sap hana - administration and monitoring sp6
TRANSCRIPT
8/11/2019 SAP HANA - Administration and Monitoring SP6
http://slidepdf.com/reader/full/sap-hana-administration-and-monitoring-sp6 1/47
SAP HANA SPS 06Administration and MonitoringJune 2013
8/11/2019 SAP HANA - Administration and Monitoring SP6
http://slidepdf.com/reader/full/sap-hana-administration-and-monitoring-sp6 2/47
© 2013 SAP AG. All rights reserved.
Agenda
• Introduction to the SAP HANA Studio
•The Administration Console of the SAP HANA Studio
• The SAP HANA Systems View
• The Administration Editor
• Overview
• Landscape
• Alerts
• Performance
• Volumes
• Configuration• System Information
• Diagnosis Files
• Trace Configuration
• SAP HANA Table Administration
• The SQL Console
• More Information

8/11/2019 SAP HANA - Administration and Monitoring SP6
http://slidepdf.com/reader/full/sap-hana-administration-and-monitoring-sp6 3/47
8/11/2019 SAP HANA - Administration and Monitoring SP6
http://slidepdf.com/reader/full/sap-hana-administration-and-monitoring-sp6 4/47
© 2013 SAP AG. All rights reserved.
Introduction to the SAP HANA StudioThe Administration Tool for SAP HANA
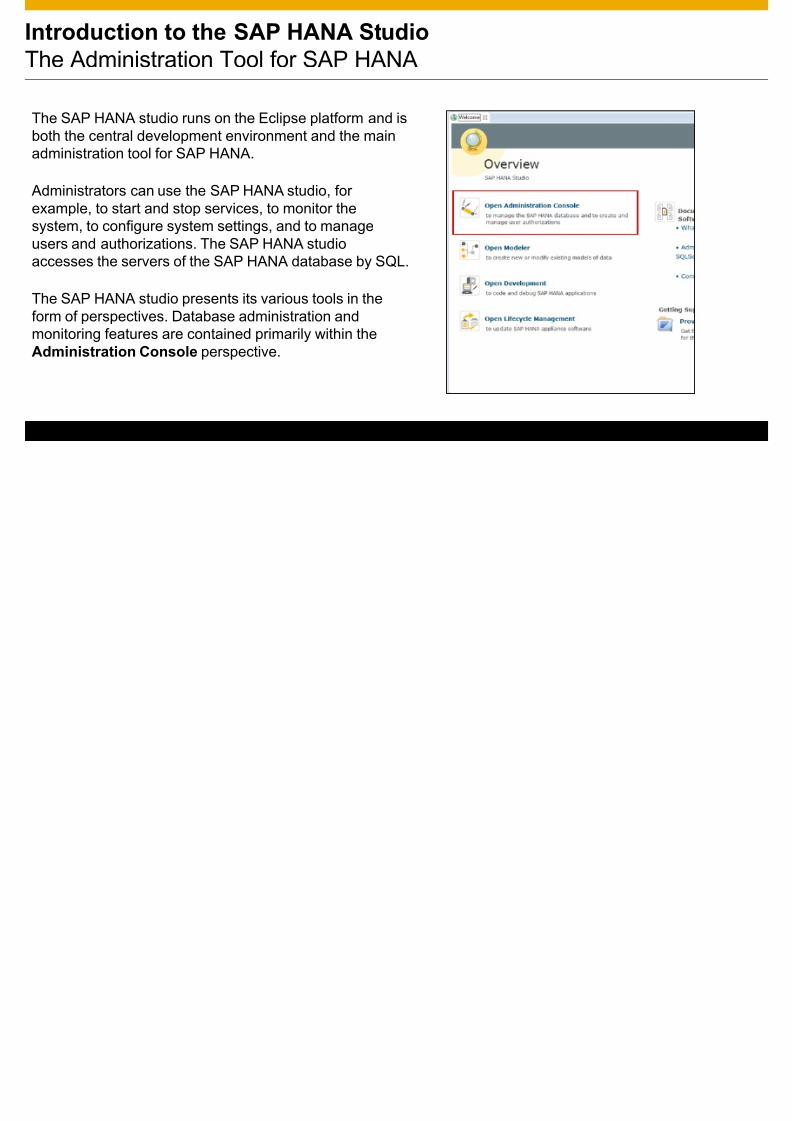
The SAP HANA studio runs on the Eclipse platform and is
both the central development environment and the mainadministration tool for SAP HANA.
Administrators can use the SAP HANA studio, forexample, to start and stop services, to monitor thesystem, to configure system settings, and to manageusers and authorizations. The SAP HANA studioaccesses the servers of the SAP HANA database by SQL.
The SAP HANA studio presents its various tools in theform of perspectives. Database administration andmonitoring features are contained primarily within theAdministration Console perspective.

8/11/2019 SAP HANA - Administration and Monitoring SP6
http://slidepdf.com/reader/full/sap-hana-administration-and-monitoring-sp6 5/47© 2013 SAP AG. All rights reserved.
Introduction to the SAP HANA StudioScreen Areas of the Administration Console
1. SAP HANA Systems view2. Editor area, for example:
Administration editor
SQL console
Table editor
3. Other views, for example:Error Log
Properties
Progress
1 2
3

8/11/2019 SAP HANA - Administration and Monitoring SP6
http://slidepdf.com/reader/full/sap-hana-administration-and-monitoring-sp6 6/47
The Administration Console ofthe SAP HANA Studio
8/11/2019 SAP HANA - Administration and Monitoring SP6
http://slidepdf.com/reader/full/sap-hana-administration-and-monitoring-sp6 7/47© 2013 SAP AG. All rights reserved.
Administration ConsoleThe SAP HANA Systems View
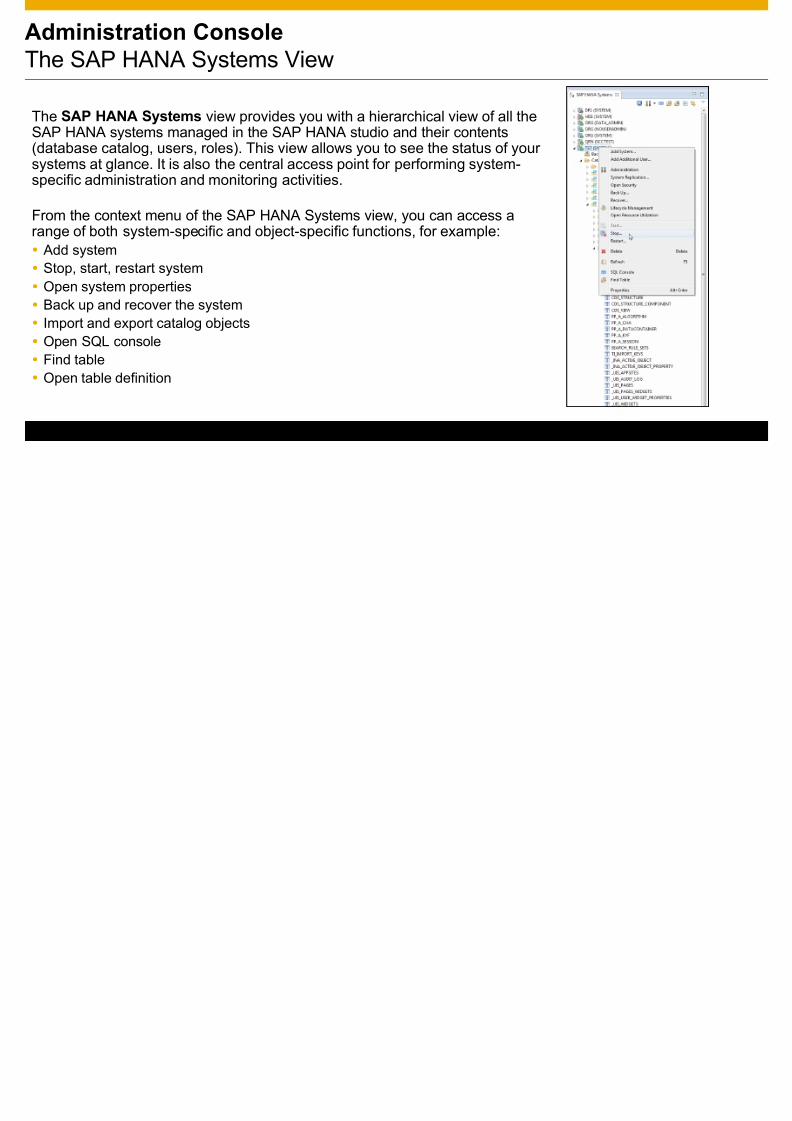
The SAP HANA Systems view provides you with a hierarchical view of all the
SAP HANA systems managed in the SAP HANA studio and their contents(database catalog, users, roles). This view allows you to see the status of yoursystems at glance. It is also the central access point for performing system-specific administration and monitoring activities.
From the context menu of the SAP HANA Systems view, you can access arange of both system-specific and object-specific functions, for example:
Add systemStop, start, restart systemOpen system propertiesBack up and recover the systemImport and export catalog objectsOpen SQL consoleFind tableOpen table definition

8/11/2019 SAP HANA - Administration and Monitoring SP6
http://slidepdf.com/reader/full/sap-hana-administration-and-monitoring-sp6 8/47© 2013 SAP AG. All rights reserved.
Administration ConsoleThe Administration Editor
The Administration editor is available in the Administration Console perspective and is the m
for performing administration and monitoring activities. You can open the Administration editor forsystem by simply double-clicking the system in the SAP HANA Systems view.
The functions of the Administration editor are available across several tabs:
8/11/2019 SAP HANA - Administration and Monitoring SP6
http://slidepdf.com/reader/full/sap-hana-administration-and-monitoring-sp6 9/47© 2013 SAP AG. All rights reserved.
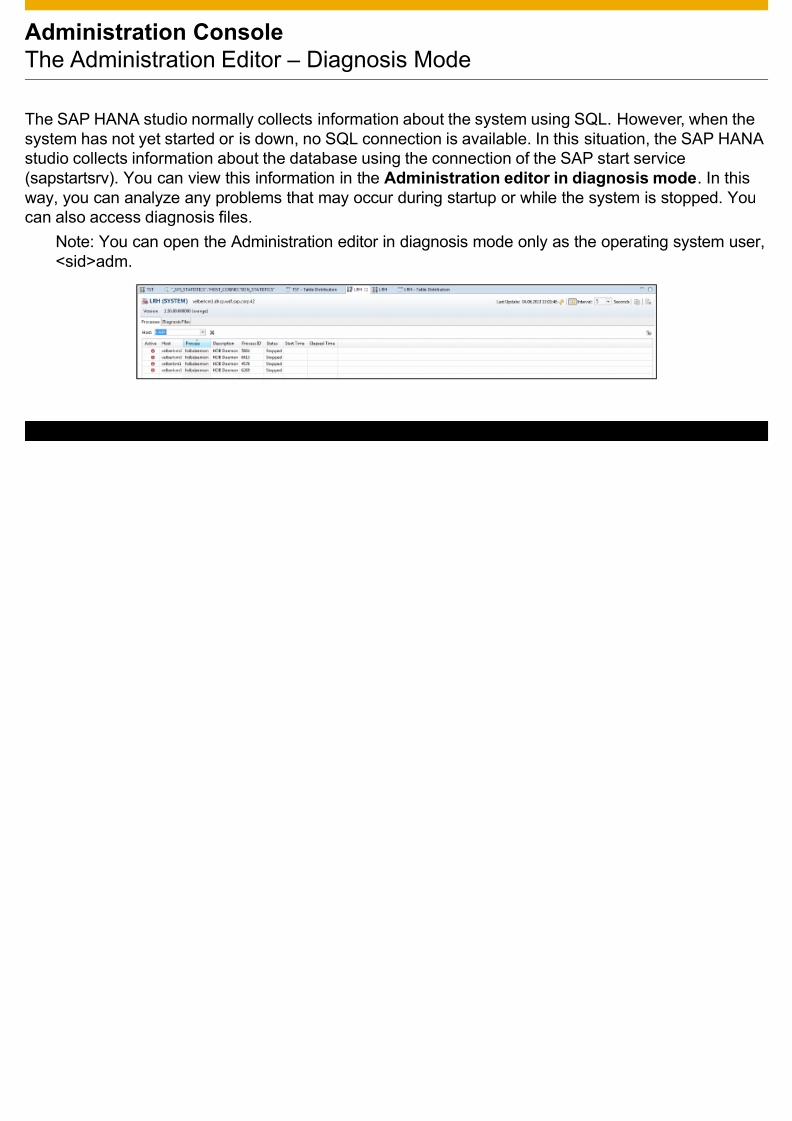
Administration ConsoleThe Administration Editor – Diagnosis Mode
The SAP HANA studio normally collects information about the system using SQL. However, when
system has not yet started or is down, no SQL connection is available. In this situation, the SAP HAstudio collects information about the database using the connection of the SAP start service(sapstartsrv). You can view this information in the Administration editor in diagnosis modeway, you can analyze any problems that may occur during startup or while the system is stopped. Yocan also access diagnosis files.
Note: You can open the Administration editor in diagnosis mode only as the operating system u<sid>adm.

8/11/2019 SAP HANA - Administration and Monitoring SP6
http://slidepdf.com/reader/full/sap-hana-administration-and-monitoring-sp6 10/47
8/11/2019 SAP HANA - Administration and Monitoring SP6
http://slidepdf.com/reader/full/sap-hana-administration-and-monitoring-sp6 11/47© 2013 SAP AG. All rights reserved.
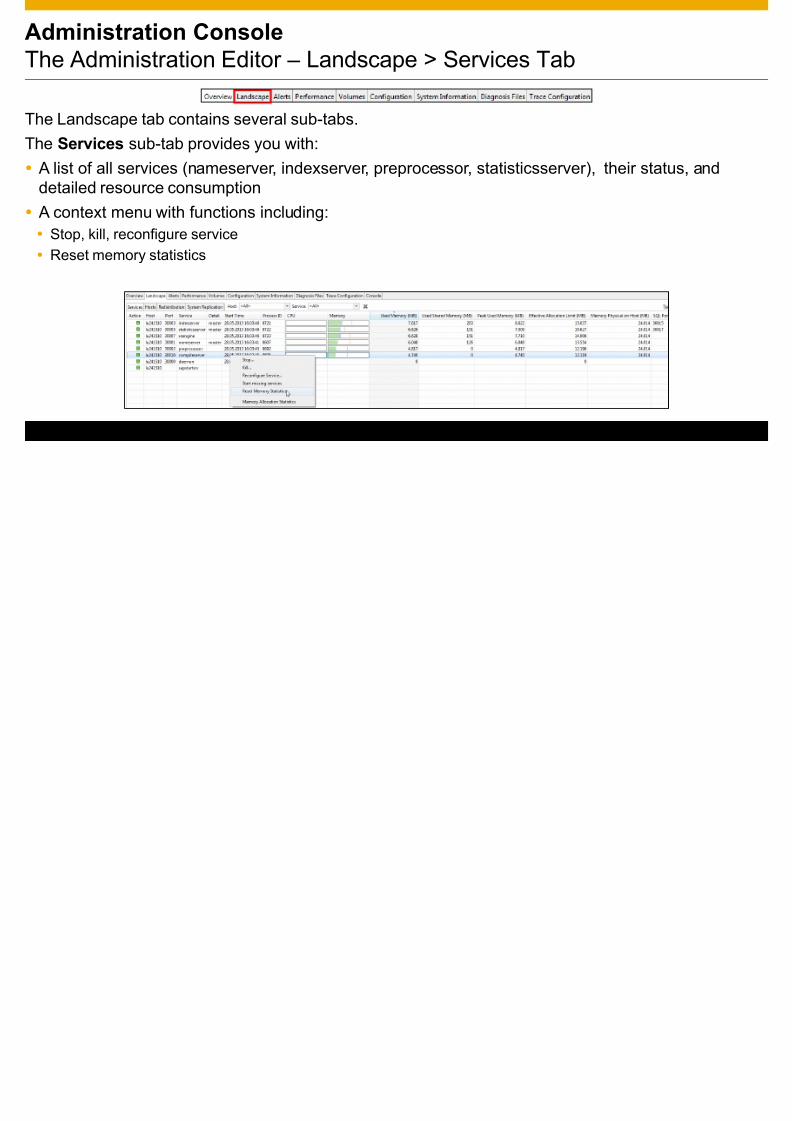
Administration ConsoleThe Administration Editor – Landscape > Services Tab
The Landscape tab contains several sub-tabs.
The Services sub-tab provides you with: A list of all services (nameserver, indexserver, preprocessor, statisticsserver), their status, anddetailed resource consumption
A context menu with functions including:Stop, kill, reconfigure serviceReset memory statistics

8/11/2019 SAP HANA - Administration and Monitoring SP6
http://slidepdf.com/reader/full/sap-hana-administration-and-monitoring-sp6 12/47
© 2013 SAP AG. All rights reserved.
Administration ConsoleThe Administration Editor – Landscape > Hosts Tab
The Hosts sub-tab provides you with:
An overview of all the hosts in a distributed systemDetailed information about the auto-failover status and configuration of hostsHost re-configuration optionsOption to remove a host from the system

8/11/2019 SAP HANA - Administration and Monitoring SP6
http://slidepdf.com/reader/full/sap-hana-administration-and-monitoring-sp6 13/47
© 2013 SAP AG. All rights reserved.
Administration ConsoleThe Administration Editor – Landscape > Redistribution Tab
In a distributed system, tables and table partitions are assigned to an index server on a particular
host at their time of creation, but this assignment can be changed. In certain situations, it is evennecessary. SAP HANA supports several “redistribution operations” that use complex algorithms toevaluate the current distribution and determine a better distribution depending on the situation.The Redistribution sub-tab allows you to execute redistribution operations if you need to:
Redistribute data before removing a host from the systemRedistribute data after adding a new host to the systemOptimize current table distributionOptimize table partitioningNote: It is always recommendedthat you save the current distribution beforeexecuting a table redistribution operationin case you need to restore it.

8/11/2019 SAP HANA - Administration and Monitoring SP6
http://slidepdf.com/reader/full/sap-hana-administration-and-monitoring-sp6 14/47
© 2013 SAP AG. All rights reserved.
Administration ConsoleThe Administration Editor – Landscape > System Replication Tab
System replication is a mechanism for ensuring the high availability of an SAP HANA system. Through the
continuous replication of data from a primary to a secondary system, including in-memory loading, systemreplication facilitates rapid failover in the event of a disaster. Productive operations can be resumed with mindowntime.
On the System Replication sub-tab, you can:
Perform the initial set-up, that is enable system replication and establish the connection between twoidentical systems.
Monitor the status of system replication to ensure that both systems are in sync.
Trigger failover to the secondary system in the event of a disaster and failback once the primary system isavailable again.

8/11/2019 SAP HANA - Administration and Monitoring SP6
http://slidepdf.com/reader/full/sap-hana-administration-and-monitoring-sp6 15/47
© 2013 SAP AG. All rights reserved.
Administration ConsoleThe Administration Editor – Landscape > System Replication Tab

8/11/2019 SAP HANA - Administration and Monitoring SP6
http://slidepdf.com/reader/full/sap-hana-administration-and-monitoring-sp6 16/47
© 2013 SAP AG. All rights reserved.
Administration ConsoleThe Administration Editor – Alerts Tab (1/3)
As one of the main components of the
monitoring infrastructure of the SAPHANA database, the statistics serverperforms regular checks and issues analert when an alert condition is fulfilled.The priority of the alert indicates theseverity of the problem and depends onthe nature of the check and configured
threshold values. For example, if 90%of available disk space is used, a lowpriority alert is issued; if 98% is used, ahigh priority alert is issued.You can monitor alerts on the Alerts tab.

8/11/2019 SAP HANA - Administration and Monitoring SP6
http://slidepdf.com/reader/full/sap-hana-administration-and-monitoring-sp6 17/47
© 2013 SAP AG. All rights reserved.
Administration ConsoleThe Administration Editor – Alerts Tab (2/3)
The Alerts sub-tab provides you with:
• An overview of:• All current unresolved alerts (default view)• Alerts sorted by time period (last 15, 30, 60, and 120 minutes, today, yesterday, last week)
• Detailed information about individual alerts

8/11/2019 SAP HANA - Administration and Monitoring SP6
http://slidepdf.com/reader/full/sap-hana-administration-and-monitoring-sp6 18/47
© 2013 SAP AG. All rights reserved.
Administration ConsoleThe Administration Editor – Alerts Tab (3/3)
• Alert filtering options by:
• Specific word• Priority• Check ID• Time frame
• Configuration options for:• E-mail notification• Alert thresholds• Check start times
8/11/2019 SAP HANA - Administration and Monitoring SP6
http://slidepdf.com/reader/full/sap-hana-administration-and-monitoring-sp6 19/47
© 2013 SAP AG. All rights reserved.
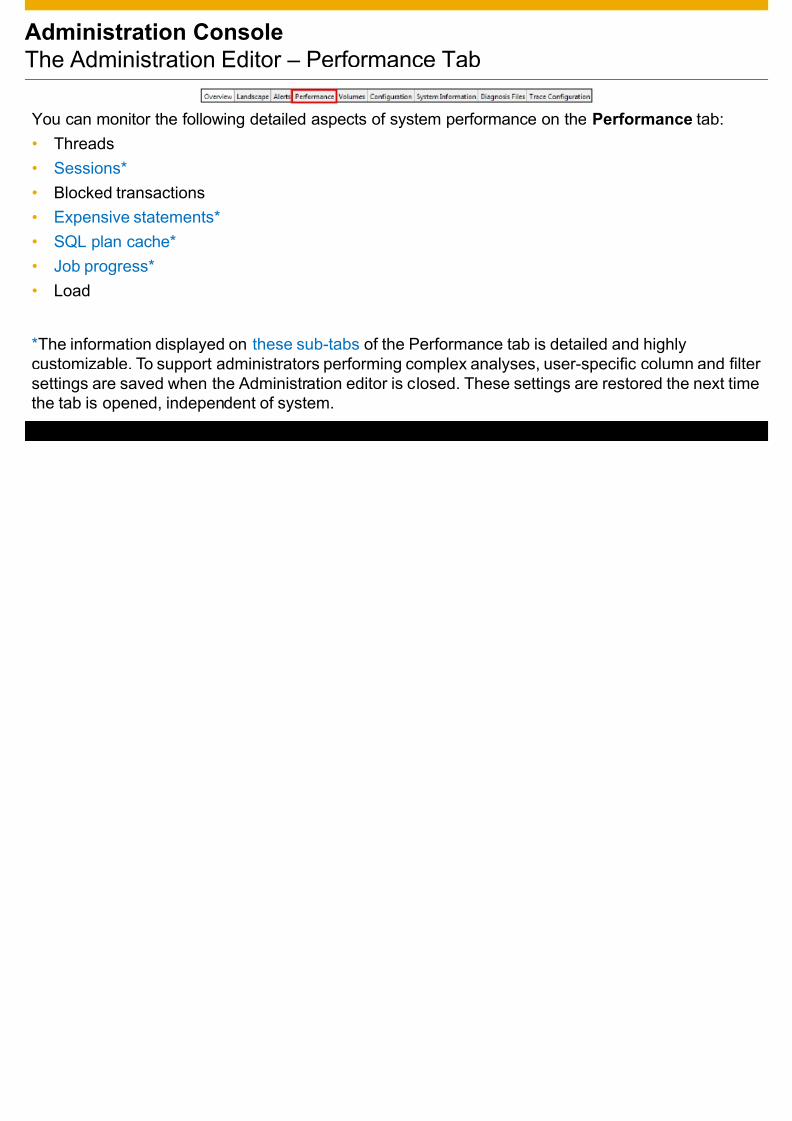
Administration ConsoleThe Administration Editor – Performance Tab
You can monitor the following detailed aspects of system performance on the Perfor
• Threads• Sessions*• Blocked transactions• Expensive statements*• SQL plan cache*• Job progress*• Load
*The information displayed on these sub-tabs of the Performance tab is detailed and highlcustomizable. To support administrators performing complex analyses, user-specific column and fsettings are saved when the Administration editor is closed. These settings are restored the next timthe tab is opened, independent of system.

8/11/2019 SAP HANA - Administration and Monitoring SP6
http://slidepdf.com/reader/full/sap-hana-administration-and-monitoring-sp6 20/47
© 2013 SAP AG. All rights reserved.
Administration ConsoleThe Administration Editor – Performance > Threads Tab (1/2)
The Threads sub-tab allows you to monitor all running threads in your system. It may be usefu
see, for example, how long a thread is running, if a thread is blocked for an inexplicable length oftime. On the Threads sub-tab:• Transactionally blocked threads are identified with a warning icon• The Group and sort filter provides a meaningful and clear structure for thread analysis:
• Threads with the same connection ID are grouped.• Within each group, the call hierarchy is depicted.• Groups are displayed in order of descending duration.

8/11/2019 SAP HANA - Administration and Monitoring SP6
http://slidepdf.com/reader/full/sap-hana-administration-and-monitoring-sp6 21/47
© 2013 SAP AG. All rights reserved.
Administration ConsoleThe Administration Editor – Performance > Threads Tab (2/2)
On the Threads sub-tab, you can also perform the following actions:
• End the operations associated with a thread• See the full details of a thread• Jump to the related calling and called threads of a thread by right-clicking the thread• View the call stack for a specific thread

8/11/2019 SAP HANA - Administration and Monitoring SP6
http://slidepdf.com/reader/full/sap-hana-administration-and-monitoring-sp6 22/47
© 2013 SAP AG. All rights reserved.
Administration ConsoleThe Administration Editor – Performance > Sessions Tab
The Sessions sub-tab allows you to monitor all sessions in the current landscape:
• Active/inactive sessions and their relation to applications• Whether a session is blocked and if so which session is blocking• The number of transactions that are blocked by a blocking session• Statistics like average query runtime and the number of DML and DDL statements in a sessionYou can also cancel sessions.

8/11/2019 SAP HANA - Administration and Monitoring SP6
http://slidepdf.com/reader/full/sap-hana-administration-and-monitoring-sp6 23/47
© 2013 SAP AG. All rights reserved.
Administration ConsoleThe Administration Editor – Performance > Blocked Transactions T
If there are blocking situations (indicated on the Threads sub-tab), you can see another
representation of the information about blocked and blocking transactions on the BlTransactions sub-tab. Sort by transaction ID to see the relationship between the two views bett
8/11/2019 SAP HANA - Administration and Monitoring SP6
http://slidepdf.com/reader/full/sap-hana-administration-and-monitoring-sp6 24/47
© 2013 SAP AG. All rights reserved.
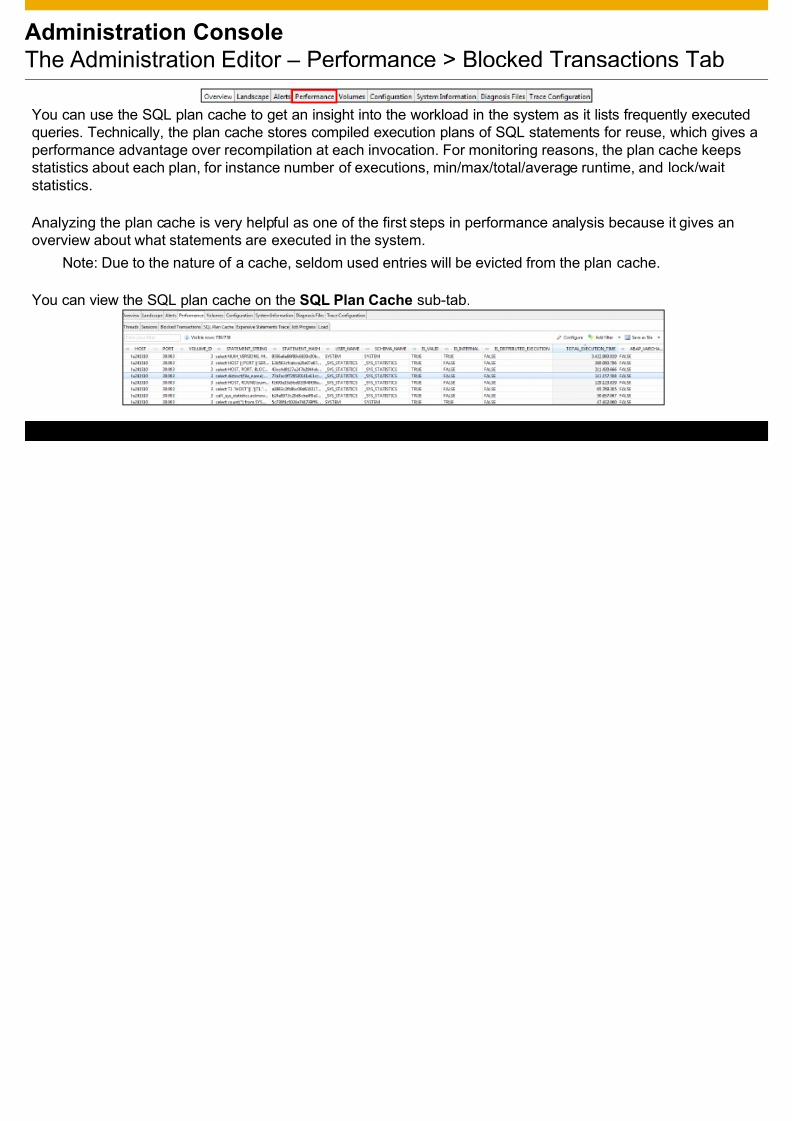
Administration ConsoleThe Administration Editor – Performance > Blocked Transactions T
You can use the SQL plan cache to get an insight into the workload in the system as it lists frequently executequeries. Technically, the plan cache stores compiled execution plans of SQL statements for reuse, which givesperformance advantage over recompilation at each invocation. For monitoring reasons, the plan cache keepsstatistics about each plan, for instance number of executions, min/max/total/average runtime, and lock/waitstatistics.
Analyzing the plan cache is very helpful as one of the first steps in performance analysis because it gives anoverview about what statements are executed in the system.
Note: Due to the nature of a cache, seldom used entries will be evicted from the plan cache.
You can view the SQL plan cache on the SQL Plan Cache sub-tab.

8/11/2019 SAP HANA - Administration and Monitoring SP6
http://slidepdf.com/reader/full/sap-hana-administration-and-monitoring-sp6 25/47
© 2013 SAP AG. All rights reserved.
Administration ConsoleThe Administration Editor – Performance > SQL Plan Cache Tab
Expensive statements are individual SQL queries whose execution time was above a configuredthreshold. Expensive statements may reduce the performance of the database. The expensivestatements trace records information about these statements for further analysis and displays themon the Expensive Statements Trace sub-tab.
Several configuration options are available.
d i i i C l
8/11/2019 SAP HANA - Administration and Monitoring SP6
http://slidepdf.com/reader/full/sap-hana-administration-and-monitoring-sp6 26/47
© 2013 SAP AG. All rights reserved.
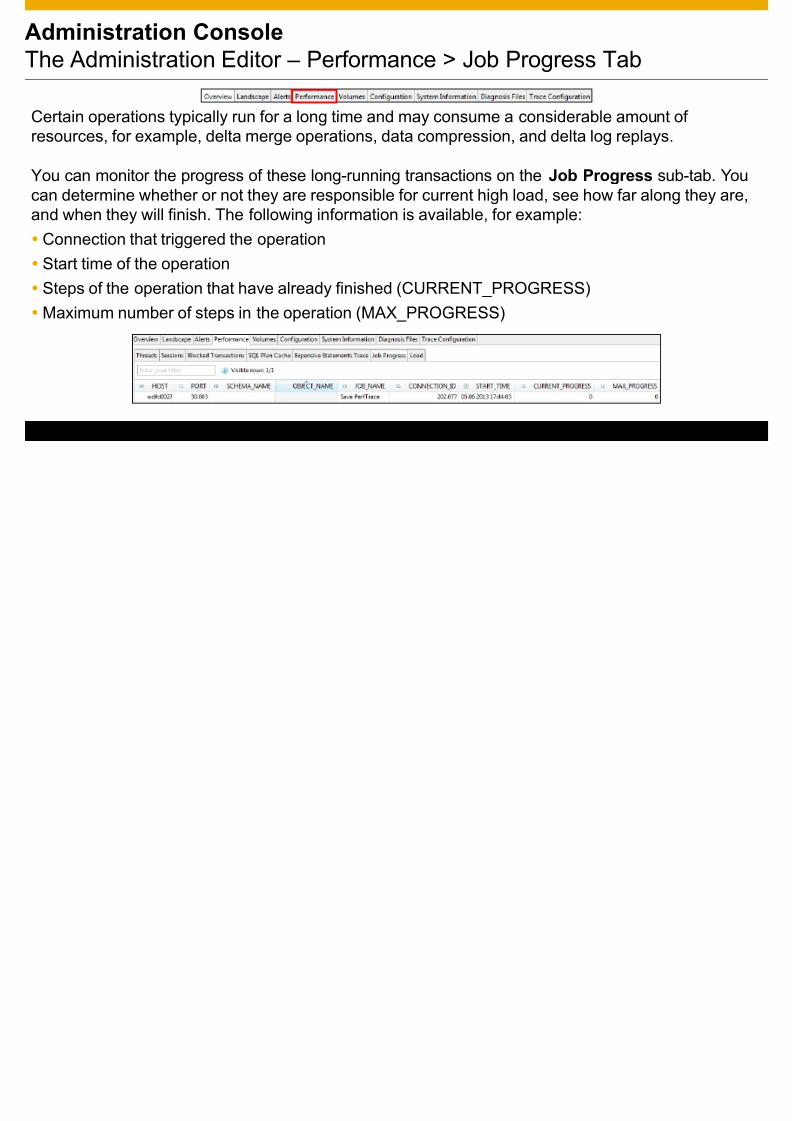
Administration ConsoleThe Administration Editor – Performance > Job Progress Tab
Certain operations typically run for a long time and may consume a considerable amount ofresources, for example, delta merge operations, data compression, and delta log replays.
You can monitor the progress of these long-running transactions on the Job Progresscan determine whether or not they are responsible for current high load, see how far along they areand when they will finish. The following information is available, for example:
Connection that triggered the operationStart time of the operation
Steps of the operation that have already finished (CURRENT_PROGRESS)Maximum number of steps in the operation (MAX_PROGRESS)
Ad i i i C l

8/11/2019 SAP HANA - Administration and Monitoring SP6
http://slidepdf.com/reader/full/sap-hana-administration-and-monitoring-sp6 27/47
© 2013 SAP AG. All rights reserved.
Administration ConsoleThe Administration Editor – Performance > Load Tab
The Load sub-tab provides you with agraphical display of currentperformance, for example:
CPU usageMemory consumptionTable unloads
You can compare the performance ofdifferent hosts.
Ad i i t ti C l

8/11/2019 SAP HANA - Administration and Monitoring SP6
http://slidepdf.com/reader/full/sap-hana-administration-and-monitoring-sp6 28/47
© 2013 SAP AG. All rights reserved.
Administration ConsoleThe Administration Editor – Volumes Tab
To ensure that the database can always be restored to its most recent committed state, you must ensurethat there is enough space on disk for data and log volumes. On the Volumes tab, you ca
Disk usage
Volume size
Other disk activity statistics
There are two views available for monitoring the size of volumes on disk: service and storage type. Youcan also filter by host.
Ad i i t ti C l

8/11/2019 SAP HANA - Administration and Monitoring SP6
http://slidepdf.com/reader/full/sap-hana-administration-and-monitoring-sp6 29/47
© 2013 SAP AG. All rights reserved.
Administration ConsoleThe Administration Editor – Configuration Tab
The properties of an SAP HANA system are definparameters of its configuration files. Configuratioseparated into sections; sections bundle parametesame category.
You can view and modify system properties on thConfiguration tab.
Administration Console
8/11/2019 SAP HANA - Administration and Monitoring SP6
http://slidepdf.com/reader/full/sap-hana-administration-and-monitoring-sp6 30/47
© 2013 SAP AG. All rights reserved.
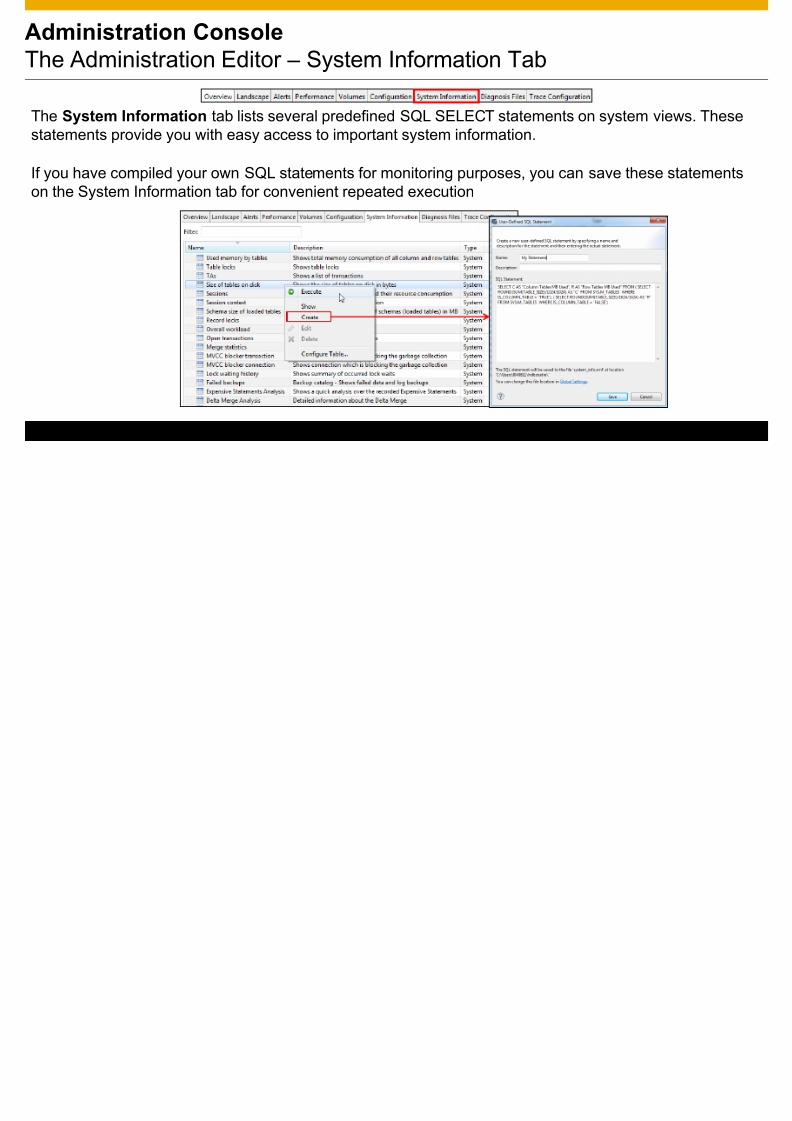
Administration ConsoleThe Administration Editor – System Information Tab
The System Information tab lists several predefined SQL SELECT statements on system views. Tstatements provide you with easy access to important system information.
If you have compiled your own SQL statements for monitoring purposes, you can save these statementson the System Information tab for convenient repeated execution
Administration Console

8/11/2019 SAP HANA - Administration and Monitoring SP6
http://slidepdf.com/reader/full/sap-hana-administration-and-monitoring-sp6 31/47
© 2013 SAP AG. All rights reserved.
Administration ConsoleThe Administration Editor – Diagnosis Files Tab
Diagnosis files include log and trace files, as well as a mixture of other diagnosis, error, andinformation files. In the event of problems with the SAP HANA database, you can check thesediagnosis files for errors.
On the Diagnosis Files tab, you can:Filter the list of diagnosis files(by keyword, host)
Display individual files
Review multiple files at the same time usingthe “Merge Diagnosis Files” function
Delete files
Download files
Administration Console
8/11/2019 SAP HANA - Administration and Monitoring SP6
http://slidepdf.com/reader/full/sap-hana-administration-and-monitoring-sp6 32/47
© 2013 SAP AG. All rights reserved.
Administration ConsoleThe Administration Editor – Trace Configuration Tab (1/3)
You can configure the following traces on the Trace Configuration tab. Different configuratavailable for each trace.
Database trace (including user-specific and end-to-end database traces)The database trace records information about activity in the components of the SAP HANA database. Ycan use this information to analyze performance and to diagnose and debug errors. Each service of theSAP HANA database writes to its own trace file. By default, the database trace is active with default trlevel ERROR.
SQL trace The SQL trace collects information about all executed SQL statements and saves it as an executablepython program. This is good for recording a scenario. By default, the SQL trace is inactive.
Expensive statements trace Expensive statements are individual SQL queries whose execution time was above a configuredthreshold. The expensive statements trace records information about these statements for furtheranalysis. By default, the expensive statements trace is inactive.
Administration Console

8/11/2019 SAP HANA - Administration and Monitoring SP6
http://slidepdf.com/reader/full/sap-hana-administration-and-monitoring-sp6 33/47
© 2013 SAP AG. All rights reserved.
Administration ConsoleThe Administration Editor – Trace Configuration Tab (2/3)
Performance traceThe performance trace is a performance tracing tool built into the SAP HANA database. It recordsperformance indicators for individual query processing steps in the database kernel. By default, theperformance trace is inactive.
Kernel profilerThe kernel profiler is a sampling profiler built into the SAP HANA database. It collects, for example,information about frequent and/or expensive execution paths during query processing. By default, thekernel profiler is inactive.
Note: Only SAP development support has the technical expertise required to interpret the informationcollected by the performance trace and the kernel profiler.
Administration Console
8/11/2019 SAP HANA - Administration and Monitoring SP6
http://slidepdf.com/reader/full/sap-hana-administration-and-monitoring-sp6 34/47
© 2013 SAP AG. All rights reserved.
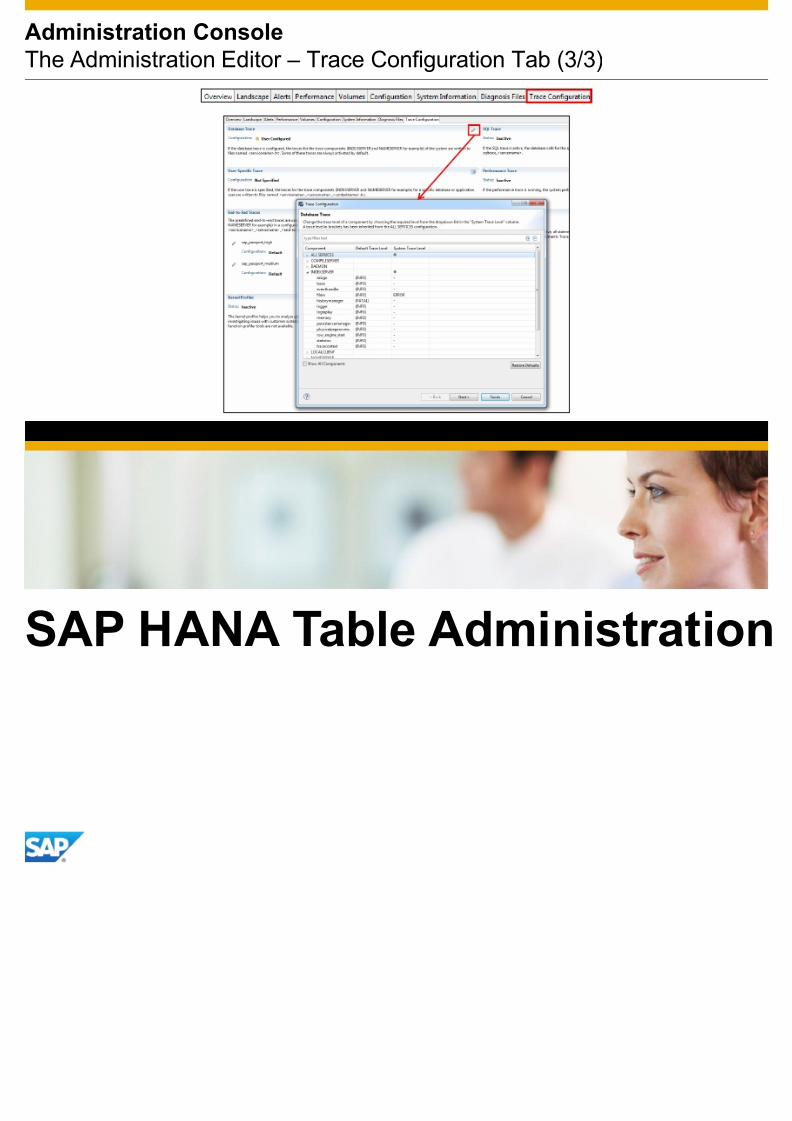
Administration ConsoleThe Administration Editor – Trace Configuration Tab (3/3)
8/11/2019 SAP HANA - Administration and Monitoring SP6
http://slidepdf.com/reader/full/sap-hana-administration-and-monitoring-sp6 35/47
SAP HANA Table Administratio
SAP HANA Table Administration
8/11/2019 SAP HANA - Administration and Monitoring SP6
http://slidepdf.com/reader/full/sap-hana-administration-and-monitoring-sp6 36/47
© 2013 SAP AG. All rights reserved.
SAP HANA Table AdministrationTable Editor (1/2)
Some monitoring and problem analysis may require you to examine individual tables, for example,many system views provided by the SAP HANA database. You can open tables and views in differeways. Several viewing options are available depending on what you want to do:
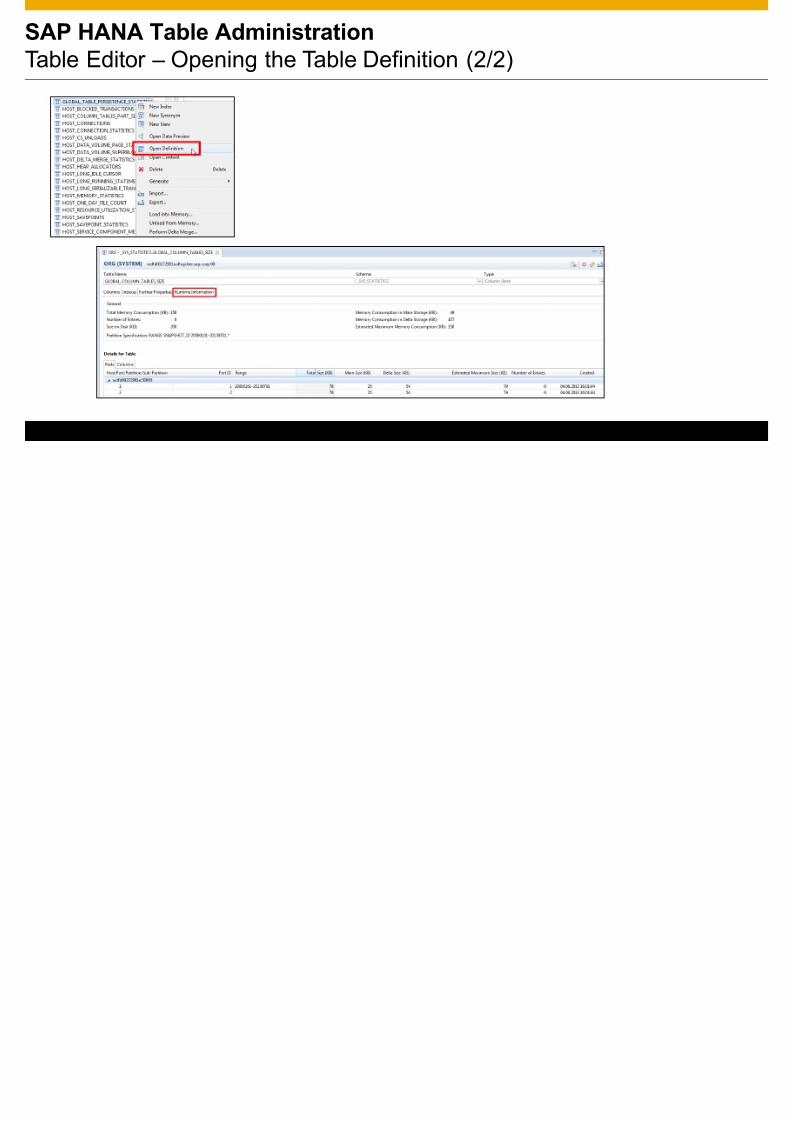
Table definitionThe table definition view provides you with information about the table's structure and propertiesexample, schema, type, column properties, and indexes). Detailed information relating to the tablmemory usage and size is available on the Runtime Information sub-tab.Table content
Opening a table's content executes a SELECT statement on the table. The results set shows theactual records in the table.Data previewOpening the data preview of a table allows you to analyze the content of the table in different waSimilarly to the table content view, this is particularly useful for analyzing system views.
SAP HANA Table Administration
8/11/2019 SAP HANA - Administration and Monitoring SP6
http://slidepdf.com/reader/full/sap-hana-administration-and-monitoring-sp6 37/47
© 2013 SAP AG. All rights reserved.
SAP HANA Table AdministrationTable Editor – Opening the Table Definition (2/2)
SAP HANA Table Administration
8/11/2019 SAP HANA - Administration and Monitoring SP6
http://slidepdf.com/reader/full/sap-hana-administration-and-monitoring-sp6 38/47
© 2013 SAP AG. All rights reserved.
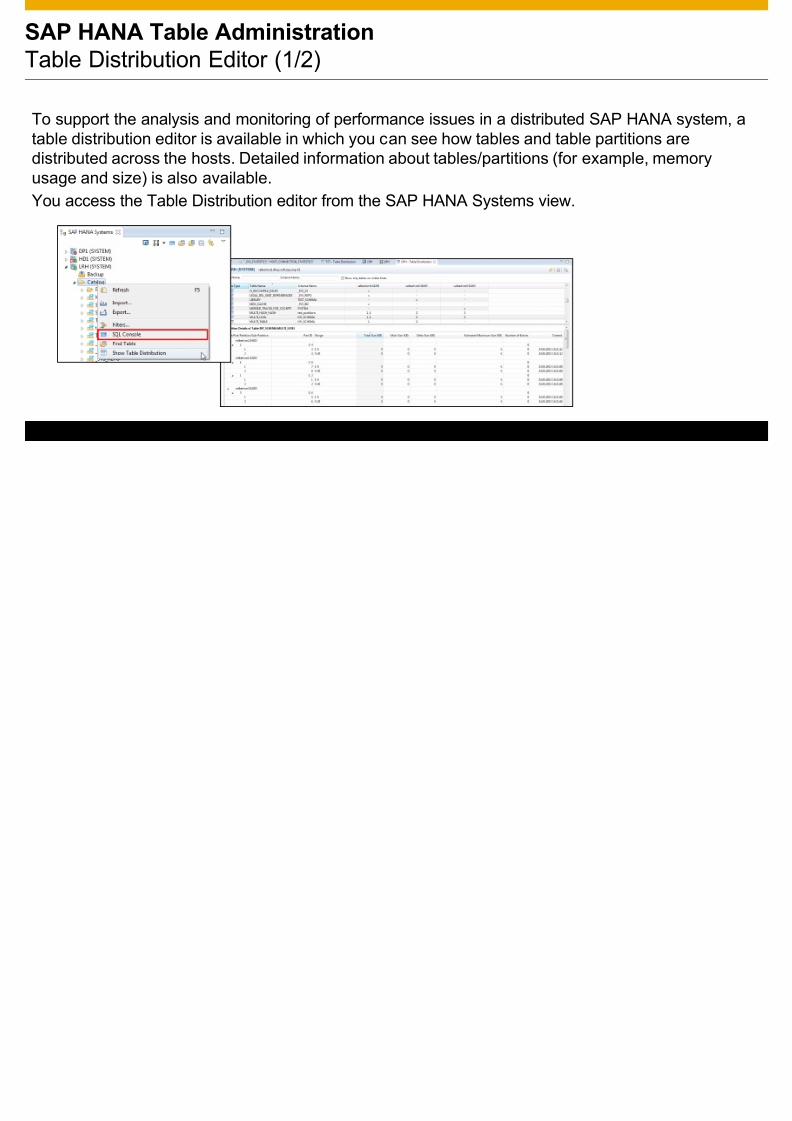
SAP HANA Table AdministrationTable Distribution Editor (1/2)
To support the analysis and monitoring of performance issues in a distributed SAP HANA system,table distribution editor is available in which you can see how tables and table partitions aredistributed across the hosts. Detailed information about tables/partitions (for example, memoryusage and size) is also available.You access the Table Distribution editor from the SAP HANA Systems view.
SAP HANA Table Administration and Monitoring
8/11/2019 SAP HANA - Administration and Monitoring SP6
http://slidepdf.com/reader/full/sap-hana-administration-and-monitoring-sp6 39/47
© 2013 SAP AG. All rights reserved.
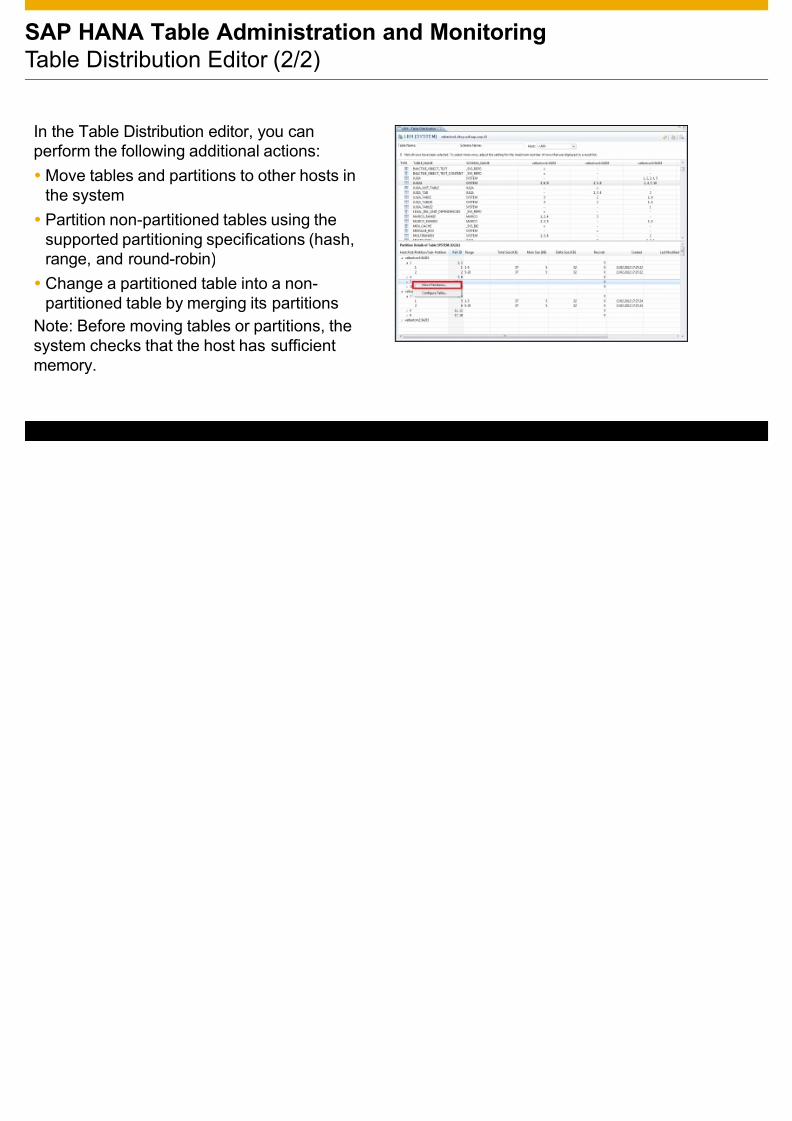
gTable Distribution Editor (2/2)
In the Table Distribution editor, you can
perform the following additional actions:Move tables and partitions to other hosts inthe systemPartition non-partitioned tables using thesupported partitioning specifications (hash,range, and round-robin)
Change a partitioned table into a non-partitioned table by merging its partitionsNote: Before moving tables or partitions, thesystem checks that the host has sufficientmemory.
SAP HANA Table Administration

8/11/2019 SAP HANA - Administration and Monitoring SP6
http://slidepdf.com/reader/full/sap-hana-administration-and-monitoring-sp6 40/47
© 2013 SAP AG. All rights reserved.
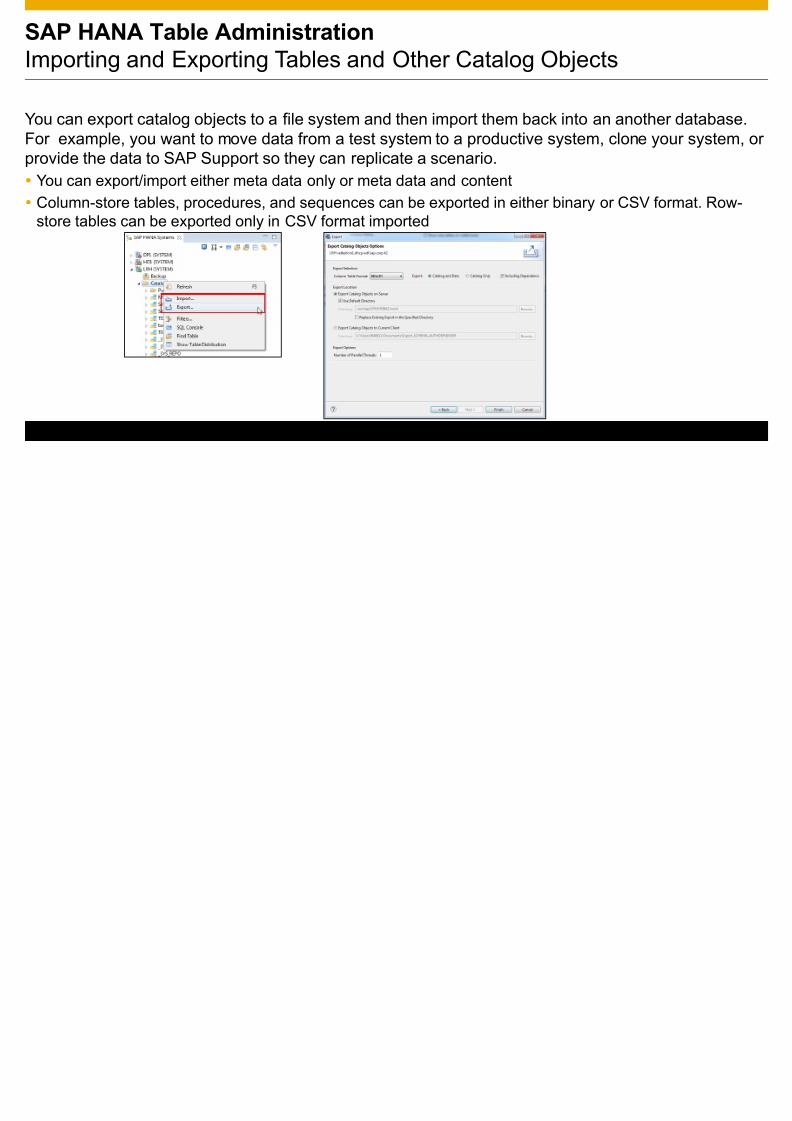
Importing and Exporting Tables and Other Catalog Objects
You can export catalog objects to a file system and then import them back into an another databaseFor example, you want to move data from a test system to a productive system, clone your systemprovide the data to SAP Support so they can replicate a scenario.
You can export/import either meta data only or meta data and contentColumn-store tables, procedures, and sequences can be exported in either binary or CSV format. Row-store tables can be exported only in CSV format imported
SAP HANA Table Administration
8/11/2019 SAP HANA - Administration and Monitoring SP6
http://slidepdf.com/reader/full/sap-hana-administration-and-monitoring-sp6 41/47
© 2013 SAP AG. All rights reserved.
Other Table Administration Options
Load into and unload from memory Under normal circumstances, the SAP HANA databasemanages the loading and unloading of tables into andfrom memory independently – the aim being to keep allrelevant data in memory. However, you can manuallyload and unload individual tables and table columns ifnecessary.Perform manual delta merge The delta merge operation is related to the memory
management concept of the column store, that is, the partof the SAP HANA database that manages data organizedin columns in memory. You can trigger the delta mergeoperation for a column table manually in the SAP HANAstudio, for example, if you need to free up memory.
8/11/2019 SAP HANA - Administration and Monitoring SP6
http://slidepdf.com/reader/full/sap-hana-administration-and-monitoring-sp6 42/47
SQL Console
SQL Console

8/11/2019 SAP HANA - Administration and Monitoring SP6
http://slidepdf.com/reader/full/sap-hana-administration-and-monitoring-sp6 43/47
© 2013 SAP AG. All rights reserved.
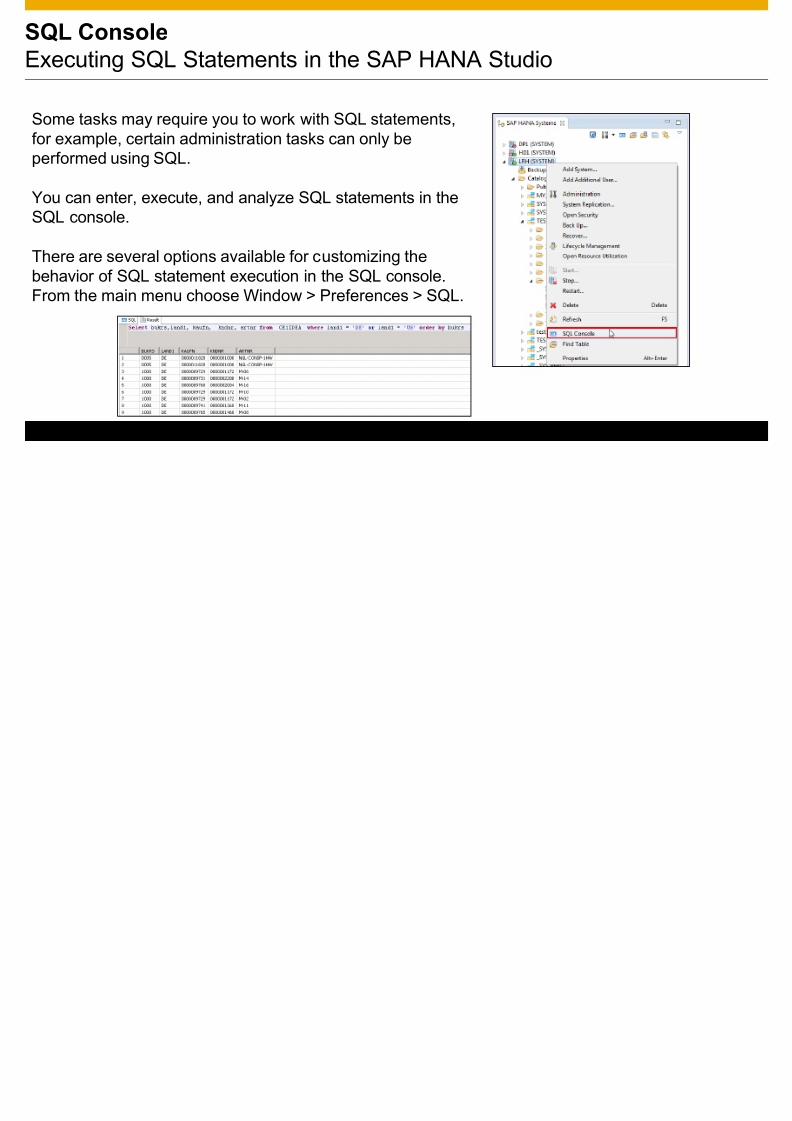
Executing SQL Statements in the SAP HANA Studio
Some tasks may require you to work with SQL statements,for example, certain administration tasks can only beperformed using SQL.
You can enter, execute, and analyze SQL statements in theSQL console.
There are several options available for customizing thebehavior of SQL statement execution in the SQL console.From the main menu choose Window > Preferences > SQL.
SQL Console

8/11/2019 SAP HANA - Administration and Monitoring SP6
http://slidepdf.com/reader/full/sap-hana-administration-and-monitoring-sp6 44/47
© 2013 SAP AG. All rights reserved.
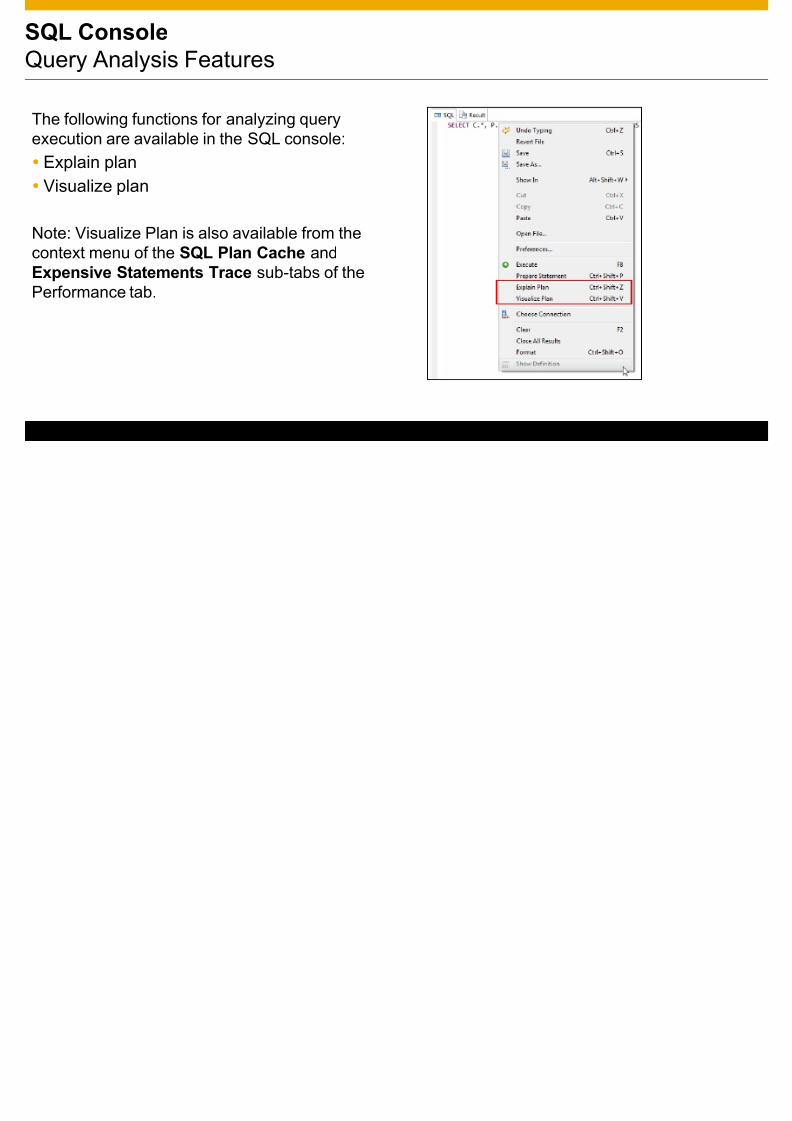
Query Analysis Features
The following functions for analyzing queryexecution are available in the SQL console:
Explain planVisualize plan
Note: Visualize Plan is also available from thecontext menu of the SQL Plan Cache andExpensive Statements Trace sub-tabs of thePerformance tab.
SQL Console
8/11/2019 SAP HANA - Administration and Monitoring SP6
http://slidepdf.com/reader/full/sap-hana-administration-and-monitoring-sp6 45/47
© 2013 SAP AG. All rights reserved.
Plan Visualizer
To help you understand and analyze the execution plan of an expensive statement or an SQLstatement further, you can generate a graphical view of its plan. A graphical representation of thequery, with estimated performance, is displayed. You can then validate the estimated performanceby choosing Execute in the context menu. Another similar high-level graphic is generated withexecution time information for each of the parts.
Visualized Plan Column PlanExecution
Additional Information

8/11/2019 SAP HANA - Administration and Monitoring SP6
http://slidepdf.com/reader/full/sap-hana-administration-and-monitoring-sp6 46/47
© 2013 SAP AG. All rights reserved.
SAP HANA Documentation
For more information about the administration and monitoring features of the SAP HANA studiointroduced in this presentation, see the SAP HANA Administration Guide , which yo
• Directly in the SAP HANA studio from the Help menu• On SAP Help Portal at http://help.sap.com/hana_appliance
Other useful documentation available on SAP Help Portal:• SAP HANA Master Guide• SAP HANA Technical Operations Manual• SAP HANA Studio Installation Guide
© 2013 SAP AG All rights reserved

8/11/2019 SAP HANA - Administration and Monitoring SP6
http://slidepdf.com/reader/full/sap-hana-administration-and-monitoring-sp6 47/47
© 2013 SAP AG. All rights reserved.
© 2013 SAP AG. All rights reserved.
No part of this publication may be reproduced or transmitted in any form or for any purpose without the express permission of SAP AG.The information contained herein may be changed without prior notice.
Some software products marketed by SAP AG and its distributors contain proprietary software components of other software vendors.National product specifications may vary.
These materials are provided by SAP AG and its affiliated companies ("SAP Group") for informational purposes only, without representation or warranty of any kindSAP Group shall not be liable for errors or omissions with respect to the materials. The only warranties for SAP Group products and services are those that are set forthe express warranty statements accompanying such products and services, if any. Nothing herein should be construed as constituting an additional warranty.
SAP and other SAP products and services mentioned herein as well as their respective logos are trademarks or registered trademarks of SAP AG in Germany and othcountries.Please see http://www.sap.com/corporate-en/legal/copyright/index.epx#trademark for additional trademark information and notices.