sap flux–upscaled canopy transpiration, stomatal...
TRANSCRIPT

Sap flux–upscaled canopy transpiration, stomatal conductance, and
water use efficiency in an old growth forest in the Great Lakes region
of the United States
Jianwu Tang,1 Paul V. Bolstad,1 Brent E. Ewers,2 Ankur R. Desai,3 Kenneth J. Davis,3
and Eileen V. Carey1
Received 5 August 2005; revised 9 February 2006; accepted 23 February 2006; published 1 June 2006.
[1] Combining sap flux and eddy covariance measurements provides a means to studyplant stomatal conductance and the relationship between transpiration and photosynthesis.We measured sap flux using Granier-type sensors in a northern hardwood-dominated oldgrowth forest in Michigan, upscaled to canopy transpiration, and calculated canopyconductance. We also measured carbon and water fluxes with the eddy covariance methodand derived daytime gross primary production (GPP). The diurnal patterns of sap flux andcanopy transpiration were mainly controlled by vapor pressure deficit (D) andphotosynthetically active radiation (PAR). Daily sums of sap flux and canopy transpirationhad exponential relationships to D that saturated at higher D and had linear relationships toPAR. Sugar maple (Acer saccharum) and yellow birch (Betula alleghaniesis) hadhigher sap flux per unit of sapwood area than eastern hemlock (Tsuga canadensis),while sugar maple and hemlock had higher canopy transpiration per unit of leaf area thanyellow birch. Sugar maple dominated canopy transpiration per ground area. Canopytranspiration averaged 1.57 mm d�1, accounting for 65% of total evapotranspiration inthe growing season. Canopy conductance was controlled by both D and PAR, but the day-to-day variation in canopy conductance mainly followed a negatively logarithmicrelationship with D. By removing the influences of PAR, half-hourly canopy conductancewas also negatively logarithmically correlated with D. Water use efficiency (WUE) had astrong exponential relationship with D on a daily basis and approached a minimum of4.4 mg g�1. WUE provides an alternative to estimate GPP from measurements of sap flux.
Citation: Tang, J., P. V. Bolstad, B. E. Ewers, A. R. Desai, K. J. Davis, and E. V. Carey (2006), Sap flux–upscaled canopy
transpiration, stomatal conductance, and water use efficiency in an old growth forest in the Great Lakes region of the United States,
J. Geophys. Res., 111, G02009, doi:10.1029/2005JG000083.
1. Introduction
[2] Ecosystem and atmospheric models are increasinglycoupled to incorporate carbon, water, and energy exchangesbetween the atmosphere and ecosystems [Foley et al., 2000;Sellers et al., 1997]. Carbon and water fluxes are not onlyclosely linked in large-scale atmospheric processes thatinfluence climate systems and climate change, but alsocoupled at small scales, from forest stands to leaf levels.Carbon uptake through photosynthesis and water lossthrough transpiration are finely regulated by stomatal con-ductance and optimized for maximum photosynthesis at thecost of minimum transpiration [Cowan, 1977; Farquhar et
al., 2002; Hari et al., 1986]. These physiological processesare responsive to environmental conditions such as humid-ity, light, temperature, and soil water content.[3] The eddy covariance method provides continuous and
simultaneous measurements of carbon, water and energyexchange between ecosystems and the atmosphere on sub-daily timescales [Aubinet et al., 2000; Baldocchi, 2003].However, water flux measurements from eddy covariancecombine transpiration and evaporation on an ecosystemlevel and thus cannot provide information on transpirationby species. Transpiration rates per unit of ground area mayvary with species and leaf area. For example, conifers anddeciduous trees may differ in transpiration rates because ofdifferences in xylem anatomy, leaf longevity, leaf area, andlength of growing season [Ewers et al., 2002]. Stem sapflux measurements from individual trees provide a methodto estimate canopy transpiration [Granier, 1987; Granierand Loustau, 1994]. This method also allows estimation ofcanopy stomatal conductance and its response to environ-mental factors on an hourly timescale [Ewers and Oren,2000; Kostner et al., 1992; Phillips and Oren, 1998].Combining sap flux measurements and eddy covariance
JOURNAL OF GEOPHYSICAL RESEARCH, VOL. 111, G02009, doi:10.1029/2005JG000083, 2006
1Department of Forest Resources, University of Minnesota, Saint Paul,Minnesota, USA.
2Department of Botany, University of Wyoming, Laramie, Wyoming,USA.
3Department of Meteorology, Pennsylvania State University, UniversityPark, Pennsylvania, USA.
Copyright 2006 by the American Geophysical Union.0148-0227/06/2005JG000083$09.00
G02009 1 of 12

measurements provide a means to study stomatal conduc-tance in response to environmental drivers and the relation-ship between photosynthesis and transpiration.[4] Stomatal regulation of water vapor loss and carbon
dioxide gain and stomatal responses to environmental con-ditions have been long and extensively studied [e.g., Jarvis,1976; Lange et al., 1971]. The multiple controls of humid-ity, light, temperature and soil moisture on stomatal con-ductance vary spatially with ecosystem types andtemporally with different timescales. Stomatal conductancemay respond to changes of leaf water potential resultingfrom transpiration, rather than directly to environmentalconditions [Mott and Parkhurst, 1991]. However, themechanism of this regulation is not fully understood[Franks, 2004; Oren et al., 1999]. It has been reported thatthe proportionality between the sensitivity of canopy sto-matal conductance (GS) to lnD and the GS at vapor pressuredeficit (D) = 1 kPa averages �0.6 [Oren et al., 1999].However, a series of filters for removing other factors haveto be often used to obtain this relationship [Ewers et al.,2005]. This makes modeling GS on the basis of environ-mental conditions difficult.[5] Water use efficiency (WUE), defined in this paper as
photosynthesis divided by transpiration, describes the link-age between water and carbon flux. We may connect waterand carbon flux measurements and determine one flux fromanother companion flux on the basis of the close relation-ship between plant hydraulic and biochemical properties[Katul et al., 2003]. Because it is relatively easier tocontinuously measure water flux of individual trees, partic-ularly through sap flux measurements, than carbon fluxfrom individual trees or from the stand level, and becausewater use efficiency is a relatively conservative plant prop-erty responding to the environment [Tanner and Sinclair,1983], deriving canopy carbon assimilation from waterflux provides a new approach for carbon studies [Moren etal., 2001]. It has been reported that WUE is inverselyproportional to vapor pressure deficit (D) [Berbigier etal., 2001; Dewar, 1997; Lindroth and Cienciala, 1996].However, studies on WUE by combining simultaneous eddycovariance measurements and scaled sap flux measurementsare limited.[6] Old growth forests provide a successional end-
member and a future trend for current second-growthforests. It has been proposed that photosynthesis decreaseswhile respiration increases as forests age, resulting in thedecline in forest growth and a neutral NEE for old growthforests [Kira and Shidei, 1967; Odum, 1969]. However,there are few empirical data to support this explanation fordecrease in growth [Ryan et al., 2004]. Hydraulic resis-tance-induced stomatal constraint may be an importantreason for observed decrease in growth [Gower et al.,1996]. While carbon flux in old growth forests has beenintensively studied [e.g., Desai et al., 2005; Goulden et al.,1998; Harmon et al., 2004; Saleska et al., 2003; Tang et al.,2006], studies on transpiration and the relationship betweentranspiration and photosynthesis from old trees and oldgrowth forests are relatively limited. Kostner et al. [2002]studied transpiration in mature stands of Norway spruce(Picea abies) varying in age from 40–140 years in Ger-many, and found water use efficiency, derived fromupscaled sap flux and stem growth, declined with stand
age. On the basis of sap flux measurements, Phillips et al.[2002] found that old (450 years) Douglas fir (Pseudotsugamenziesii) trees in the Pacific Northwest, USA had lesscrown-averaged stomatal conductance than younger treesbecause of hydraulic resistance related to tree height. Irvineet al. [2004] reported that old (�250 years) ponderosa pine(Pinus ponderosa) stands in the Pacific West, USA hadsimilar site-averaged transpiration but much less transpira-tion per unit leaf area than younger stands, similar to thefindings of Ewers et al. [2005] for 150-year-old borealblack spruce (Picea mariana) forests. Ewers et al. [2006]compared transpiration from a single species, sugar maple(Acer saccharum), in an old growth, second-growth, andthinned second-growth stands in the Great Lakes region.However, we have not seen studies focused on transpirationin old growth forests in the Great Lakes region.[7] The objectives of this research were (1) to measure
sap flux in an old growth hemlock–northern hardwoodforest in the Great Lakes region; (2) to upscale sap flux tocanopy transpiration, estimate canopy stomatal conduc-tance, and examine transpiration and stomatal responses toenvironmental conditions; (3) to calculate water use effi-ciency and its responses to environmental conditions bycombining sap flux measurements and eddy covariancemeasurements; and (4) to discuss the possibility to use theresponse of water use efficiency to environmental condi-tions to predict daily carbon assimilation on the basis oftranspiration.
2. Materials and Methods
2.1. Site Description
[8] The study area is located on the boundary of theSylvania Wilderness and Recreation Area of the OttawaNational Forest in the upper peninsula of Michigan, USA(46�1403100N, 89�2005200W). Average elevation is 542 m.The climate is northern continental, characterized by shortgrowing seasons and long, cold winters. Annual averageprecipitation and air temperature measured in a nearbyweather station over 1961–1990 is 896 mm and 3.9�C,respectively. Precipitation is evenly distributed in all sea-sons. Dominant upland soils are moderately well-drained,coarse or sandy loam spodosols [Pastor and Broschart,1990].[9] The 8500 ha Sylvania Wildness is one of only two
large tracts of old growth forest remaining in the GreatLakes region. The Sylvania Wilderness is a hemlock–northern hardwood forest comprising 3–30 ha patchesdominated by either eastern hemlock (Tsuga canadensis)or sugar maple (Acer saccharum), with yellow birch (Betulaalleghaniesis), basswood (Tilia americana), and ironwood(Ostrya virginiana) also present in the overstory [Frelich etal., 1993; Pastor and Broschart, 1990]. The forest is arepresentative of late successional forests and has long-termcompositional stability.[10] The study site, about a hectare in area and within the
typical footprint area of an eddy covariance flux tower[Desai et al., 2005], was a hardwood-dominated old growthstand. Sugar maple comprised 71% of trees, in addition tohemlock (14%), yellow birch (7%), and basswood andironwood (8%). Trees ranged from 0–350 years old, butold trees dominated the canopy. Average canopy height was
G02009 TANG ET AL.: TRANSPIRATION IN AN OLD GROWTH FOREST
2 of 12
G02009

approximately 22 m. Stand density was 439 trees/hectare forall trees greater than 7 cm in diameter at breast height(DBH), with an average DBH of 25.9 cm and basal area of33.1 m2 ha�1 measured in 2002. Maximum leaf area index(LAI) averaged 4.1 m2 m�2 measured with an LAI-2000(LI-COR, Inc., Lincoln, NE) in 2002 across the site. Leafdebris and coarse woody debris covered the ground. Treeseedlings and saplings, maidenhair fern (Adiantum spp.),jack in the pulpit (Arisaema triphyllum), and Lycopodiaceaespp. were scattered under the closed tree canopy.
2.2. Sap Flux Measurements
[11] We measured sap flux per unit of conducting xylemarea (JS) in stem xylem of 48 trees including 19 sugar mapletrees, 14 yellow birch, and 15 hemlock in the growingseason of 2002 (days 160–261) and 2003 (days 152–264).Stem sap flux measurements were made at 1.4 m above theground at two positions toward the north and south of eachtree using Granier-type sensors [Granier, 1987]. The sen-sors were inserted into the xylem at 20 mm depth. JS (g H2Om�2 s�1) was calculated on the basis of the empiricalrelationship of Granier [1987]:
JS ¼ 119DTM � DT
DT
� �1:231
; ð1Þ
where DTM (�C) is the maximum temperature differencebetween heated and unheated reference sensors occurring atnight during the course of a day, and DT (�C) is thetemperature difference between the heated and unheatedsensors at any given time. JS is zero when DTM is measured.[12] Equation (1) assumes that natural temperature gra-
dients between sensors are small [Lundblad et al., 2001].Fifteen-minute averages of temperature difference data werecomputed and stored in data loggers (CR-10x, CampbellScientific Inc., Logan, UT, USA). The average of JS in thenorth and south position represented the mean of theazimuthal pattern. We did not measure JS across the stemsection, but we assumed that JS in the sapwood deeper than20 mm from the cambium was 50% of JS in the outer 20 mmthat we measured, following the sharp radial decline patternin JS in inner 20 mm of the xylem reported by Pausch et al.[2000], Ewers and Oren [2000] and Schafer et al. [2000].Thus we computed mean JS on the basis of the above radialpattern for each tree and then mean JS for each of the threespecies.[13] Canopy transpiration (EC) was upscaled from mean
JS by multiplying it with sapwood area per unit ground area[Ewers et al., 1999; Oren et al., 1998]:
EC ¼ JSAS
AG
; ð2Þ
where AS is the total sapwood area of the study site, and AG
is the total area of the site.[14] We used an exponential saturation equation to ana-
lyze the relationship between JS (or EC) and D [Ewers et al.,2001]:
JS ¼ a 1� e�bD� �
; ð3Þ
where a and b are fitted coefficients. JS saturates at a whenD approaches +1.
2.3. Stand Measurements
[15] Tree diameter at breast height (DBH) was read fromband dendrometers. Sapwood depth and bark thicknesswere measured from tree cores taken from all 48 trees withsap flux sensors. Sapwood depth was determined visuallyfrom tree cores. The total sapwood area from the site wasestimated from the relationship between measured sapwoodarea and DBH, combined with a 100% inventory of DBH atthe site.[16] Site-averaged LAI was measured using LAI-2000
(LI-COR Inc, Lincoln, NE, USA). LAI for each species wasestimated from litterfall measurements. We placed 10 bas-kets, each with an area of 1969 cm2, to collect litterfall.Litterfall was sorted by species. Subsamples were taken forindividual leaf area measured with an optical scanner anddigital summation (SigmaScan, SPSS, Chicago, IL, USA),and dry biomass was weighed to calculate specific leaf area(SLA = leaf area/dry mass). LAI for each species in thestand was estimated on the basis of SLA and total drybiomass from litterfall. Litterfall-based LAI is a measure ofmaximum LAI for deciduous trees during the growingseason. We assumed a constant leaf area during all seasonsfor hemlock, guided by the lack of seasonality in litterfall.Therefore hemlock LAI was calculated from litterfall datamultiplied by 3 years of leaf longevity [Barnes and Wagner,1981].
2.4. Ecosystem Carbon, Water, and MeteorologicalMeasurements
[17] Fluxes of CO2 and water vapor were measured froma tower at 36 m aboveground at the center of the study site,described in detail by Desai et al. [2005]. High-frequency(10 Hz) three-dimensional wind speed was measured by asonic anemometer (CSAT-3, Campbell Scientific Inc.,Logan, UT, USA). CO2 and water at 10 Hz were measuredby an infrared gas analyzer (LI-6262, LI-COR, Lincoln, NE,USA). Gases were drawn by a diaphragm pump (modelUN89, KNF Neuberger Inc., Trenton, NJ, USA). Storageflux calculations and calibration of high-frequency CO2
were obtained by measuring low-frequency (3 min average,21 min interval), high-precision (±0.5 ppm) CO2 mixingratios at seven levels between the ground and flux mea-surement height [Desai et al., 2005].[18] Turbulent fluxes of CO2 and water were calculated at
half-hourly intervals as the covariance of vertical windvelocity and the scalar factors, while considering the lagand spectral corrections [Berger et al., 2001]. Net ecosystemexchange (NEE) at the surface was calculated as the sum ofthe turbulent flux at sensor height and the storage termbelow sensor height. NEE data were screened for weakturbulence friction velocity (�0.05 m s�1) at night andnonrepresentative footprints contaminated by lakes andwetlands [Desai et al., 2005]. Nighttime NEE was assumedto be a measurement of ecosystem respiration, and wasextrapolated to all times by using a moving-window tem-perature response function as described by Cook et al.[2004] and Desai et al. [2005]. Daytime gross primaryproduction (GPP) was then calculated as a sum of ecosys-tem respiration and NEE.
G02009 TANG ET AL.: TRANSPIRATION IN AN OLD GROWTH FOREST
3 of 12
G02009

[19] In addition to flux measurements, a full suite ofmicrometeorological measurements were made at this site,including total photosynthetically active radiation (PAR;model PAR-LITE, Kipp and Zonen Inc., Saskatoon, SK,Canada), air temperature and humidity (model HMP45Cplatinum resistance temperature and capacitive polymerhumidity probe, Campbell Scientific Inc., Logan, UT,USA), total precipitation (model TE525WS tipping bucketrain gauge and CS705 snowfall adapter, Campbell ScientificInc., Logan, UT, USA), and soil water contents at 5, 10, 20,50, and 100 cm using time domain reflectometers (CS615,Campbell Scientific, Inc., Logan, UT, USA). Vapor pressuredeficit (D) in the canopy was calculated from humidity andair temperature at 20 m height [Buck, 1981]. Half-hourlyaverages of these micrometeorological measurements werecomputed and stored on a computer to coincide with theflux measurements. Daytime mean D was calculated fromthe length with daylight hours determined by measurementsof PAR (PAR > 0).
2.5. Canopy Conductance
[20] Assuming an aerodynamically well mixed canopyand similar leaf and air temperature, mean canopy stomatalconductance (GS) can be calculated as a simplified form ofthe Penman-Monteith equation as suggested by Monteithand Unsworth [1990]:
GS ¼ g Tð Þ � l Tð Þ � EL
Cp � r Tð Þ � D ; ð4Þ
where g is the psychrometric constant, l is the latent heat ofvaporization of water, Cp is the specific heat of air, r is thedensity of liquid water, T is the temperature, D is the vaporpressure deficit of the canopy air, and EL is the canopytranspiration per unit of leaf area (= EC/LAI) upscaled fromsap flux measurements by assuming there are negligibletime lags between dynamics of sap flux and environmentalvariables.[21] The four temperature-dependent terms in equation (4),
g, l, Cp, and r, can be aggregated into a single parameter,KG (kPa m2 kg�1):
GS ¼ KG
EL
D
KG ¼ 115:8þ 0:4226T ; ð5Þ
where GS is the canopy stomatal conductance (mm s�1), EL
is canopy transpiration per leaf area (g m�2 s�1), and D(kPa) is vapor pressure deficit in the canopy. Phillips andOren [1998] showed that the errors for this aggregation arenegligible.[22] GS responds to multiple environmental variables.
The responses of GS have been formulated by Jarvis[1976] using a series of multiplicative functions:
GS ¼ GSmaxf PARð Þf Dð Þf TAð Þf CLð Þ; ð6Þ
where Gsmax is the maximum GS, TA is the air temperature,and yL is the leaf water potential. Within a range of solarradiation and air temperature and with unlimited soilmoisture conditions, the response of GS to D can be
isolated and analytically expressed as a logarithmic equation[Oren et al., 1999]:
GS ¼ GSref � m lnD; ð7Þ
where GSref is a reference conductance at D = 1 kPa, and mis the stomatal sensitivity of GS in response to lnD.
2.6. Water Use Efficiency
[23] The ratio of daily sum of GPP to EC was defined aswater use efficiency (WUE). We used an exponential decayequation to analyze the relationship between WUE and D(or PAR):
WUE ¼ a0 þ a1e�a2D; ð8Þ
where a0, a1 and a2 are fitted coefficients and WUEminimizes at a0 when D approaches + 1.[24] Statistical analyses and regressions were conducted
in S-PLUS (version 6.0, Insightful Corp., Seattle, WA,USA) and Sigmaplot (version 8.0, SPSS Inc., Chicago,IL, USA).
3. Results
3.1. Sap Flux per Unit of Sapwood Area
[25] We randomly chose 2 days to show the typicaldiurnal patterns of sap flux within our time series data intwo growing seasons. Figure 1 shows the diurnal patterns ofvapor pressure deficit (D), photosynthetically active radia-tion (PAR), and mean sap flux per unit of sapwood area (JS)for three species in two representative sunny days in thesummers of 2002 and 2003. JS peaked between 13 h (localstandard time) and 15 h on day 192 of 2002 with peakvalues of 28.9, 24.7, 20.8 g m�2 s�1 in sugar maple, yellowbirch, and hemlock, respectively. JS peaked between 12.5 hand 14.5 h on day 152 of 2003 with peak values of 27.3,36.4, 21.7 g m�2 s�1 in sugar maple, yellow birch, andhemlock, respectively. JS peaked approximately 1–3 hourslater than PAR, but 2–4 hours earlier than the peak of D.[26] Exponential saturation equations fitted daily sums of
JS against daytime mean D (Figure 2a). The parameters forexponential saturation equations (equation (3)) for sugarmaple, yellow birch and hemlock are shown in Table 1. Thedifference in r2 suggested that the correlations between JSand D for sugar maple and yellow birch are higher than forhemlock. The coefficient a suggests the maximum JS that aspecies may have. Overall, sugar maple and yellow birchhad higher JS than hemlock. Sugar maple had slightly lowerJS than yellow birch.[27] Daily sums of JS were also controlled by daily sums
of PAR with a linear relationship fitting the data (Figure 2b).The parameters of the linear equations for three species areshown in Table 1. The sensitivity (slope of response) of JSto PAR was the lowest for hemlock while JS respondedsimilarly to PAR for sugar maple and yellow birch.
3.2. Scaling Sap Flux to Canopy Transpiration
[28] We found that measurements of sapwood area of atree were linearly correlated with DBH. The interceptsare �292.2, �236.1, �188.7 cm2, slopes are 29.3, 22.3,22.1 cm, and r2 are 0.92, 0.75, 0.73 (p all less than 0.001)
G02009 TANG ET AL.: TRANSPIRATION IN AN OLD GROWTH FOREST
4 of 12
G02009

for sugar maple, yellow birch, and hemlock, respectively.This linear relationship was used to estimate total sapwoodarea over the site on the basis of DBH measurements. IfDBH < 12 cm, sapwood area of a tree was assumed to bethe stem area excluding the bark. Sapwood area and leafbiomass and area for three dominant species are shown inTable 2. The total sapwood area was 19.65 cm2 m�2, or59% of basal area. Sugar maple accounted for 70% of totalsapwood area. Among the three species, the sapwood to leafarea ratio was the largest for hemlock and smallest foryellow birch.[29] Table 2 also shows dry leaf biomass, leaf area index
(LAI), and specific leaf area (SLA) for sugar maple, yellowbirch, and hemlock, on the basis of litterfall data averagedfrom years 2002 and 2003. The total surface LAI measure-ment based on litterfall data was larger than the optical site-average measurement based on the instrument LAI-2000(4.1 m2 m�2). Because of the dominant stem numbers, sugarmaple had the largest leaf biomass and LAI. Yellow birchhad higher SLA than sugar maple. Hemlock had the lowestvalue of SLA because of its small and relatively thickleaves.[30] Canopy transpiration per unit of leaf area (EL) on the
daily basis varied substantially in the growing season, withminimums of 15.8, 14.2, and 13.7 g m�2 d�1 andmaximums of 363.4, 262.3, 422.8 g m�2 d�1 for sugarmaple, yellow birch, and hemlock, respectively (Figures 3aand 3b). The averages of EL over the growing season of2002 and 2003 were 220.6, 161.5, 226.8 g m�2 d�1 forsugar maple, yellow birch, and hemlock, respectively.Opposite to the order of Js, hemlock had the highest EL,followed by sugar maple and yellow birch, because both Jsand the sapwood to leaf area ratio determined EL. Hemlock
had a low sapwood to leaf area ratio compared with sugarmaple and yellow birch.[31] Total daily canopy transpiration per ground area (EC)
also varied substantially from a minimum of 0.13 mm d�1
to a maximum of 2.43 mm d�1 in the growing season(Figures 3c and 3d). The averages of EC for sugar maple,yellow birch, and hemlock were 1.15, 0.26, 0.16 mm d�1,respectively. The average of total EC was 1.58 mm d�1 in2002 and 1.56 mm d�1 in 2003 with 1.57 mm d�1 averagedover the growing seasons of 2002 and 2003.[32] We plotted daily sums of EC against daytime mean D
and daily sums of PAR (Figure 4). As the upscaled JS(Figure 2) and aggregation of three species, EC respondedto D by an exponential saturation curve with r2 = 0.81 andthe coefficients a = 2.17, b = 2.27 (Figure 4a). Similar tothe relationship between JS for each species and PAR,upscaled and aggregated EC also showed a linear relation-ship with PAR (Figure 4b) with r2 = 0.75, slope = 0.034,and intercept = 0.16.[33] We did not find the control of soil moisture on EC
since an average of 896 mm precipitation was almost evenlydistributed in all seasons at this site. The average ofvolumetric soil water content at 10 cm was 0.19 m3 m�3
with standard deviation of 0.03 m3 m�3 in the growingseason of 2002 and 2003. As a result of the favorable soilmoisture level to plants, the correlation between soil mois-ture and EC was not significant (r2 < 0.1).[34] Canopy transpiration at the site upscaled from sap
flux was compared to evapotranspiration measured by thewater flux between the canopy and the atmosphere usingeddy covariance measurements. The average evapotranspi-ration was 2.43 mm d�1 over the growing season of 2002and 2003. If these two methods are comparable, transpira-
E
Figure 1. Diurnal patterns of (a and b) D, (c and d) PAR, and (e and f) Js for three species in 2 typicaldays in the summers of 2002 and 2003. The error bars in Figures 1e and 1f are standard errors.
G02009 TANG ET AL.: TRANSPIRATION IN AN OLD GROWTH FOREST
5 of 12
G02009

tion accounted for 65% of total evapotranspiration. Thedifference between evapotranspiration and transpiration wasfrom soil and tree evaporation, which averaged 0.86 mmd�1, accounting for 35% of total evapotranspiration in thegrowing season. The average precipitation during theseperiods was 2.59 mm d�1. The surplus of water at0.16 mm d�1 either permeated into groundwater, stored inthe soil, or transported as surface runoff.
[35] We compared daily sums of transpiration (EC)upscaled from sap flux measurements and total evapotrans-piration (ET) measured with the eddy covariance method ondays with and without rain (Figure 5). Days with rain wereseparated from without rain because evaporation occurredfrom leaves and stems in addition to the soil during therainy days. On days without rain, a power function fitted tothe data. On rainy days, EC and ET were linearly correlated.
3.3. Canopy Stomatal Conductance
[36] Figure 6 shows two groups of diurnal patterns ofstomatal conductance (GS), D and PAR over five typicalsunny days in 2002 and 2003. Daily peak GS increased from0.57 mm s�1 on day 192 to 0.82 mm s�1 on days 195 and196 of 2002, and decreased from 0.70 mm s�1 on day 152to 0.48 mm s�1 on days 154, 155 and 156 of 2003. Thepeak GS generally occurred between 10–12 h except day on156 of 2003. These diurnal patterns of GS correlated wellwith PAR with a similar peak time.[37] Because of multiple controls on GS, particularly the
strong control of PAR at midday, the diurnal patterns of GS
did not show a negative correlation with D during thecourse of a day. However, daytime mean values of GS
negatively correlated with daytime mean D. Within therepresentative 5 days, we found that daytime mean GS
increased from 0.35 mm s�1 on day 192 to 0.52 mm s�1
on day 195 and decreased to 0.50 mm s�1 on day 196 in2002. Correspondingly, daytime mean D decreased from1.37 kPa on day 192 to 0.94 kPa on day 195 and thenincreased to 1.05 kPa on day 196 in 2002. A similarcorrelation pattern also occurred in 2003. Daytime meanGS decreased from 0.39 mm s�1 on day 152 to 0.29 mm s�1
on days 155 and 156. At the same time, D increased from0.97 kPa on day 152 to 1.51 kPa on day 156 in 2003.[38] We plotted daytime mean GS against D over two
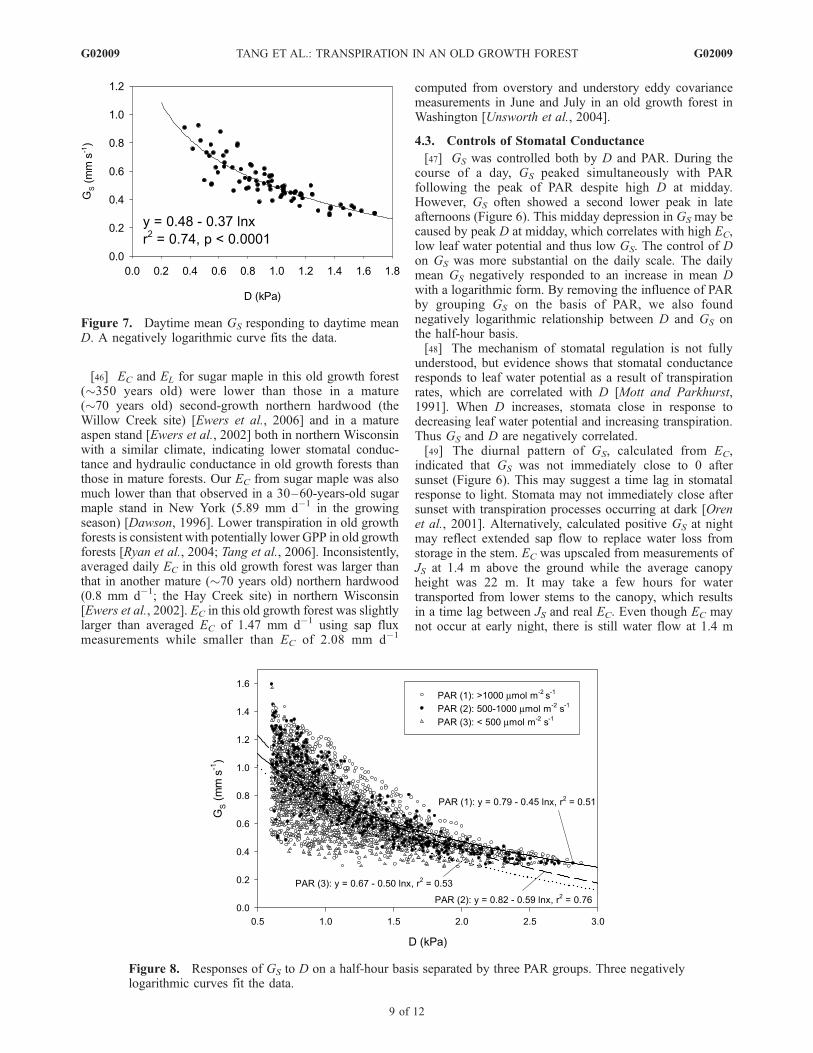
growing seasons (Figure 7). We selected GS for the dayswhen D > 0.1 kPa for any 15-min daytime period to excludeerrors associated in the calculation of GS using equation (5).GS was strongly correlated with D, indicating the control ofD on the day-to-day variation of GS. A logarithmic function,GS = 0.48–0.37lnD, fitted the data with r2 = 0.74, p <0.0001. Although GS was correlated with PAR during thecourse of a day, we did not find a significant relationshipbetween mean GS and PAR on the daily scale.[39] To examine the response of GS to D on a half-hour
basis, we used a filter ofD=0.6 kPa to excludeGS data forD<0.6 kPa and thus decreased errors associated in computinghalf-hourly GS, as suggested by Ewers and Oren [2000].Figure 8 shows the responses of GS to D separated by three
Figure 2. Daily sum of Js as a function of (a) daytimemean D and (b) daily sum of PAR for sugar maple (SM),yellow birch (YB), and hemlock (HL). Lines are exponen-tial saturation curves (y = a(1 � exp(�bx)) (Figure 2a) andlinear curves (Figure 2b).
Table 1. Parameters for the Exponential Saturation Equation JS =
a(1 � exp(�bD)) and the Linear Equation JS = A PAR + B for
Sugar Maple, Yellow Birch, and Hemlock
Species Sugar Maple Yellow Birch Hemlock
JS Versus Da 118.6 121.0 72.3b 2.1 2.5 2.4r2 0.82 0.74 0.58p <0.001 <0.001 <0.001
JS Versus PARA 1.8 1.8 1.2B 7.5 16.7 1.5r2 0.74 0.70 0.63p <0.001 <0.001 <0.001
Table 2. Sapwood Area per Unit Ground Area, Sapwood to Leaf
Area Ratio, Dry Leaf Biomass per Unit Ground Area, Leaf Area
Index (LAI), and Specific Leaf Area (SLA) for Sugar Maple,
Yellow Birch, and Hemlock
SpeciesSugarMaple
YellowBirch Hemlock Sum
Sapwood area per unit groundarea, cm2 m�2
13.82 2.90 2.93 19.65
Sapwood to leaf area ratio,cm2 m�2
2.65 1.78 4.26 –
Leaf biomass, g m�2 186.19 48.14 66.65 300.98LAI, m2 m�2 5.21 1.63 0.69 7.53SLA, cm2 g�1 279.80 338.85 102.92 –
G02009 TANG ET AL.: TRANSPIRATION IN AN OLD GROWTH FOREST
6 of 12
G02009

PAR groups, PAR (1) > 1000 mmol m�2 s�1, PAR (2) = 500–1000 mmol m�2 s�1, and PAR (3) <500 mmol m�2 s�1. Threenegatively logarithmic lines fitted the data with r2 = 0.51,0.76, 0.53 for group (1), group (2) and group (3), respectively.The coefficients of the three lines indicate that the correlationwas the highest and GS was the most sensitive to D for therange of PAR at 500–1000 mmol m�2 s�1. The sensitivity ofGS to D decreased when PAR was greater than 1000 mmolm�2 s�1 or less than 500 mmol m�2 s�1.
3.4. Water Use Efficiency
[40] We did not find a strong correlation between GPPand D (r2 = 0.29). However, water use efficiency (WUE) onthe daily basis shows a strong relationship with daytimemean D (Figure 9a). An exponential decay function withr2 = 0.72 fitted this relationship. WUE dramaticallyincreased when D < 0.3 kPa, with a peak measured valueof 25.8 mg g�1. WUE was stable when D was larger than0.6 kPa and approached a minimum of 4.4 mg g�1,indicating conservative WUE when D was high.[41] WUE also had an exponential decay relationship
with PAR with r2 = 0.52 (Figure 9b). Either PAR or Dmay be used to predict WUE, but D was a better indicator.PAR and D on the daily basis also correlated with r2 = 0.61.
4. Discussion
4.1. Controls of Sap Flux and Transpiration
[42] Diurnal patterns and day-to-day variations of JS andEC were both controlled by D and PAR. During the courseof a day, the peak time of JS and EC, falling midwaybetween that of D and PAR, suggests a simultaneous controlof D and PAR on JS and EC. The saturation of daily sums ofJS and EC at high D (>1.2 kPa) suggests that at the lowerrange of D, D is a major control on JS and EC because thegradient of water vapor between inside the stomata andambient air drives transpiration. When D was high, JS and
Figure 3. (a and b) Daily sum of EL for sugar maple (SM), yellow birch (YB), and hemlock (HL) and(c and d) total EC per unit of ground area between June and September of 2002 and 2003.
Figure 4. Daily sum of EC as a function of (a) daytimemean D and (b) daily sum of PAR. An exponentialsaturation curve fits the data of EC versus D, and a linearcurve fits the data of EC versus PAR.
G02009 TANG ET AL.: TRANSPIRATION IN AN OLD GROWTH FOREST
7 of 12
G02009

EC saturated because of decreased stomatal conductance,despite the favorable water vapor gradient for transpiration.JS and EC did not saturate at high PAR on the daily basis,consistent with many other studies [e.g., Ewers et al., 2005].Within our observation range of PAR between 5 and 70 molm�2 d�1, JS responded linearly to PAR.
4.2. Transpiration Versus Evapotranspiration
[43] Our result of 65% of EC/ET in the growing season isconsistent with a recent study that reported 66% of EC/ET ina northern hardwood forest in northern lower Michigan[Bovard et al., 2005] and less than a result of 75% when ET
was high in the summer in a temperate forest in NorthCarolina [Schafer et al., 2002]. Our EC/ET in this old growthforest with ample moisture is less than that in a Mediterra-nean-type old growth forest in Washington with EC/ET of90% derived from overstory and understory eddy covari-ance measurements of water flux in dry summer due to lowsoil moisture and evaporation [Unsworth et al., 2004].[44] The ratio of EC/ET in this paper is derived from two
independent methods, both of which suffer from errorsduring measurements and upscaling processes. Errors asso-ciated with eddy covariance measurements have been widelydiscussed [e.g., Baldocchi, 2003]. In addition to measure-ment errors in JS, errors of EC are from upscaling processes,namely, the weighted mean JS and estimation of sapwoodarea (equation (2)). Among these error sources, the averageof JS from measurements is a critical one because of theradial pattern of JS across the stem section. There is noconsensus of the radial pattern of JS for each species becauseof difficulties in measuring JS across the stem. This paperused a simple bisection method to average JS of each tree.Detailed description of JS as a function of radial tree depth issubject to further investigation.[45] The power function between EC and ET on days
without rain (Figure 5) suggests that when EC was high(>1.5 mm d�1) associated with high D and low GS, ET
(including evaporation and transpiration) increased fasterthan EC, indicating that evaporation from soil is not con-strained at high D while EC is constrained by stomatalclosure. The departure of EC from ET at high values is inagreement with Bovard et al. [2005], Schafer et al. [2002],and MacKay et al. [2002], but in disagreement with asimple linear relationship reported by Oren et al. [1998].On rainy days with very low D, EC was linearly correlatedwith ET, indicating little physiological regulation of EC.
Figure 6. Diurnal patterns of GS, PAR, and D over 5 typical sunny days between (a) days 192 and 196in 2002 and (b) days 152 and 156 in 2003 and daytime mean D and GS over these days.
Figure 5. Comparison of daily sum of transpiration (EC)upscaled from sap flux measurements and total evapotran-spiration (ET) measured with the eddy covariance methodon days with and without rain. A power curve fits the datawithout rain, and a linear curve fits the data with rain.
G02009 TANG ET AL.: TRANSPIRATION IN AN OLD GROWTH FOREST
8 of 12
G02009
[46] EC and EL for sugar maple in this old growth forest(�350 years old) were lower than those in a mature(�70 years old) second-growth northern hardwood (theWillow Creek site) [Ewers et al., 2006] and in a matureaspen stand [Ewers et al., 2002] both in northern Wisconsinwith a similar climate, indicating lower stomatal conduc-tance and hydraulic conductance in old growth forests thanthose in mature forests. Our EC from sugar maple was alsomuch lower than that observed in a 30–60-years-old sugarmaple stand in New York (5.89 mm d�1 in the growingseason) [Dawson, 1996]. Lower transpiration in old growthforests is consistent with potentially lower GPP in old growthforests [Ryan et al., 2004; Tang et al., 2006]. Inconsistently,averaged daily EC in this old growth forest was larger thanthat in another mature (�70 years old) northern hardwood(0.8 mm d�1; the Hay Creek site) in northern Wisconsin[Ewers et al., 2002]. EC in this old growth forest was slightlylarger than averaged EC of 1.47 mm d�1 using sap fluxmeasurements while smaller than EC of 2.08 mm d�1
computed from overstory and understory eddy covariancemeasurements in June and July in an old growth forest inWashington [Unsworth et al., 2004].
4.3. Controls of Stomatal Conductance
[47] GS was controlled both by D and PAR. During thecourse of a day, GS peaked simultaneously with PARfollowing the peak of PAR despite high D at midday.However, GS often showed a second lower peak in lateafternoons (Figure 6). This midday depression in GS may becaused by peak D at midday, which correlates with high EC,low leaf water potential and thus low GS. The control of Don GS was more substantial on the daily scale. The dailymean GS negatively responded to an increase in mean Dwith a logarithmic form. By removing the influence of PARby grouping GS on the basis of PAR, we also foundnegatively logarithmic relationship between D and GS onthe half-hour basis.[48] The mechanism of stomatal regulation is not fully
understood, but evidence shows that stomatal conductanceresponds to leaf water potential as a result of transpirationrates, which are correlated with D [Mott and Parkhurst,1991]. When D increases, stomata close in response todecreasing leaf water potential and increasing transpiration.Thus GS and D are negatively correlated.[49] The diurnal pattern of GS, calculated from EC,
indicated that GS was not immediately close to 0 aftersunset (Figure 6). This may suggest a time lag in stomatalresponse to light. Stomata may not immediately close aftersunset with transpiration processes occurring at dark [Orenet al., 2001]. Alternatively, calculated positive GS at nightmay reflect extended sap flow to replace water loss fromstorage in the stem. EC was upscaled from measurements ofJS at 1.4 m above the ground while the average canopyheight was 22 m. It may take a few hours for watertransported from lower stems to the canopy, which resultsin a time lag between JS and real EC. Even though EC maynot occur at early night, there is still water flow at 1.4 m
Figure 8. Responses of GS to D on a half-hour basis separated by three PAR groups. Three negativelylogarithmic curves fit the data.
Figure 7. Daytime mean GS responding to daytime meanD. A negatively logarithmic curve fits the data.
G02009 TANG ET AL.: TRANSPIRATION IN AN OLD GROWTH FOREST
9 of 12
G02009

measured as JS for compensating the water loss from thecanopy [Granier and Loustau, 1994; Phillips et al., 1997].Finally, nonzero GS at night may be due to errors associatedwith the measurements of JS and EL. The small error inmeasuring DTM for calculating JS (equation (1)) may beamplified when we calculate GS at low EL and low D(equation (5)) at night [Ewers and Oren, 2000].[50] We have found that an exponential saturation equa-
tion may be used to describe the relationship between JS, EL
or EC with D on the daily basis (equation (3)). Combiningequation (3) and equation (5) we have
GS ¼ KG
a
D1� e�bD� �
: ð9Þ
[51] We used nonlinear regression to fit our daily data,which resulted in parameters a = 0.0044, b = 2.64, r2 =0.78. Equation (9) may be used to estimate the day-to-dayvariation of canopy stomatal conductance without measure-ments of transpiration. We also found that the logarithmicfunction can directly describe the relationship between GS
and D (equation (7)). Within our measurement range ofdaytime mean D between 0.2 and 1.8 kPa, two fitted linesusing the forms of equation (7) and equation (9) werealmost identical while equation (7) is a simpler expressionfor describing the response of GS to D.[52] We may ignore the effect of PAR on GS when we
investigate the relationship between GS and D on the dailytimescale (Figure 7), but we have to take into account theeffect of PAR for the instantaneous response of GS to D onthe half-hourly basis since the diurnal variation of PAR is
more significant in affecting GS than daily mean PAR.Three groups of PAR data result in three logarithmic linesfitting GS vs. D (Figure 8). The proportions of m/GSref are0.57, 0.72 and 0.74 for PAR greater than 1000, between500–1000, and less than 500 mmol m�2 s�1, respectively.Across a large range of ecosystem types and environmentalconditions, m/GSref is approximately 0.6, indicating thestomatal regulation of water potential to prevent xylemcavitation [Ewers et al., 2005; Oren et al., 1999]. Ourresults indicated that m/GSref increased with the decreasein PAR. During the maximum PAR, m/GSref was the closestto 0.6 among three PAR groups. The stomatal sensitivity ofGS response to lnD, m, is the highest for the PAR between500–1000 mmol m�2 s�1, and the lowest for the PARgreater than 1000 mmol m�2 s�1. GSref increased from0.67 mm s�1 at PAR < 500 mmol m�2 s�1 to 0.82 mms�1 at PAR = 500–1000 mmol m�2 s�1, and slightly downto 0.79 mm s�1 at PAR > 1000 mmol m�2 s�1. This is inagreement with Schafer et al. [2000] that reported a satu-ration of GSref at PAR = 600 mmol m�2 s�1.
4.4. Modeling GPP Using WUE
[53] Sap flux measurements provide an alternative todirectly estimate photosynthesis on the basis of calculationof water use efficiency (WUE) and the correlation betweenWUE and D. The correlation can be expressed as anexponential decay function (Figure 9 and equation (8)).Therefore GPP can be modeled on the daily scale as
GPP ¼ EC a0 þ a1e�a2D
� �: ð10Þ
[54] We found that this model explained 24% of variationin GPP derived from eddy covariance measurements, whenwe plotted modeled GPP against measured GPP. AlthoughWUE had a high correlation with D, WUE-derived GPP hada relatively low correlation with measured GPP. The reasonwas probably due to the influence of WUE at high D onGPP. When D was high, the small variation in WUE wasamplified by high EC, resulting in a relatively high error inmodeling GPP.[55] WUE also had a good relationship with PAR. How-
ever, since D and PAR were positively correlated at our site(r2 = 0.61), it is possible for us to derive water useefficiency or GPP solely from D that may have confoundedeffect of PAR.[56] It is advantageous to use EC and WUE to estimate
GPP given the difficulty in continuously measuring photo-synthesis at the leaf level and then upscaling to the canopylevel compared with sap flux measurements. Studies onWUE and its control and variation have been conductedsince 1950s for crop yield and water supply analyses [e.g.,Bierhuizen and Slatyer, 1965]. Recently, it has been attemp-ted to use WUE to model carbon exchange in forests[Dewar, 1997; Moren et al., 2001]. Although the conserva-tive nature of WUE was found in this forest with amplemoisture, WUE may be stable regardless of water supply[Dewar, 1997; Monteith, 1986]. More studies on WUE andits mechanism in different stages of forest development aresuggested.[57] Although WUE has been defined using various
combinations of numerator and denominator at either the
Figure 9. Water use efficiency (WUE) on a daily basisresponding to (a) daytime mean D and (b) daily sum ofPAR. Fitted lines are exponential decay curves (y = a0 + a1exp (�a2x)).
G02009 TANG ET AL.: TRANSPIRATION IN AN OLD GROWTH FOREST
10 of 12
G02009

leaf or canopy level, for example, photosynthesis, netproduction, or aboveground production for numerator, andtranspiration or evapotranspiration for denominator, WUEreflects carbon uptake at the cost of water loss. Tanner andSinclair [1983] has summarized that WUE is a conservativeplant property on the basis of a synthesis of crop yield andevaporation. It has been reported that WUE correlates withD as an inverse equation (WUE � 1/D) [Baldocchi et al.,1987; Berbigier et al., 2001; Dewar, 1997; Moren et al.,2001]. Bierhuizen and Slatyer [1965] and Monteith [1986]have theoretically derived this equation at the leaf scale.Both photosynthesis and transpiration can be expressed as ageneral diffusion equation, that is, multiplication of thedifference between ambient and intercellular concentration(ca � ci) and stomatal conductance to CO2 (gc) or to watervapor (gw). Because of a relatively conservative nature of(ca � ci) or ci/ca for CO2 and the gc/gw ratio, WUE isproportional to 1/(ca � ci) for water vapor or approximatedto be proportional to 1/D if D is approximated to be (ca � ci)for water vapor [Bierhuizen and Slatyer, 1965].[58] However, these approximations may not hold be-
cause of stomatal behavior in response to D. First, the ci/caratio may not be strictly constant as D varies [Dewar, 1997].Second, gc/gw may not be constant in response to D. At theleaf scale, stomatal resistance is the sum of boundary layerresistance (rb), stomatal (pore) resistance (rs), and intercel-lular space and wall resistance (ri). Each component resis-tance to CO2 is larger than that to water with different ratios;particularly, ri to CO2 is much larger than ri to water [Jones,1992; Tanner and Sinclair, 1983]. The different ratios ofeach component conductance may explain the variation inthe aggregated gc/gw in response to D.[59] We found that an exponential decay function fitted our
data better than an inverse equation (r2 = 0.42). The expo-nential decay function reflects the asymmetric pattern ofWUE in lower D and higher D. In the range of higher D(daytime mean D > 0.6 kPa), WUE had a small variation andapproached a constant. The mechanistic explanation of thisexponential decay function is subject to further investigation.
5. Conclusions
[60] Sap flux measurements provide a useful tool tocontinuously estimate canopy transpiration and stomatalconductance. Combining sap flux and eddy covariancemeasurements of carbon and water fluxes enables estima-tion of the relationship between transpiration and photosyn-thesis from tree to stand levels. We found that the diurnalpatterns of sap flux and canopy transpiration were mainlycontrolled by vapor pressure deficit (D) and photosynthet-ically active radiation (PAR). Daily sums of sap flux andcanopy transpiration had exponential relationships with Dthat saturated at higher D, and had linear relationships withPAR. Canopy transpiration in this old growth forest waslower than that from a few reported mature northernhardwood forests [Dawson, 1996; Ewers et al., 2006],suggesting lower stomatal conductance and hydraulic con-ductance in old growth forests than those in mature forests.[61] Canopy conductance was controlled both by D and
PAR, but the day-to-day variation in canopy conductancewas negatively logarithmically correlated with D. Canopyconductance on the half-hourly basis was also logarithmi-
cally correlated with D after grouping canopy conductanceon the basis of PAR.[62] Water use efficiency (WUE), calculated as GPP
divided by transpiration, had a strong exponential relation-ship with D on the daily basis, indicating a conservativenature when D is high. The strong correlation betweenWUE and environmental conditions indicates that we maypotentially estimate GPP from transpiration and environ-mental variables.
[63] Acknowledgments. We thank J. Martin, B. Cook, D. Hudleston,L. Kreller, J. Zhang, L. Teng, and many undergraduate students from theUniversity of Minnesota for assistance in installing and maintaining sapflux sensors and processing sap flux data. We thank two anonymousreviewers for valuable comments in improving the earlier version of thismanuscript. We also thank the University of Wisconsin Kemp NaturalResources Station for housing personnel, storing equipment, and providinglaboratory access. This work was primarily funded by the Office of Science/BER, U.S. Department of Energy Terrestrial Carbon Processes Program(DE-FG02-00ER63023).
ReferencesAubinet, M., et al. (2000), Estimates of the annual net carbon and waterexchange of forests: The EUROFLUX methodology, Adv. Ecol. Res., 30,113–175.
Baldocchi, D. D. (2003), Assessing the eddy covariance technique forevaluating carbon dioxide exchange rates of ecosystems: Past, presentand future, Global Change Biol., 9(4), 479–492.
Baldocchi, D. D., S. B. Verma, and D. E. Anderson (1987), Canopy photo-synthesis and water-use efficiency in a deciduous forest, J. Appl. Ecol.,24(1), 251–260.
Barnes, B. V., and W. H. Wagner (1981), Michigan Trees: A Guide to theTrees of Michigan and the Great Lakes Region, 383 pp., Univ. of Mich.Press, Ann Arbor.
Berbigier, P., J. M. Bonnefond, and P. Mellmann (2001), CO2 and watervapour fluxes for 2 years above Euroflux forest site, Agric. For. Meteor-ol., 108(3), 183–197.
Berger, B. W., K. J. Davis, C. X. Yi, P. S. Bakwin, and C. L. Zhao (2001),Long-term carbon dioxide fluxes from a very tall tower in a northernforest: Flux measurement methodology, J. Atmos. Oceanic Technol.,18(4), 529–542.
Bierhuizen, J. F., and R. O. Slatyer (1965), Effect of atmospheric concen-tration of water vapour and CO2 in determining transpiration-photosynth-esis relationships of cotton leaves, Agric. Meteorol., 2(4), 259–270.
Bovard, B. D., P. S. Curtis, C. S. Vogel, H. B. Su, and H. P. Schmid (2005),Environmental controls on sap flow in a northern hardwood forest, TreePhysiol., 25(1), 31–38.
Buck, A. L. (1981), New equations for computing vapor pressure andenhancement factor, J. Appl. Meteorol., 20(12), 1527–1532.
Cook, B. D., et al. (2004), Carbon exchange and venting anomalies in anupland deciduous forest in northern Wisconsin, USA, Agric. For. Meteor-ol., 126(3–4), 271–295.
Cowan, I. R. (1977), Stomatal behaviour and environment, Adv. Bot. Res.,4, 117–228.
Dawson, T. E. (1996), Determining water use by trees and forests fromisotopic, energy balance and transpiration analyses: The roles of tree sizeand hydraulic lift, Tree Physiol., 16(1–2), 263–272.
Desai, A. R., P. V. Bolstad, B. D. Cook, K. J. Davis, and E. V. Carey (2005),Comparing net ecosystem exchange of carbon dioxide between an old-growth and mature forest in the upper Midwest, USA, Agric. For. Me-teorol., 128(1–2), 33–55.
Dewar, R. C. (1997), A simple model of light and water use evaluated forPinus radiata, Tree Physiol., 17(4), 259–265.
Ewers, B. E., and R. Oren (2000), Analyses of assumptions and errors in thecalculation of stomatal conductance from sap flux measurements, TreePhysiol., 20(9), 579–589.
Ewers, B. E., R. Oren, T. J. Albaugh, and P. M. Dougherty (1999), Carry-over effects of water and nutrient supply on water use of Pinus taeda,Ecol. Appl., 9(2), 513–525.
Ewers, B. E., R. Oren, K. H. Johnsen, and J. J. Landsberg (2001), Estimat-ing maximum mean canopy stomatal conductance for use in models,Can. J. For. Res., 31(2), 198–207.
Ewers, B. E., D. S. Mackay, S. T. Gower, D. E. Ahl, S. N. Burrows,and S. S. Samanta (2002), Tree species effects on stand transpirationin northern Wisconsin, Water Resour. Res., 38(7), 1103, doi:10.1029/2001WR000830.
G02009 TANG ET AL.: TRANSPIRATION IN AN OLD GROWTH FOREST
11 of 12
G02009

Ewers, B. E., S. T. Gower, B. Bond-Lamberty, and C. K. Wang (2005),Effects of stand age and tree species on canopy transpiration and averagestomatal conductance of boreal forests, Plant Cell Environ., 28(5), 660–678.
Ewers, B. E., D. S. Mackay, J. Tang, P. Bolstad, and S. Samanta (2006),Intercomparison of sugar maple (Acer sacchrum Marsh.) stand transpira-tion responses to environmental conditions from the western Great Lakesregion of the United States, Agric. For. Meteorol., in press.
Farquhar, G. D., T. N. Buckley, and J. M. Miller (2002), Optimal stomatalcontrol in relation to leaf area and nitrogen content, Silva Fennica, 36(3),625–637.
Foley, J. A., S. Levis, M. H. Costa, W. Cramer, and D. Pollard (2000),Incorporating dynamic vegetation cover within global climate models,Ecol. Appl., 10(6), 1620–1632.
Franks, P. J. (2004), Stomatal control and hydraulic conductance, withspecial reference to tall trees, Tree Physiol., 24(8), 865–878.
Frelich, L. E., R. R. Calcote, M. B. Davis, and J. Pastor (1993), Patchformation and maintenance in an old-growth hemlock-hardwood forest,Ecology, 74(2), 513–527.
Goulden, M. L., et al. (1998), Sensitivity of boreal forest carbon balance tosoil thaw, Science, 279, 214–217.
Gower, S. T., R. E. McMurtrie, and D. Murty (1996), Aboveground netprimary production decline with stand age: Potential causes, Trends Ecol.Evol., 11(9), 378–382.
Granier, A. (1987), Evaluation of transpiration in a Douglas-fir stand bymeans of sap flow measurements, Tree Physiol., 3, 309–320.
Granier, A., and D. Loustau (1994), Measuring and modeling the transpira-tion of a maritime pine canopy from sap-flow data, Agric. For. Meteorol.,71(1–2), 61–81.
Hari, P., A. Makela, E. Korpilahti, and M. Holmberg (1986), Optimalcontrol of gas exchange, Tree Physiol., 2, 169–175.
Harmon, M. E., K. Bible, M. G. Ryan, D. C. Shaw, H. Chen, J. Klopatek,and X. Li (2004), Production, respiration, and overall carbon balance inan old-growth Pseudotsuga-tsuga forest ecosystem, Ecosystems, 7(5),498–512.
Irvine, J., B. E. Law, M. R. Kurpius, P. M. Anthoni, D. Moore, and P. A.Schwarz (2004), Age-related changes in ecosystem structure and functionand effects on water and carbon exchange in ponderosa pine, Tree Phy-siol., 24(7), 753–763.
Jarvis, P. G. (1976), Interpretation of variations in leaf water potential andstomatal conductance found in canopies in the field, Philos. Trans. R.Soc. London, Ser. B, 273(927), 593–610.
Jones, H. G. (1992), Plants and Microclimate: A Quantitative Approach toEnvironmental Plant Physiology, 428 pp., Cambridge Univ. Press, NewYork.
Katul, G., R. Leuning, and R. Oren (2003), Relationship between planthydraulic and biochemical properties derived from a steady-state coupledwater and carbon transport model, Plant Cell Environ., 26(3), 339–350.
Kira, T., and T. Shidei (1967), Primary production and turnover of organicmatter in different forest ecosystems of the western pacific, Jpn. J. Ecol.,17, 70–87.
Kostner, B. M. M., E. D. Schulze, F. M. Kelliher, D. Y. Hollinger, J. N.Byers, J. E. Hunt, T. M. Mcseveny, R. Meserth, and P. L. Weir (1992),Transpiration and canopy conductance in a pristine broad-leaved forest ofNothofagus—An analysis of xylem sap flow and eddy-correlation mea-surements, Oecologia, 91(3), 350–359.
Kostner, B., E. Falge, and J. D. Tenhunen (2002), Age-related effects onleaf area/sapwood area relationships, canopy transpiration and carbongain of Norway spruce stands (Picea abies) in the Fichtelgebirge, Ger-many, Tree Physiol., 22(8), 567–574.
Lange, O. L., R. Losch, E. D. Schulze, and L. Kappen (1971), Responses ofstomata to changes in humidity, Planta, 100(1), 76–86.
Lindroth, A., and E. Cienciala (1996), Water use efficiency of short-rotationSalix viminalis at leaf, tree and stand scales, Tree Physiol., 16(1–2),257–262.
Lundblad, M., F. Lagergren, and A. Lindroth (2001), Evaluation of heatbalance and heat dissipation methods for sapflow measurements in pineand spruce, Ann. For. Sci., 58(6), 625–638.
MacKay, D. S., D. E. Ahl, B. E. Ewers, S. T. Gower, S. N. Burrows,S. Samanta, and K. J. Davis (2002), Effects of aggregated classificationsof forest composition on estimates of evapotranspiration in a northernWisconsin forest, Global Change Biol., 8(12), 1253–1265.
Monteith, J. L. (1986), How do crops manipulate water supply and de-mand?, Philos. Trans. R. Soc. London, Ser. A, 316(1537), 245–259.
Monteith, J. L., and M. H. Unsworth (1990), Principles of EnvironmentalPhysics, 291 pp., Edward Arnold, London.
Moren, A. S., A. Lindroth, and A. Grelle (2001), Water-use efficiency as ameans of modelling net assimilation in boreal forests, Trees Struct.Funct., 15(2), 67–74.
Mott, K. A., and D. F. Parkhurst (1991), Stomatal responses to humidity inair and helox, Plant Cell Environ., 14, 509–515.
Odum, E. P. (1969), The strategy of ecosystem development, Science, 164,262–270.
Oren, R., N. Phillips, G. Katul, B. E. Ewers, and D. E. Pataki (1998),Scaling xylem sap flux and soil water balance and calculating variance:A method for partitioning water flux in forests, Ann. Sci. For., 55(1–2),191–216.
Oren, R., J. S. Sperry, G. G. Katul, D. E. Pataki, B. E. Ewers, N. Phillips,and K. V. R. Schafer (1999), Survey and synthesis of intra- and inter-specific variation in stomatal sensitivity to vapour pressure deficit, PlantCell Environ., 22(12), 1515–1526.
Oren, R., J. S. Sperry, B. E. Ewers, D. E. Pataki, N. Phillips, and J. P.Megonigal (2001), Sensitivity of mean canopy stomatal conductance tovapor pressure deficit in a flooded Taxodium distichum L. forest: Hy-draulic and non-hydraulic effects, Oecologia, 126(1), 21–29.
Pastor, J., and M. Broschart (1990), The spatial pattern of a northern hard-wood-conifer landscape, Landscape Ecol., 4(1), 55–68.
Pausch, R. C., E. E. Grote, and T. E. Dawson (2000), Estimating water useby sugar maple trees: Considerations when using heat-pulse methods intrees with deep functional sapwood, Tree Physiol., 20(4), 217–227.
Phillips, N., and R. Oren (1998), A comparison of daily representations ofcanopy conductance based on two conditional time-averaging methodsand the dependence of daily conductance on environmental factors, Ann.Sci. Forest., 55(1–2), 217–235.
Phillips, N., A. Nagchaudhuri, R. Oren, and G. Katul (1997), Time constantfor water transport in loblolly pine trees estimated from time series ofevaporative demand and stem sapflow, Trees Struct. Funct., 11(7), 412–419.
Phillips, N., B. J. Bond, N. G. McDowell, and M. G. Ryan (2002), Canopyand hydraulic conductance in young, mature and old Douglas-fir trees,Tree Physiol., 22(2–3), 205–211.
Ryan, M. G., D. Binkley, J. H. Fownes, C. P. Giardina, and R. S. Senock(2004), An experimental test of the causes of forest growth decline withstand age, Ecol. Monogr., 74(3), 393–414.
Saleska, S. R., et al. (2003), Carbon in Amazon forests: Unexpectedseasonal fluxes and disturbance-induced losses, Science, 302, 1554–1557.
Schafer, K. V. R., R. Oren, and J. D. Tenhunen (2000), The effect of treeheight on crown level stomatal conductance, Plant Cell Environ., 23(4),365–375.
Schafer, K. V. R., R. Oren, C.-T. Lai, and G. G. Katul (2002), Hydrologicbalance in an intact temperate forest ecosystem under ambient and ele-vated atmospheric CO2 concentration, Global Change Biol., 8(9), 895–911.
Sellers, P. J., et al. (1997), Modeling the exchanges of energy, water, andcarbon between continents and the atmosphere, Science, 275, 502–509.
Tang, J., P. V. Bolstad, A. R. Desai, J. G. Martin, B. D. Cook, K. J. Davis,and E. V. Carey (2006), Ecosystem respiration and its components in anold-growth forest in the Great Lakes region of the United States, Agric.For. Meteorol., in press.
Tanner, C. B., and T. R. Sinclair (1983), Efficient water use in crop produc-tion: Research or re-search?, in Limitations to Efficient Water Use in CropProduction, edited by H. M. Tabberer, W. R. Jordan, and T. R. Sinclair,pp. 1–27, Am. Soc. of Agron., Madison, Wis.
Unsworth, M. H., N. Phillips, T. Link, B. J. Bond, M. Falk, M. E. Harmon,T. M. Hinckley, D. Marks, and K. T. Paw U (2004), Components andcontrols of water flux in an old-growth Douglas-fir-western hemlockecosystem, Ecosystems, 7(5), 468–481.
�����������������������P. V. Bolstad, E. V. Carey, and J. Tang, Department of Forest Resources,
University of Minnesota, 1530 North Cleveland Avenue, Saint Paul, MN55108, USA. ([email protected])K. J. Davis and A. R. Desai, Department of Meteorology, Pennsylvania
State University, 503 Walker Building, University Park, PA 16802, USA.B. E. Ewers, Department of Botany, University of Wyoming, 1000 E.
University Avenue, Laramie, WY 82071, USA.
G02009 TANG ET AL.: TRANSPIRATION IN AN OLD GROWTH FOREST
12 of 12
G02009