santa monica college presentation of the 2015-2016 tentative budget report
TRANSCRIPT

S A N TA M O N I C A C O L L E G E
P R ES EN TAT I ON OF THE 2015 - 2016TEN TAT I V E BUD G ET R EP ORT

T E N TAT I V E I S … . . T E N TAT I V E ! ! !
• Still waiting for P2
• Year end closing
• May Revise - Macro view
• Governor vs. Legislature
• CAUTION: For these reasons projections may significantly differ from final allocation

OV E RV I E W
• Governor’s Proposed Budget
• Tentative Budget

2015-2016Governor’s May Revise
WARNING: RESULTS MAY VARY
G OV E R N O R ’ S M AY R E V I S E
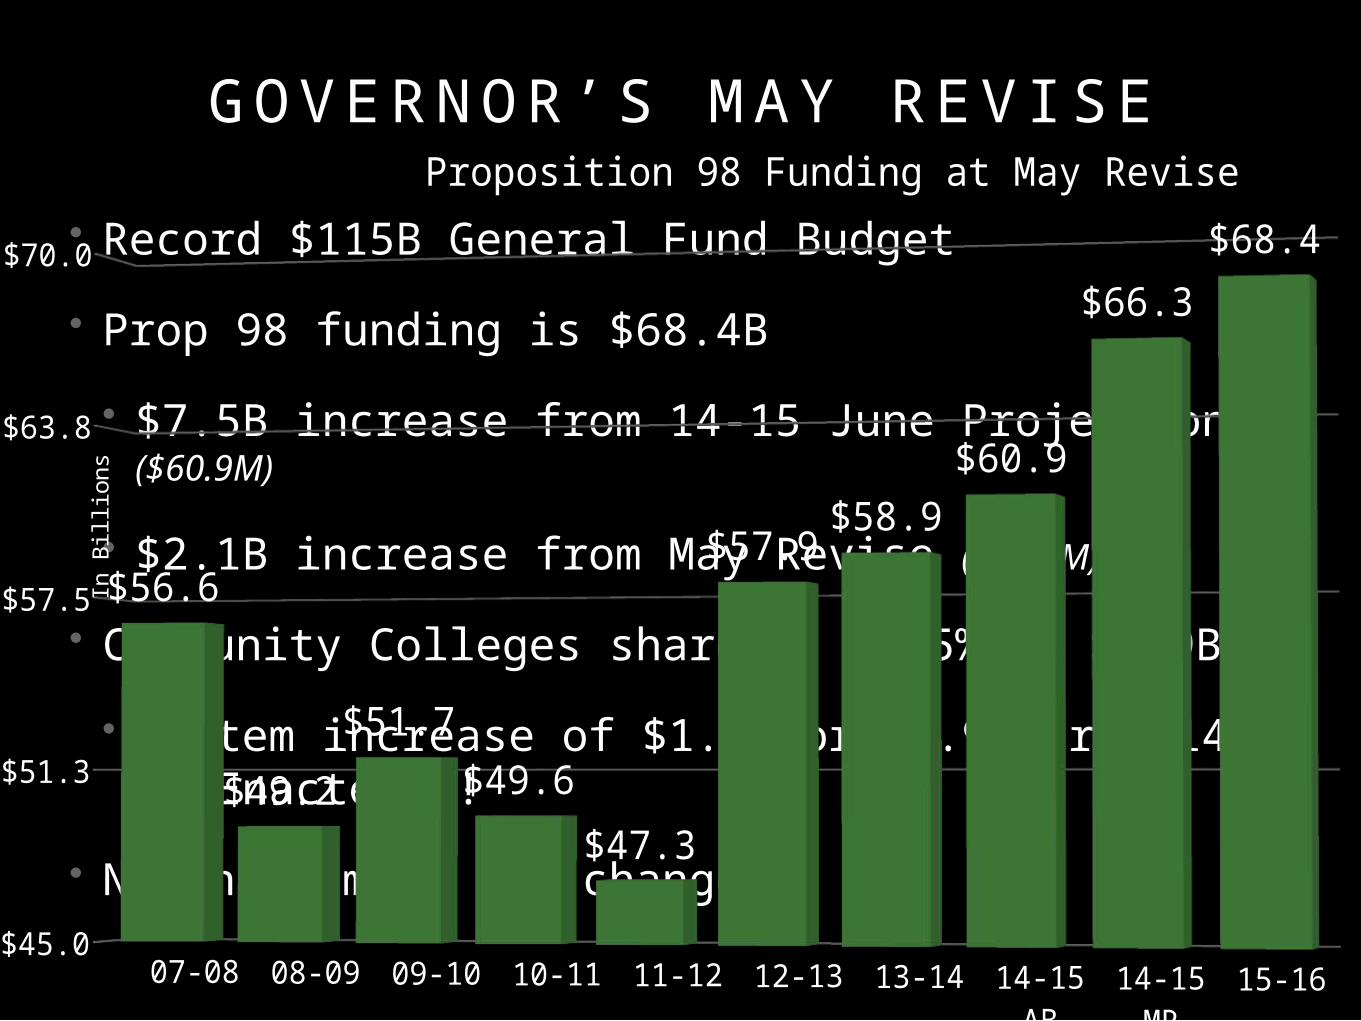
• Record $115B General Fund Budget
• Prop 98 funding is $68.4B
• $7.5B increase from 14-15 June Projection ($60.9M)
• $2.1B increase from May Revise ($66.3M)
• Community Colleges share is 11.5% or $7.9B
• System increase of $1.3B or 19.9% From 14-15 Enacted!!!
• No enrollment fee change
07-08 08-09 09-10 10-11 11-12 12-13 13-14 14-15 AB
14-15 MR
15-16$45.0
$51.3
$57.5
$63.8
$70.0
$56.6
$49.2
$51.7
$49.6
$47.3
$57.9$58.9
$60.9
$66.3
$68.4
Proposition 98 Funding at May Revise
In B
illio
ns
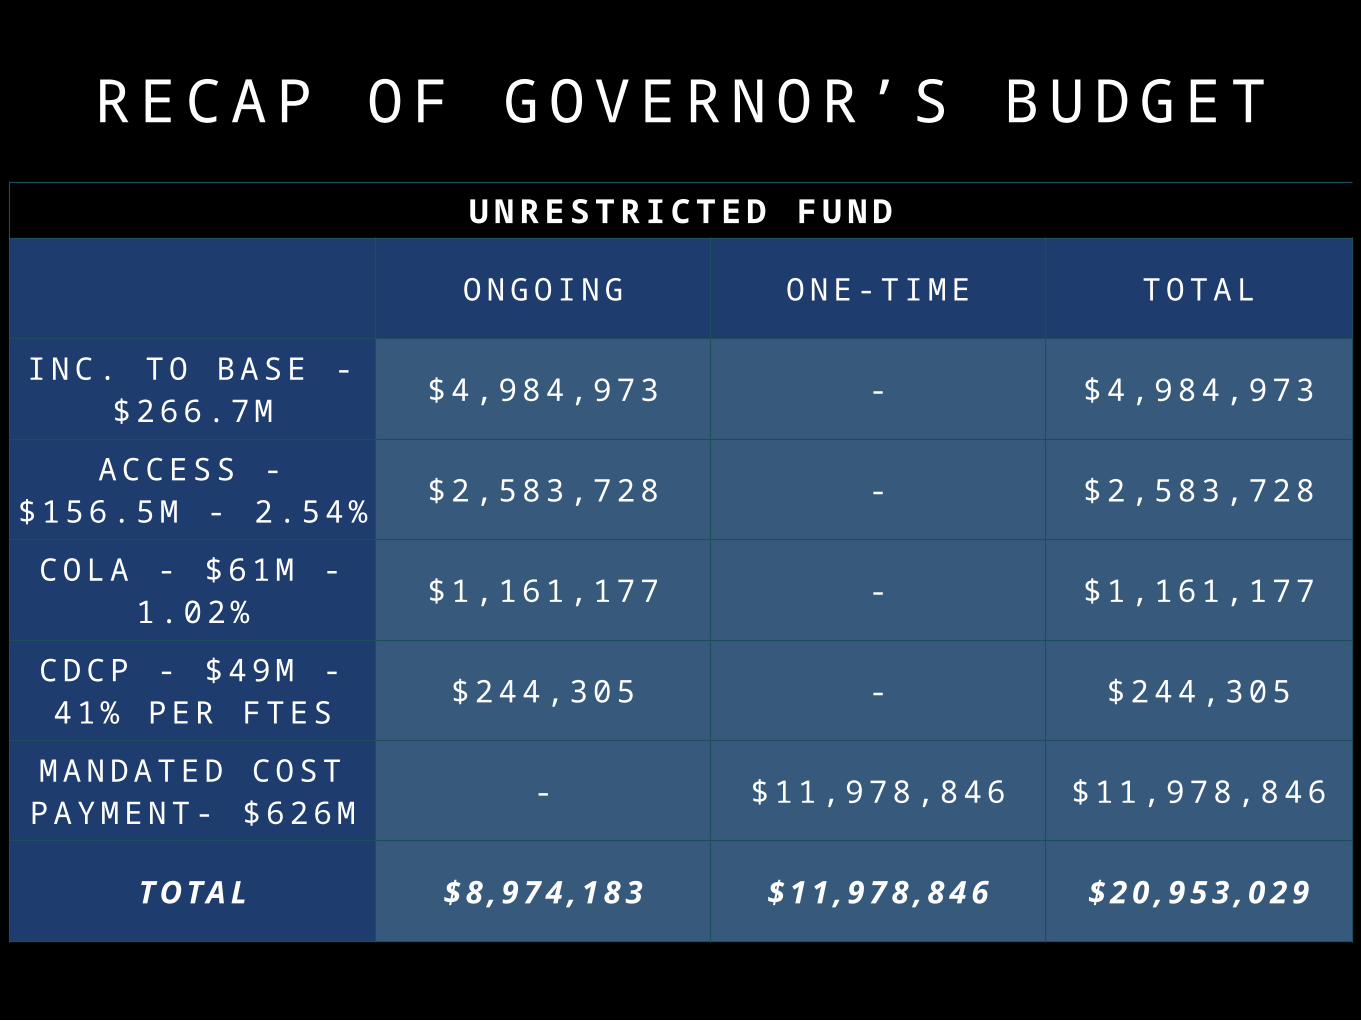
R E C A P O F G OV E R N O R ’ S BU D G E T
UNRESTRICTED FUND
ON G OI N G ON E -T I ME T OTAL
I N C . T O B AS E - $ 2 6 6 . 7 M $ 4 , 9 8 4 , 9 73 - $ 4 , 9 8 4 , 9 73
AC C E S S - $ 1 5 6 . 5 M - 2 . 5 4 % $ 2 , 5 8 3 , 7 28 - $ 2 , 5 8 3 , 7 28
C OL A - $ 6 1 M - 1 . 0 2 % $ 1 , 1 6 1 , 1 77 - $ 1 , 1 6 1 , 1 77
C DCP - $ 4 9 M - 4 1 % P E R FT E S $ 2 4 4 , 3 0 5 - $ 2 4 4 , 3 0 5
MAN DAT E D C OS T PAY ME N T- $ 6 2 6 M - $ 1 1 , 9 7 8 , 84 6 $ 1 1 , 9 7 8 , 84 6
TOTAL $8,974 ,183 $11 ,978 ,846 $20 ,953 ,029

R E C A P O F G OV E R N O R ’ S BU D G E T
RESTRICTED FUND
ON G OI N G ON E -T I ME T OTAL
S S S P - $ 10 0 M $ 1 , 6 7 6 , 4 14 - $ 1 , 6 7 6 , 4 14
E QU I T Y - $ 1 1 5 M $ 1 , 8 1 6 , 3 90 - $ 1 , 8 1 6 , 3 90
C OL A - E OP S / DS P S / C ALW
ORK S$ 3 6 , 2 2 5 - $ 3 6 , 2 2 5
I N S T. BG / S C H E D . MA I N T EN AN C E - $ 2 , 8 4 0 , 2 25 $ 2 , 8 4 0 , 2 25
P ROP 3 9 - $ 3 9 . 6 M - $ 7 3 9 , 1 7 0 $ 7 3 9 , 1 7 0
TOTAL $3,529 ,029 $3,579 ,395 $7,108 ,424

R E C A P O F G OV E R N O R ’ S BU D G E T
UNRESTRICTED AND RESTRICTED FUND
ON G OI N G ON E -T I ME T OTAL
U N RE S TR I C T E D ( 0 1 . 0 ) $ 8 , 9 7 4 , 1 83 $ 1 1 , 9 7 8 , 84 6 $ 2 0 , 9 5 3 , 02 9
RES T R I C TE D ( 0 1 . 3 ) $ 3 , 5 2 9 , 0 29 $ 3 , 5 7 9 , 3 95 $ 7 , 1 0 8 , 4 24
TOTAL $12 ,503 ,212 $15 ,558 ,241 $28 ,061 ,453

P R OP O S A L S N O T I N C LU D E D
• Unrestricted
• $75M for full-time faculty
• $50M Awards for Innovation
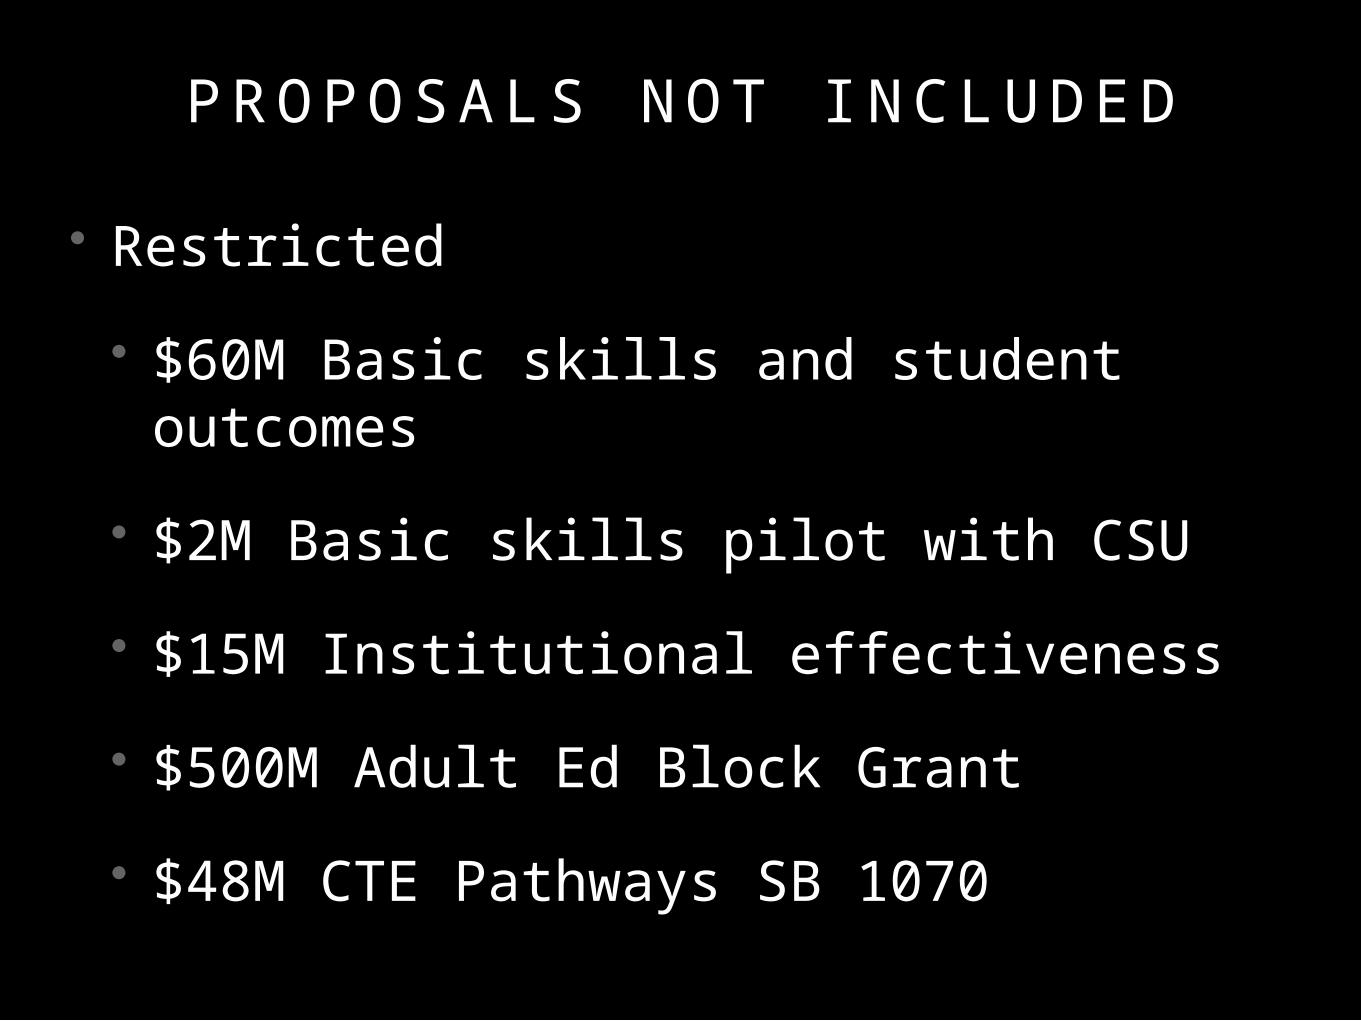
P R OP O S A L S N O T I N C LU D E D
• Restricted
• $60M Basic skills and student outcomes
• $2M Basic skills pilot with CSU
• $15M Institutional effectiveness
• $500M Adult Ed Block Grant
• $48M CTE Pathways SB 1070

2015-2016 Tentative Budget

Changes in Revenue

P R O J E C T E D C H A N G E S I N R E V E N U E 1 4 - 1 5 T O T E N TAT I V E P R O J E C T I O N S
2014-2015 Revenue Projection: 149,698,927Mandated Costs - Past Claims 10,433,856Apportionment - Base Change/CDCP 5,229,179Growth 2,583,728Non-resident Tuition 1,538,566Inflationary Adjustment 1,161,177Deficit Factor net PY Adjustment 187,824Lottery 77,165Medicare Part D Subsidy -231,648Other 39,122
2015-2016 Tentative Revenue Projection: 170,717,896
$21,250,617
$-231,648
$21,018,969 or 14%

F I V E Y E A R R E V E N U E T R E N D
2011-2012 2012-2013 2013-2014 2014-2015 2015-2016$125,000,000
$138,750,000
$152,500,000
$166,250,000
$180,000,000Revenue

Changes in Expenditures

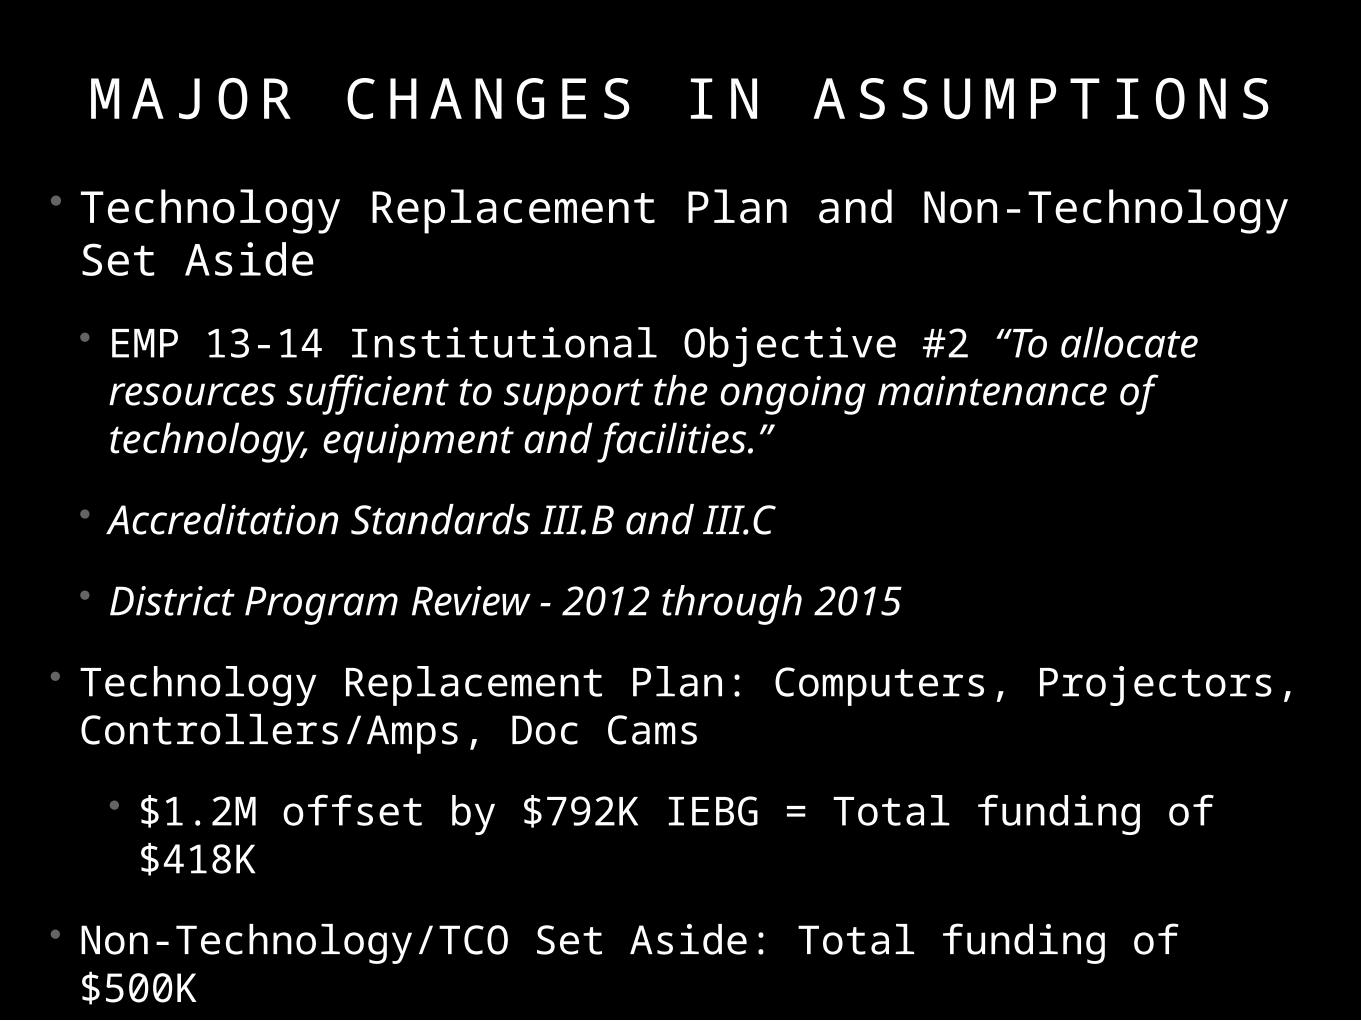
M AJ OR C H ANG ES I N ASSU MPT I ONS
• Vacancy List
• Past Practice: Fund 50% of the entire list (Would equate to $3.1M in 15-16)
• New Practice: Fund $2.5M in salaries and related benefits. Discount at 66%. (Equates to $1.2M)
• Exception for 2015-2016 is President/Superintendent
M AJ OR C H ANG ES I N ASSU MPT I ONS
• Technology Replacement Plan and Non-Technology Set Aside
• EMP 13-14 Institutional Objective #2 “To allocate resources sufficient to support the ongoing maintenance of technology, equipment and facilities.”
• Accreditation Standards III.B and III.C
• District Program Review - 2012 through 2015
• Technology Replacement Plan: Computers, Projectors, Controllers/Amps, Doc Cams
• $1.2M offset by $792K IEBG = Total funding of $418K
• Non-Technology/TCO Set Aside: Total funding of $500K

P R O J E C T E D C H A N G E S I N E X P E N D I T U R E S 2 0 1 4 - 2 0 1 5 T O T E N TAT I V E P R O J E C T I O N S
2014-2015 Expenditure Projection: 153,834,272
Salary Increase and Related Benefits 2,588,479
Non-Health and Welfare Benefits 1,202,422
Equip., Technology and TCO Replacement Plan 1,012,375
Step, Column and Longevity 982,162
Vacancy List 742,285
Health and Welfare Incl. Retiree 607,051
OPEB Contribution 500,000
Utilities and Insurance 170,844
Supplies and Other Operating 75,371
Decrease in Hourly -654,278
Net Effect of Hiring and Separation -660,628
Others -42,614
2015-2016 Tentative Exp. Projection: 160,357,741$6,523,469 or 4.2%
$7,880,989
$-1,357,520

F I V E Y E A R E X P E N D I T U R E T R E N D
2011-2012 2012-2013 2013-2014 2014-2015 2015-2016$127,500,000
$135,000,000
$142,500,000
$150,000,000
$157,500,000
$165,000,000 Expenditures

Changes in Fund Balance
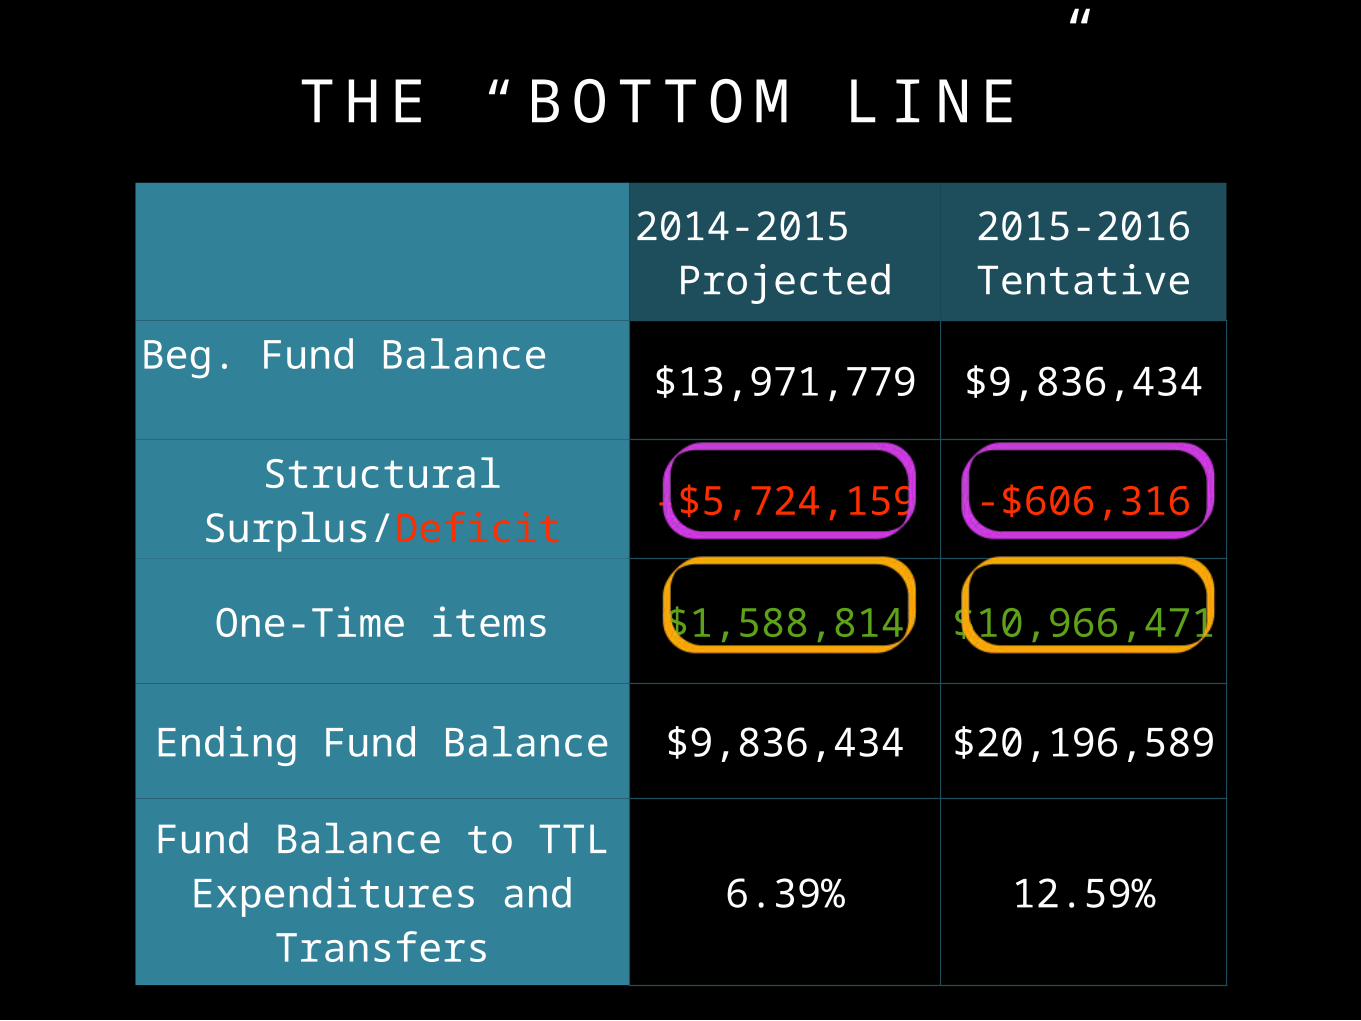
T H E “BOTT OM L I N E ”
2014-2015 Projected
2015-2016 Tentative
Beg. Fund Balance$13,971,779 $9,836,434
Structural Surplus/Deficit
-$5,724,159 -$606,316
One-Time items $1,588,814 $10,966,471
Ending Fund Balance $9,836,434 $20,196,589
Fund Balance to TTL Expenditures and
Transfers6.39% 12.59%

F I V E Y E A R R E V E N U E T R E N D
2011-2012 2012-2013 2013-2014 2014-2015 2015-2016$135,000,000
$146,250,000
$157,500,000
$168,750,000
$180,000,000
Revenue Expenditures

O TH E R I S S UE S M OV ING FO RWAR D
• PERS and STRS increases
• Built in increases: Step and column, benefits, OPEB, utilities
• FTES: Cautious optimism
• Tentative FTES Target: 21,507 Credit (approx. 534 Growth)
13 -1 4 14 -1 5 15 -1 6 16 -1 7 17 -1 8 18 -1 9 19 -2 0 20 -2 1
S T RS 8 . 2 5 % 8 . 8 8 % 1 0 . 7 3 % 1 2 . 5 8 % 1 4 . 4 3 % 1 6 . 2 8 % 1 8 . 1 3 % 1 9 . 1 %
P ERS 1 1 . 4 4 2 % 1 1 . 7 7 % 1 1 . 8 4 % 1 4 . 2 4 % 1 5 . 8 4 % 1 7 . 4 4 % 1 9 . 1 4 % 1 9 . 6 4 %
• Structural Surplus/Deficit

Thank You!!!
The Accounting Team with Special Thanks To Veronica Diaz and Jo Lau
Jocelyn Chong and Al DeSalles
Charlie Yen, Greg Brown and the Facilities Team
Budget Committee