santa monica college employee diversity report€¦ · · 2011-06-08santa monica college ....
TRANSCRIPT

1
Presented by:Marcia M. Wade
Vice President, Human Resourcesand
Patricia BrownDean, Human Resources
October 06, 2009
Santa Monica College Employee Diversity Report

2
Page
Executive Summary 4
Frequently Asked Questions 20
Appendices 27
Appendix A: Data Collection 28Applicant EEO Survey 29Student Demographic Survey 30
Appendix B: County of Los Angeles Diversity 31Hispanic v. Non-Hispanic 2006-2008 32County Diversity (Bar Graph) 2006-2008 33
Appendix C: Diversity Statistics Within Employee & Student Groups 34SMC Student Snapshot – 2008 35SMC Student Population – 2006-2008 36SMC Employee Diversity (Bar Graph) 2006-2008 37Academic Administrators 38Classified Managers 39Classified Support 40Full-Time Faculty 41Part-Time Faculty 42
Appendix D: Applicant Pools 43SMC Academic Applicants Diversity 2006-2008 44SMC Classified Applicants Diversity 2006-2008 45Academic Applicants Gender 2006-2008 46Classified Applicants Gender 2006-2008 47
TABLE OF CONTENTS

3
Appendix E: Employee and Student Gender Data 2006-2008 48Student Gender 2006-2008 49Employee Gender Overall Composite 2006-2008 50Academic Administrators 2006-2008 51Classified Managers 29006-2008 52Classified Support 53Full-Time Faculty 2006-2008 54Part-Time Faculty 2006-2008 55
Appendix F: New Hires Diversity 56Snapshot: New Hires 2006-2008 57
Appendix G: Faculty Diversity by Department 58Full-Time Faculty Diversity by Department 2006-2008 59-62Part-Time Faculty Diversity by Department 2006-2008 63-65
Appendix H: Employee Age Distribution 66Academic Administrators Age Range Fall 2009 67Classified Managers Age Range Fall 2009 68Classified Support Age Range Fall 2009 69Full-Time Faculty Age Range Fall 2009 70Part-Time Faculty Age Range Fall 2009 71
Appendix I: Diversity Initiatives 72-74
TABLE OF CONTENTS, continued
Appendices, continued Page

4
EXECUTIVE SUMMARY

5
EXECUTIVE SUMMARY
Santa Monica College (SMC) is within one of the most racially and ethnically diverse counties within the United States. The diversity of Los Angeles County is enhanced by its location in the State of California, the comfortable climate, the stunning geography, and most importantly the easy access to a multitude of options and opportunities for the people who live here. Santa Monica College’s reputation as a premier two-year institution of higher education continues to reinforce its popularity and respected status with educators, students and the communities which this college serves.
This report will provide a snapshot of faculty, staff and student diversity within Santa Monica College and a platform from which strategies for employment outreach will be devised in this post Proposition 209 environment.
Information provided for the college spans a three-year period from July 2006 through June 2009, and was collected with the assistance of staff from the Offices of Institutional Research and Information Management. Los Angeles County data was collected from the 2008 U.S. Census Bureau Data Report and the California Department of Finance.
Record Student Enrollment The outstanding reputation of this institution is one of many reasons why postsecondary students are
coming in droves to SMC from public, private and charter schools. It is also understood that with tumultuous economic times and high unemployment, people return to school. Progressively increasing enrollment is evident in the comparison data for years 2006, 2007 and 2008 contained in this report. Though not included in the report, fall semester 2009 enrollment data through September 28, 2009 indicates a headcount of 35,307 students. 9,365 are full-time equivalent credit students (FTES) enrolled with 12 or more units.

6
Data is collected by applicants’ and employees’ optional identification of race and ethnicity. Traditionalsurveys requested people to identify race as being American Indian/Alaska Native, Asian, Black,Hispanic, or White. The updated EEO surveys remain optional but now respondents are specificallyasked to identify race and ethnicity. They must first identify whether or not they are Hispanic/Latinoor Spanish Origin and if their race is American Indian or Alaskan Native, Asian, Black or AfricanAmerican, or Native Hawaiian or Other Pacific Islander. Respondents may further identify if thereare two or more races within their lineage.
EXECUTIVE SUMMARY, continued
Data Collection and New Reporting GuidelinesIn response to criticism about racial and ethnic standards not adequately reflecting the diversity of the
nation’s current population, the U. S. Office of Management and Budget (OMB) initiated acomprehensive review in 1993. Recommendations from this review were implemented in 1997 bythe federal government through the OMB’s “Revisions to the Standards for the Classification ofFederal Data on Race and Ethnicity.” In 2007, the U.S. Department of Education posted theguidelines to implement OMB’s 1997 standards and California Community Colleges are collectingdata in accord with these standards through the Equal Employment Opportunity Survey Form, adocument that is a primary source for applicants and employees to identify their race and ethnicity.This form was revised to comply with updates to Title 5.

7
EXECUTIVE SUMMARY, continued
Diversity StatisticsData is presented on a fiscal year basis: 2006-2007 (2006), 2007-2008 (2007) and 2008-2009 (2008).
When reviewing the data, totals are shown on the right side of the page. Corresponding group numbers are presented with percentages in each category. Data is presented initially by race and ethnicity and subsequently by gender.
To better understand employee changes since June 2009, current employee information for Fall Semester 2009 is shown below. Unless specified, the following statistics for each group are representative of 2008- 2009 data.
Current SMC Employees - Fall Semester 2009Academic Administrators: 48 Classified Managers: 39Classified Support: 473Full-Time Faculty: 310Part-Time Faculty: 1,008

8
Students
Student information is included for comparison purposes with the District workforce.
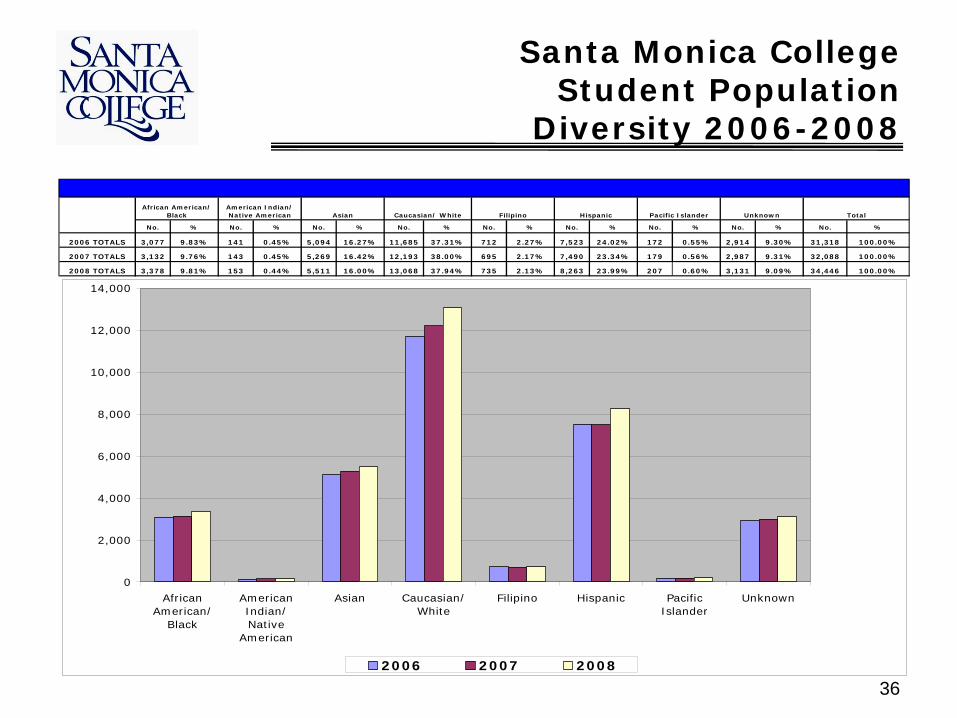
Student race and ethnicity population data remained relatively consistent from 2006 through 2008.
Student diversity figures for 2008-2009 were:
9.81% (3,378) were African American/Black 0.44% (153) were American Indian/Native American 16.0% (5,511) were Asian 37.94% (13,068) were Caucasian/White 2.13% (735) were Filipino 23.99% (8,263 ) were Hispanic0.60% (207) were Pacific Islander 9.09% (3,131) were Unknown
Female students clearly outnumbered male students in 2006, 2007 and 2008. In 2008, femalesoutnumbered males, 57.76% (15,897) to 42.21% (14,540).
EXECUTIVE SUMMARY, continued

9
EXECUTIVE SUMMARY, continued
Academic AdministratorsThere were 55 Academic Administrators:
69.09% (38) were Female30.91% (17) were Male
20.0% (11) were African American/Black9.09% (5) were Asian36.36% (20) were Caucasian/White3.64% (2) were Filipino10.91% (6) were Hispanic1.82% (1) were Pacific Islander18.18% (10) were Unknown
A point of interest when reviewing the stats is that Academic Administrators include Project Managers. Project Managers are one year temporary employees.
There were 11 Project Managers: 45% (5) were African American/Black27% (3) were Caucasian/White27% (3) were Hispanic/Latino
91% (10) were Female9% (1) was Male

10
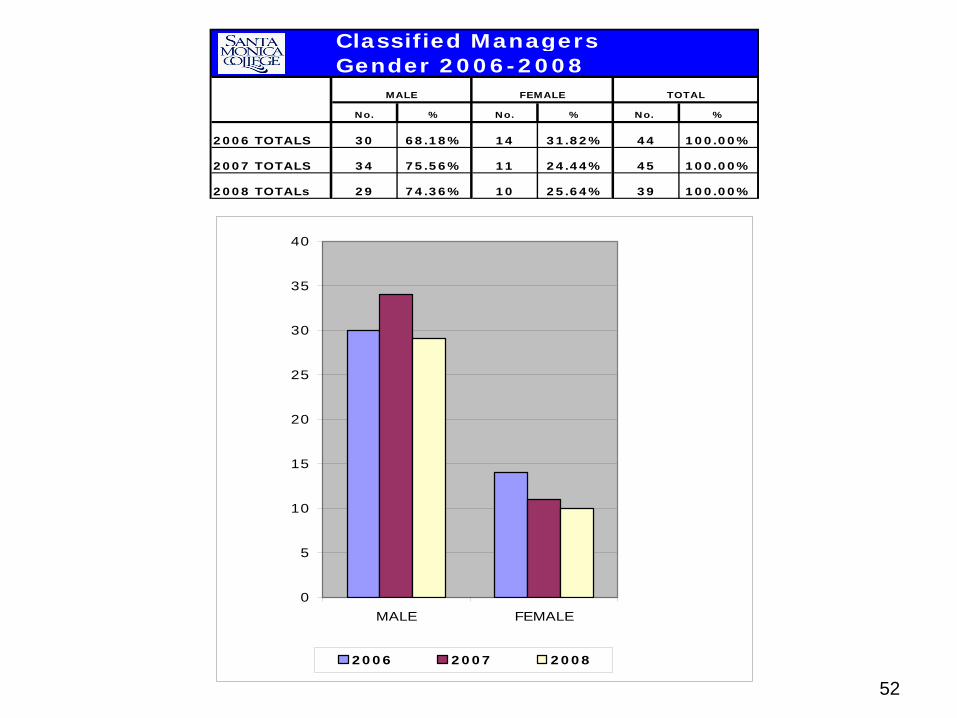
Classified ManagersThere were 39 Classified Managers:
25.64% (10) were Female 74.36% (29) were Male
17.95% (7) were African American/Black 2.56% (1) was American Indian/Native American 7.69% (3) were Asian 66.67% (26) were Caucasian/White 5.13% (2) were Hispanic
This category is dominated by Caucasian men and is less racially and ethnically diverse compared to college employees overall.
EXECUTIVE SUMMARY, continued

11
Classified SupportThere were 473 Classified Support personnel:
53.48% (246) were Female 46.52% (227) were Male
25.76% (122) were African American/Black 0.21% (1) was American Indian/Native American 6.77% (32) were Asian 36.79% (174) were Caucasian/White 2.33% (11) were Filipino23.47% (111) were Hispanic4.65% (22) were Unknown
African Americans and Latinos are more evenly represented in classified support positions than Asians and Native Americans.
EXECUTIVE SUMMARY, continued

12
EXECUTIVE SUMMARY, continued
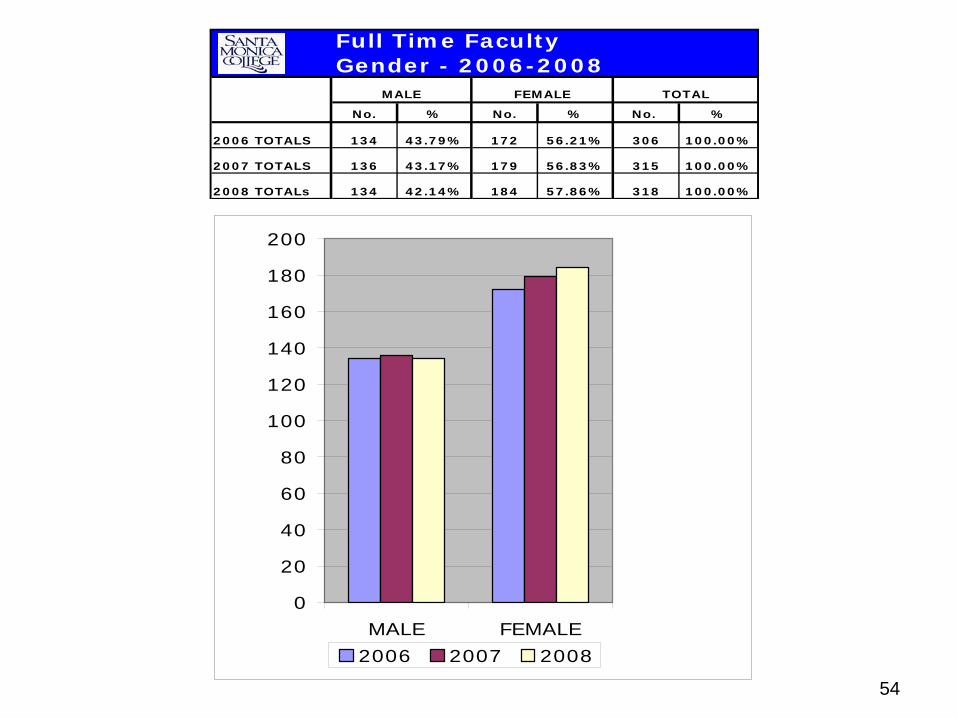
Full-Time FacultyThere were 318 full-time faculty members:
57.86% (184) were Female 42.14% (134) were Male
11.95% (38) were African American/Black7.86% (25) were Asian63.21% (201) were Caucasian/White0.94% (3) were Filipino11.64% (37) were Hispanic4.40% (14) were Unknown
Minority populations are under-represented within SMC’s full-time faculty. Please refer to the Faculty Diversity Data by Department in Appendix G for more specific survey results.

13
EXECUTIVE SUMMARY, continued
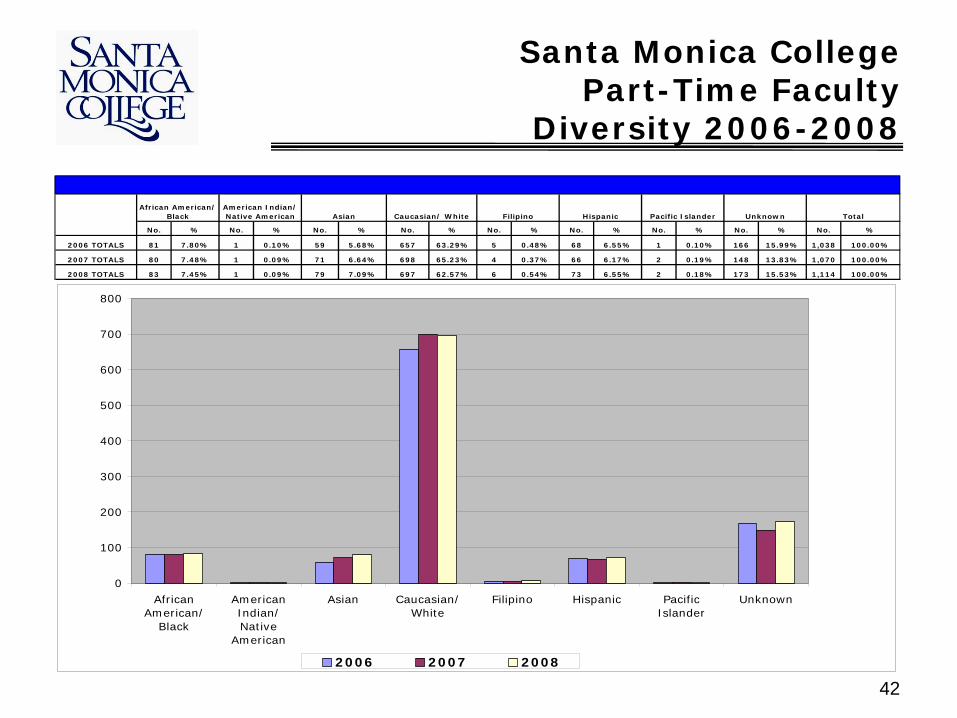
Part-Time FacultyThere were 1,114 part-time faculty members:
53.5% (596) were Female 46.5% (518) were Male
7.45% (83) were African American/Black 0.09% (1) was American Indian/Native American 7.09% (79) were Asian 62.57% (697) were Caucasian/White0.54% (6) were Filipino 6.55% (73) were Hispanic0.18% (2) were Pacific Islander15.53% (173) were Unknown
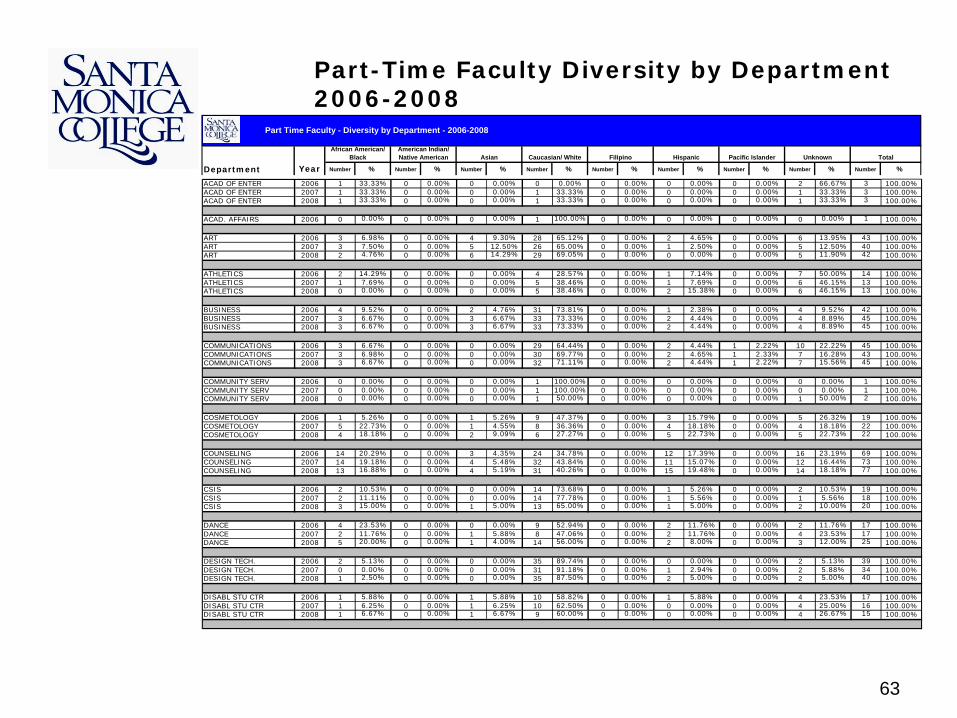
Minority populations are under-represented within SMC’s part-time faculty. Please refer to the Faculty Diversity Data by Department in Appendix G for survey results.

14
Age Data
Information has been reviewed by Human Resources to determine the age of employees by employment category. The results reinforce the need to effectively implement succession planning strategies.
60+ years of age
30% (95) of full-time faculty members25% (257) of part-time faculty members17% (8) of academic administrators16% (6) of classified managers19% (91) of classified support personnel
EXECUTIVE SUMMARY, continued

15
Applicant Pools, New Hire Information and Interpretation of the DataDuring 2008-2009, 1,586 academic applications were received but 62.42% (990) applicants were
“Unknown.” This unknown component skews survey results. However, the data indicates under- representation with racial and ethnic minorities.
An online application process was initiated by the Personnel Commission during this year for classified employment applications that resulted with 9,636 classified applications being processed. Only 10.35% (997) of the applicants did not complete or respond to the optional EEO survey when applying for a job. The increase with classified employment applications in all categories indicated significantly improved recruitment outreach in most groups. There were no responses for Pacific Islanders. Though there were more applicants, the caliber of the applicant pool is not known until a testing and selection process is initiated.
In viewing the data, it is evident that based upon all employment categories except for classified managers; more females apply for positions and are hired by the District.
New Hire DataThere were 179 employees hired during 2008-2009:
10.61% (19) were African American/Black 6.70% (12) were Asian 51.96% (93) were Caucasian/White 10.61% (19) were Hispanics 0.56% (1) was Pacific Islander 19.55% (35) did not identify race and ethnicity
EXECUTIVE SUMMARY, continued

16
EXECUTIVE SUMMARY, continued
Impact of “Unknown” ResponsesA significant percentage of people did not respond, self identify or simply did not complete the Equal
Employment Opportunity Survey Form, thus their race and ethnicity are categorized as “unknown”. Where students or employees were formerly able to check “Decline to State” or “Unknown” on the Equal Employment Opportunity Survey Form, these options are no longer available on the updated form.
The “unknown” designation impacts data and leads to major speculation as to what must be done to encourage more thorough completion of the EEO Survey. It also triggered awareness of the need to improve or expand data collection methods at the college.
The HR Office will implement changes in its intake process of new hires to encourage completion of the optional Equal Employment Opportunity Survey.

17
EXECUTIVE SUMMARY, continued
Employee/Employment Outreach Since 2007, the District Human Resources Office and the Personnel Commission have worked
collectively to improve recruitment, testing and selection processes. The Personnel Commission quickly initiated the move to automate an applicant tracking process. This allowed for a broader and more comprehensive sweep for prospective talent. With the implementation of NEOGOV in February 2008, classified applicants increased 1000%. The caliber of applicants also improved because of strategic outreach efforts and improved testing methods.
The District HR Office will implement PeopleAdmin, an online academic application tracking process, in October or November 2009. It is anticipated that recruitment outreach efforts will be enhanced by having a more efficient and easily accessible path for prospective candidates to apply for academic positions. Prospects will see that SMC is the place to be! It will also provide an opportunity for applicants to virtually peruse SMC.
Both the District HR Office and Personnel Commission will continue EEO training of selection committee members and hiring panels. This training is mandated for all committee members or panelists of each hiring process.

18
EXECUTIVE SUMMARY, continued
SummaryIn conclusion, based on the data that has been gathered, there is work to be done to develop strategies
to broaden and balance racial and ethnic representation among employee categories with each recruitment process. The Human Resources Office and Personnel Commission will do this within the guidelines of applicable laws and policies.
To accomplish this ideal, a conscientious decision to support such efforts must be made and be supported by the SMC Board of Trustees. Hiring employees to achieve a better balance is a quick yet expensive proposition in these challenging economic times. Pressure to rally for specific positions is expected. Each suggested replacement or added position must be scrutinized. If feasible, recruitments should be open processes.
The message that the District wants to promote is that there is commitment to achieving employee diversity at SMC.

19
ACKNOWLEDGEMENTS
The report was compiled from information obtained with the assistance of staff in the Offices of Institutional Research and Information Management.
Special gratitude also to Ms. Laurie Heyman, Administrative Assistant-III Confidential, in Human Resources, for her apt computer skills in producing this report; and to Mr. Micky Kwan and Ms. Darlene Kasch of the Office of Information Management for data collection for this report. Without their assistance, this report would not be possible.

20
FREQUENTLY ASKED QUESTIONS
21
Frequently Asked Questions on Race and Ethnicity Reporting Guidelines
(Source: Information on the New Standards for IPEDS (Integrated Postsecondary Education Data System)
Race and Ethnicity Reporting at www.sheeo.org)
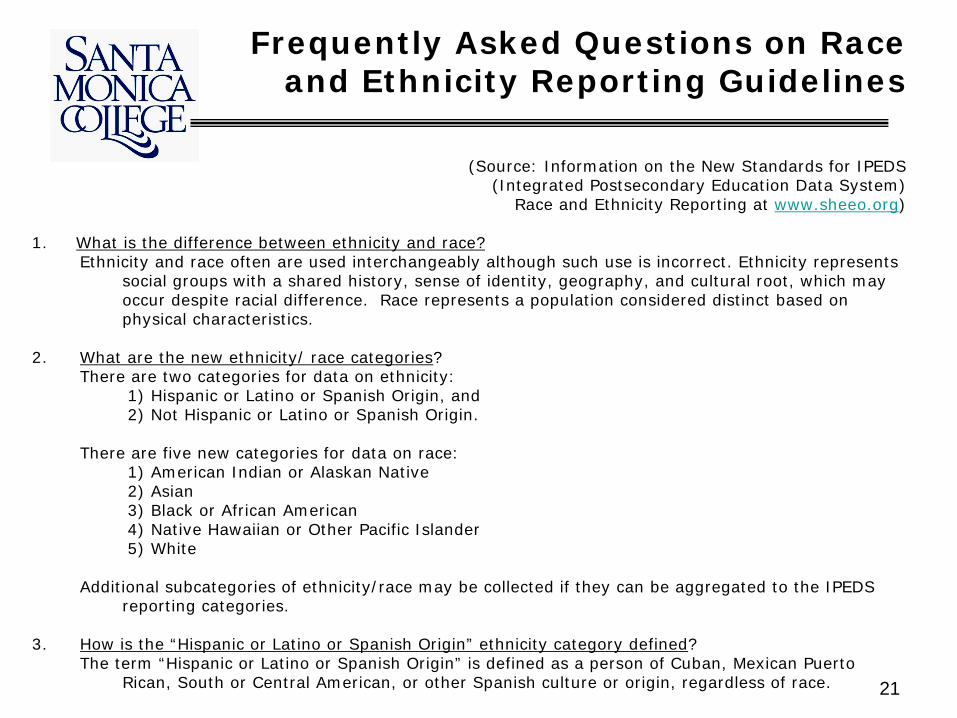
1. What is the difference between ethnicity and race?Ethnicity and race often are used interchangeably although such use is incorrect. Ethnicity represents
social groups with a shared history, sense of identity, geography, and cultural root, which may occur despite racial difference. Race represents a population considered distinct based on physical characteristics.
2. What are the new ethnicity/ race categories?There are two categories for data on ethnicity:
1) Hispanic or Latino or Spanish Origin, and 2) Not Hispanic or Latino or Spanish Origin.
There are five new categories for data on race:1) American Indian or Alaskan Native2) Asian3) Black or African American4) Native Hawaiian or Other Pacific Islander5) White
Additional subcategories of ethnicity/race may be collected if they can be aggregated to the IPEDS reporting categories.
3. How is the “Hispanic or Latino or Spanish Origin” ethnicity category defined?The term “Hispanic or Latino or Spanish Origin” is defined as a person of Cuban, Mexican Puerto
Rican, South or Central American, or other Spanish culture or origin, regardless of race.

22
4. Why were these ethnicity/race changes made?Responding to growing criticism that the 1977 racial and ethnic standards did not reflect the diversity
of the nation’s current population, the Federal Office of Management and Budget (OMB) initiated a comprehensive review in 1993. The review included:
1) organizing a workshop to address the issues by the National Academy of Science, 2) convening four public hearings, and 3) appointing an Interagency Committee for the Review of Racial and Ethnic Standards,
which later developed a research agenda and conducted several research studies.
The result of the Committee’s efforts was a report describing recommended changes with most of those recommendations being accepted by the OMB it its 1997 Standards. The Office ofManagement and Budget (OMB) is requiring the changes as issued in its 1997 “Revisions to theStandards for the Classification of Federal Data on Race and Ethnicity.”
On October 19, 2007, the US Department of Education posted the guidelines to implement OMB’s1997 Standards.
Frequently Asked Questions on Race and Ethnicity Reporting Guidelines, continued

23
5. How should postsecondary institutions collect ethnicity/race information from students and employees?Two questions must be used when collecting ethnicity/race.The first question is whether the respondent is “Hispanic or Latino or Spanish Origin” or “Not Hispanic or Latino or Spanish Origin” (The term “Hispanic or Latino or Spanish Origin” is defined as a person of Cuban, Mexican, Puerto Rican, South or Central American, or other Spanish culture or origin, regardless of race).
The second question is whether the respondent is from one or more races from the following list: American Indian or Alaskan Native, Asian, Black or African American, Native Hawaiian or Other Pacific Islander, White. Postsecondary Institutions cannot use a multi-race category in collection data from respondents.
The question on ethnicity must be asked first.
Frequently Asked Questions on Race and Ethnicity Reporting Guidelines, continued
24
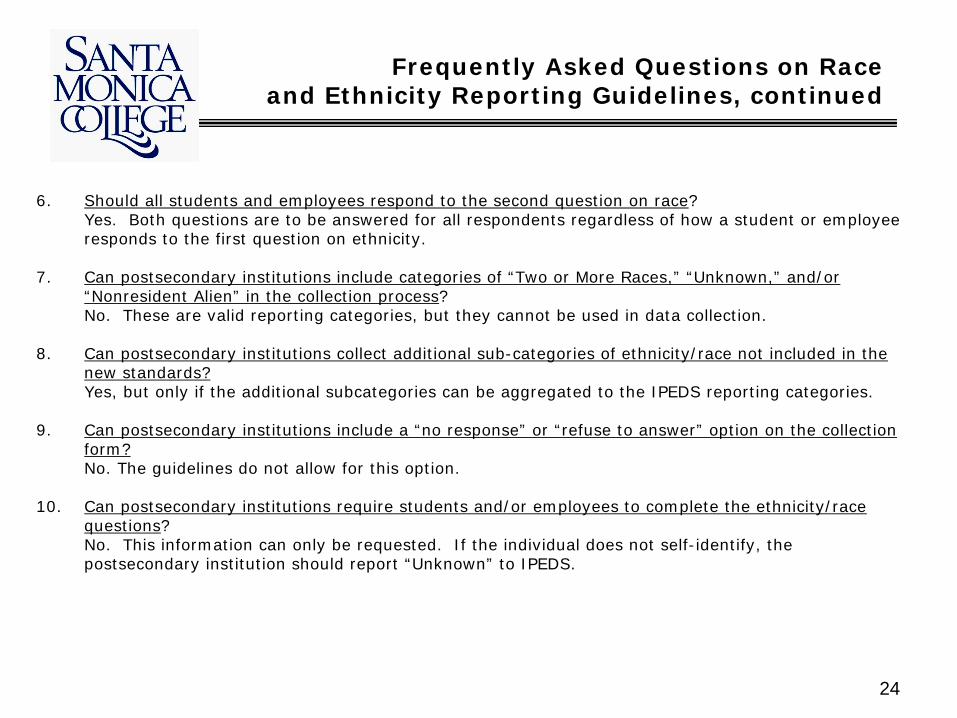
6. Should all students and employees respond to the second question on race?Yes. Both questions are to be answered for all respondents regardless of how a student or employee responds to the first question on ethnicity.
7. Can postsecondary institutions include categories of “Two or More Races,” “Unknown,” and/or “Nonresident Alien” in the collection process?No. These are valid reporting categories, but they cannot be used in data collection.
8. Can postsecondary institutions collect additional sub-categories of ethnicity/race not included in the new standards?Yes, but only if the additional subcategories can be aggregated to the IPEDS reporting categories.
9. Can postsecondary institutions include a “no response” or “refuse to answer” option on the collection form?No. The guidelines do not allow for this option.
10. Can postsecondary institutions require students and/or employees to complete the ethnicity/race questions?No. This information can only be requested. If the individual does not self-identify, the postsecondary institution should report “Unknown” to IPEDS.
Frequently Asked Questions on Race and Ethnicity Reporting Guidelines, continued

25
11. How will postsecondary institutions report data under the new ethnicity/race categories?Postsecondary institution will be required to report aggregated ethnic and racial data in seven categories:
1) Hispanic/Latino/Spanish Origin of any raceFor respondents who are non-Hispanic/Latino/Spanish Origin only.2) American Indian or Alaskan Native,3) Asian4) Black or African American,5) Native Hawaiian or Other Pacific Islander,6) White, and 7) Two or more races.
Plus, 8) Non-Resident Alien (of any ethnicity or race), and 9) Ethnicity/Race Unknown (if the respondent does not self identify).
Frequently Asked Questions on Race and Ethnicity Reporting Guidelines, continued

26
12. How do postsecondary institutions report a respondent who self-identifies in two or more racial categories?A respondent who self-identifies in two or more racial categories must be reported as “Two or more races” only if the respondent does not self identify as Hispanic/Latino/Spanish Origin.If the respondent self-identifies as Hispanic/Latino/Spanish Origin, the postsecondary institution should only report the respondent as Hispanic/Latino/Spanish Origin, and should not report the respondent in any of the five racial categories or the “Two or more races” category.
13. If a respondent self-identifies as “Non-Hispanic or Latino or Spanish Origin” and self-identifies in two or more of the five racial categories, should that respondent be reported to IPEDS as “Two or more races” only?Yes. A respondent who self identifies as “Non-Hispanic or Latino or Spanish Origin” and self-identifies in two or more of the five racial categories must be reported as “Two or more races”only.
14. What are the potential impacts of these changes?The count for each race potentially could drop from prior years as individuals are reclassified as Hispanic/Latino or as “Two or more races”.
15. How will these changes impact trend data?The count for each race potentially could drop from prior years as individuals are reclassified as Hispanic/Latino or as “Two or more race.” Additionally, such reclassification potentially may Increase the counts for Hispanic/Latino from prior years.
Frequently Asked Questions on Race and Ethnicity Reporting Guidelines, continued

27
Appendices

28
Appendix A: DATA COLLECTION

29
APPLICANT EEO SURVEY

30
STUDENT DEMOGRAPHIC SURVEY

31
Appendix B: COUNTY OF LOS ANGELES DIVERSITY

32
No. % No. % No. %
2006 TOTALS 4,620,110 47.02% 5,206,383 52.98% 9,826,493 100.00%
2007 TOTALS 4,635,350 47.26% 5,172,520 52.74% 9,807,870 100.00%
2008 TOTALS 4,702,785 47.69% 5,159,264 52.31% 9,862,049 100.00%
Note: Hispanics may be of any race, so also are included in applicable race categoriesNote: Hispanic origin is considered an ethnicity, not a race.
Sources:http://quickfacts.census.gov/qfd/states/06/06037.html
http://www.census.gov/popest/counties/asrh/CC-EST2008-RACE6.html
U.S. Census Bureau: State and County Quick Facts. Data derived from Population Estimates, Census of Population and Housing. Last Revised Tuesday, May 05, 2009
Annual Estimates of the Resident Population by Sex, Race Alone, and Hispanic Origin for Counties: April 1, 2000 to July 1, 2008
Los Angeles County - Hispanic/Non-Hispanic 2006-2008
HISPANIC NON-HISPANIC TOTAL
4,300,000
4,400,000
4,500,000
4,600,000
4,700,000
4,800,000
4,900,000
5,000,000
5,100,000
5,200,000
5,300,000
HISPANIC NON-HISPANIC
2006 2007 2008

33
County of Los Angeles Diversity 2006-2008
No. % No. % No. % No. % No. % No. % No. % No. % No. %
2006 TOTALS 945,493 9.62% 98,357 1.00% 1,277,404 13.00% 7,287,852 74.17% n/a 0.00% n/a 0.00% 33,954 0.35% 183,433 1.87% 9,826,493 100.00%
2007 TOTALS 935,140 9.53% 97,674 1.00% 1,285,999 13.11% 7,270,670 74.13% n/a 0.00% n/a 0.00% 33,553 0.34% 184,834 1.88% 9,807,870 100.00%
2008 TOTALS 931,478 9.45% 98,470 1.00% 1,298,746 13.17% 7,312,060 74.14% n/a 0.00% n/a 0.00% 33,781 0.34% 187,514 1.90% 9,862,049 100.00%
African American/ Black
American Indian/ Native American Asian Pacific Islander Two or More Races TotalCaucasian/ White Filipino Hispanic
0
1,000,000
2,000,000
3,000,000
4,000,000
5,000,000
6,000,000
7,000,000
8,000,000
African American/Black
American Indian/Native American
Asian Caucasian/ White Pacific Islander Two or More Races
2006 2007 2008

34
Appendix C: DIVERSITY WITHIN EMPLOYEE AND STUDENT
GROUPS

35
SANTA MONICA COLLEGE STUDENT SNAPSHOT - 2008
Total= 34,446
Caucasian White13,06838%
Filipino7352%
Hispanic8,26324%
Pacific Islander2071%
Unknown3,1319%
African AmericanBlack3,37810%
Asian5,51116%
American IndianNative American
1531%<
TOTAL = 34,446
36
Santa Monica College Student Population
Diversity 2006-2008
No. % No. % No. % No. % No. % No. % No. % No. % No. %
2006 TOTALS 3,077 9.83% 141 0.45% 5,094 16.27% 11,685 37.31% 712 2.27% 7,523 24.02% 172 0.55% 2,914 9.30% 31,318 100.00%
2007 TOTALS 3,132 9.76% 143 0.45% 5,269 16.42% 12,193 38.00% 695 2.17% 7,490 23.34% 179 0.56% 2,987 9.31% 32,088 100.00%
2008 TOTALS 3,378 9.81% 153 0.44% 5,511 16.00% 13,068 37.94% 735 2.13% 8,263 23.99% 207 0.60% 3,131 9.09% 34,446 100.00%
African American/ Black
American Indian/ Native American Asian Pacific Islander Unknown Total
Caucasian/ White Filipino Hispanic
0
2,000
4,000
6,000
8,000
10,000
12,000
14,000
AfricanAmerican/
Black
AmericanIndian/Native
American
Asian Caucasian/White
Filipino Hispanic PacificIslander
Unknown
2006 2007 2008
37
Santa Monica College Employee Diversity 2006-2008
No. % No. % No. % No. % No. % No. % No. % No. % No. %
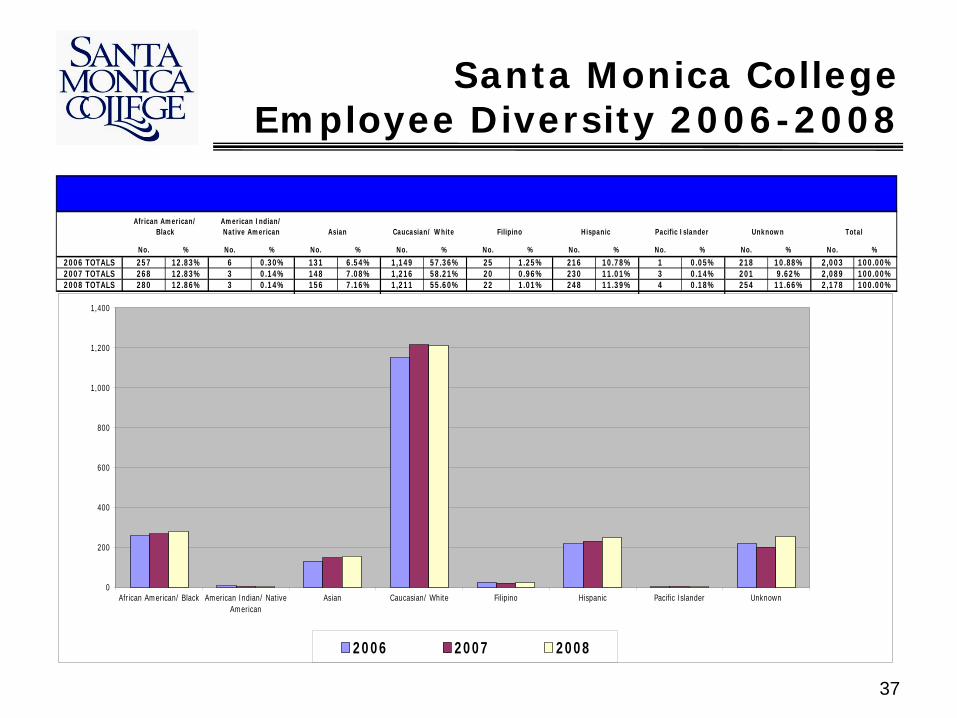
2006 TOTALS 257 12.83% 6 0.30% 131 6.54% 1,149 57.36% 25 1.25% 216 10.78% 1 0.05% 218 10.88% 2,003 100.00%2007 TOTALS 268 12.83% 3 0.14% 148 7.08% 1,216 58.21% 20 0.96% 230 11.01% 3 0.14% 201 9.62% 2,089 100.00%2008 TOTALS 280 12.86% 3 0.14% 156 7.16% 1,211 55.60% 22 1.01% 248 11.39% 4 0.18% 254 11.66% 2,178 100.00%
African American/ Black
American Indian/ Native American Asian Pacific Islander Unknown Total
Caucasian/ White Filipino Hispanic
0
200
400
600
800
1,000
1,200
1,400
African American/ Black American Indian/ NativeAmerican
Asian Caucasian/ White Filipino Hispanic Pacific Islander Unknown
2006 2007 2008

38
Santa Monica College Academic Administrators
Diversity 2006-2008
No. % No. % No. % No. % No. % No. % No. % No. % No. %
2006 TOTALS 7 17.95% 0 0.00% 5 12.82% 19 48.72% 3 7.69% 5 12.82% 0 0.00% 0 0.00% 39 100.00%
2007 TOTALS 8 19.05% 0 0.00% 5 11.90% 20 47.62% 1 2.38% 4 9.52% 0 0.00% 4 9.52% 42 100.00%
2008 TOTALS 11 20.00% 0 0.00% 5 9.09% 20 36.36% 2 3.64% 6 10.91% 1 1.82% 10 18.18% 55 100.00%
African American/ Black
American Indian/ Native American Asian Pacific Islander Unknown Total
Caucasian/ White Filipino Hispanic
0
5
10
15
20
25
AfricanAmerican/
Black
AmericanIndian/Native
American
Asian Caucasian/White
Filipino Hispanic PacificIslander
Unknown
2006 2007 2008

39
Santa Monica College Classified Managers
Diversity 2006-2008
No. % No. % No. % No. % No. % No. % No. % No. % No. %
2006 TOTALS 7 15.91% 1 2.27% 3 6.82% 31 70.45% 0 0.00% 2 4.55% 0 0.00% 0 0.00% 44 100.00%
2007 TOTALS 9 20.00% 1 2.22% 3 6.67% 28 62.22% 0 0.00% 4 8.89% 0 0.00% 0 0.00% 45 100.00%
2008 TOTALS 7 17.95% 1 2.56% 3 7.69% 26 66.67% 0 0.00% 2 5.13% 0 0.00% 0 0.00% 39 100.00%
African American/ Black
American Indian/ Native Asian
Unknown TotalCaucasian/ White Filipino Hispanic Pacific Islander
0
5
10
15
20
25
30
35
AfricanAmerican/
Black
AmericanIndian/Native
American
Asian Caucasian/White
Filipino Hispanic PacificIslander
Unknown
2006 2007 2008

40
Santa Monica College Classified Support
Diversity 2006-2008
No. % No. % No. % No. % No. % No. % No. % No. % No. %
2006 TOTALS 109 25.95% 1 0.24% 28 6.67% 155 36.90% 12 2.86% 98 23.33% 0 0.00% 17 4.05% 420 100.00%
2007 TOTALS 114 26.70% 1 0.23% 28 6.56% 152 35.60% 12 2.81% 101 23.65% 0 0.00% 19 4.45% 427 100.00%
2008 TOTALS 122 25.79% 1 0.21% 32 6.77% 174 36.79% 11 2.33% 111 23.47% 0 0.00% 22 4.65% 473 100.00%
Pacific Islander Unknown Total
African American/
BlackAmerican Indian/ Native American Asian Caucasian/ White Filipino Hispanic
0
20
40
60
80
100
120
140
160
180
200
AfricanAmerican/
Black
AmericanIndian/Native
American
Asian Caucasian/White
Filipino Hispanic PacificIslander
Unknown
2006 2007 2008

41
Santa Monica College Full-Time Faculty
Diversity 2006-2008
No. % No. % No. % No. % No. % No. % No. % No. % No. %
2006 TOTALS 37 12.09% 0 0.00% 25 8.17% 201 65.69% 3 0.98% 37 12.09% 0 0.00% 3 0.98% 306 100.00%
2007 TOTALS 38 12.06% 0 0.00% 24 7.62% 205 65.08% 3 0.95% 36 11.43% 0 0.00% 9 2.86% 315 100.00%
2008 TOTALS 38 11.95% 0 0.00% 25 7.86% 201 63.21% 3 0.94% 37 11.64% 0 0.00% 14 4.40% 318 100.00%
Unknown TotalAfrican American/
BlackAmerican Indian/ Native American Asian Caucasian/ White Filipino Hispanic Pacific Islander
0
50
100
150
200
250
AfricanAmerican/
Black
AmericanIndian/Native
American
Asian Caucasian/White
Filipino Hispanic PacificIslander
Unknown
2006 2007 2008
42
Santa Monica College Part-Time Faculty
Diversity 2006-2008
No. % No. % No. % No. % No. % No. % No. % No. % No. %
2006 TOTALS 81 7.80% 1 0.10% 59 5.68% 657 63.29% 5 0.48% 68 6.55% 1 0.10% 166 15.99% 1,038 100.00%
2007 TOTALS 80 7.48% 1 0.09% 71 6.64% 698 65.23% 4 0.37% 66 6.17% 2 0.19% 148 13.83% 1,070 100.00%
2008 TOTALS 83 7.45% 1 0.09% 79 7.09% 697 62.57% 6 0.54% 73 6.55% 2 0.18% 173 15.53% 1,114 100.00%
Unknown Total
African American/
BlackAmerican Indian/ Native American Asian Caucasian/ White Filipino Hispanic Pacific Islander
0
100
200
300
400
500
600
700
800
AfricanAmerican/
Black
AmericanIndian/Native
American
Asian Caucasian/White
Filipino Hispanic PacificIslander
Unknown
2006 2007 2008

43
Appendix D: APPLICANT POOLS

44
Santa Monica College Academic Applicants Diversity 2006-2008
No. % No. % No. % No. % No. % No. % No. % No. % No. %
2006 TOTALS 27 3.25% 3 0.36% 37 4.46% 184 22.17% 0 0.00% 23 2.77% 0 0.00% 556 66.99% 830 100.00%
2007 TOTALS 84 7.84% 4 0.37% 61 5.70% 181 16.90% 6 0.56% 37 3.45% 2 0.19% 696 64.99% 1,071 100.00%
2008 TOTALS 104 6.56% 4 0.25% 106 6.68% 304 19.17% 8 0.50% 69 4.35% 1 0.06% 990 62.42% 1,586 100.00%
African American/
Black
American Indian/ Native
American Asian Pacific Islander Unknown TotalCaucasian/ White Filipino Hispanic
0
200
400
600
800
1000
1200
AfricanAmerican/
Black
AmericanIndian/Native
American
Asian Caucasian/White
Filipino Hispanic PacificIslander
Unknown
2006 2007 2008

45
Santa Monica College Classified Applicants Diversity 2006-2008
No. % No. % No. % No. % No. % No. % No. % No. % No. %
2006 TOTALS 180 20.27% 4 0.45% 33 3.72% 122 13.74% 5 0.56% 103 11.60% 5 0.56% 436 49.10% 888 100.00%
2007 TOTALS 188 20.61% 6 0.66% 32 3.51% 91 9.98% 11 1.21% 154 16.89% 2 0.22% 428 46.93% 912 100.00%
2008 TOTALS 2,254 23.39% 71 0.74% 992 10.29% 3,055 31.70% 197 2.04% 2,070 21.48% 0 0.00% 997 10.35% 9,636 100.00%
African American/
BlackAmerican Indian/ Native American Asian Caucasian/ White Filipino Hispanic Pacific Islander Unknown Total
0
500
1,000
1,500
2,000
2,500
3,000
3,500
AfricanAmerican/
Black
AmericanIndian/Native
American
Asian Caucasian/White
Filipino Hispanic PacificIslander
Unknown
2006 2007 2008

46
No. % No. % No. %
2006 TOTALS 315 37.95% 515 62.05% 830 100.00%
2007 TOTALS 424 39.52% 649 60.48% 1,073 100.00%
2008 TOTALs 652 41.08% 935 58.92% 1,587 100.00%
Academic Applicants Gender - 2006-2008
MALE FEMALE TOTAL
0
100
200
300
400
500
600
700
800
900
1,000
MALE FEMALE
2006 2007 2008

47
No. % No. % No. %
2006 TOTALS 383 43.08% 506 56.92% 889 100.00%2007 TOTALS 356 38.99% 557 61.01% 913 100.00%2008 TOTALS 3,552 38.26% 5,733 61.74% 9,285 100.00%
MALE FEMALE TOTAL
Classified Applicants Gender 2006-2008
0
1000
2000
3000
4000
5000
6000
7000
MALE FEMALE
2006 2007 2008

48
Appendix E: EMPLOYEE AND STUDENT GENDER DATA

49
No. % No. % No. % No. %
2006 TOTALS 12,934 41.30% 18,381 58.69% 3 0.01% 31,318 100.00%
2007 TOTALS 13,471 41.98% 18,615 58.01% 2 0.01% 32,088 100.00%
2008 TOTALS 14,540 42.21% 19,897 57.76% 9 0.03% 34,446 100.00%
Student Population Gender 2006-2008
MALE FEMALE TOTALUNKNOWN
0
5,000
10,000
15,000
20,000
25,000
MALE FEMALE UNKNOWN2006 2007 2008

50
No. % No. % No. %
2006 TOTALS 937 46.80% 1,065 53.20% 2,002 100.00%
2007 TOTALS 964 46.15% 1,125 53.85% 2,089 100.00%
2008 TOTALS 1,001 45.96% 1,177 54.04% 2,178 100.00%
College-wide All Employees, Staff & Faculty Gender 2006-2008
MALE FEMALE TOTAL
0
200
400
600
800
1,000
1,200
1,400
MALE FEMALE
2006 2007 2008

51
No. % No. % No. %
2006 TOTALS 13 33.33% 26 66.67% 39 100.00%
2007 TOTALS 12 28.57% 30 71.43% 42 100.00%
2008 TOTALS 17 30.91% 38 69.09% 55 100.00%
Academic Administrators 2006-2008 - Gender
MALE FEMALE TOTAL
0
5
10
15
20
25
30
35
40
Male Female
2006 2007 2008
52
No. % No. % No. %
2006 TOTALS 30 68.18% 14 31.82% 44 100.00%
2007 TOTALS 34 75.56% 11 24.44% 45 100.00%
2008 TOTALs 29 74.36% 10 25.64% 39 100.00%
MALE FEMALE TOTAL
Classified Managers Gender 2006-2008
0
5
10
15
20
25
30
35
40
MALE FEMALE
2006 2007 2008

53
No. % No. % No. %
2006 TOTALS 207 45.88% 213 54.12% 420 100.00%
2007 TOTALS 205 46.82% 222 53.18% 427 100.00%
2008 TOTALS 227 46.52% 246 53.48% 473 100.00%
Classified Support Gender - 2006-2008
MALE FEMALE TOTAL
180
190
200
210
220
230
240
250
MALE FEMALE
2006 2007 2008
54
No. % No. % No. %
2006 TOTALS 134 43.79% 172 56.21% 306 100.00%
2007 TOTALS 136 43.17% 179 56.83% 315 100.00%
2008 TOTALs 134 42.14% 184 57.86% 318 100.00%
Full Time Faculty Gender - 2006-2008
MALE FEMALE TOTAL
0
20
40
60
80
100
120
140
160
180
200
MALE FEMALE
2006 2007 2008

55
No. % No. % No. %
2006 TOTALS 485 46.72% 553 53.28% 1,038 100.00%
2007 TOTALS 492 45.98% 578 54.02% 1,070 100.00%
2008 TOTALS 518 46.50% 596 53.50% 1,114 100.00%
Part Time Faculty Gender 2006-2008
MALE FEMALE TOTAL
0
100
200
300
400
500
600
700
MALE FEMALE2006 2007 2008

56
Appendix F: NEW HIRES DIVERSITY

57
Number % Number % Number % Number % Number % Number % Number % Number % Number %
2006 TOTALS 0 0.00% 0 0.00% 0 0.00% 1 50.00% 1 50.00% 0 0.00% 0 0.00% 0 0.00% 2 100.00%2007 TOTALS 0 0.00% 0 0.00% 0 0.00% 0 0.00% 0 0.00% 0 0.00% 0 0.00% 2 100.00% 2 100.00%2008 TOTALS 3 27.27% 0 0.00% 1 9.09% 3 27.27% 0 0.00% 2 18.18% 1 9.09% 1 9.09% 11 100.00%
2006 TOTALS 0 0.00% 0 0.00% 0 0.00% 4 100.00% 0 0.00% 0 0.00% 0 0.00% 0 0.00% 4 100.00%2007 TOTALS 0 0.00% 0 0.00% 0 0.00% 1 50.00% 0 0.00% 1 50.00% 0 0.00% 0 0.00% 2 100.00%2008 TOTALS 0 0.00% 0 0.00% 0 0.00% 3 100.00% 0 0.00% 0 0.00% 0 0.00% 0 0.00% 3 100.00%
2006 TOTALS 6 30.00% 0 0.00% 1 5.00% 7 35.00% 1 5.00% 2 10.00% 0 0.00% 3 15.00% 20 100.00%2007 TOTALS 8 26.67% 0 0.00% 2 6.67% 9 30.00% 0 0.00% 7 23.33% 0 0.00% 4 13.33% 30 100.00%2008 TOTALS 7 18.92% 0 0.00% 4 10.81% 19 51.35% 0 0.00% 5 13.51% 0 0.00% 2 5.41% 37 100.00%
2006 TOTALS 1 10.00% 0 0.00% 1 10.00% 8 80.00% 0 0.00% 0 0.00% 0 0.00% 0 0.00% 10 100.00%2007 TOTALS 5 27.78% 0 0.00% 1 5.56% 4 22.22% 0 0.00% 1 5.56% 0 0.00% 7 38.89% 18 100.00%2008 TOTALS 1 6.67% 0 0.00% 1 6.67% 6 40.00% 0 0.00% 2 13.33% 0 0.00% 5 33.33% 15 100.00%
2006 TOTALS 9 7.56% 0 0.00% 9 7.56% 66 55.46% 0 0.00% 4 3.36% 0 0.00% 31 26.05% 119 100.00%2007 TOTALS 6 4.35% 0 0.00% 14 10.14% 99 71.74% 0 0.00% 10 7.25% 1 0.72% 8 5.80% 138 100.00%2008 TOTALS 8 7.08% 0 0.00% 6 5.31% 62 54.87% 0 0.00% 10 8.85% 0 0.00% 27 23.89% 113 100.00%
Number % Number % Number % Number % Number % Number % Number % Number % Number %
2006 TOTALS 16 10.32% 0 0.00% 11 7.10% 86 55.48% 2 1.29% 6 3.87% 0 0.00% 34 21.94% 155 100.00%2007 TOTALS 19 10.00% 0 0.00% 17 8.95% 113 59.47% 0 0.00% 19 10.00% 1 0.53% 21 11.05% 190 100.00%2008 TOTALS 19 10.61% 0 0.00% 12 6.70% 93 51.96% 0 0.00% 19 10.61% 1 0.56% 35 19.55% 179 100.00%
Caucasian/ White Filipino Hispanic Pacific Islander
Snapshot: Diversity Report College-Wide Statistics 2006-2008 - New Hires
Classified Manager - New Hires
Classified Support - New Hires
Academic Administrators - New Hires
Unknown TotalAfrican American/
BlackAmerican Indian/ Native American Asian
Pacific Islander Unknown Total
Full Time Faculty - New Hires
Part Time Faculty - New Hires
College-wide - All Employees, Staff & Faculty - New Hires
Caucasian/ White Filipino HispanicAfrican American/
BlackAmerican Indian/ Native American Asian

58
Appendix G: FACULTY DIVERSITY BY DEPARTMENT

59
ART 2006 1 10.00% 0 0.00% 0 0.00% 8 80.00% 0 0.00% 1 10.00% 0 0.00% 0 0.00% 10 100.00%
ART 2007 1 11.11% 0 0.00% 0 0.00% 7 77.78% 0 0.00% 1 11.11% 0 0.00% 0 0.00% 9 100.00%
ART 2008 1 11.11% 0 0.00% 0 0.00% 7 77.78% 0 0.00% 1 11.11% 0 0.00% 0 0.00% 9 100.00%
ATHLETICS 2006 3 100.00% 0 0.00% 0 0.00% 0 0.00% 0 0.00% 0 0.00% 0 0.00% 0 0.00% 3 100.00%
ATHLETICS 2007 3 75.00% 0 0.00% 0 0.00% 1 25.00% 0 0.00% 0 0.00% 0 0.00% 0 0.00% 4 100.00%
ATHLETICS 2008 3 100.00% 0 0.00% 0 0.00% 0 0.00% 0 0.00% 0 0.00% 0 0.00% 0 0.00% 3 100.00%
BUSINESS 2006 2 16.67% 0 0.00% 1 8.33% 8 66.67% 0 0.00% 1 8.33% 0 0.00% 0 0.00% 12 100.00%
BUSINESS 2007 3 21.43% 0 0.00% 1 7.14% 8 57.14% 0 0.00% 1 7.14% 0 0.00% 1 7.14% 14 100.00%
BUSINESS 2008 2 14.29% 0 0.00% 1 7.14% 8 57.14% 0 0.00% 1 7.14% 0 0.00% 2 14.29% 14 100.00%
CHILD CENTER 2006 1 100.00% 0 0.00% 0 0.00% 0 0.00% 0 0.00% 0 0.00% 0 0.00% 0 0.00% 1 100.00%
CHILD CENTER 2007 1 100.00% 0 0.00% 0 0.00% 0 0.00% 0 0.00% 0 0.00% 0 0.00% 0 0.00% 1 100.00%
CHILD CENTER 2008 1 100.00% 0 0.00% 0 0.00% 0 0.00% 0 0.00% 0 0.00% 0 0.00% 0 0.00% 1 100.00%
COMMUNICATIONS 2006 1 10.00% 0 0.00% 1 10.00% 8 80.00% 0 0.00% 0 0.00% 0 0.00% 0 0.00% 10 100.00%
COMMUNICATIONS 2007 1 9.09% 0 0.00% 1 9.09% 8 72.73% 0 0.00% 0 0.00% 0 0.00% 1 9.09% 11 100.00%
COMMUNICATIONS 2008 1 9.09% 0 0.00% 1 9.09% 8 72.73% 0 0.00% 0 0.00% 0 0.00% 1 9.09% 11 100.00%
COSMETOLOGY 2006 1 33.33% 0 0.00% 0 0.00% 2 66.67% 0 0.00% 0 0.00% 0 0.00% 0 0.00% 3 100.00%
COSMETOLOGY 2007 1 33.33% 0 0.00% 0 0.00% 2 66.67% 0 0.00% 0 0.00% 0 0.00% 0 0.00% 3 100.00%
COSMETOLOGY 2008 1 33.33% 0 0.00% 0 0.00% 2 66.67% 0 0.00% 0 0.00% 0 0.00% 0 0.00% 3 100.00%
COUNSELING 2006 4 16.00% 0 0.00% 1 4.00% 11 44.00% 0 0.00% 8 32.00% 0 0.00% 1 4.00% 25 100.00%
COUNSELING 2007 4 15.38% 0 0.00% 1 3.85% 12 46.15% 0 0.00% 8 30.77% 0 0.00% 1 3.85% 26 100.00%
COUNSELING 2008 4 16.00% 0 0.00% 1 4.00% 11 44.00% 0 0.00% 8 32.00% 0 0.00% 1 4.00% 25 100.00%
CSIS 2006 2 16.67% 0 0.00% 0 0.00% 9 75.00% 0 0.00% 1 8.33% 0 0.00% 0 0.00% 12 100.00%
CSIS 2007 2 15.38% 0 0.00% 0 0.00% 10 76.92% 0 0.00% 1 7.69% 0 0.00% 0 0.00% 13 100.00%
CSIS 2008 2 15.38% 0 0.00% 0 0.00% 10 76.92% 0 0.00% 1 7.69% 0 0.00% 0 0.00% 13 100.00%
DANCE 2006 0 0.00% 0 0.00% 0 0.00% 2 100.00% 0 0.00% 0 0.00% 0 0.00% 0 0.00% 2 100.00%
DANCE 2007 0 0.00% 0 0.00% 0 0.00% 2 66.67% 0 0.00% 0 0.00% 0 0.00% 1 33.33% 3 100.00%
DANCE 2008 0 0.00% 0 0.00% 0 0.00% 2 66.67% 0 0.00% 0 0.00% 0 0.00% 1 33.33% 3 100.00%
DESIGN TECH. 2006 0 0.00% 0 0.00% 0 0.00% 5 62.50% 1 12.50% 2 25.00% 0 0.00% 0 0.00% 8 100.00%
DESIGN TECH. 2007 0 0.00% 0 0.00% 0 0.00% 5 62.50% 1 12.50% 2 25.00% 0 0.00% 0 0.00% 8 100.00%
DESIGN TECH. 2008 0 0.00% 0 0.00% 0 0.00% 5 62.50% 1 12.50% 2 25.00% 0 0.00% 0 0.00% 8 100.00%
DISABL STU CTR 2006 0 0.00% 0 0.00% 1 11.11% 7 77.78% 0 0.00% 0 0.00% 0 0.00% 1 11.11% 9 100.00%
DISABL STU CTR 2007 0 0.00% 0 0.00% 1 12.50% 6 75.00% 0 0.00% 0 0.00% 0 0.00% 1 12.50% 8 100.00%
DISABL STU CTR 2008 0 0.00% 0 0.00% 1 11.11% 7 77.78% 0 0.00% 0 0.00% 0 0.00% 1 11.11% 9 100.00%
Full-Time Faculty Diversity by Department 2006-2008
Full Time Faculty - Diversity by Department - 2006-2008
Number % Number % Number % Number % Number % Number % Number % Number % Number %
Hispanic Pacific Islander Unknown Total
Department Year
African American/ Black
American Indian/ Native American Asian Caucasian/ White Filipino

60
Number % Number % Number % Number % Number % Number % Number % Number % Number %
Hispanic Pacific Islander Unknown Total
Department Year
African American/ Black
American Indian/ Native American Asian Caucasian/ White Filipino
Full Time Faculty - Diversity by Department - 2006-2008
EARTH SCIENCE 2006 0 0.00% 0 0.00% 0 0.00% 10 100.00% 0 0.00% 0 0.00% 0 0.00% 0 0.00% 10 100.00%
EARTH SCIENCE 2007 0 0.00% 0 0.00% 0 0.00% 11 100.00% 0 0.00% 0 0.00% 0 0.00% 0 0.00% 11 100.00%
EARTH SCIENCE 2008 0 0.00% 0 0.00% 0 0.00% 10 90.91% 0 0.00% 0 0.00% 0 0.00% 1 9.09% 11 100.00%
EDUCATION/ECE 2006 1 25.00% 0 0.00% 1 25.00% 2 50.00% 0 0.00% 0 0.00% 0 0.00% 0 0.00% 4 100.00%
EDUCATION/ECE 2007 1 20.00% 0 0.00% 1 20.00% 3 60.00% 0 0.00% 0 0.00% 0 0.00% 0 0.00% 5 100.00%
EDUCATION/ECE 2008 1 20.00% 0 0.00% 1 20.00% 3 60.00% 0 0.00% 0 0.00% 0 0.00% 0 0.00% 5 100.00%
ENGLISH 2006 3 8.57% 0 0.00% 1 2.86% 28 80.00% 0 0.00% 3 8.57% 0 0.00% 0 0.00% 35 100.00%
ENGLISH 2007 3 7.89% 0 0.00% 1 2.63% 30 78.95% 0 0.00% 3 7.89% 0 0.00% 1 2.63% 38 100.00%
ENGLISH 2008 3 8.11% 0 0.00% 1 2.70% 28 75.68% 0 0.00% 3 8.11% 0 0.00% 2 5.41% 37 100.00%
EOPS 2006 0 0.00% 0 0.00% 0 0.00% 1 33.33% 1 33.33% 1 33.33% 0 0.00% 0 0.00% 3 100.00%
EOPS 2007 0 0.00% 0 0.00% 0 0.00% 1 33.33% 1 33.33% 1 33.33% 0 0.00% 0 0.00% 3 100.00%
EOPS 2008 0 0.00% 0 0.00% 0 0.00% 1 33.33% 1 33.33% 1 33.33% 0 0.00% 0 0.00% 3 100.00%
ESL 2006 1 10.00% 0 0.00% 0 0.00% 8 80.00% 0 0.00% 1 10.00% 0 0.00% 0 0.00% 10 100.00%
ESL 2007 1 10.00% 0 0.00% 0 0.00% 8 80.00% 0 0.00% 1 10.00% 0 0.00% 0 0.00% 10 100.00%
ESL 2008 1 10.00% 0 0.00% 0 0.00% 8 80.00% 0 0.00% 1 10.00% 0 0.00% 0 0.00% 10 100.00%
HEALTH SCIENCE 2006 2 28.57% 0 0.00% 0 0.00% 5 71.43% 0 0.00% 0 0.00% 0 0.00% 0 0.00% 7 100.00%
HEALTH SCIENCE 2007 3 37.50% 0 0.00% 0 0.00% 5 62.50% 0 0.00% 0 0.00% 0 0.00% 0 0.00% 8 100.00%
HEALTH SCIENCE 2008 2 28.57% 0 0.00% 0 0.00% 5 71.43% 0 0.00% 0 0.00% 0 0.00% 0 0.00% 7 100.00%
HEALTH SERVICES 2006 0 0.00% 0 0.00% 0 0.00% 0 0.00% 0 0.00% 1 100.00% 0 0.00% 0 0.00% 1 100.00%
HEALTH SERVICES 2007 0 0.00% 0 0.00% 0 0.00% 0 0.00% 0 0.00% 1 100.00% 0 0.00% 0 0.00% 1 100.00%
HEALTH SERVICES 2008 0 0.00% 0 0.00% 0 0.00% 0 0.00% 0 0.00% 1 100.00% 0 0.00% 0 0.00% 1 100.00%
HISTORY 2006 1 11.11% 0 0.00% 1 11.11% 5 55.56% 0 0.00% 2 22.22% 0 0.00% 0 0.00% 9 100.00%
HISTORY 2007 1 12.50% 0 0.00% 1 12.50% 5 62.50% 0 0.00% 1 12.50% 0 0.00% 0 0.00% 8 100.00%
HISTORY 2008 1 12.50% 0 0.00% 1 12.50% 5 62.50% 0 0.00% 1 12.50% 0 0.00% 0 0.00% 8 100.00%
INT'L STUD CNTR 2008 0 0.00% 0 0.00% 1 33.33% 1 33.33% 0 0.00% 1 33.33% 0 0.00% 0 0.00% 3 100.00%
ISC 2006 0 0.00% 0 0.00% 1 33.33% 1 33.33% 0 0.00% 1 33.33% 0 0.00% 0 0.00% 3 100.00%
ISC 2007 0 0.00% 0 0.00% 1 33.33% 1 33.33% 0 0.00% 1 33.33% 0 0.00% 0 0.00% 3 100.00%
KINESIOLOGY 2006 0 0.00% 0 0.00% 0 0.00% 2 66.67% 1 33.33% 0 0.00% 0 0.00% 0 0.00% 3 100.00%
KINESIOLOGY 2007 0 0.00% 0 0.00% 0 0.00% 3 75.00% 1 25.00% 0 0.00% 0 0.00% 0 0.00% 4 100.00%
KINESIOLOGY 2008 0 0.00% 0 0.00% 0 0.00% 2 66.67% 1 33.33% 0 0.00% 0 0.00% 0 0.00% 3 100.00%

61
LIBRARY 2006 2 28.57% 0 0.00% 0 0.00% 5 71.43% 0 0.00% 0 0.00% 0 0.00% 0 0.00% 7 100.00%
LIBRARY 2007 2 28.57% 0 0.00% 0 0.00% 5 71.43% 0 0.00% 0 0.00% 0 0.00% 0 0.00% 7 100.00%
LIBRARY 2008 2 28.57% 0 0.00% 0 0.00% 5 71.43% 0 0.00% 0 0.00% 0 0.00% 0 0.00% 7 100.00%
LIFE SCIENCE 2006 1 5.26% 0 0.00% 4 21.05% 12 63.16% 0 0.00% 2 10.53% 0 0.00% 0 0.00% 19 100.00%
LIFE SCIENCE 2007 1 5.00% 0 0.00% 4 20.00% 12 60.00% 0 0.00% 2 10.00% 0 0.00% 1 5.00% 20 100.00%
LIFE SCIENCE 2008 1 4.76% 0 0.00% 4 19.05% 12 57.14% 0 0.00% 2 9.52% 0 0.00% 2 9.52% 21 100.00%
MATHEMATICS 2006 3 11.54% 0 0.00% 5 19.23% 14 53.85% 0 0.00% 3 11.54% 0 0.00% 1 3.85% 26 100.00%
MATHEMATICS 2007 3 11.11% 0 0.00% 4 14.81% 15 55.56% 0 0.00% 3 11.11% 0 0.00% 2 7.41% 27 100.00%
MATHEMATICS 2008 3 10.71% 0 0.00% 5 17.86% 14 50.00% 0 0.00% 4 14.29% 0 0.00% 2 7.14% 28 100.00%
MATRICULATION 2006 1 50.00% 0 0.00% 0 0.00% 0 0.00% 0 0.00% 1 50.00% 0 0.00% 0 0.00% 2 100.00%
MATRICULATION 2007 1 50.00% 0 0.00% 0 0.00% 0 0.00% 0 0.00% 1 50.00% 0 0.00% 0 0.00% 2 100.00%
MATRICULATION 2008 1 50.00% 0 0.00% 0 0.00% 0 0.00% 0 0.00% 1 50.00% 0 0.00% 0 0.00% 2 100.00%
MODERN LANGUAGE 2006 1 9.09% 0 0.00% 3 27.27% 3 27.27% 0 0.00% 4 36.36% 0 0.00% 0 0.00% 11 100.00%
MODERN LANGUAGE 2007 1 9.09% 0 0.00% 3 27.27% 3 27.27% 0 0.00% 4 36.36% 0 0.00% 0 0.00% 11 100.00%
MODERN LANGUAGE 2008 1 9.09% 0 0.00% 3 27.27% 3 27.27% 0 0.00% 4 36.36% 0 0.00% 0 0.00% 11 100.00%
MUSIC 2006 0 0.00% 0 0.00% 0 0.00% 6 100.00% 0 0.00% 0 0.00% 0 0.00% 0 0.00% 6 100.00%
MUSIC 2007 0 0.00% 0 0.00% 0 0.00% 5 100.00% 0 0.00% 0 0.00% 0 0.00% 0 0.00% 5 100.00%
MUSIC 2008 0 0.00% 0 0.00% 0 0.00% 5 100.00% 0 0.00% 0 0.00% 0 0.00% 0 0.00% 5 100.00%
OFF OF SCH REL 2006 1 33.33% 0 0.00% 0 0.00% 2 66.67% 0 0.00% 0 0.00% 0 0.00% 0 0.00% 3 100.00%
OFF OF SCH REL 2007 1 33.33% 0 0.00% 0 0.00% 2 66.67% 0 0.00% 0 0.00% 0 0.00% 0 0.00% 3 100.00%
OFF OF SCH REL 2008 1 33.33% 0 0.00% 0 0.00% 2 66.67% 0 0.00% 0 0.00% 0 0.00% 0 0.00% 3 100.00%
PHILOSOPHY/SOCI 2006 0 0.00% 0 0.00% 2 11.11% 13 72.22% 0 0.00% 3 16.67% 0 0.00% 0 0.00% 18 100.00%
PHILOSOPHY/SOCI 2007 0 0.00% 0 0.00% 2 11.76% 12 70.59% 0 0.00% 3 17.65% 0 0.00% 0 0.00% 17 100.00%
PHILOSOPHY/SOCI 2008 0 0.00% 0 0.00% 2 11.76% 12 70.59% 0 0.00% 3 17.65% 0 0.00% 0 0.00% 17 100.00%
PHOTO - FASHION 2006 0 0.00% 0 0.00% 0 0.00% 4 100.00% 0 0.00% 0 0.00% 0 0.00% 0 0.00% 4 100.00%
PHOTO - FASHION 2007 0 0.00% 0 0.00% 0 0.00% 4 100.00% 0 0.00% 0 0.00% 0 0.00% 0 0.00% 4 100.00%
PHOTO - FASHION 2008 0 0.00% 0 0.00% 0 0.00% 4 100.00% 0 0.00% 0 0.00% 0 0.00% 0 0.00% 4 100.00%
PHYSICAL SCI 2006 3 17.65% 0 0.00% 1 5.88% 12 70.59% 0 0.00% 1 5.88% 0 0.00% 0 0.00% 17 100.00%
PHYSICAL SCI 2007 2 13.33% 0 0.00% 1 6.67% 11 73.33% 0 0.00% 1 6.67% 0 0.00% 0 0.00% 15 100.00%
PHYSICAL SCI 2008 2 11.76% 0 0.00% 1 5.88% 13 76.47% 0 0.00% 1 5.88% 0 0.00% 0 0.00% 17 100.00%
PSYCH SERVICES 2008 2 66.67% 0 0.00% 0 0.00% 0 0.00% 0 0.00% 0 0.00% 0 0.00% 1 33.33% 3 100.00%
Full Time Faculty - Diversity by Department - 2006-2008
Number % Number % Number % Number % Number % Number % Number % Number % Number %
Hispanic Pacific Islander Unknown Total
Department Year
African American/ Black
American Indian/ Native American Asian Caucasian/ White Filipino

62
PSYCHOLOGY 2006 1 12.50% 0 0.00% 1 12.50% 5 62.50% 0 0.00% 1 12.50% 0 0.00% 0 0.00% 8 100.00%
PSYCHOLOGY 2007 1 12.50% 0 0.00% 1 12.50% 5 62.50% 0 0.00% 1 12.50% 0 0.00% 0 0.00% 8 100.00%
PSYCHOLOGY 2008 1 12.50% 0 0.00% 1 12.50% 5 62.50% 0 0.00% 1 12.50% 0 0.00% 0 0.00% 8 100.00%
STUDENT LIFE 2006 1 100.00% 0 0.00% 0 0.00% 0 0.00% 0 0.00% 0 0.00% 0 0.00% 0 0.00% 1 100.00%
STUDENT LIFE 2007 1 100.00% 0 0.00% 0 0.00% 0 0.00% 0 0.00% 0 0.00% 0 0.00% 0 0.00% 1 100.00%
STUDENT LIFE 2008 1 100.00% 0 0.00% 0 0.00% 0 0.00% 0 0.00% 0 0.00% 0 0.00% 0 0.00% 1 100.00%
THEATRE ARTS 2006 0 0.00% 0 0.00% 1 25.00% 3 75.00% 0 0.00% 0 0.00% 0 0.00% 0 0.00% 4 100.00%
THEATRE ARTS 2007 0 0.00% 0 0.00% 1 25.00% 3 75.00% 0 0.00% 0 0.00% 0 0.00% 0 0.00% 4 100.00%
THEATRE ARTS 2008 0 0.00% 0 0.00% 1 25.00% 3 75.00% 0 0.00% 0 0.00% 0 0.00% 0 0.00% 4 100.00%
Full Time Faculty - Diversity by Department - 2006-2008
Number % Number % Number % Number % Number % Number % Number % Number % Number %
Hispanic Pacific Islander Unknown Total
Department Year
African American/ Black
American Indian/ Native American Asian Caucasian/ White Filipino
63
ACAD OF ENTER 2006 1 33.33% 0 0.00% 0 0.00% 0 0.00% 0 0.00% 0 0.00% 0 0.00% 2 66.67% 3 100.00%ACAD OF ENTER 2007 1 33.33% 0 0.00% 0 0.00% 1 33.33% 0 0.00% 0 0.00% 0 0.00% 1 33.33% 3 100.00%ACAD OF ENTER 2008 1 33.33% 0 0.00% 0 0.00% 1 33.33% 0 0.00% 0 0.00% 0 0.00% 1 33.33% 3 100.00%
ACAD. AFFAIRS 2006 0 0.00% 0 0.00% 0 0.00% 1 100.00% 0 0.00% 0 0.00% 0 0.00% 0 0.00% 1 100.00%
ART 2006 3 6.98% 0 0.00% 4 9.30% 28 65.12% 0 0.00% 2 4.65% 0 0.00% 6 13.95% 43 100.00%ART 2007 3 7.50% 0 0.00% 5 12.50% 26 65.00% 0 0.00% 1 2.50% 0 0.00% 5 12.50% 40 100.00%ART 2008 2 4.76% 0 0.00% 6 14.29% 29 69.05% 0 0.00% 0 0.00% 0 0.00% 5 11.90% 42 100.00%
ATHLETICS 2006 2 14.29% 0 0.00% 0 0.00% 4 28.57% 0 0.00% 1 7.14% 0 0.00% 7 50.00% 14 100.00%ATHLETICS 2007 1 7.69% 0 0.00% 0 0.00% 5 38.46% 0 0.00% 1 7.69% 0 0.00% 6 46.15% 13 100.00%ATHLETICS 2008 0 0.00% 0 0.00% 0 0.00% 5 38.46% 0 0.00% 2 15.38% 0 0.00% 6 46.15% 13 100.00%
BUSINESS 2006 4 9.52% 0 0.00% 2 4.76% 31 73.81% 0 0.00% 1 2.38% 0 0.00% 4 9.52% 42 100.00%BUSINESS 2007 3 6.67% 0 0.00% 3 6.67% 33 73.33% 0 0.00% 2 4.44% 0 0.00% 4 8.89% 45 100.00%BUSINESS 2008 3 6.67% 0 0.00% 3 6.67% 33 73.33% 0 0.00% 2 4.44% 0 0.00% 4 8.89% 45 100.00%
COMMUNICATIONS 2006 3 6.67% 0 0.00% 0 0.00% 29 64.44% 0 0.00% 2 4.44% 1 2.22% 10 22.22% 45 100.00%COMMUNICATIONS 2007 3 6.98% 0 0.00% 0 0.00% 30 69.77% 0 0.00% 2 4.65% 1 2.33% 7 16.28% 43 100.00%COMMUNICATIONS 2008 3 6.67% 0 0.00% 0 0.00% 32 71.11% 0 0.00% 2 4.44% 1 2.22% 7 15.56% 45 100.00%
COMMUNITY SERV 2006 0 0.00% 0 0.00% 0 0.00% 1 100.00% 0 0.00% 0 0.00% 0 0.00% 0 0.00% 1 100.00%COMMUNITY SERV 2007 0 0.00% 0 0.00% 0 0.00% 1 100.00% 0 0.00% 0 0.00% 0 0.00% 0 0.00% 1 100.00%COMMUNITY SERV 2008 0 0.00% 0 0.00% 0 0.00% 1 50.00% 0 0.00% 0 0.00% 0 0.00% 1 50.00% 2 100.00%
COSMETOLOGY 2006 1 5.26% 0 0.00% 1 5.26% 9 47.37% 0 0.00% 3 15.79% 0 0.00% 5 26.32% 19 100.00%COSMETOLOGY 2007 5 22.73% 0 0.00% 1 4.55% 8 36.36% 0 0.00% 4 18.18% 0 0.00% 4 18.18% 22 100.00%COSMETOLOGY 2008 4 18.18% 0 0.00% 2 9.09% 6 27.27% 0 0.00% 5 22.73% 0 0.00% 5 22.73% 22 100.00%
COUNSELING 2006 14 20.29% 0 0.00% 3 4.35% 24 34.78% 0 0.00% 12 17.39% 0 0.00% 16 23.19% 69 100.00%COUNSELING 2007 14 19.18% 0 0.00% 4 5.48% 32 43.84% 0 0.00% 11 15.07% 0 0.00% 12 16.44% 73 100.00%COUNSELING 2008 13 16.88% 0 0.00% 4 5.19% 31 40.26% 0 0.00% 15 19.48% 0 0.00% 14 18.18% 77 100.00%
CSIS 2006 2 10.53% 0 0.00% 0 0.00% 14 73.68% 0 0.00% 1 5.26% 0 0.00% 2 10.53% 19 100.00%CSIS 2007 2 11.11% 0 0.00% 0 0.00% 14 77.78% 0 0.00% 1 5.56% 0 0.00% 1 5.56% 18 100.00%CSIS 2008 3 15.00% 0 0.00% 1 5.00% 13 65.00% 0 0.00% 1 5.00% 0 0.00% 2 10.00% 20 100.00%
DANCE 2006 4 23.53% 0 0.00% 0 0.00% 9 52.94% 0 0.00% 2 11.76% 0 0.00% 2 11.76% 17 100.00%DANCE 2007 2 11.76% 0 0.00% 1 5.88% 8 47.06% 0 0.00% 2 11.76% 0 0.00% 4 23.53% 17 100.00%DANCE 2008 5 20.00% 0 0.00% 1 4.00% 14 56.00% 0 0.00% 2 8.00% 0 0.00% 3 12.00% 25 100.00%
DESIGN TECH. 2006 2 5.13% 0 0.00% 0 0.00% 35 89.74% 0 0.00% 0 0.00% 0 0.00% 2 5.13% 39 100.00%DESIGN TECH. 2007 0 0.00% 0 0.00% 0 0.00% 31 91.18% 0 0.00% 1 2.94% 0 0.00% 2 5.88% 34 100.00%DESIGN TECH. 2008 1 2.50% 0 0.00% 0 0.00% 35 87.50% 0 0.00% 2 5.00% 0 0.00% 2 5.00% 40 100.00%
DISABL STU CTR 2006 1 5.88% 0 0.00% 1 5.88% 10 58.82% 0 0.00% 1 5.88% 0 0.00% 4 23.53% 17 100.00%DISABL STU CTR 2007 1 6.25% 0 0.00% 1 6.25% 10 62.50% 0 0.00% 0 0.00% 0 0.00% 4 25.00% 16 100.00%DISABL STU CTR 2008 1 6.67% 0 0.00% 1 6.67% 9 60.00% 0 0.00% 0 0.00% 0 0.00% 4 26.67% 15 100.00%
Part-Time Faculty Diversity by Department 2006-2008
Year Number % Number % Number % Number % Number % Number % Number % Number % Number %
Unknown Total
Part Time Faculty - Diversity by Department - 2006-2008
Department
African American/ Black
American Indian/ Native American Asian Caucasian/ White Filipino Hispanic Pacific Islander

64
EARTH SCIENCE 2006 0 0.00% 0 0.00% 0 0.00% 19 79.17% 0 0.00% 0 0.00% 0 0.00% 5 20.83% 24 100.00%EARTH SCIENCE 2007 0 0.00% 0 0.00% 0 0.00% 20 83.33% 0 0.00% 0 0.00% 0 0.00% 4 16.67% 24 100.00%EARTH SCIENCE 2008 0 0.00% 0 0.00% 0 0.00% 20 83.33% 0 0.00% 0 0.00% 0 0.00% 4 16.67% 24 100.00%
EDUCATION/ECE 2006 0 0.00% 0 0.00% 0 0.00% 8 88.89% 0 0.00% 1 11.11% 0 0.00% 0 0.00% 9 100.00%EDUCATION/ECE 2007 1 11.11% 0 0.00% 0 0.00% 7 77.78% 0 0.00% 1 11.11% 0 0.00% 0 0.00% 9 100.00%EDUCATION/ECE 2008 1 9.09% 0 0.00% 0 0.00% 8 72.73% 0 0.00% 2 18.18% 0 0.00% 0 0.00% 11 100.00%
EMERITUS 2006 3 3.95% 0 0.00% 5 6.58% 59 77.63% 0 0.00% 3 3.95% 0 0.00% 6 7.89% 76 100.00%EMERITUS 2007 3 3.61% 0 0.00% 5 6.02% 65 78.31% 0 0.00% 3 3.61% 0 0.00% 7 8.43% 83 100.00%EMERITUS 2008 3 3.70% 0 0.00% 6 7.41% 59 72.84% 0 0.00% 3 3.70% 0 0.00% 10 12.35% 81 100.00%
ENGLISH 2006 1 0.90% 0 0.00% 4 3.60% 84 75.68% 0 0.00% 4 3.60% 0 0.00% 18 16.22% 111 100.00%ENGLISH 2007 4 3.36% 0 0.00% 4 3.36% 92 77.31% 0 0.00% 3 2.52% 0 0.00% 16 13.45% 119 100.00%ENGLISH 2008 3 2.48% 0 0.00% 4 3.31% 95 78.51% 0 0.00% 3 2.48% 0 0.00% 16 13.22% 121 100.00%
EOPS 2006 1 100.00% 0 0.00% 0 0.00% 0 0.00% 0 0.00% 0 0.00% 0 0.00% 0 0.00% 1 100.00%EOPS 2007 1 100.00% 0 0.00% 0 0.00% 0 0.00% 0 0.00% 0 0.00% 0 0.00% 0 0.00% 1 100.00%EOPS 2008 1 100.00% 0 0.00% 0 0.00% 0 0.00% 0 0.00% 0 0.00% 0 0.00% 0 0.00% 1 100.00%
ESL 2006 1 4.00% 0 0.00% 0 0.00% 23 92.00% 0 0.00% 0 0.00% 0 0.00% 1 4.00% 25 100.00%ESL 2007 1 3.57% 0 0.00% 1 3.57% 25 89.29% 0 0.00% 0 0.00% 0 0.00% 1 3.57% 28 100.00%ESL 2008 1 3.23% 0 0.00% 1 3.23% 23 74.19% 0 0.00% 1 3.23% 0 0.00% 5 16.13% 31 100.00%
HEALTH SCIENCE 2006 4 22.22% 0 0.00% 0 0.00% 9 50.00% 2 11.11% 0 0.00% 0 0.00% 3 16.67% 18 100.00%HEALTH SCIENCE 2007 5 22.73% 0 0.00% 4 18.18% 10 45.45% 1 4.55% 0 0.00% 0 0.00% 2 9.09% 22 100.00%HEALTH SCIENCE 2008 5 18.52% 0 0.00% 3 11.11% 14 51.85% 2 7.41% 1 3.70% 0 0.00% 2 7.41% 27 100.00%
HISTORY 2006 4 11.76% 0 0.00% 2 5.88% 14 41.18% 1 2.94% 4 11.76% 0 0.00% 9 26.47% 34 100.00%HISTORY 2007 2 8.00% 0 0.00% 1 4.00% 13 52.00% 1 4.00% 3 12.00% 0 0.00% 5 20.00% 25 100.00%HISTORY 2008 3 11.11% 0 0.00% 1 3.70% 13 48.15% 1 3.70% 4 14.81% 0 0.00% 5 18.52% 27 100.00%
ISC 2006 0 0.00% 0 0.00% 2 28.57% 2 28.57% 0 0.00% 2 28.57% 0 0.00% 1 14.29% 7 100.00%ISC 2007 0 0.00% 0 0.00% 2 28.57% 2 28.57% 0 0.00% 2 28.57% 0 0.00% 1 14.29% 7 100.00%ISC 2008 0 0.00% 0 0.00% 3 37.50% 2 25.00% 0 0.00% 2 25.00% 0 0.00% 1 12.50% 8 100.00%
KINESIOLOGY 2006 2 6.90% 0 0.00% 0 0.00% 17 58.62% 0 0.00% 1 3.45% 0 0.00% 9 31.03% 29 100.00%KINESIOLOGY 2007 2 5.56% 0 0.00% 1 2.78% 22 61.11% 0 0.00% 2 5.56% 0 0.00% 9 25.00% 36 100.00%KINESIOLOGY 2008 1 2.94% 0 0.00% 2 5.88% 21 61.76% 0 0.00% 2 5.88% 0 0.00% 8 23.53% 34 100.00%
LIBRARY 2006 1 12.50% 0 0.00% 0 0.00% 6 75.00% 0 0.00% 0 0.00% 0 0.00% 1 12.50% 8 100.00%LIBRARY 2007 0 0.00% 0 0.00% 0 0.00% 4 80.00% 0 0.00% 0 0.00% 0 0.00% 1 20.00% 5 100.00%LIBRARY 2008 1 14.29% 0 0.00% 0 0.00% 5 71.43% 0 0.00% 0 0.00% 0 0.00% 1 14.29% 7 100.00%
LIFE SCIENCE 2006 1 3.03% 0 0.00% 1 3.03% 21 63.64% 0 0.00% 2 6.06% 0 0.00% 8 24.24% 33 100.00%LIFE SCIENCE 2007 1 2.78% 0 0.00% 1 2.78% 25 69.44% 0 0.00% 2 5.56% 0 0.00% 7 19.44% 36 100.00%LIFE SCIENCE 2008 1 2.63% 0 0.00% 1 2.63% 20 52.63% 0 0.00% 1 2.63% 0 0.00% 15 39.47% 38 100.00%
MATHEMATICS 2006 10 13.89% 1 1.39% 10 13.89% 42 58.33% 0 0.00% 4 5.56% 0 0.00% 5 6.94% 72 100.00%MATHEMATICS 2007 9 11.39% 1 1.27% 12 15.19% 47 59.49% 0 0.00% 3 3.80% 1 1.27% 6 7.59% 79 100.00%MATHEMATICS 2008 11 15.07% 1 1.37% 12 16.44% 39 53.42% 0 0.00% 4 5.48% 1 1.37% 5 6.85% 73 100.00%
Year Number % Number % Number % Number % Number % Number % Number % Number % Number %
Unknown Total
Part Time Faculty - Diversity by Department - 2006-2008
Department
African American/ Black
American Indian/ Native American Asian Caucasian/ White Filipino Hispanic Pacific Islander

65
MODERN LANGUAGE 2006 1 2.08% 0 0.00% 14 29.17% 20 41.67% 0 0.00% 8 16.67% 0 0.00% 5 10.42% 48 100.00%MODERN LANGUAGE 2007 2 3.57% 0 0.00% 16 28.57% 24 42.86% 0 0.00% 8 14.29% 0 0.00% 6 10.71% 56 100.00%MODERN LANGUAGE 2008 1 1.64% 0 0.00% 18 29.51% 20 32.79% 0 0.00% 6 9.84% 0 0.00% 16 26.23% 61 100.00%
MUSIC 2006 2 3.85% 0 0.00% 4 7.69% 37 71.15% 0 0.00% 3 5.77% 0 0.00% 6 11.54% 52 100.00%MUSIC 2007 3 5.26% 0 0.00% 4 7.02% 41 71.93% 1 1.75% 3 5.26% 0 0.00% 5 8.77% 57 100.00%MUSIC 2008 5 8.20% 0 0.00% 3 4.92% 44 72.13% 1 1.64% 3 4.92% 0 0.00% 5 8.20% 61 100.00%
NC EDUCATION 2006 0 0.00% 0 0.00% 0 0.00% 7 63.64% 0 0.00% 2 18.18% 0 0.00% 2 18.18% 11 100.00%NC EDUCATION 2007 0 0.00% 0 0.00% 0 0.00% 7 70.00% 0 0.00% 2 20.00% 0 0.00% 1 10.00% 10 100.00%NC EDUCATION 2008 0 0.00% 0 0.00% 0 0.00% 6 66.67% 0 0.00% 1 11.11% 0 0.00% 2 22.22% 9 100.00%
OFF OF SCH REL 2006 3 37.50% 0 0.00% 0 0.00% 2 25.00% 0 0.00% 3 37.50% 0 0.00% 0 0.00% 8 100.00%OFF OF SCH REL 2007 3 37.50% 0 0.00% 0 0.00% 2 25.00% 0 0.00% 3 37.50% 0 0.00% 0 0.00% 8 100.00%OFF OF SCH REL 2008 3 37.50% 0 0.00% 0 0.00% 2 25.00% 0 0.00% 3 37.50% 0 0.00% 0 0.00% 8 100.00%
PHILOSOPHY/SOCI 2006 4 8.89% 0 0.00% 1 2.22% 29 64.44% 0 0.00% 2 4.44% 0 0.00% 9 20.00% 45 100.00%PHILOSOPHY/SOCI 2007 3 6.98% 0 0.00% 0 0.00% 29 67.44% 0 0.00% 2 4.65% 0 0.00% 9 20.93% 43 100.00%PHILOSOPHY/SOCI 2008 3 6.38% 0 0.00% 0 0.00% 33 70.21% 0 0.00% 2 4.26% 0 0.00% 9 19.15% 47 100.00%
PHOTO - FASHION 2006 0 0.00% 0 0.00% 2 6.90% 19 65.52% 1 3.45% 1 3.45% 0 0.00% 6 20.69% 29 100.00%PHOTO - FASHION 2007 0 0.00% 0 0.00% 1 3.23% 23 74.19% 0 0.00% 1 3.23% 0 0.00% 6 19.35% 31 100.00%PHOTO - FASHION 2008 0 0.00% 0 0.00% 1 3.33% 22 73.33% 1 3.33% 1 3.33% 0 0.00% 5 16.67% 30 100.00%
PHYSICAL SCI 2006 3 10.34% 0 0.00% 2 6.90% 13 44.83% 1 3.45% 1 3.45% 0 0.00% 9 31.03% 29 100.00%PHYSICAL SCI 2007 3 8.82% 0 0.00% 3 8.82% 15 44.12% 1 2.94% 1 2.94% 0 0.00% 11 32.35% 34 100.00%PHYSICAL SCI 2008 3 9.68% 0 0.00% 5 16.13% 14 45.16% 1 3.23% 1 3.23% 0 0.00% 7 22.58% 31 100.00%
PROGRAM DEVELOP 2006 0 0.00% 0 0.00% 0 0.00% 1 100.00% 0 0.00% 0 0.00% 0 0.00% 0 0.00% 1 100.00%
PSYCH SERVICES 2006 2 66.67% 0 0.00% 0 0.00% 1 33.33% 0 0.00% 0 0.00% 0 0.00% 0 0.00% 3 100.00%PSYCH SERVICES 2007 1 50.00% 0 0.00% 0 0.00% 0 0.00% 0 0.00% 1 50.00% 0 0.00% 0 0.00% 2 100.00%PSYCH SERVICES 2008 0 0.00% 0 0.00% 0 0.00% 0 0.00% 0 0.00% 1 100.00% 0 0.00% 0 0.00% 1 100.00%
PSYCHOLOGY 2006 1 4.76% 0 0.00% 0 0.00% 20 95.24% 0 0.00% 0 0.00% 0 0.00% 0 0.00% 21 100.00%PSYCHOLOGY 2007 1 5.26% 0 0.00% 0 0.00% 18 94.74% 0 0.00% 0 0.00% 0 0.00% 0 0.00% 19 100.00%PSYCHOLOGY 2008 1 5.00% 0 0.00% 0 0.00% 19 95.00% 0 0.00% 0 0.00% 0 0.00% 0 0.00% 20 100.00%
THEATRE ARTS 2006 0 0.00% 0 0.00% 1 7.69% 9 69.23% 0 0.00% 1 7.69% 0 0.00% 2 15.38% 13 100.00%THEATRE ARTS 2007 0 0.00% 0 0.00% 1 10.00% 8 80.00% 0 0.00% 0 0.00% 0 0.00% 1 10.00% 10 100.00%THEATRE ARTS 2008 0 0.00% 0 0.00% 1 7.69% 9 69.23% 0 0.00% 0 0.00% 0 0.00% 3 23.08% 13 100.00%
TRIO 2006 0 0.00% 0 0.00% 0 0.00% 0 0.00% 0 0.00% 1 100.00% 0 0.00% 0 0.00% 1 100.00%TRIO 2007 0 0.00% 0 0.00% 0 0.00% 0 0.00% 0 0.00% 1 100.00% 0 0.00% 0 0.00% 1 100.00%TRIO 2008 0 0.00% 0 0.00% 0 0.00% 0 0.00% 0 0.00% 1 100.00% 0 0.00% 0 0.00% 1 100.00%
WORKFORCE/ECON 2006 0 0.00% 0 0.00% 0 0.00% 0 0.00% 0 0.00% 0 0.00% 0 0.00% 1 100.00% 1 100.00%
Year Number % Number % Number % Number % Number % Number % Number % Number % Number %
Unknown Total
Part Time Faculty - Diversity by Department - 2006-2008
Department
African American/ Black
American Indian/ Native American Asian Caucasian/ White Filipino Hispanic Pacific Islander

66
Appendix H: EMPLOYEE AGE DISTRIBUTION

67
ACADEMIC ADMINISTRATORS AGE RANGE – FALL 2009
Total = 48
30-398
17%
40-4914
29%50-59
1837%
60-698
17%
21-290
0%70-79
00%
80-900
0%

68
CLASSIFIED MANAGERS AGE RANGE – FALL 2009
40-4917
43%50-5914
36%
60-695
13%
21-290
0%
80-900
0%70-79
13%
30-392
5%
Total = 39

69
CLASSIFIED SUPPORT AGE RANGE – FALL 2009
21-29419% 30-39
7716%
40-4912326%
50-5914130%
60-6979
17%
80-901
<1%70-79
112%
Total = 473

70
40-4971
23%
60-6987
28%
50-5911538%
30-39289%
80-901
<1%
21-291
<1%70-79
72%
FULL-TIME FACULTY AGE RANGE – FALL 2009
Total = 310

71
30-3920821%
40-4923223%
60-6920520%
80-909
1%21-29
475%
70-79434%
50-5926426%
Total = 1,008
PART-TIME FACULTY AGE RANGE – FALL 2009
72
Appendix I: DIVERSITY INITIATIVES

73
Diversity Initiatives:
People Admin ServicesPeople Admin Services is an applicant data tracking system that allows applicants for
certificated positions to apply online. This system will allow screening committees to log on to a secure website to view a specific group of position applicant information during the screening process. This will greatly minimize paper production. Also, it is believed that the new online system will portend an increase in ease of application, encourage race/ethnicity identification, and possibly result in larger, and perhaps more diverse, applicant pools.
District Equal Employment Opportunity PlanThe California Community College Chancellor’s Office requires each community college
district to develop an Equal Employment Opportunity Plan which shall address specific items relevant to how the District satisfies its commitment to equal employment opportunity in classified and certificated hiring.
Section 53003(a) of Title 5 requires the governing board of each community college district to develop and adopt a district-wide written equal employment opportunity plan to implement its equal employment opportunity program. Currently, the document is being drafted and reviewed by the District Planning and Policy (DPAC) Human Resources Subcommittee. DPAC-HR is staffed by members of each college constituent group, including students. The Plan is expected to be completed and presented to the Board for adoption within the next few months.

74
Diversity Initiatives, continued:
SMC Team Diversity
Using District Diversity funds, a diverse 10 member team of faculty, staff, managers and administrators attended the 22nd annual NCOJRE (National Conference on Race and Ethnicity) this past May in San Diego, California. The attendants were informed prior to attendance that by attending the conference, the District would expect them to participate in the District’s diversity efforts. As a result, the team, now called SMC Team Diversity has held regular meetings to discuss diversity initiatives for the College. The team will be expanded to include additional college membership. For example, the College Psychologists have been asked to assist the team with developing relevant topics for discussion and diversity exercises to move the College toward cultural proficiency.
The members of the SMC Team Diversity will also play a key role in the planning and execution of the College-wide Diversity/Inclusivity Training that is being planned for the College and is discussed below. The Team’s role will be as informed colleagues who can provide support, leadership and assistance to the consulting team as needed, in helping to advance pertinent concepts and individual growth in addressing diversity issues.
College-wide Diversity/Inclusivity Training
Santa Monica College will undertake development and implementation of college-wide diversity and inclusivity experiences and training for all employee groups. With the advice and assistance of a to-be-determined consulting group, fueled in combination with the buy-in of faculty, staff and senior leadership, each College employee group will participate in a program of intensive diversity learning experiences and training. This initiative is driven by the College’s long-standing and documented commitment to incorporating diversity into its vision, mission, operational goals and outcomes. In recognition of documented projections of increased diversity countywide and statewide, it is the College’s objective to position itself to be a leader in meeting the diverse needs of its applicants, employees, students and communities in a manner consistent with 21st century mandates.