santa clara valley, california - usgs · of downtown san jose), ... santa clara valley, california...
TRANSCRIPT
A case of arrested subsidence
S.E. Ingebritsen and David R. JonesU.S. Geological Survey, Menlo Park, California
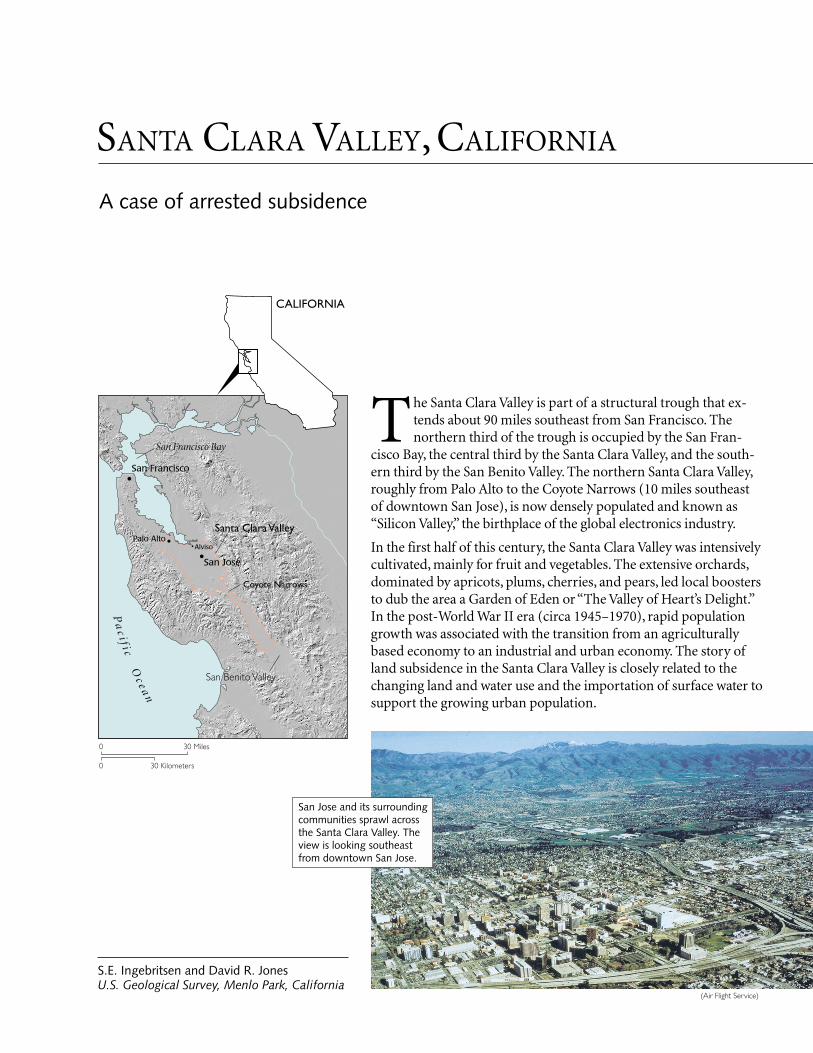
The Santa Clara Valley is part of a structural trough that ex-tends about 90 miles southeast from San Francisco. Thenorthern third of the trough is occupied by the San Fran-
cisco Bay, the central third by the Santa Clara Valley, and the south-ern third by the San Benito Valley. The northern Santa Clara Valley,roughly from Palo Alto to the Coyote Narrows (10 miles southeastof downtown San Jose), is now densely populated and known as“Silicon Valley,” the birthplace of the global electronics industry.
In the first half of this century, the Santa Clara Valley was intensivelycultivated, mainly for fruit and vegetables. The extensive orchards,dominated by apricots, plums, cherries, and pears, led local boostersto dub the area a Garden of Eden or “The Valley of Heart’s Delight.”In the post-World War II era (circa 1945–1970), rapid populationgrowth was associated with the transition from an agriculturallybased economy to an industrial and urban economy. The story ofland subsidence in the Santa Clara Valley is closely related to thechanging land and water use and the importation of surface water tosupport the growing urban population.
San Jose and its surroundingcommunities sprawl acrossthe Santa Clara Valley. Theview is looking southeastfrom downtown San Jose.
Santa Clara Valley
San Francisco
San Jose
Palo Alto
San Francisco Bay
Alviso
Pa
c i f i cO
c e an
San Benito Valley
Coyote Narrows
0 30 Miles
0 30 Kilometers
CALIFORNIA
(Air Flight Service)
SANTA CLARA VALLEY, CALIFORNIA
Mining Ground Water16
The Santa Clara Valley was the first area in the United States whereland subsidence due to ground-water withdrawal was recognized(Tolman and Poland,1940). It was also the first area where orga-nized remedial action was undertaken, and subsidence was effec-tively halted by about 1969. The ground-water resource is stillheavily used, but importation of surface water has reduced ground-water pumping and allowed an effective program of ground-waterrecharge that prevents ground-water levels from approaching thehistoric lows of the 1960s. The unusually well-coordinated and ef-fective conjunctive use of surface water and ground water in theSanta Clara Valley is facilitated by the fact that much of the Valley isserved by a single water-management agency, the Santa Clara Val-ley Water District.
GROUND-WATER PUMPING SUPPLIED ORCHARDS AND,EVENTUALLY, CITIES
The moderate climate of the Santa Clara Valley has distinct wet anddry periods. During the wet season (November to April), averagerainfall ranges from a high of about 40 inches in the low, steepmountain ranges to the southwest to a low of about 14 inches onthe valley floor—rates that are generally insufficient to supportspecialty crops. Early irrigation efforts depended upon local diver-sions of surface water, but the acreage that could be irrigated in thismanner was very limited. By the 1860s, wells were in common use.
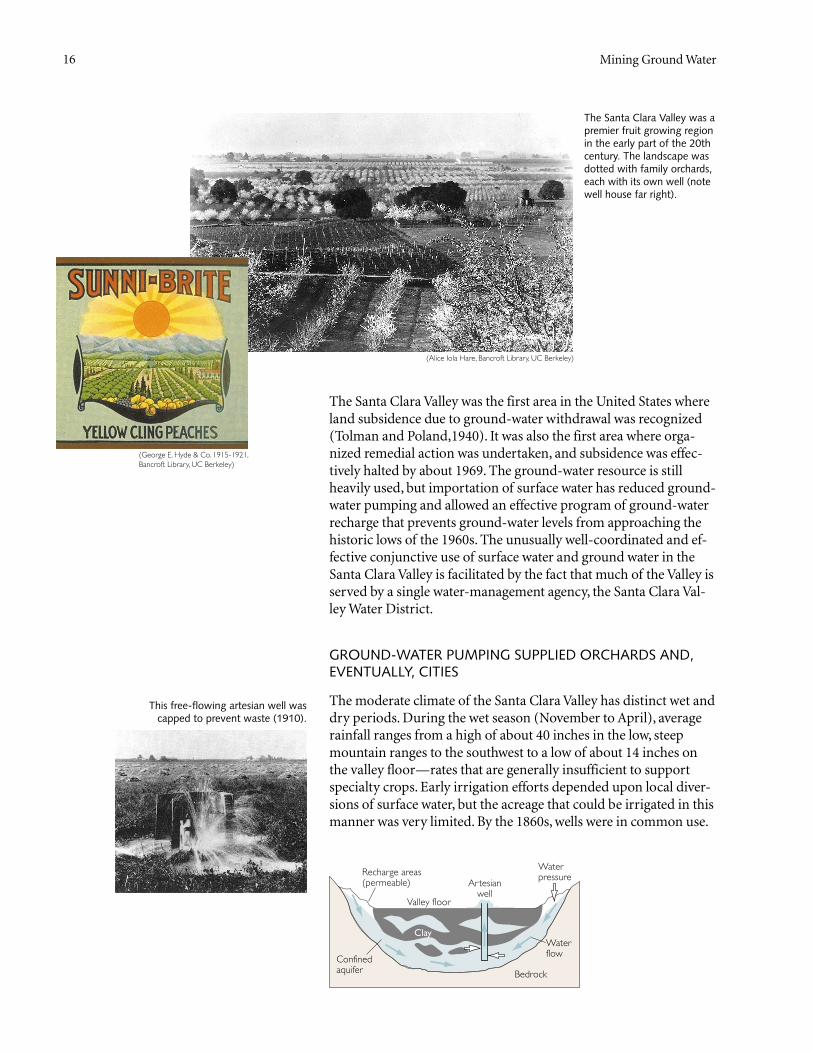
The Santa Clara Valley was apremier fruit growing regionin the early part of the 20thcentury. The landscape wasdotted with family orchards,each with its own well (notewell house far right).
(Alice Iola Hare, Bancroft Library, UC Berkeley)
(George E. Hyde & Co. 1915-1921,Bancroft Library, UC Berkeley)
This free-flowing artesian well wascapped to prevent waste (1910).
Artesianwell
Valley floor
Recharge areas (permeable)
Waterpressure
Waterflow
Confinedaquifer Bedrock
Clay
Santa Clara Valley, California 17
In the late 1800s construction of railroads,refrigerator cars, and improved canningtechniques gave farmers access to the grow-ing California and eastern markets for per-ishable crops. The planting of orchards andassociated ground-water pumping increasedrapidly into the 1900s.
In the late 1880s most wells in the area be-tween downtown San Jose and Alviso andalong the Bay northwest and northeast ofAlviso were artesian. That is, water flowed
freely without needing to be pumped. In fact, there was substantialwaste of ground water from uncapped artesian wells. The wide-spread artesian conditions were due to the natural hydrogeology ofthe Santa Clara Valley. Water levels in the artesian wells rose abovethe land surface because they tapped confined aquifers that havepermeable connections to higher-elevation recharge areas on theflanks of the Valley but are overlain by low-permeability clay layers.
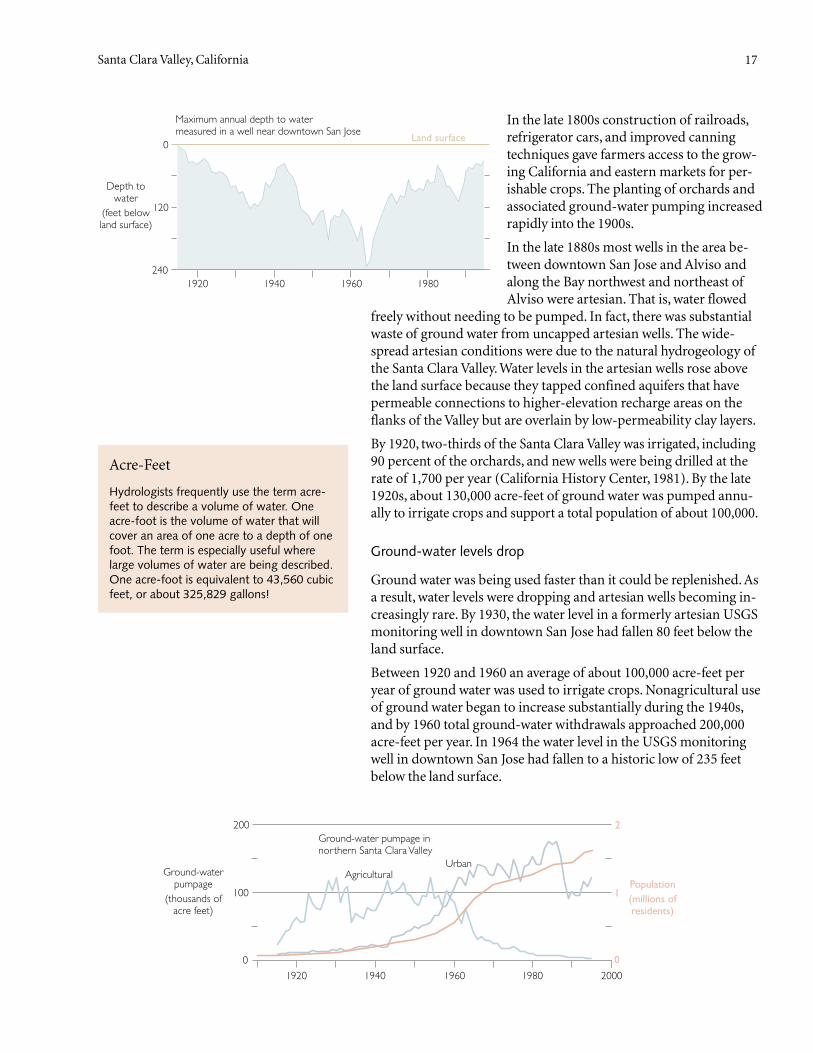
By 1920, two-thirds of the Santa Clara Valley was irrigated, including90 percent of the orchards, and new wells were being drilled at therate of 1,700 per year (California History Center, 1981). By the late1920s, about 130,000 acre-feet of ground water was pumped annu-ally to irrigate crops and support a total population of about 100,000.
Ground-water levels drop
Ground water was being used faster than it could be replenished. Asa result, water levels were dropping and artesian wells becoming in-creasingly rare. By 1930, the water level in a formerly artesian USGSmonitoring well in downtown San Jose had fallen 80 feet below theland surface.
Between 1920 and 1960 an average of about 100,000 acre-feet peryear of ground water was used to irrigate crops. Nonagricultural useof ground water began to increase substantially during the 1940s,and by 1960 total ground-water withdrawals approached 200,000acre-feet per year. In 1964 the water level in the USGS monitoringwell in downtown San Jose had fallen to a historic low of 235 feetbelow the land surface.
Hydrologists frequently use the term acre-feet to describe a volume of water. Oneacre-foot is the volume of water that willcover an area of one acre to a depth of onefoot. The term is especially useful wherelarge volumes of water are being described.One acre-foot is equivalent to 43,560 cubicfeet, or about 325,829 gallons!
Acre-Feet
240
120
0
1920 1940 1960 1980
Depth towater
(feet belowland surface)
Maximum annual depth to water measured in a well near downtown San Jose
Land surface
0
100
200
1920 1940 1960 1980 2000
Ground-waterpumpage
(thousands ofacre feet)
Agricultural
Ground-water pumpage innorthern Santa Clara Valley
Urban
0
1
2
Population(millions ofresidents)
Mining Ground Water18
San Jose
Alviso
Sunnyvale
Mountain View
Santa Clara
Palo Alto
8
6
4
2
0.5
1.0
0.1
Gu
a
da
lu
pe
R.
Co
yo
te
Cr.
Coyo
te
C
r.
0 5 Miles
0 5 KilometersLand-surface altitude (feet above sea level)
San Francisco Bay
1000
1000
400400
2000
2000
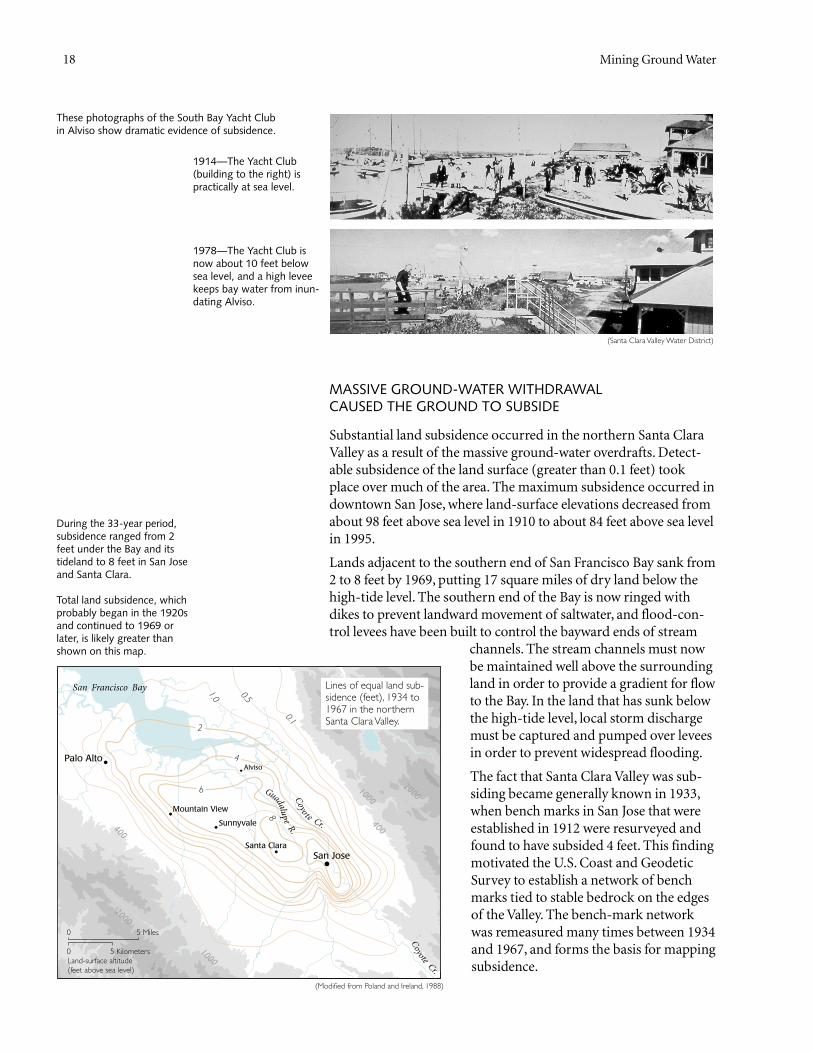
Lines of equal land sub-sidence (feet), 1934 to1967 in the northern Santa Clara Valley.
MASSIVE GROUND-WATER WITHDRAWALCAUSED THE GROUND TO SUBSIDE
Substantial land subsidence occurred in the northern Santa ClaraValley as a result of the massive ground-water overdrafts. Detect-able subsidence of the land surface (greater than 0.1 feet) tookplace over much of the area. The maximum subsidence occurred indowntown San Jose, where land-surface elevations decreased fromabout 98 feet above sea level in 1910 to about 84 feet above sea levelin 1995.
Lands adjacent to the southern end of San Francisco Bay sank from2 to 8 feet by 1969, putting 17 square miles of dry land below thehigh-tide level. The southern end of the Bay is now ringed withdikes to prevent landward movement of saltwater, and flood-con-trol levees have been built to control the bayward ends of stream
channels. The stream channels must nowbe maintained well above the surroundingland in order to provide a gradient for flowto the Bay. In the land that has sunk belowthe high-tide level, local storm dischargemust be captured and pumped over leveesin order to prevent widespread flooding.
The fact that Santa Clara Valley was sub-siding became generally known in 1933,when bench marks in San Jose that wereestablished in 1912 were resurveyed andfound to have subsided 4 feet. This findingmotivated the U.S. Coast and GeodeticSurvey to establish a network of benchmarks tied to stable bedrock on the edgesof the Valley. The bench-mark networkwas remeasured many times between 1934and 1967, and forms the basis for mappingsubsidence.
These photographs of the South Bay Yacht Clubin Alviso show dramatic evidence of subsidence.
1914—The Yacht Club(building to the right) ispractically at sea level.
1978—The Yacht Club isnow about 10 feet belowsea level, and a high leveekeeps bay water from inun-dating Alviso.
During the 33-year period,subsidence ranged from 2feet under the Bay and itstideland to 8 feet in San Joseand Santa Clara.
Total land subsidence, whichprobably began in the 1920sand continued to 1969 orlater, is likely greater thanshown on this map.
(Santa Clara Valley Water District)
(Modified from Poland and Ireland, 1988)
Santa Clara Valley, California 19
Subsidence had to be stopped
In 1935 and 1936, the Santa Clara Valley Water District built fivestorage dams on local streams to capture storm flows. This permit-ted controlled releases to increase ground-water recharge throughstreambeds. Wet years in the early 1940s enhanced both natural andartificial recharge. Although subsidence was briefly arrested duringWorld War II, these measures proved inadequate to halt water-leveldeclines over the long term, and, between 1950 and 1965, subsidenceresumed at an accelerated rate. In 1965, increased imports of surfacewater allowed the Santa Clara Valley Water District to greatly expandits program of ground-water recharge, leading to substantial recov-ery of ground-water levels, and there has been little additional sub-sidence since about 1969.
In fact, as of 1995, water levels in the USGS monitoring well indowntown San Jose were only 35 feet below land surface, the highestlevels observed since the early 1920s. A series of relatively wet yearsin the mid-1990s even caused a return to artesian conditions insome areas near San Francisco Bay. Some capped and long-forgottenwells near the Bay began to leak and were thereby rediscovered!
Subsidence in the Santa Clara Valley was caused by the decline of ar-tesian pressures and the resulting increase in the effective overbur-den load on the water-bearing sediments. The sediments compactedunder the increasing stress and the land surface sank. Most of thecompaction occurred in fine-grained clay deposits (aquitards),which are more compressible, though less permeable, than coarser-grained sediments. The low permeability of the clay layers retardsand smooths the compaction of the aquifer system relative to thewater-level variations in the permeable aquifers. Since 1969, despitewater-level recoveries, a small amount of additional residual com-
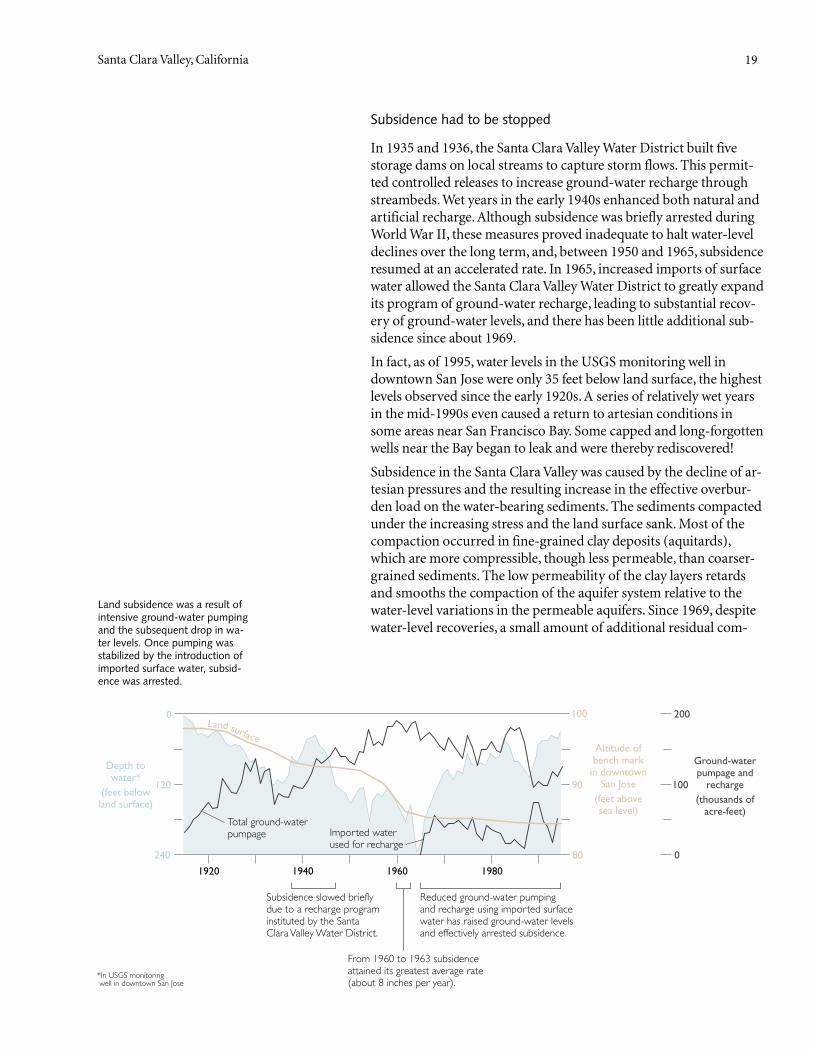
Land subsidence was a result ofintensive ground-water pumpingand the subsequent drop in wa-ter levels. Once pumping wasstabilized by the introduction ofimported surface water, subsid-ence was arrested.
100
90
80
200
100
0
Ground-waterpumpage and
recharge(thousands of
acre-feet)
Altitude ofbench mark
in downtownSan Jose
(feet abovesea level)
Total ground-waterpumpage Imported water
used for recharge
Reduced ground-water pumping and recharge using imported surface water has raised ground-water levels and effectively arrested subsidence.
1920 1940 1960 1980
Subsidence slowed briefly due to a recharge program instituted by the Santa Clara Valley Water District.
From 1960 to 1963 subsidence attained its greatest average rate (about 8 inches per year).
240
120
0
Depth towater*
(feet belowland surface)
*In USGS monitoring well in downtown San Jose
Land surface
Mining Ground Water20
paction and subsidence has accrued. The total subsidence has beenlarge and chiefly permanent, but future subsidence can be con-trolled if ground-water levels are maintained safely above their sub-sidence thresholds.
Surface water is delivered for use in the Valley
To balance Santa Clara Valley’s water-use deficit, surface water hasbeen imported from northern and eastern California via aque-ducts—Hetch Hetchy (San Francisco Water Department, 1951-),the California State Water Project (1965-), and the Federal SanFelipe Water Project (1987-). Much of the imported water alsofeeds into various local distribution lines. But presently about one-fourth of the water imported by the Santa Clara Valley Water Dis-trict (about 40,000 of the 150,000 acre-feet total) is used forground-water recharge.
The aquifer systems are used for natural storage and conveyance, inpreference to constructing expensive surface-storage and convey-ance systems. In order to avoid recurrence of the land subsidencethat plagued the Valley prior to 1969, ground-water levels are main-tained well above their historic lows, even during drought periods.For example, ground-water levels beneath downtown San Josewere maintained even during the major California droughts of1976–77 and 1987–91. In order to avoid large ground-water over-drafts, the Water District aggressively encourages water conserva-tion during drought periods. Per-capita water use under currentconditions is much lower than in the agrarian past. Today, about350,000 acre-feet of surface and ground water meet the annual re-quirements of a countywide population of about 1,600,000, andper-capita water use is only about one-fifth of the 1920 level.
The economic impact can only be approximated
The direct costs of land subsidence in the Santa Clara Valley in-clude the cost of constructing levees around the southern end ofSan Francisco Bay and the bayward ends of stream channels, main-
The South Bay aqueductconveys water from the Sac-ramento-San Joaquin Deltato the Santa Clara Valley.
(Santa Clara Valley Water District)
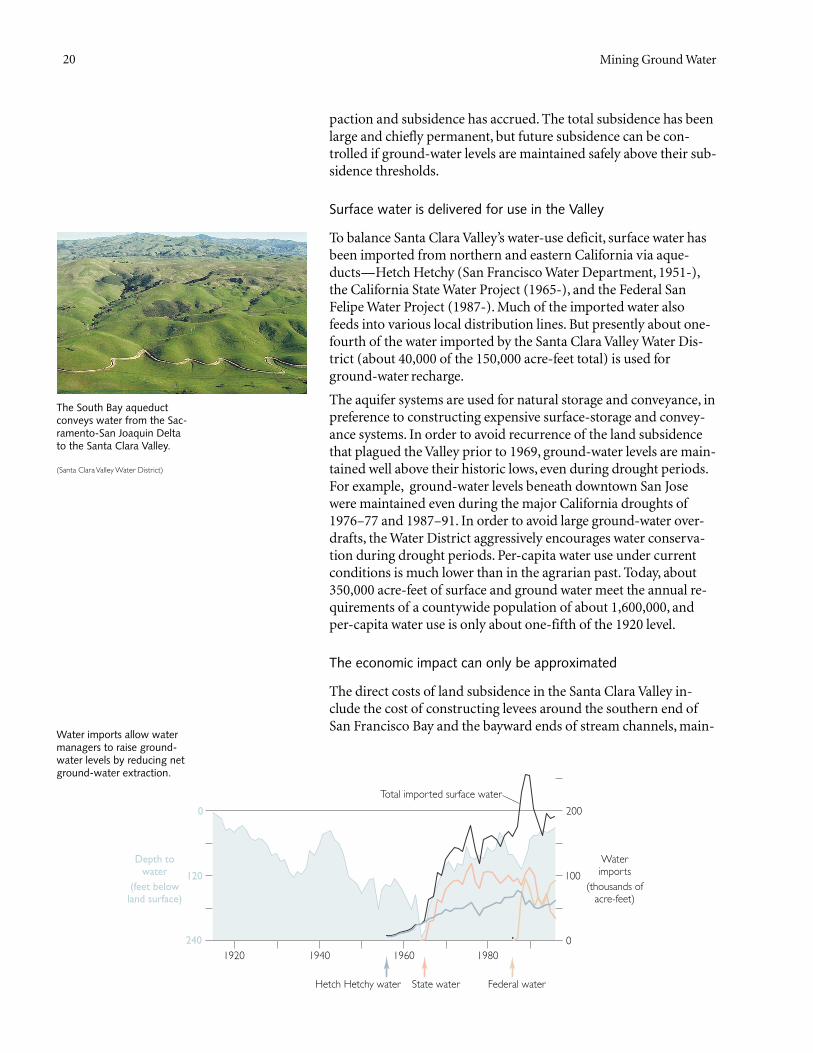
Water imports allow watermanagers to raise ground-water levels by reducing netground-water extraction.
200
100
0
Waterimports
(thousands ofacre-feet)
Total imported surface water
240
120
0
1920 1940 1960 1980
Depth towater
(feet belowland surface)
Federal waterState waterHetch Hetchy water
Santa Clara Valley, California 21
Alviso
Palo Alto
San Francisco Bay
South Bay Aqueduct
Co
yo
te
Cr
.
River
Gu
ad
alu
pe
Anderson Res.
San Jose
Lexington
Res.
Guadalupe Res.
Almaden Res.
Calero Res.
Uvas Res.
Chesbro Res.
Vasona Res.
Coyote Res.
Stevens Cr. Res.
Lo
sG
ato
s
Cr.
Peniten
ciaC r.
0 5 Miles
0 5 Kilometers
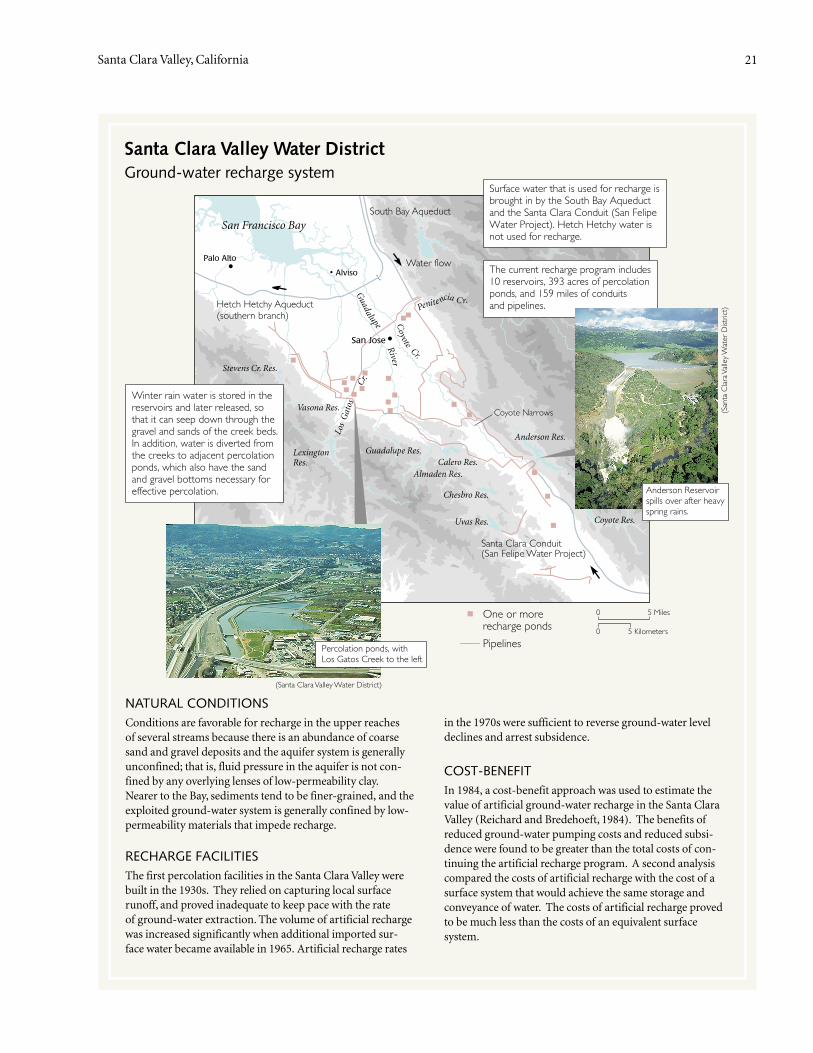
Santa Clara Valley Water DistrictGround-water recharge system
The current recharge program includes 10 reservoirs, 393 acres of percolation ponds, and 159 miles of conduitsand pipelines.
Surface water that is used for recharge is brought in by the South Bay Aqueductand the Santa Clara Conduit (San FelipeWater Project). Hetch Hetchy water isnot used for recharge.
Winter rain water is stored in the reservoirs and later released, sothat it can seep down through the gravel and sands of the creek beds.In addition, water is diverted from the creeks to adjacent percolation ponds, which also have the sand and gravel bottoms necessary for effective percolation.
NATURAL CONDITIONSConditions are favorable for recharge in the upper reaches of several streams because there is an abundance of coarse sand and gravel deposits and the aquifer system is generally unconfined; that is, fluid pressure in the aquifer is not con-fined by any overlying lenses of low-permeability clay. Nearer to the Bay, sediments tend to be finer-grained, and the exploited ground-water system is generally confined by low-permeability materials that impede recharge.
RECHARGE FACILITIESThe first percolation facilities in the Santa Clara Valley were built in the 1930s. They relied on capturing local surface runoff, and proved inadequate to keep pace with the rate of ground-water extraction. The volume of artificial rechargewas increased significantly when additional imported sur-face water became available in 1965. Artificial recharge rates
in the 1970s were sufficient to reverse ground-water level declines and arrest subsidence.
COST-BENEFITIn 1984, a cost-benefit approach was used to estimate the value of artificial ground-water recharge in the Santa Clara Valley (Reichard and Bredehoeft, 1984). The benefits of reduced ground-water pumping costs and reduced subsi-dence were found to be greater than the total costs of con-tinuing the artificial recharge program. A second analysiscompared the costs of artificial recharge with the cost of a surface system that would achieve the same storage and conveyance of water. The costs of artificial recharge proved to be much less than the costs of an equivalent surfacesystem.
One or morerecharge ponds
PipelinesPercolation ponds, with Los Gatos Creek to the left
Anderson Reservoirspills over after heavy spring rains.
Water flow
Coyote Narrows
Santa Clara Conduit(San Felipe Water Project)
Hetch Hetchy Aqueduct(southern branch)
(Santa Clara Valley Water District)
(San
ta C
lara
Val
ley
Wat
er D
istric
t)
Mining Ground Water22
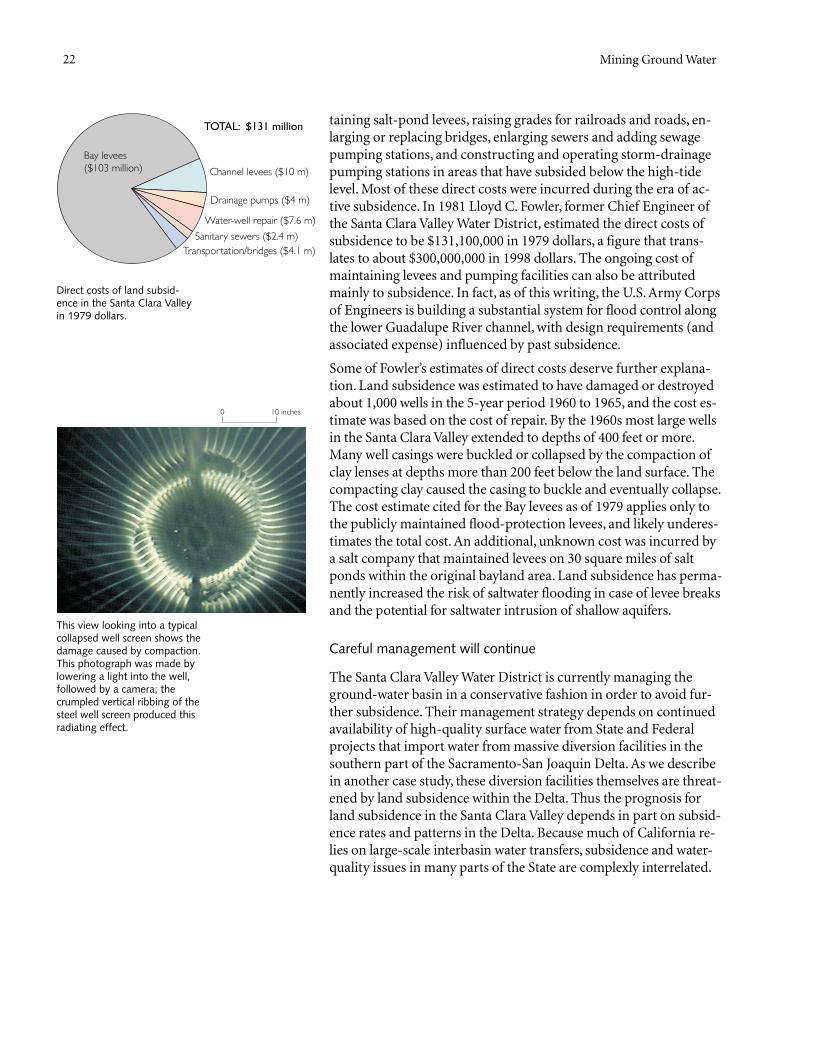
taining salt-pond levees, raising grades for railroads and roads, en-larging or replacing bridges, enlarging sewers and adding sewagepumping stations, and constructing and operating storm-drainagepumping stations in areas that have subsided below the high-tidelevel. Most of these direct costs were incurred during the era of ac-tive subsidence. In 1981 Lloyd C. Fowler, former Chief Engineer ofthe Santa Clara Valley Water District, estimated the direct costs ofsubsidence to be $131,100,000 in 1979 dollars, a figure that trans-lates to about $300,000,000 in 1998 dollars. The ongoing cost ofmaintaining levees and pumping facilities can also be attributedmainly to subsidence. In fact, as of this writing, the U.S. Army Corpsof Engineers is building a substantial system for flood control alongthe lower Guadalupe River channel, with design requirements (andassociated expense) influenced by past subsidence.
Some of Fowler’s estimates of direct costs deserve further explana-tion. Land subsidence was estimated to have damaged or destroyedabout 1,000 wells in the 5-year period 1960 to 1965, and the cost es-timate was based on the cost of repair. By the 1960s most large wellsin the Santa Clara Valley extended to depths of 400 feet or more.Many well casings were buckled or collapsed by the compaction ofclay lenses at depths more than 200 feet below the land surface. Thecompacting clay caused the casing to buckle and eventually collapse.The cost estimate cited for the Bay levees as of 1979 applies only tothe publicly maintained flood-protection levees, and likely underes-timates the total cost. An additional, unknown cost was incurred bya salt company that maintained levees on 30 square miles of saltponds within the original bayland area. Land subsidence has perma-nently increased the risk of saltwater flooding in case of levee breaksand the potential for saltwater intrusion of shallow aquifers.
Careful management will continue
The Santa Clara Valley Water District is currently managing theground-water basin in a conservative fashion in order to avoid fur-ther subsidence. Their management strategy depends on continuedavailability of high-quality surface water from State and Federalprojects that import water from massive diversion facilities in thesouthern part of the Sacramento-San Joaquin Delta. As we describein another case study, these diversion facilities themselves are threat-ened by land subsidence within the Delta. Thus the prognosis forland subsidence in the Santa Clara Valley depends in part on subsid-ence rates and patterns in the Delta. Because much of California re-lies on large-scale interbasin water transfers, subsidence and water-quality issues in many parts of the State are complexly interrelated.
Direct costs of land subsid-ence in the Santa Clara Valleyin 1979 dollars.
This view looking into a typicalcollapsed well screen shows thedamage caused by compaction.This photograph was made bylowering a light into the well,followed by a camera; thecrumpled vertical ribbing of thesteel well screen produced thisradiating effect.
0 10 inches
Bay levees($103 million) Channel levees ($10 m)
Drainage pumps ($4 m)
Water-well repair ($7.6 m)
Sanitary sewers ($2.4 m)Transportation/bridges ($4.1 m)
TOTAL: $131 million