santa clara nexus study 07-06-2018
TRANSCRIPT

Santa Clara Traffic Impact Fee Nexus Study AB 1600 Traffic Mitigation Program Update
Prepared for:
City of Santa Clara
July 5, 2018
Hexagon Transportation Consultants, Inc. Hexagon Office: 4 North Second Street, Suite 400
San Jose, CA 95113
Hexagon Job Number: 17JC02
Phone: 408.971.6100

Traffic Impact Fee Nexus Study July 5, 2018
Table of Contents
Executive Summary ................................................................................................................................... i 1. Introduction ..................................................................................................................................... 1 2. Projected Growth and Its Impacts ................................................................................................... 5 3. Traffic Impact Fee Improvements ................................................................................................. 10 4. Options for Phase D Program ....................................................................................................... 13 5. Proposed Impact Fee Program ..................................................................................................... 17
List of Tables
Table ES 1 Impact Fees per PM Peak Hour Trip for Five Options ...................................................... iii Table ES 2 Impact Fees for Common Land Uses for Five Options………………………………………iv
Table 1 Existing and Future Intersection Levels of Service ............................................................. 7-9 Table 2 Traffic Mitigation Program Improvements - Phase D ........................................................... 12 Table 3 Projected Increase in PM Peak Hour Trips….……………………………………….…………15 Table 4 Impact Fees per PM Peak Hour Trip ................................................................................... 16 Table 5 Impact Fee Amounts for Common Land Uses Under Five Options ..................................... 19
List of Figures
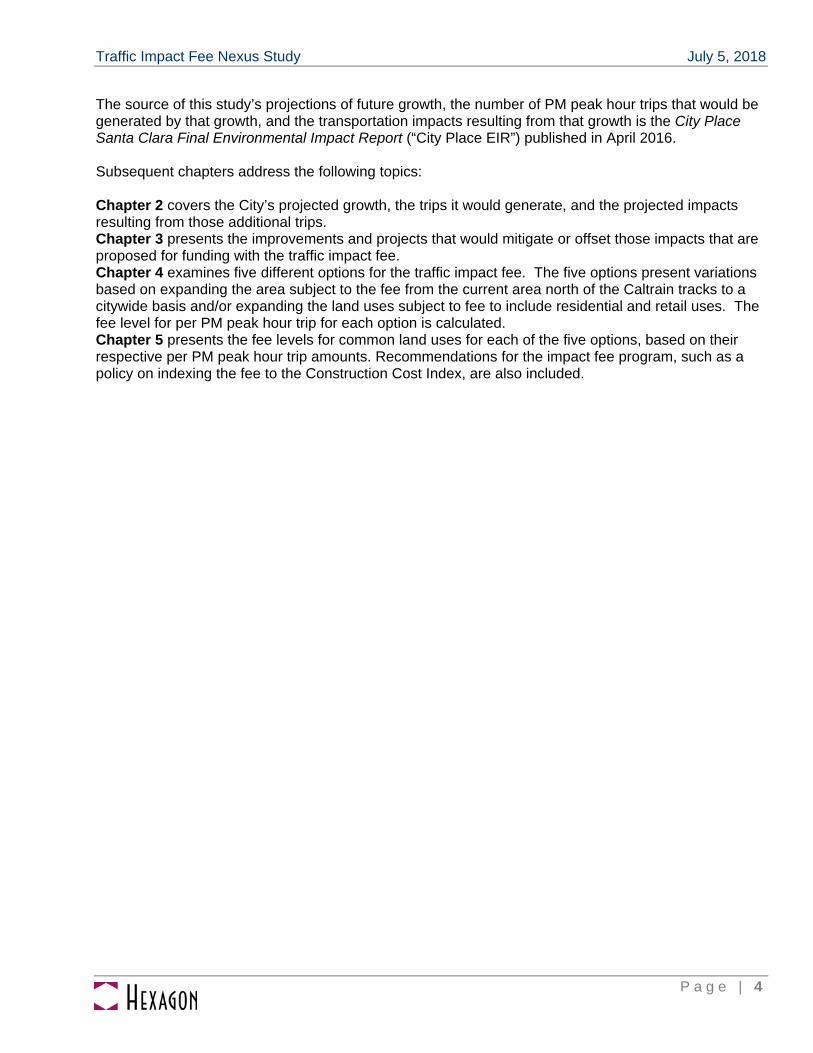
Figure 1 Traffic Mitigation Impact Fee Area Map…………………………………………………………..2

Traffic Impact Fee Nexus Study July 5, 2018
P a g e | i
Executive Summary
This report presents the results of an AB 1600 nexus study prepared to update the City of Santa Clara’s existing traffic impact fee program. The City of Santa Clara established its Traffic Mitigation Program, including impact fees, in 1988, and has revised it several times since then. This revision will be referred to as Phase D of that program. The purpose of this study is to allow the City to make the necessary findings in accordance with AB 1600 in order to revise its Traffic Mitigation Program (TMP). The City currently only charges traffic impact fees in the portion of the City that is north of the Caltrain tracks. The most recent modification to the fees charged in the Traffic Mitigation Program was in 2010. The rates approved at that time and still in effect today are as follows:
Office and R&D: $1.00 per square foot
Industrial: $0.67 per square foot
Warehousing, Utilities and Communications: $0.20 per square foot
Hotel/Motel: $400.00 per room
Projected Growth and Its Impacts
The source of this study’s projections of future growth, the number of PM peak hour trips that would be generated by that growth, and the transportation impacts resulting from that growth is the City Place Santa Clara Final Environmental Impact Report (“City Place EIR”) published in April 2016. This nexus study is based on the Cumulative Plus Project scenario of that EIR, which includes growth projections for the year 2040 for the entire region, including all of Santa Clara, as well as the City Place project. The travel demand forecasting model used in the City Place EIR projected an additional 31,520 PM peak hour trips with origins and/or destinations in Santa Clara, compared with existing conditions.
This nexus study presents the level of service analysis for 60 signalized study intersections from the City Place EIR. Of the 60 intersections, there are 38 intersections that would operate at an unacceptable level of service. Of those 38 intersections, City Place is 100% responsible for implementing or paying for the mitigation measures that have been identified for 17 of them. Thus, there will be no need to use impact fees for improvements at those 17 intersections.
Traffic Impact Fee Improvements
The City has proposed a very broad range of improvements in its list of projects to mitigate or offset, to the extent feasible, the impacts of increased congestion caused by future growth. Projects that were previously included in the City’s Traffic Mitigation Program but have not yet been completed are carried

Traffic Impact Fee Nexus Study July 5, 2018
P a g e | i i
forward and included on the list. New projects include capacity enhancements at specific locations, projects that would improve traffic operations, and improvements designed to improve bicycle and pedestrian facilities and increase alternative mode use. The development of a balanced multimodal transportation network is consistent with the City’s General Plan and Climate Action Plan.
Improvements proposed for funding through the City’s Multimodal Improvement Plan (MIP), which is being prepared in parallel with this nexus study and contemplates establishing a separate impact fee, are not included in the TMP project list.
The total cost of the improvements is $59,989,268, and the amount to be funded with TMP impact fees could be up to $52,289,075, which leaves a minimum of $7,700,193 to be funded by the City. After deducting the impact fees that have already been expended on these projects and the current balance of traffic impact fees held by the City, the amount needed from future impact fees in order to complete the projects is up to $37,223,018.
Options for Phase D Traffic Mitigation Program
The basis of Santa Clara’s traffic impact fee is the number of net new PM peak hour vehicle trips generated by new development. Those additional trips result in the traffic impacts the fee is intended to mitigate. The fee is calculated by dividing the total cost of the projects in the Traffic Mitigation Program by the number of additional PM peak hour trips generated by new development, which results in a “per PM peak hour trip” fee amount.
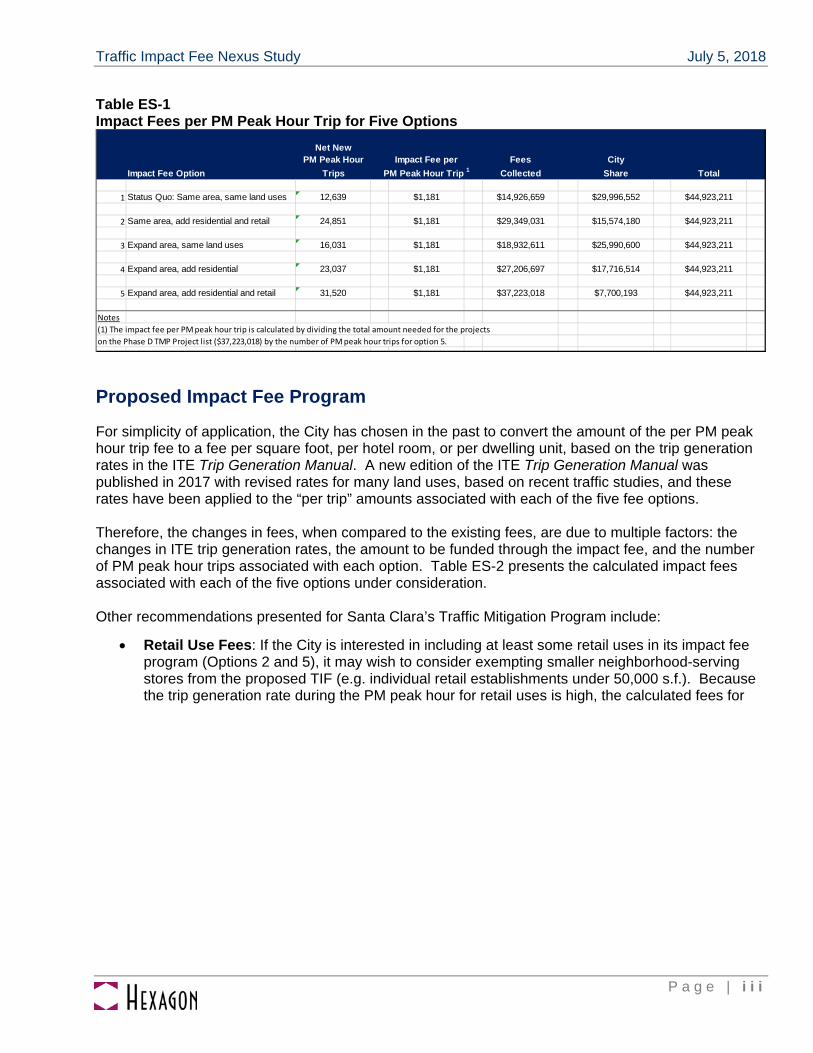
This nexus study examines the following five options for revising the Traffic Mitigation Program: Option 1: Status Quo. Continue to charge a TIF only north of the Caltrain tracks and on the same land uses that are currently subject to the fee. No expansion of area or land uses subject to the TIF. Option 2: Same area plus residential and retail. Continue to charge the TIF only north of the Caltrain tracks. Expand the land uses subject to the TIF to include residential and retail development. Option 3: Citywide and existing land uses only. Expand the area subject to the TIF to the entire city, but continue to exempt both residential and retail uses from the TIF. Option 4: Citywide plus residential. Expand the area subject to the TIF to the entire city, and expand the land uses subject to the TIF to include residential development. Option 5: Citywide plus residential and retail. Expand the area subject to the TIF to the entire city, and expand the land uses subject to the TIF to include residential and retail development. Using the travel demand forecasting model that was used in the City Place EIR, the number of PM peak hour trips associated with each of the five options was estimated. Table ES-1 presents the number of additional PM peak hour trips associated with each of the five impact fee options under consideration. The impact fee amount “per PM peak hour trip” was calculated based on Option 5, which establishes a citywide nexus between the number of trips and the cost of improvements. If the impact fee is charged to only a subset of land uses or in just part of the City, the amount collected would be less, and the City share of the improvement costs would increase.
Traffic Impact Fee Nexus Study July 5, 2018
P a g e | i i i
Table ES-1 Impact Fees per PM Peak Hour Trip for Five Options
Proposed Impact Fee Program
For simplicity of application, the City has chosen in the past to convert the amount of the per PM peak hour trip fee to a fee per square foot, per hotel room, or per dwelling unit, based on the trip generation rates in the ITE Trip Generation Manual. A new edition of the ITE Trip Generation Manual was published in 2017 with revised rates for many land uses, based on recent traffic studies, and these rates have been applied to the “per trip” amounts associated with each of the five fee options. Therefore, the changes in fees, when compared to the existing fees, are due to multiple factors: the changes in ITE trip generation rates, the amount to be funded through the impact fee, and the number of PM peak hour trips associated with each option. Table ES-2 presents the calculated impact fees associated with each of the five options under consideration. Other recommendations presented for Santa Clara’s Traffic Mitigation Program include:
Retail Use Fees: If the City is interested in including at least some retail uses in its impact fee program (Options 2 and 5), it may wish to consider exempting smaller neighborhood-serving stores from the proposed TIF (e.g. individual retail establishments under 50,000 s.f.). Because the trip generation rate during the PM peak hour for retail uses is high, the calculated fees for
Net NewPM Peak Hour Impact Fee per Fees City
Impact Fee Option Trips PM Peak Hour Trip 1 Collected Share Total
1 Status Quo: Same area, same land uses 12,639 $1,181 $14,926,659 $29,996,552 $44,923,211
2 Same area, add residential and retail 24,851 $1,181 $29,349,031 $15,574,180 $44,923,211
3 Expand area, same land uses 16,031 $1,181 $18,932,611 $25,990,600 $44,923,211
4 Expand area, add residential 23,037 $1,181 $27,206,697 $17,716,514 $44,923,211
5 Expand area, add residential and retail 31,520 $1,181 $37,223,018 $7,700,193 $44,923,211
Notes
(1) The impact fee per PM peak hour trip is calculated by dividing the total amount needed for the projects
on the Phase D TMP Project list ($37,223,018) by the number of PM peak hour trips for option 5.

Traffic Impact Fee Nexus Study July 5, 2018
P a g e | i v
Table ES 2 Impact Fees for Common Land Uses for Five Options
ITE ITE TripLand Use Generation Unit of Current
Land Use Category Rate 1 Measure Impact Fee 1 2 3 4 5
Impact Fee per PM Peak Hour Trip $1,181 $1,181 $1,181 $1,181 $1,181
Office/R&D 710 1.15 s.f. $1.00 $1.36 $1.36 $1.36 $1.36 $1.36
Industrial 110 0.63 s.f. $0.67 $0.74 $0.74 $0.74 $0.74 $0.74
Warehousing,Utilities,Communications 150 0.19 s.f. $0.20 $0.22 $0.22 $0.22 $0.22 $0.22
Hotel/Motel 310 0.60 Room $400.00 $708.60 $708.60 $708.60 $708.60 $708.60
Multi-Family Residential 2 221 0.44 d.u. n.a. n.a. $519.64 n.a. $519.64 $519.64
Single-Family Residential 210 0.99 d.u. n.a. n.a. $1,169.19 n.a. $1,169.19 $1,169.19
Retail 3 820 3.81 s.f. n.a. n.a. $4.50 n.a. n.a. $4.50City Share $33,383,000 $29,995,000 $15,578,000 $25,992,000 $17,721,000 $7,700,000
Notes:(1) All trip generation rates are average rates for the PM peak hour from Institute of Transportation Engineers, Trip Generation Manual, 10th Edition (2017). Rates for offices (710), industrial (110), warehousing (150), and retail (820) are per thousand square feet. Fee levels for these uses are provided per square foot for ease of comparison with the City's existing fees.(2) The City may exempt affordable housing (projects that are 100% BMR units and BMR units in excess of the City's requirement) from this fee.(3) The City may exempt retail projects under 50,000 s.f. from this fee.
TIF Options

Traffic Impact Fee Nexus Study July 5, 2018
P a g e | v
retail (as shown in Table ES-2) are correspondingly high. Because neighborhood-serving retail typically reduces Vehicle Miles Traveled (VMT) despite its high trip generation rate, and because retail generates sales tax for the City, Hexagon recommends an exemption for individual retail establishments below 50,000 s.f.. Many other cities in the region provide a similar exemption for smaller retail projects or reduce the impact fee rate that is charged on retail developments.
• Exempting Affordable Housing from the TIF: If the city is interested in including residential uses in the impact fee program (Options 2, 4, and 5), it may wish to consider an exemption for any affordable housing units built as part of a development as defined by City Code Section 17.40. The purpose of this exemption would be to encourage construction of affordable housing units in Santa Clara.
• Indexing the TIF: Since all of the improvements to be funded with the TIF are capital projects for which cost estimates will increase with time, indexing the TIF would allow the fees collected to also increase over time in order to keep up with construction costs. Without annual adjustments to keep pace with inflation, the impact fees collected over the years will not be sufficient to implement the Phase D projects without preparing a new nexus study to raise the rates. It is strongly recommended that the impact fee levels be automatically adjusted annually, subject to City Council approval prior to the start of each fiscal year, in line with the Construction Cost Index. Many other cities in the region adjust their traffic impact fees in accordance with the Construction Cost Index at the start of each fiscal year when they adopt a revised fee schedule for other municipal purposes.
• Applying the TIF to Vacant Parcels and on Changing Land Uses: If a site has been vacant for at least two years, then it is recommended that any new development project on that site be subject to the appropriate TIF, and that no credit for existing uses be given when calculating the TMP impact fee. Hexagon also recommends that the TIF be applied when the land use on a given parcel changes, due to the wide variation in trip generation rates for different uses. The TIF for changing land uses would be triggered when a permit for construction, a zoning change, or a conditional use permit is required.
• Meeting AB 1600 Requirements: The City should continue to follow the requirements of the Mitigation Fee Act (AB 1600) with regard to reporting annually on expenditures from the TIF fund (Fund 525 in the City Capital Improvement Budget) and making findings regarding a continuing need for any funds that are unexpended and uncommitted five or more years after deposit of such fees.
Traffic Impact Fee Nexus Study July 5, 2018
P a g e | 1
1. Introduction
This report presents the results of a nexus study prepared to update the City of Santa Clara’s existing traffic impact fee program. Development impact fees are commonly used throughout California to require new development to pay for the needs that it creates. The City of Santa Clara currently charges six development impact fees, for such purposes as traffic mitigation, sanitary sewers, storm drains, and parkland. The purpose of this study is to allow the City to make the necessary findings in order to revise its existing Traffic Mitigation Program.
Development Impact Fees in California
The Mitigation Fee Act (Government Code Sections 66000-66025) was originally enacted through Assembly Bill 1600 in 1987 and requires that a reasonable relationship (nexus) be established between the projects or mitigations to be funded by an impact fee and the impacts caused by new development. Impact fees are one-time fees that are charged by a local government agency and are distinct from taxes and special assessments. When imposing an impact fee as a condition of approval of a development project, a local agency must make the following findings:
Identify the purpose of the fee; Identify the use to which the fee is to be put; Determine how there is a reasonable relationship between the need for the public facility and
the type of development project on which the fee is imposed; Determine how there is a reasonable relationship between the amount of the fee and the cost of
the public facility or portion of the public facility attributable to the development on which the fee is imposed.
This study provides the necessary evidentiary basis to support these findings.
Traffic Mitigation Program History
The City of Santa Clara established a Traffic Mitigation Program (TMP) in 1988 in order to finance traffic improvements resulting from current and projected traffic demands. The initial phase of the TMP, known as Phase A, included two financing mechanisms. An assessment district was created to fund the share of traffic improvement costs associated with existing development (60 percent), while an impact fee was established to fund the share of traffic improvement costs associated with new development (40 percent). The traffic mitigation assessment district and impact fees were applied to the City’s primary growth area, which is north of the Caltrain tracks. Because of their beneficial effect on traffic conditions in the northern part of the City, residential and retail uses were not subject to traffic impact fees. The area subject to the City’s traffic impact fees, both in 1988 and today, is shown in Figure 1.

Santa Clara Traffic Mitigation Impact Fee
! Q) u C:
Tasman Dr
Scott Blvd
�,:�
�[
�C�ent"'=;=;ral E=xpwy�
____________j Kifer Rd
Monroe St
El Camino Real
Homestead Rd
·.:
Q) E
<(
Stevens Creek Blvd
LEGEND
D = Traffic Mitigation Impact Fee Area
,..........
........... W lXAGON hANl�Orn TION (ONIUL TANI\. I NC.
C: "'
Cl)
Figure 1
Traffic Mitigation Impact Fee Area Map
@ NORTH Notto Scale

Traffic Impact Fee Nexus Study July 5, 2018
P a g e | 3
In 1997, the City Council approved Phase B of the TMP, which continued the collection of impact fees at the same rates as established in Phase A in 1988. Assessment district levies were discontinued in Phase B as new development was expected to account for all of the traffic growth and associated needs for improvements.
In February 2009, the City Council approved Phase C of the TMP, which continued the imposition of traffic mitigation impact fees on new development at rates equal to those established in the previous phases. The City planned to use other sources of funding, such as fair share contributions from developers and local, state, and/or federal grants, to complete the funding of project costs.
In 2010, the City Council modified the impact fee rates charged to some land uses in order to be consistent with updated trip generation rates in the Institute of Transportation Engineers’ Trip Generation Manual, 8th Edition, 2008. The rates approved at that time and still in effect today are as follows:
Office and R&D: $1.00 per square foot
Industrial: $0.67 per square foot
Warehousing, Utilities and Communications: $0.20 per square foot
Hotel/Motel: $400.00 per room
The City may modify the Traffic Mitigation Program from time to time to increase or decrease fees, alter project schedules, modify, phase, delete or expand projects and modify the Program boundaries. As required by AB 1600, the City prepares an annual report on its development impact fees every year. According to the “AB 1600 Report on Development Impact Fees for Fiscal Year Ended June 30, 2017,” the ending balance in Fund 525 (where traffic impact fees are held) as of 6/30/2017 was $8,711,428. The city’s annual report for fiscal year ended 6/30/17 also noted that $2,404,289 had been held for over five years, but that those funds were committed to projects identified on the Traffic Mitigation Fee project list. AB 1600 requires cities to refund impact fees that are still unexpended or uncommitted five or more fiscal years after deposit of such fees. Because all of the traffic impact fees held more than five years have been appropriated to specific projects, those funds may be retained by the City.
Report Organization
The remainder of this report addresses the following steps in order to make the necessary findings for updating the City’s traffic impact fee program:
1. The level of future growth in Santa Clara in terms of residential dwelling units and new jobs is projected;
2. The number of PM peak hour vehicle trips that would be generated by that growth is estimated; 3. The transportation impacts or deficiencies caused by those additional PM peak hour trips are
identified; 4. Projects that would mitigate or offset those impacts or deficiencies to the extent feasible are
identified; 5. The cost of those projects is estimated; 6. A proposed impact fee to be charged to future growth is calculated.
Traffic Impact Fee Nexus Study July 5, 2018
P a g e | 4
The source of this study’s projections of future growth, the number of PM peak hour trips that would be generated by that growth, and the transportation impacts resulting from that growth is the City Place Santa Clara Final Environmental Impact Report (“City Place EIR”) published in April 2016. Subsequent chapters address the following topics: Chapter 2 covers the City’s projected growth, the trips it would generate, and the projected impacts resulting from those additional trips. Chapter 3 presents the improvements and projects that would mitigate or offset those impacts that are proposed for funding with the traffic impact fee. Chapter 4 examines five different options for the traffic impact fee. The five options present variations based on expanding the area subject to the fee from the current area north of the Caltrain tracks to a citywide basis and/or expanding the land uses subject to fee to include residential and retail uses. The fee level for per PM peak hour trip for each option is calculated. Chapter 5 presents the fee levels for common land uses for each of the five options, based on their respective per PM peak hour trip amounts. Recommendations for the impact fee program, such as a policy on indexing the fee to the Construction Cost Index, are also included.

Traffic Impact Fee Nexus Study July 5, 2018
P a g e | 5
2. Projected Growth and Its Impacts
This chapter describes the level of growth projected to occur in Santa Clara through the horizon year of 2040, the number of PM peak hour vehicle trips expected to be generated by that growth, and the transportation impacts resulting from those additional motor vehicle trips.
Projected Development and Increase in Peak Hour Vehicle Trips
The basis of this nexus study is the City Place EIR, which was comprehensive in scope and included a total of 125 study intersections in Santa Clara and adjacent jurisdictions. The projections of future conditions in that EIR were made with the VTA travel demand forecasting model, which is the best tool available for developing long-range traffic forecasts for Santa Clara and the surrounding jurisdictions, especially for very large projects such as City Place. The Cumulative with Project conditions scenario in the City Place EIR includes 2040 traffic volumes based on build-out of Santa Clara’s General Plan, build-out of the City Place project, ABAG 2040 land use projections, and the planned and funded transportation system improvements for 2040 in VTA’s Valley Transportation Plan. Existing conditions in the City Place EIR are represented by the year 2015, so the projected increases in residents, jobs, and vehicle trips are the difference between 2040 conditions and 2015 conditions.
The travel demand forecasting model estimated that there would be 22,846 new housing units, housing 61,394 new residents, and 63,897 new jobs in the City of Santa Clara under the Cumulative with Project scenario in the City Place EIR. The model projected an additional 31,520 PM peak hour trips with origins and/or destinations in Santa Clara, compared with existing conditions. These peak hour trip numbers include the additional trips attributable to the City Place project, as well as other future development projects within Santa Clara. These projections do not include trips for which both the origin and the destination are outside Santa Clara and are “pass through” trips of a regional nature.
Level of Service Standards
Traffic conditions at intersections are evaluated using level of service (LOS), which is a qualitative description of operating conditions ranging from LOS A, or free-flow conditions with little or no delay, to LOS F, or jammed conditions with excessive delays.
The City of Santa Clara’s level of service standard for City-controlled signalized intersections that are not a part of the Congestion Management Program (CMP) network is LOS D or better. The standard for CMP intersections and intersections controlled by the Santa Clara County Department of Roads and

Traffic Impact Fee Nexus Study July 5, 2018
P a g e | 6
Airports (expressway intersections) is LOS E. The City has not adopted an LOS standard for unsignalized intersections.
Existing and Future Intersection Levels of Service
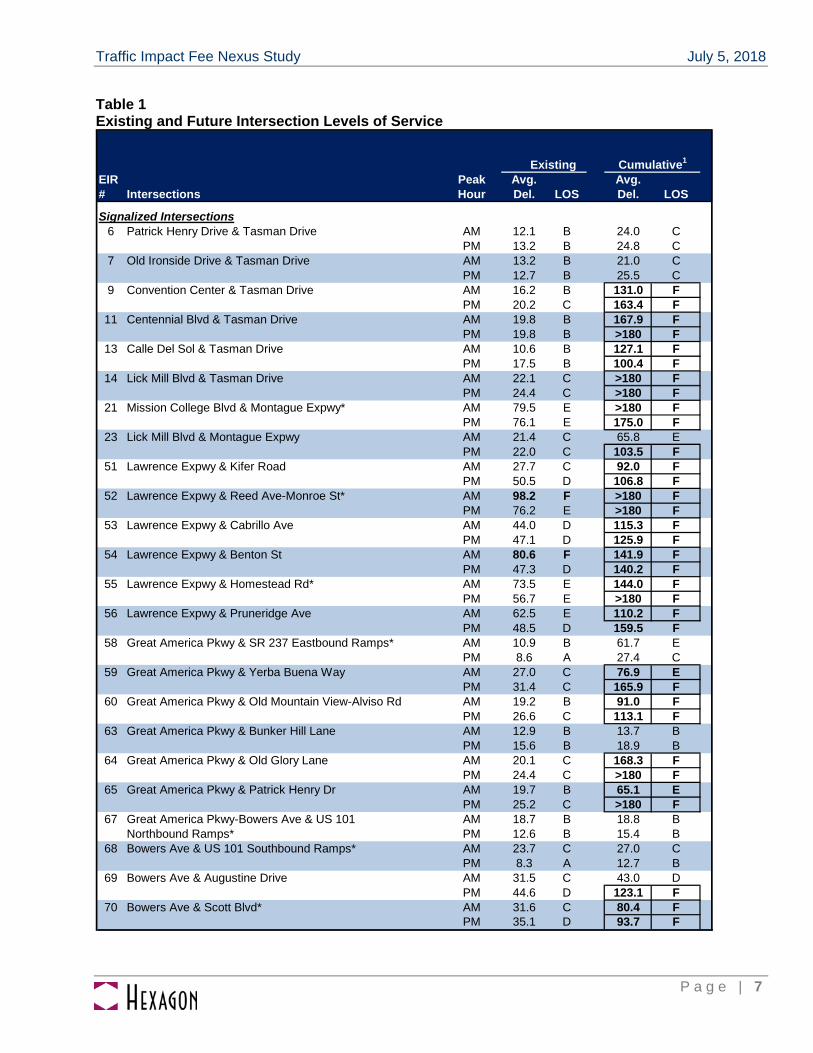
The level of service analysis under existing and future traffic conditions at 64 of the 125 study intersections included in the City Place EIR are summarized in Table 1. All data presented in Table 1 is taken from Appendix 5.1, “Updated Transportation Tables” to the City Place Final EIR, Table 3.3-49 “Cumulative with Project Signalized Intersection LOS Results” and Table 3.3-51 “Cumulative with Project Unsignalized Intersection LOS Results.” For ease of reference, the study intersection number used in the City Place EIR is shown in Table 1.
The 64 intersections (60 signalized and 4 unsignalized) shown in Table 1 were chosen for inclusion in this nexus study based on the following criteria:
Santa Clara location: Intersections outside Santa Clara were excluded since impact fees are intended to be spent on local improvements within Santa Clara. Intersections that are on a city boundary are included because the City may choose to use impact fees for its share of any improvements costs. Of the 125 study intersections in the City Place EIR, 78 are located wholly or partially in Santa Clara.
Currently existing intersections: The City Place EIR included seven intersections that will be located at the site of future driveways. These future intersections do not currently exist and are not included here.
Not subject of a Multimodal Improvement Plan: The City of Santa Clara is currently preparing a Multimodal Improvement Plan (MIP), as required by VTA, for seven CMP intersections that were identified as having significant and unavoidable impacts in the City Place EIR. Because these intersections will be included in the MIP and a separate impact fee will be developed for them, the following seven intersections are not included in Table 1.
o Great America Parkway and Tasman Drive o Great America Parkway and Mission College Boulevard o Agnew Road/De La Cruz Boulevard and Montague Expressway o Scott Boulevard and Central Expressway o De La Cruz Boulevard and Central Expressway o San Tomas Expressway and Monroe Street o Lafayette Street and El Camino Real
Intersections that include a County expressway are included in Table 1 since the City may choose to use impact fees to fund the required local match for expressway improvements or for improvements to the local approaches to expressway facilities. Four unsignalized intersections in Santa Clara are also included, since the City has chosen to use impact fees in the past to signalize intersections.
As shown in Table 1, there are two intersections that currently operate at unacceptable levels of service during at least one peak hour:
Lawrence Expressway and Reed Avenue-Monroe Street: LOS F in AM peak hour Lawrence Expressway and Benton Street: LOS F in AM peak hour
All of the other intersections currently operate at acceptable levels of service under existing conditions. According to state law, impact fees may not be used to remedy existing transportation deficiencies.
Traffic Impact Fee Nexus Study July 5, 2018
P a g e | 7
Table 1 Existing and Future Intersection Levels of Service
ExistingEIR Peak Avg. Avg.# Intersections Hour Del. LOS Del. LOS
Signalized Intersections6 Patrick Henry Drive & Tasman Drive AM 12.1 B 24.0 C
PM 13.2 B 24.8 C7 Old Ironside Drive & Tasman Drive AM 13.2 B 21.0 C
PM 12.7 B 25.5 C9 Convention Center & Tasman Drive AM 16.2 B 131.0 F
PM 20.2 C 163.4 F11 Centennial Blvd & Tasman Drive AM 19.8 B 167.9 F
PM 19.8 B >180 F13 Calle Del Sol & Tasman Drive AM 10.6 B 127.1 F
PM 17.5 B 100.4 F14 Lick Mill Blvd & Tasman Drive AM 22.1 C >180 F
PM 24.4 C >180 F21 Mission College Blvd & Montague Expwy* AM 79.5 E >180 F
PM 76.1 E 175.0 F23 Lick Mill Blvd & Montague Expwy AM 21.4 C 65.8 E
PM 22.0 C 103.5 F51 Lawrence Expwy & Kifer Road AM 27.7 C 92.0 F
PM 50.5 D 106.8 F52 Lawrence Expwy & Reed Ave-Monroe St* AM 98.2 F >180 F
PM 76.2 E >180 F53 Lawrence Expwy & Cabrillo Ave AM 44.0 D 115.3 F
PM 47.1 D 125.9 F54 Lawrence Expwy & Benton St AM 80.6 F 141.9 F
PM 47.3 D 140.2 F55 Lawrence Expwy & Homestead Rd* AM 73.5 E 144.0 F
PM 56.7 E >180 F56 Lawrence Expwy & Pruneridge Ave AM 62.5 E 110.2 F
PM 48.5 D 159.5 F58 Great America Pkwy & SR 237 Eastbound Ramps* AM 10.9 B 61.7 E
PM 8.6 A 27.4 C59 Great America Pkwy & Yerba Buena Way AM 27.0 C 76.9 E
PM 31.4 C 165.9 F60 Great America Pkwy & Old Mountain View-Alviso Rd AM 19.2 B 91.0 F
PM 26.6 C 113.1 F63 Great America Pkwy & Bunker Hill Lane AM 12.9 B 13.7 B
PM 15.6 B 18.9 B64 Great America Pkwy & Old Glory Lane AM 20.1 C 168.3 F
PM 24.4 C >180 F65 Great America Pkwy & Patrick Henry Dr AM 19.7 B 65.1 E
PM 25.2 C >180 F67 Great America Pkwy-Bowers Ave & US 101 AM 18.7 B 18.8 B
Northbound Ramps* PM 12.6 B 15.4 B68 Bowers Ave & US 101 Southbound Ramps* AM 23.7 C 27.0 C
PM 8.3 A 12.7 B69 Bowers Ave & Augustine Drive AM 31.5 C 43.0 D
PM 44.6 D 123.1 F70 Bowers Ave & Scott Blvd* AM 31.6 C 80.4 F
PM 35.1 D 93.7 F
Cumulative1
Traffic Impact Fee Nexus Study July 5, 2018
P a g e | 8
Table 1 (continued) Existing and Future Intersection Levels of Service
ExistingEIR Peak Avg. Avg.# Intersections Hour Del. LOS Del. LOS
71 Bowers Ave & Central Expwy* AM 49.9 D >180 FPM 64.6 E >180 F
72 Bowers Ave & Kifer Rd-Walsh Ave AM 20.5 C 43.6 DPM 25.4 C 84.0 F
73 Bowers Ave & Monroe St AM 33.2 C 37.1 DPM 38.8 D 172.9 F
74 Bowers Ave & El Camino Real* AM 30.4 C 81.1 FPM 35.5 D 82.6 F
75 San Tomas Expwy & Scott Blvd* AM 58.4 E >180 FPM 66.2 E 111.8 F
76 San Tomas Expwy & Walsh Ave AM 60.2 E >180 FPM 48.0 D 137.1 F
78 San Tomas Expwy & El Camino Real* AM 71.9 E >180 FPM 57.3 E 126.9 F
79 San Tomas Expwy & Benton St AM 41.9 D 156.9 FPM 37.8 D 58.3 E
80 San Tomas Expwy & Homestead Rd* AM 53.0 D 167.3 FPM 57.9 E 120.4 F
81 San Tomas Expwy & Forbes Ave AM 26.4 C 29.2 CPM 24.3 C 35.2 D
82 San Tomas Expwy & Pruneridge Ave AM 69.1 E >180 FPM 50.8 D 87.5 F
83 San Tomas Expwy & Saratoga Ave* AM 73.7 E 132.1 FPM 55.4 E 130.7 F
90 Lafayette Street & Calle De Luna AM 15.5 B 105.5 FPM 19.2 B 26.4 C
91 Lafayette Street & Hogan Drive AM 9.8 A 13.0 BPM 10.5 B 12.7 B
92 Lafayette Street & Eisenhower Drive AM 10.4 B 34.9 CPM 8.1 A 9.5 A
93 Lafayette Street & Hope Drive AM 20.5 C 29.6 CPM 13.7 B 29.1 C
94 Lafayette Street & Agnew Drive AM 38.7 D 51.0 DPM 41.0 D 87.0 F
95 Lafayette Street & Palm Drive AM 7.2 A 12.6 BPM 14.3 B 12.0 B
96 Lafayette Street & Montague Expwy Westbound AM 34.1 C 111.5 FRamps PM 26.1 C 37.7 D
97 Lafayette Street & Montague Expwy Eastbound AM 14.0 B 13.2 BRamps PM 13.0 B 12.3 B
98 Lafayette Street & Central Expressway* AM 60.5 E >180 FPM 63.5 E 127.0 F
99 Lafayette Street & Walsh Ave AM 12.7 B 16.1 BPM 19.2 B 21.9 C
100 Lafayette Street & Martin Ave AM 20.0 B 24.9 CPM 19.6 B 26.4 C
101 Lafayette Street & Mathew St-Memorex Dr AM 9.7 A 18.1 BPM 10.1 B 12.4 B
Cumulative1

Traffic Impact Fee Nexus Study July 5, 2018
P a g e | 9
Table 1 (continued) Existing and Future Intersection Levels of Service
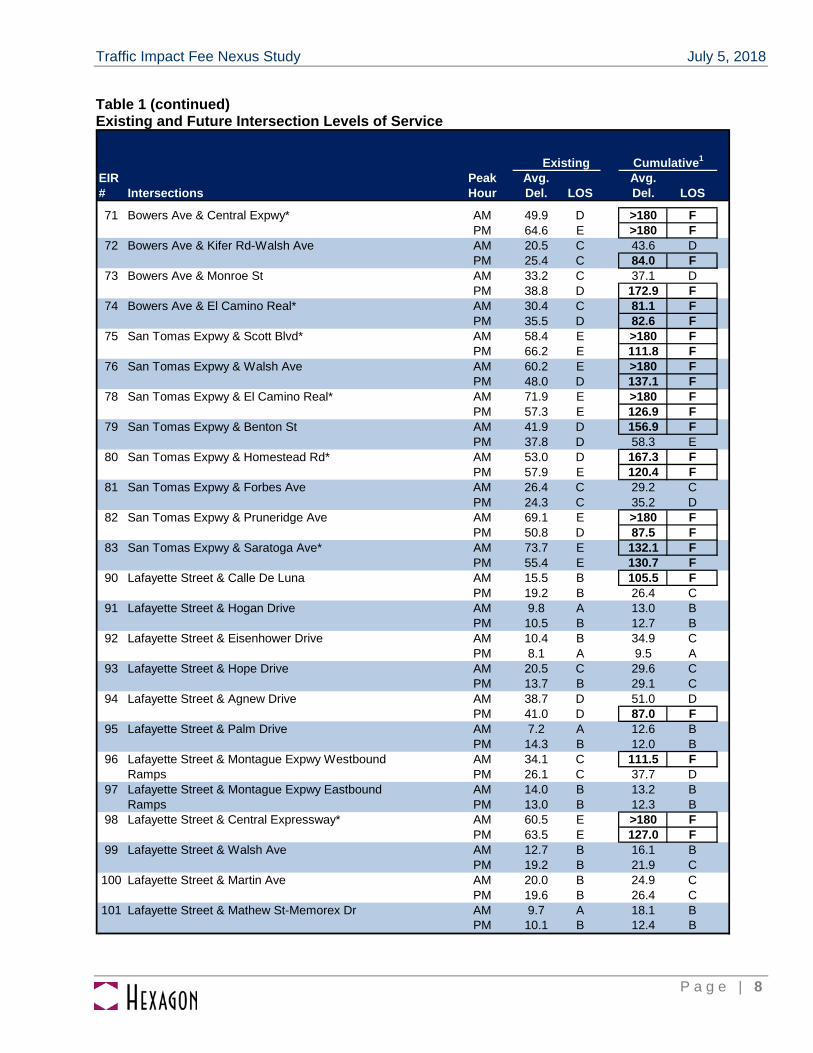
Of the 60 existing signalized intersections included in Table 1, there are 22 that would continue to operate at an acceptable level of service in the future. There are 38 signalized intersections that would operate at an unacceptable level of service. Of those 38 intersections, City Place is 100% responsible for implementing or paying for the mitigation measures that have been identified for 17 of them. Thus, there will be no need to use impact fees for improvements at those 17 intersections.
ExistingEIR Peak Avg. Avg.# Intersections Hour Del. LOS Del. LOS
103 Lafayette Street & Lewis Street AM 9.5 A 8.0 APM 37.2 D 141.2 F
104 Lafayette Street & Benton Street AM 18.4 B 17.5 BPM 17.1 B 18.3 B
105 Lafayette Street & Homestead Road AM 10.2 B 10.3 BPM 10.9 B 10.3 B
106 Lafayette Street & Market Street AM 34.3 C 39.8 DPM 28.3 C 41.6 D
107 Lafayette Street & Poplar Street AM 13.8 B 13.4 BPM 10.1 B 10.3 B
115 Lick Mill Blvd & Hope Drive AM 26.6 C 23.6 CPM 23.6 C 36.0 D
117 Agnew Road & Sunfire Way AM 10.4 B 10.6 BPM 17.4 B 15.1 B
118 De La Cruz Blvd & Greenwood Drive AM 9.3 A 7.4 APM 8.2 A 6.9 A
119 De La Cruz Blvd & Aldo Avenue AM 16.5 B 16.7 BPM 16.0 B 66.0 E
120 De La Cruz Blvd & Laurelwood Road AM 15.9 B >180 FPM 16.7 B >180 F
122 De La Cruz Blvd & Reed Avenue AM 12.2 B >180 FPM 14.3 B 91.5 F
125 San Tomas Expwy & Stevens Creek Blvd* AM 63.5 E >180 FPM 59.9 E 147.8 F
Unsignalized Intersections85 Lafayette Street & Great America Way AM 9.6 A 46.8 D
(1-way stop control on Great America Way) PM 21.1 C 39.0 D89 Lafayette Street & Calle Del Mundo AM 14.1 B >150 F
(1-way stop control on Calle Del Mundo) PM 12.7 B >150 F114 Calle Del Sol & Calle De Luna AM 13.8 B 13.6 B
(2-way stop control on Calle De Luna) PM 21.3 C 12.3 B116 Agnew Road & Garrity Way AM 12.9 B 13.5 B
PM 14.0 B 21.4 C
Notes:* Denotes CMP Intersection(1) "Cumulative" presents conditions with 2040 traffic volumes, including City Place, and with 2040 geometry.Bold indicates substandard level of service Boxed indicates a significant impact
caused by City Place.
Cumulative1

Traffic Impact Fee Nexus Study July 5, 2018
P a g e | 1 0
3. Traffic Impact Fee Improvements
This chapter presents the improvements proposed by the City to mitigate or offset to the extent feasible the impacts of increased congestion caused by future growth. The growth in demand for the transportation system will be accommodated by the development of a safe, efficient, and environmentally sensitive multimodal transportation system. The City has proposed a very broad range of improvements in its list of projects to be funded through its Traffic Impact Fee. Projects that were previously included in the City’s Traffic Mitigation Program but have not yet been completed are carried forward and included on the list. New projects include capacity enhancements at specific locations, projects that would improve traffic operations, and improvements designed to improve bicycle and pedestrian facilities and increase alternative mode use. By including numerous projects that will enhance the City’s existing bicycle and pedestrian facilities and provide greater connectivity in the sidewalk and bikeways networks, the Traffic Mitigation Program seeks to provide infrastructure so that bicycling and walking become more attractive, safe, cost-competitive, and time-competitive choices. The development of a balanced multimodal transportation network is consistent with the City’s General Plan and Climate Action Plan. However, improvements proposed for funding through the City’s Multimodal Improvement Plan (MIP), which is being prepared in parallel with this nexus study, are not included here. The Multimodal Improvement Plan also proposes a broad range of projects, and identifies a subset of those projects to be funded through a separate impact fee that would be imposed on development projects that generate trips that would use any of the seven deficient intersections for which Multimodal Mini-Plans are being prepared. As currently envisioned, there would be two separate transportation-related impact fees in the City of Santa Clara. One would be a continuation of the existing Traffic Mitigation Program (the subject of this report and referred to as the Phase D TMP impact fee) and one would be a new impact fee that would be charged only to development projects with trips that would go through one or more of the seven intersections included in the MIP (referred to as the MIP impact fee). To avoid double-charging a developer for the same improvements, there is no overlap between the list of projects to be funded through the TMP Impact Fee and the list of projects to be funded through the MIP impact fee. The TMP list, as shown in Table 2, includes three projects related to two of the MIP intersections (Great America Parkway / Mission College Blvd. and Lafayette Street / El Camino Real) because these projects were included in previous phases of the City’s Traffic Mitigation Program. The specific improvements included in these projects (CIP project numbers 2621, 2630, and 2660, as shown on Table 2) are not included in the MIP impact fee project list.

Traffic Impact Fee Nexus Study July 5, 2018
P a g e | 1 1
Table 2 lists the improvements that will be funded through the TMP impact fee, the estimated cost of each improvement, and an estimate of the percentage and amount to be funded by the TMP impact fee. In some cases, the project cost estimates shown in Table 2 are greater than the current project appropriations in the City’s current Capital Improvement Program Budget, because the values in Table 2 reflect the total project cost, including future year appropriations. The amount of impact fees that have been expended through 6/30/17 is also shown, as well as the remaining cost to be funded with impact fees. The total remaining cost to be funded with impact fees is used as the basis for calculating the proposed future impact fee amounts. All data in Table 2 are taken from the City of Santa Clara’s “FY 2017-18 Capital Improvement Program Budget”, the City’s “AB 1600 Report on Development Impact Fees for Fiscal Year Ended 6/30/2017”, or information provided by City staff. As shown in Table 2, the total cost of the improvements is $59,989,268, and the amount that could be funded with TMP impact fees is $52,289,075. The difference of $7,700,193 will be funded by sources other than the TIF. These sources include assessment districts, grants, and state and federal funding. After deducting the impact fees that have already been expended on these projects and the current balance of traffic impact fees held by the City, the amount needed from future impact fees in order to complete the projects is $37,223,018. For those projects that will be funded by less than 100% impact fees, the balance may come from federal, state, county, or City funding. Direct developer funding will also fund a portion of the cost for a few of the listed improvement projects. The direct developer funding is generally set forth in individual development agreements and is intended to reflect a fair-share contribution towards significant project impacts. Fair share payments towards improvements that are included in the City’s impact fee program are credited towards the project’s TIF payment, in order to avoid double-charging developers for planned improvements. No credit is given for off-site improvements that are not included in the impact fee expenditure plan.

Traffic Impact Fee Nexus Study July 5, 2018
P a g e | 1 2
Table 2 Traffic Mitigation Program Improvements: Phase D
CIP Project Number Project Name Description Total Cost
Percent Funded by
Impact Fees
Amount Funded by
Impact Fees
Impact Fees Expended
Thru 6/30/2017
Remaining Cost to be Funded by
Impact Fees
2616 Great America Bus Turn-Out Install last remaining bus turnout along GA Pkway 225,000$ 40% 90,000$ 3,438$ 86,562$ 2621 Improvements - Great America Parkway At Mission College Blvd: Add 3rd WBLT, 3rd NBLT, SB thru 2,601,000$ 40% 1,040,400$ 430,973$ 609,427$ 2624 Coleman Avenue Widening Add third SB travel lane between Brokaw and City limits 190,000$ 39% 74,332$ 79$ 74,253$ 2628 Hwy 101 Off-ramp widening at GA Pkway Widen SB and NB Hwy 101 off-ramps to GA Pkway 390,000$ 40% 156,000$ 1,436$ 154,564$ 2630 Mission College Blvd/ GAP Improvements Construct WBRT lane; increase LT pocket lengths on MCB 5,256,086$ 42% 2,200,000$ 593,292$ 1,606,708$ 2631 Sidewalk Installation Program Install missing sidewalk segments in residential and industrial
areas1,089,579$ 90% 980,621$ 30,208$ 950,413$
2638 Lawrence Expwy / Monroe St Improvements Phase B: Provide additional WB travel lane 300,000$ 100% 300,000$ 12,500$ 287,500$ 2639 San Tomas Expwy / Homestead Rd Improvements Phase B: Add 2nd EBLT 548,470$ 90% 494,000$ 494,000$ -$ 2649 Traffic Studies & Signal Needs Assessment Needs assessment/upgrade of existing signal system 700,000$ 100% 700,000$ 151,701$ 548,299$ 2658 El Camino Real / San Tomas Improvements Phase B: Add 2nd EBLT and 2nd WBLT on ECR 2,843,588$ 59% 1,683,590$ 1,683,590$ -$ 2660 El Camino Real / Lafayette Improvements Phase B: Add 2nd EBLT on ECR 1,250,000$ 94% 1,171,250$ 3,590$ 1,167,660$ 2665 Central Control Traffic Signal Upgrade Upgrade signal system for surveillance and coordination 2,370,649$ 88% 2,096,720$ 399,842$ 1,696,878$ 2666 Monroe Street / Chromite Dr Traffic Signal Install traffic signal 400,000$ 100% 400,000$ -$ 400,000$ 2667 Install Sidewalks on San Tomas Expwy Install sidewalks on west side of expressway 183,000$ 67% 122,882$ 122,882$ -$ 2668 Traffic Pre-Emptors Design & install emergency vehicle pre-emptors 1,445,259$ 100% 1,445,259$ 517,512$ 927,747$ 2669 Traffic Signal Enhancements Install new signals and video detection 1,400,000$ 100% 1,400,000$ 474,717$ 925,283$ 2670 Pedestrian and Bicycle Facility Enhancements Construct sidewalks and bicycle facilities 1,815,637$ 100% 1,815,637$ 1,037,431$ 778,206$ 1201 Creek Trails Expansion Master Plan Calabazas Cr, Saratoga Cr, & Hetch Hetchy ROW trails 291,500$ 100% 291,500$ 291,500$ -$ 2672 Traffic Monitoring at Various Locations Install video cameras for traffic monitoring 624,500$ 100% 624,500$ 105,938$ 518,562$ 2676 Accessible Pedestrian Signal Installation Replace existing signals with new ADA-compliant signals 700,000$ 100% 700,000$ -$ 700,000$ 2677 Traffic Signal Controller Replacement Replace existing signal software, controllers & cabinets 500,000$ 100% 500,000$ -$ 500,000$ 2678 Replacement of Signals in downtown area New signal poles, cabinets, communications, timing plans 1,515,000$ 50% 757,500$ -$ 757,500$
Phase D Scott Blvd / San Tomas Expwy Improvement Provide additional WBRT lane 260,000$ 100% 260,000$ -$ 260,000$ Phase D Homestead / Lawrence Expwy Improvement Provide additional EB through lane on Homestead 520,000$ 100% 520,000$ -$ 520,000$ Phase D Benton St / Lawrence Expwy Improvement Provide additional WBLT lane 520,000$ 100% 520,000$ -$ 520,000$ Phase D Lawrence Expwy Access Restrictions Close median at Lochinvar. RT access only at 6 side streets 300,000$ 100% 300,000$ -$ 300,000$ Phase D Pedestrian Crosswalk Sensors Install pedestrian crosswalk radar sensors at signals 450,000$ 100% 450,000$ -$ 450,000$ Phase D Bowers Ave / Scott Blvd Improvement Add a second SB LT lane 415,000$ 91% 377,390$ -$ 377,390$ Phase D Bowers Ave / Kifer Rd- Walsh Ave Improvement Add a second EB LT lane 45,000$ 95% 42,971$ -$ 42,971$ Phase D Bowers Ave / El Camino Real Improvement Add a second EB LT lane 1,550,000$ 99% 1,526,882$ -$ 1,526,882$ Phase D De La Cruz Blvd / Aldo Ave Improvement Add an EB overlap phase 140,000$ 70% 97,641$ -$ 97,641$ Phase D Trails and Bike Lanes Provide 40 miles of trails and bike lanes 18,000,000$ 100% 18,000,000$ -$ 18,000,000$ Phase D Travel Demand Model Development Develop and maintain forecasting model 250,000$ 100% 250,000$ -$ 250,000$ Phase D Traffic Signal Interconnect Upgrade Upgrade GAP & Tasman corridor to fiber 1,900,000$ 100% 1,900,000$ -$ 1,900,000$ Phase D ITS Enhancements Upgrade City's traffic signals to smarter traffic signals 6,000,000$ 100% 6,000,000$ -$ 6,000,000$ Phase D Future Signal Installation Design & construct new signals at locations throughout City 3,000,000$ 100% 3,000,000$ -$ 3,000,000$
TOTAL 59,989,268$ 52,289,075$ 6,354,629$ 45,934,446$ Traffic Impact Fee Balance as of 6/30/2017 8,711,428$
Amount Needed from Future Traffic Impact Fees 37,223,018$
Sources: City of Santa Clara, "FY 2017-18 Capital Improvement Project Budget", Fund 525 Traffic Mitigation. City of Santa Clara, "AB 1600 Report on Development Impact Fees for Fiscal Year ended June 30, 2017."
Traffic Impact Fee Nexus Study July 5, 2018
P a g e | 1 3
4. Options for Phase D Program
The City’s Traffic Mitigation Program establishes transportation improvements required to meet the City’s level of service policy. Without the Traffic Mitigation Program improvements, levels of service at several intersections would degrade from their current acceptable levels to substandard levels. The need for these improvements is a result of traffic added by new development. It is reasonable, then, to require new development in Santa Clara to provide most or all of the funding for these mitigation improvements. The basis of Santa Clara’s traffic impact fee is the number of net new PM peak hour vehicle trips generated by new development, because those additional trips result in the traffic impacts the fee is intended to mitigate. The increase in PM peak hour trips has been used as the basis of the fee in the past because the PM peak hour is typically more congested than the AM peak hour. The fee is calculated by dividing the total cost of the projects in the Traffic Mitigation Program by the number of additional PM peak hour trips generated by new development, which results in a “per PM peak hour trip” fee amount. To facilitate implementation, this fee per trip has then been converted to an equivalent fee per square foot for office and industrial uses and per room for hotel/motel uses by applying the trip generation rates for those uses from the most recent version of the Institute of Transportation Engineers’ Trip Generation Manual. This conversion process is explained further in Chapter 5.
Options for Phase D of the Traffic Mitigation Program
As described in Chapter 1, Santa Clara’s current Traffic Impact Fee is charged in only a portion of the city and only on specified land uses. The area of the City that is subject to the fee is north of the Caltrain tracks, as was shown in Figure 1. The land uses that are subject to the fee and their rates are as follows:
Office/R&D: $1.00 per square foot Industrial: $0.67 per square foot Warehousing/Utilities/Communications: $0.20 per square foot Hotel/Motel: $400.00 per room
Both residential and retail uses are currently exempt from the TIF. When the rates above were approved in 2010, the underlying nexus study indicated that higher fees could be charged based on the number of net new PM peak hour trips projected and the cost of the projects identified to mitigate the

Traffic Impact Fee Nexus Study July 5, 2018
P a g e | 1 4
impact of the additional traffic volumes. The City Council approved rates lower than the levels that could be justified by the nexus study and indicated that the shortfall in funding for the TMP projects would be made up by federal, state and local grants, as well as by direct contributions from developers as fair share contributions towards improvements necessary to mitigate any significant project impacts identified in an EIR. This nexus study examines the following options for revising the Traffic Mitigation Program: Option 1: Status Quo. Continue to charge a TIF only north of the Caltrain tracks and on the same land uses that are currently subject to the fee. No expansion of area or land uses subject to the TIF. Option 2: Same area plus residential and retail. Continue to charge the TIF only north of the Caltrain tracks. Expand the land uses subject to the TIF to include residential and retail development. Option 3: Citywide and existing land uses only. Expand the area subject to the TIF to the entire city, but continue to exempt both residential and retail uses from the TIF. Option 4: Citywide plus residential. Expand the area subject to the TIF to the entire city, and expand the land uses subject to the TIF to include residential development. Option 5: Citywide plus residential and retail. Expand the area subject to the TIF to the entire city, and expand the land uses subject to the TIF to include residential and retail development. In order to determine the amount of money that could be collected in each of these options, it is necessary to estimate the number of net new PM peak hour trips that would be generated under each of the options. The travel demand forecasting model from the City Place EIR was used to estimate the additional PM peak hour trips that would be generated north of the Caltrain tracks and south of the Caltrain tracks by the year 2040. The model’s Travel Analysis Zones (TAZs) north and south of the Caltrain tracks were used as the basis for the geographic areas identified in the TIF options. As shown in Table 3, the model projects an additional 31,520 PM peak hour trips in the year 2040, based on the difference between the Existing Conditions (2015) scenario and the Cumulative Plus Project (i.e., Cumulative Plus City Place) scenario. Of these net new trips, 24,851 would be generated by new development north of the Caltrain tracks and 6,669 would be generated by new development south of the Caltrain tracks. The forecasting model provides estimates of how many new residential units and how many new jobs are projected by the year 2040, and it also provides an estimate of how many of the total new jobs would be retail jobs. However, the forecasting model’s output provides only the total number of additional trips that would be generated by all new development in a given TAZ, but it does not specify how many trips would be generated by different land uses. Since the five options under consideration require a projection of the trips that would be generated by residential growth, by retail growth, and by non-retail job growth, Hexagon developed estimates of the new trips generated by those land uses by using average PM peak hour trip rates from the recently published Institute of Transportation Engineers’ Trip Generation Manual, 10th Edition (2017). By considering the number of new residential units, new retail jobs, and all other jobs projected by the model in combination with the ITE trip generation rates for those three uses, Hexagon developed projections of the number of trips that would be generated by each of those uses. Hexagon used the ITE land use category that best represents the three types of development identified in the five TIF options: new residential development, retail development, and non-retail development.

Traffic Impact Fee Nexus Study July 5, 2018
P a g e | 1 5
For example, for residential land uses, the analysis uses the trip rate for mid-rise multi-family housing (ITE category 221), which covers residential developments with between three and ten floors. Most recent housing developments in Santa Clara have been multi-family projects with more than two stories. Thus, even though there will likely also be some new single-family developments or low-rise multi-family developments in the future, it was determined that land use category 221 likely best represents the majority of new residential development included in the travel demand forecasting model projections. An estimate was developed of the number of trips that would be generated by new retail jobs in Santa Clara using the general Shopping Center trip rate (ITE category 820). A trip estimate was also developed for the new non-retail jobs using the General Offices trip rate (ITE category 710) as a proxy for this group of land uses. The resulting trip projections were then factored to correspond to the model’s trip projections for the two areas of the city, north and south of the Caltrain tracks. Table 3 Projected Increase in PM Peak-Hour Trips
Based on Table 3, the following summarizes the number of PM peak hour trips associated with each of the five impact fee options under consideration: Option 1: Status Quo. 12,639 PM peak hour trips Option 2: Only north of Caltrain tracks, plus residential and retail. 24,851 PM peak hour trips Option 3: Citywide and existing land uses only. 16,031 PM peak hour trips Option 4: Citywide plus residential. 23,037 PM peak hour trips Option 5: Citywide plus residential and retail. 31,520 PM peak hour trips
Calculation of the Impact Fee Amounts for the Five Options
The proposed amount of the Phase D TMP impact fee has been calculated by dividing the cost of the improvements to be funded by the TMP TIF by the number of additional PM peak hour vehicle trips included in Option 5. Option 5 establishes a citywide nexus between the trips associated with new development and the cost of necessary improvements. The other options would collect less money because they would exempt parts of the City or exempt certain land uses. The amount of future TMP
North of South ofLand Use Caltrain Tracks Caltrain Tracks Citywide
Employment-based uses (except retail) 12,639 3,392 16,031
Retail 6,689 1,795 8,483
Residential 5,523 1,482 7,006
Total of all land uses 24,851 6,669 31,520
Notes:
Total new trips from all land uses in 2040 is from the City Place EIR model (Cumulative Plus Project).Trips for the land use categories are based on average PM peak hour trip rates in Institute of Transportation Engineers'
Trip Generation Manual, 10th Edition (2017).
For employment-based uses: General office (710), PM pk hr trips per employee, General urban/suburban setting.
For retail: General shopping center (820), PM pk hr trips per GLA, General urban/suburban setting.
For residential: Mid-rise multifamily housing (221), PM pk hr trips per dwelling unit, General urban/suburban setting.
Net New PM Peak Hour Trips

Traffic Impact Fee Nexus Study July 5, 2018
P a g e | 1 6
impact fee funding needed to fund the Phase D TMP project list, as was shown in Table 2, is $37,223,018. The impact fee per PM peak hour trip is calculated by dividing $37,223,018 by the number of PM peak hour trips associated with Option 5. Table 4 shows the amount the City would collect in impact fees under each Option. Table 4 Impact Fees per PM Peak Hour Trip
Net NewPM Peak Hour Impact Fee per Fees City
Impact Fee Option Trips PM Peak Hour Trip 1 Collected Share Total
1 Status Quo: Same area, same land uses 12,639 $1,181 $14,926,659 $29,996,552 $44,923,211
2 Same area, add residential and retail 24,851 $1,181 $29,349,031 $15,574,180 $44,923,211
3 Expand area, same land uses 16,031 $1,181 $18,932,611 $25,990,600 $44,923,211
4 Expand area, add residential 23,037 $1,181 $27,206,697 $17,716,514 $44,923,211
5 Expand area, add residential and retail 31,520 $1,181 $37,223,018 $7,700,193 $44,923,211
Notes
(1) The impact fee per PM peak hour trip is calculated by dividing the total amount needed for the projects
on the Phase D TMP Project list ($37,223,018) by the number of PM peak hour trips for option 5.

Traffic Impact Fee Nexus Study July 5, 2018
P a g e | 1 7
5. Proposed Impact Fee Program
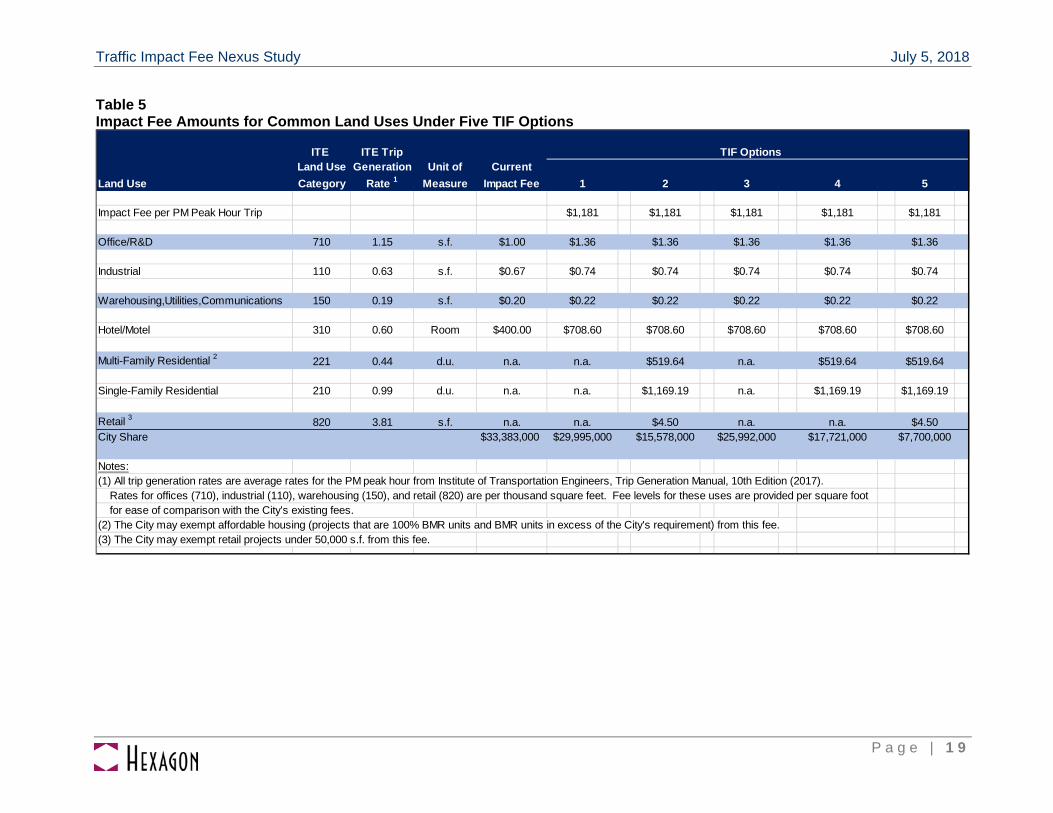
For simplicity of application, the City has chosen in the past to convert the amount of the per PM peak hour trip fee to a fee per square foot, per hotel room, or per dwelling unit, based on the trip generation rates in the ITE Trip Generation Manual. A new edition of the ITE Trip Generation Manual was published in 2017 with revised rates for many land uses, based on recent traffic studies, and these rates have been applied to the “per trip” amounts associated with each of the five fee options. Therefore, the changes in fees, when compared to the existing fees, are due to multiple factors: the changes in ITE trip generation rates, the amount to be funded through the impact fee (from Table 2), and the number of PM peak hour trips associated with each option. Table 5 presents the impact fees associated with each of the five options under consideration. The methodology for converting the “per PM peak hour trip” amount to the amount that would be charged for a given land use is the same for all land uses. The TIF per PM peak hour trip is multiplied by the appropriate ITE PM peak hour trip generation rate. For uses where the ITE rate is given per 1,000 square feet, the result is divided by 1,000 to obtain the fee per square foot. Sometimes unique uses may be proposed that do not fit within the land use categories for which TMP impact fees have been established. In these cases, the trip generation rate for the use and the “per trip” fee amount can be used to calculate an appropriate fee for the use. Trip generation rates may be obtained from the most recent ITE Trip Generation Manual or other documented source of such rates. For unique uses for which no published rates are available, trip generation rates may be calculated using direct measurement of similar uses that are in operation elsewhere or through a rational analysis based on number of employees, residents, visitors, or other factors that affect trip generation.
Retail Use Fees
Two of the options include a fee on retail uses: Option 2 would charge a TIF on retail uses north of the Caltrain tracks and Option 5 would charge a TIF on retail uses citywide. As shown in Table 5, the calculated fee per square foot for retail is much higher than the calculated fee for other commercial uses. This is because the ITE PM peak hour trip generation rate for retail (3.81) is more than three times higher than the next-highest rate, which is 1.15 for office uses. The resulting rate for retail uses of $4.50 per s.f. is sufficiently high that it may function as a disincentive to future retail development in the City. Note that the rate does not account for pass-by trips or other reductions that are allowed by VTA when a traffic study is conducted.
Traffic Impact Fee Nexus Study July 5, 2018
P a g e | 1 8
If the City is interested in including at least some retail uses in its impact fee program, it may wish to consider setting the rate at a lower level than the calculated amount shown in Table 5 or exempting individual stores under a certain size threshold, such as 50,000 s.f. There are several reasons the City may wish to exempt smaller, neighborhood-serving retail projects from the TIF. One reason is that many retail trips are made by drivers passing by the retail site on their way to or from another location (referred to as “pass-by trips”) and are not separate vehicle trips on the roadway network. Thus, many retail trips have a lower traffic impact since they do not represent additional vehicle trips made solely for the purpose of shopping. The latest edition of the ITE Trip Generation Handbook (3rd Edition, 2017) states that the average PM peak hour pass-by rate for retail uses (ITE category 820) is 34%. Thus, approximately one-third of the trips generated by retail uses are not “new” trips on the roadway network, but are trips that would have been made anyway. Another rationale for exempting relatively small retail projects from the TIF is that even though retail projects have high trip generation rates, the traffic impacts of neighborhood-serving retail can be fairly low because of short trip lengths. Depending on where a retail project is located, it may serve to reduce vehicle miles traveled, if its location allows some people to drive shorter distances than they otherwise would to a shopping destination. Shorter trips are also more likely to be made by walking or bicycling. Retail projects also generate sales tax revenue for a municipality. Thus, if the City is interested in including retail in the TIF program, it may wish to consider an exemption for individual retail establishments below a certain size (e.g., 50,000 s.f.) or reducing the TIF for neighborhood-serving retail projects.
Traffic Impact Fee Nexus Study July 5, 2018
P a g e | 1 9
Table 5 Impact Fee Amounts for Common Land Uses Under Five TIF Options
ITE ITE TripLand Use Generation Unit of Current
Land Use Category Rate 1 Measure Impact Fee 1 2 3 4 5
Impact Fee per PM Peak Hour Trip $1,181 $1,181 $1,181 $1,181 $1,181
Office/R&D 710 1.15 s.f. $1.00 $1.36 $1.36 $1.36 $1.36 $1.36
Industrial 110 0.63 s.f. $0.67 $0.74 $0.74 $0.74 $0.74 $0.74
Warehousing,Utilities,Communications 150 0.19 s.f. $0.20 $0.22 $0.22 $0.22 $0.22 $0.22
Hotel/Motel 310 0.60 Room $400.00 $708.60 $708.60 $708.60 $708.60 $708.60
Multi-Family Residential 2 221 0.44 d.u. n.a. n.a. $519.64 n.a. $519.64 $519.64
Single-Family Residential 210 0.99 d.u. n.a. n.a. $1,169.19 n.a. $1,169.19 $1,169.19
Retail 3 820 3.81 s.f. n.a. n.a. $4.50 n.a. n.a. $4.50City Share $33,383,000 $29,995,000 $15,578,000 $25,992,000 $17,721,000 $7,700,000
Notes:(1) All trip generation rates are average rates for the PM peak hour from Institute of Transportation Engineers, Trip Generation Manual, 10th Edition (2017). Rates for offices (710), industrial (110), warehousing (150), and retail (820) are per thousand square feet. Fee levels for these uses are provided per square foot for ease of comparison with the City's existing fees.(2) The City may exempt affordable housing (projects that are 100% BMR units and BMR units in excess of the City's requirement) from this fee.(3) The City may exempt retail projects under 50,000 s.f. from this fee.
TIF Options

Traffic Impact Fee Nexus Study July 5, 2018
P a g e | 2 0
Indexing the TIF
Many cities in the Bay Area adjust their transportation-related impact fees annually in order to reflect inflation. The Construction Cost Index, published by Engineering News Record, is commonly used to adjust the amount of traffic impact fees at the start of each fiscal year. Since all of the improvements to be funded with the TIF are capital projects for which cost estimates will increase with time, indexing the TIF will allow the fees collected to also increase over time in order to keep up with construction costs. Without annual adjustments to keep pace with inflation, the impact fees collected over the years will not be sufficient to implement the Phase D projects without preparing a new nexus study to raise the rates.
It is therefore strongly recommended that fee levels be automatically adjusted annually, subject to City Council approval prior to the start of each fiscal year, in line with the Construction Cost Index. Many other cities increase their TIF rates annually as part of adopting a revised fee schedule for other municipal purposes.
Exemption for Affordable Housing
If the city is interested in including residential uses in the impact fee program (Options 2, 4, and 5), it may wish to consider an exemption for any affordable housing units built as part of a development as defined by City Code Section 17.40. The purpose of this exemption would be to encourage construction of affordable housing units in Santa Clara.
Applying the TIF to Vacant Parcels and on Changing Land Uses
If a site has been vacant for at least two years, then it is recommended that any new development project on that site be subject to the appropriate TIF, and that no credit for existing uses be given when calculating the TMP impact fee. The rationale for this is that the project would generate new trips compared to recent and existing conditions, regardless of the site’s historical use. The rationale for two years as the minimum period of vacancy is that it is consistent with VTA’s TIA Guidelines requiring traffic studies to use traffic counts that are no more than two years old.
Hexagon also recommends that the TIF be applied when the land use on a given parcel changes, due to the wide variation in trip generation rates for different uses. The TIF for changing land uses would be triggered when a permit for construction, a zoning change, or a conditional use permit is required.
Meeting AB 1600 Requirements
The City should continue to follow the requirements of the Mitigation Fee Act (AB 1600) with regard to reporting annually on expenditures from the TIF fund (Fund 525 in the City Capital Improvement Budget) and making findings regarding a continuing need for any funds that are unexpended and uncommitted five or more years after deposit of such fees. The City has been including such findings in its annual “AB 1600 Report on Development Impact Fees” after each fiscal year, and should continue to do so.