sanitary sewer effluent monitoring · sanitary sewer effluent monitoring 2003 llnl environmental...
TRANSCRIPT
Sanitary Sewer Effluent Monitoring
Lawrence Livermore National Laboratory monitors a multifaceted system of waters that includes wastewaters, storm water, and groundwater, as well as rainfall and local surface waters. Water systems can also operate differently between the Livermore site and Site 300. For example, Site 300 is not serviced by a publicly owned treatment works as is the Livermore site, so different methods of treating and disposing of sanitary waste are used at the two LLNL sites. As described below, many different regulatory drivers deter-mine the appropriate methods and locations among the various water monitoring programs.
In general, water samples are collected according to written standardized procedures appropriate for the medium (see Woods 2002). The samples are then sent to outside analytical laboratories contracted by LLNL to be analyzed for some subset of the anal-yses listed in Appendix A. Sampling plans are prepared in advance by each network analyst, who is the LLNL staff person responsible for developing and implementing the specific monitoring programs or networks. The network analyst decides what analytes are to be sampled, at what frequency, and includes any permit-specified analyses. Except for certain sanitary sewer and retention tank analytes, the analyses were usually performed by off-site California-certified contract analytical laboratories.
SANITARY SEWER EFFLUENT MONITORING
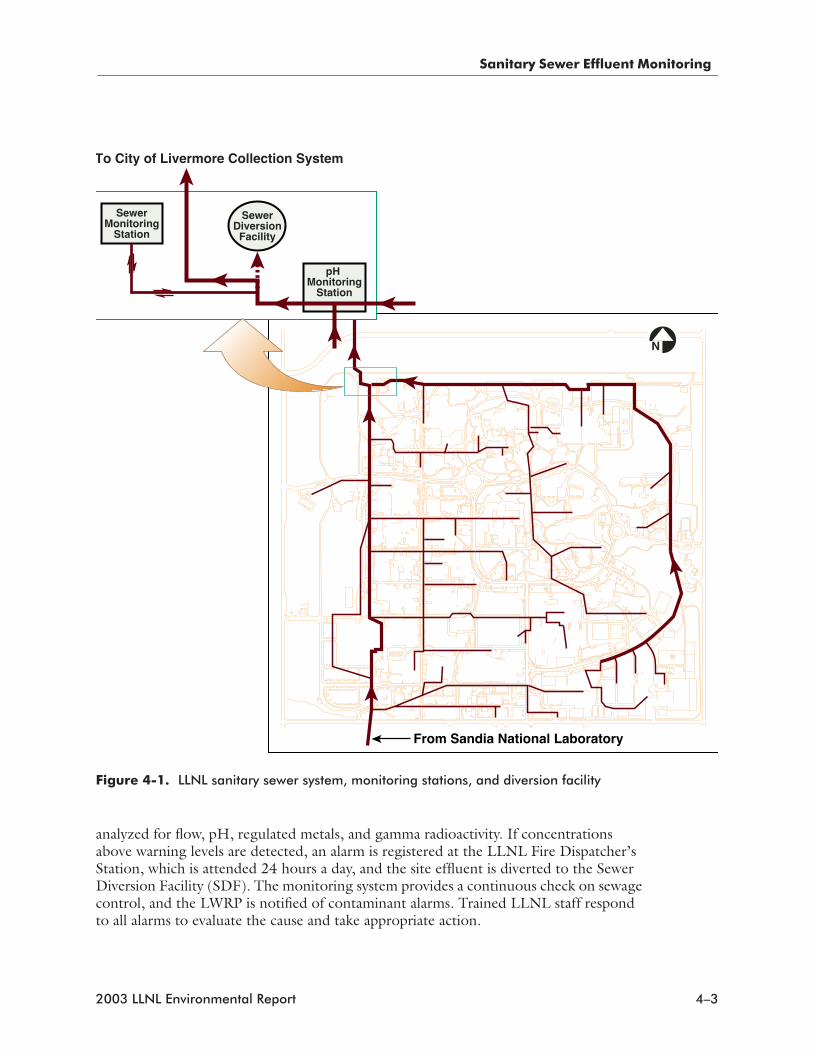
In 2003, the Livermore site discharged an average of 0.95 million liters (ML) per day of wastewater to the City of Livermore sewer system, 3.8% of the total flow into the city’s system. This volume includes wastewater generated by Sandia National Laboratories/ California (Sandia/California), which is discharged to the LLNL collection system and combines with LLNL sewage before it is released at a single point to the municipal collection system (Figure 4-1). In 2003, Sandia/California generated approximately 11% of the total effluent discharged from the Livermore site. LLNL’s wastewater contains both sanitary sewage and process wastewater and is discharged in accordance with permit requirements and the City of Livermore Municipal Code, as discussed below.
Livermore Site Complex
LLNL’s sanitary sewer discharge permit (Permit 1250, 2002/2003 and 2003/2004) requires continuous monitoring of the effluent flow rate and pH. Samplers collect flow-proportional composite samples and instantaneous grab samples that are analyzed for metals, radioactivity, toxic chemicals, and water-quality parameters at the Sewer Monitoring Station (SMS). In addition, as a best management practice, the outflow to the municipal collection system is sampled continuously and analyzed in real time for conditions that might cause upset to the Livermore Water Reclamation Plant (LWRP) treatment process or otherwise impact the public welfare. The effluent is continuously
4–2 2003 LLNL Environmental Report
Sanitary Sewer Effluent Monitoring
analyzed for flow, pH, regulated metals, and gamma radioactivity. If concentrations above warning levels are detected, an alarm is registered at the LLNL Fire Dispatcher’s Station, which is attended 24 hours a day, and the site effluent is diverted to the Sewer Diversion Facility (SDF). The monitoring system provides a continuous check on sewage control, and the LWRP is notified of contaminant alarms. Trained LLNL staff respond to all alarms to evaluate the cause and take appropriate action.
Figure 4-1. LLNL sanitary sewer system, monitoring stations, and diversion facility
From Sandia National Laboratory
N
pH Monitoring
Station
SewerMonitoring
Station
SewerDiversionFacility
To City of Livermore Collection System
2003 LLNL Environmental Report 4–3
Sanitary Sewer Effluent Monitoring
In addition to the continuous monitoring at the SMS, LLNL monitors pH at the upstream pH Monitoring Station (pHMS) (see Figure 4-1). The pHMS continuously monitors pH during peak flow hours between 7 a.m. and 7 p.m. during the workweek and diverts pH discharges outside the permit range of 5 to 10 to the SDF. The pHMS duplicates the pH monitoring and diversion capabilities of the SMS but is able to initiate diversion earlier because it is located upstream of the SDF. Earlier detection allows LLNL to divert wastewater outside the permit limits detected by the pHMS.
LLNL maintains and operates a diversion system that activates automatically when either the SMS continuous monitoring system or the pHMS detects an anomalous condition. For SMS-activated alarms, the SDF ensures that all but the first few minutes of the potentially affected wastewater flow is retained at LLNL, thereby protecting the LWRP and minimizing any potential cleanup. When the SDF is activated by the pHMS for pH excursions, even the first few minutes of affected wastewater flow are retained. Up to 775,000 L of potentially contaminated sewage can be held, pending analysis to deter-mine the appropriate handling method. The diverted effluent may be returned to the sanitary sewer (if it meets LLNL’s wastewater discharge permit limits), shipped for off-site disposal, or treated at LLNL’s Radioactive and Hazardous Waste Management (RHWM) facilities. All diverted sewage in 2003 was returned to the sanitary sewer.
Radiological Monitoring Results
Work Smart Standards (WSS) establish the standards of operation at LLNL (see Chapter 2), and include the standards for sanitary sewer discharges. For radioactive material releases, complementary (rather than overlapping) sections from Department of Energy (DOE) Order 5400.5 and 10 CFR Part 20 are both part of the standards. From DOE Order 5400.5, the WSS for sanitary sewer discharges include the criteria DOE established for the application of best available technology to protect public health and minimize degradation of the environment. These criteria (the Derived Concentration Guides, or DCGs) limit the concentration of each radionuclide discharged to publicly owned treatment works. If a measurement of the monthly average concentration of a radioisotope exceeds its specific concentration limit, LLNL is required to improve discharge control measures until concentrations are again below the DOE limits. From 10 CFR Part 20, the numerical discharge limits for sanitary sewer discharges in the WSS include the annual discharge limits for radioactivity: 185 GBq (5 Ci) of tritium, 37 GBq (1 Ci) of carbon-14, and 37 GBq (1 Ci) of all other radionuclides combined. The 10 CFR Part 20 limit on total tritium activity dischargeable during a single year (185 GBq) is primary over the DOE Order 5400.5 concentration-based limit for tritium for facilities such as LLNL that generate wastewater in large volumes. In addition to the DOE average concentration discharge limit for tritium and the 10 CFR Part 20 annual total discharge limit for tritium, the LWRP established in 1999 an effluent concentration discharge limit for LLNL governing daily releases of tritium. This limit is more stringent than the DOE discharge limit: it is a factor of 30 smaller and applies to a daily rather than an annualized concentration. The following discussion includes the specific radioisotopes with potential to be found in the sanitary sewer effluent at LLNL with respect to the appropriate discharge limit.
4–4 2003 LLNL Environmental Report
Sanitary Sewer Effluent Monitoring
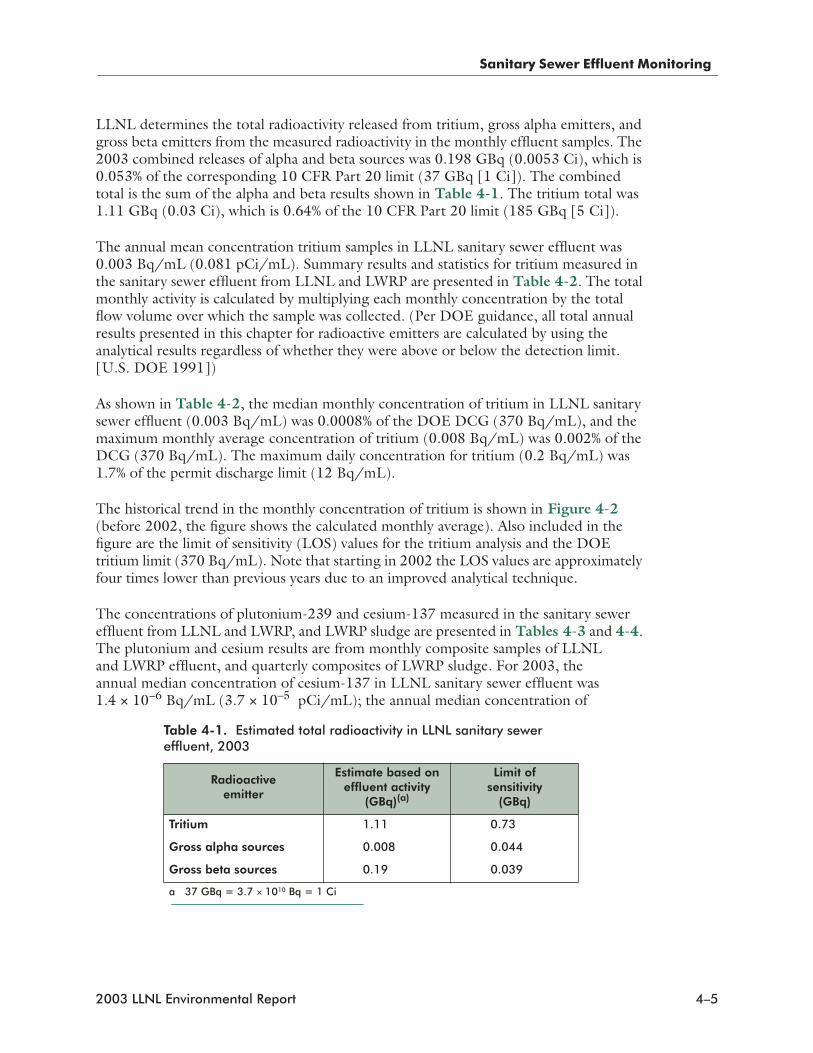
LLNL determines the total radioactivity released from tritium, gross alpha emitters, and gross beta emitters from the measured radioactivity in the monthly effluent samples. The 2003 combined releases of alpha and beta sources was 0.198 GBq (0.0053 Ci), which is 0.053% of the corresponding 10 CFR Part 20 limit (37 GBq [1 Ci]). The combined total is the sum of the alpha and beta results shown in Table 4-1. The tritium total was 1.11 GBq (0.03 Ci), which is 0.64% of the 10 CFR Part 20 limit (185 GBq [5 Ci]).
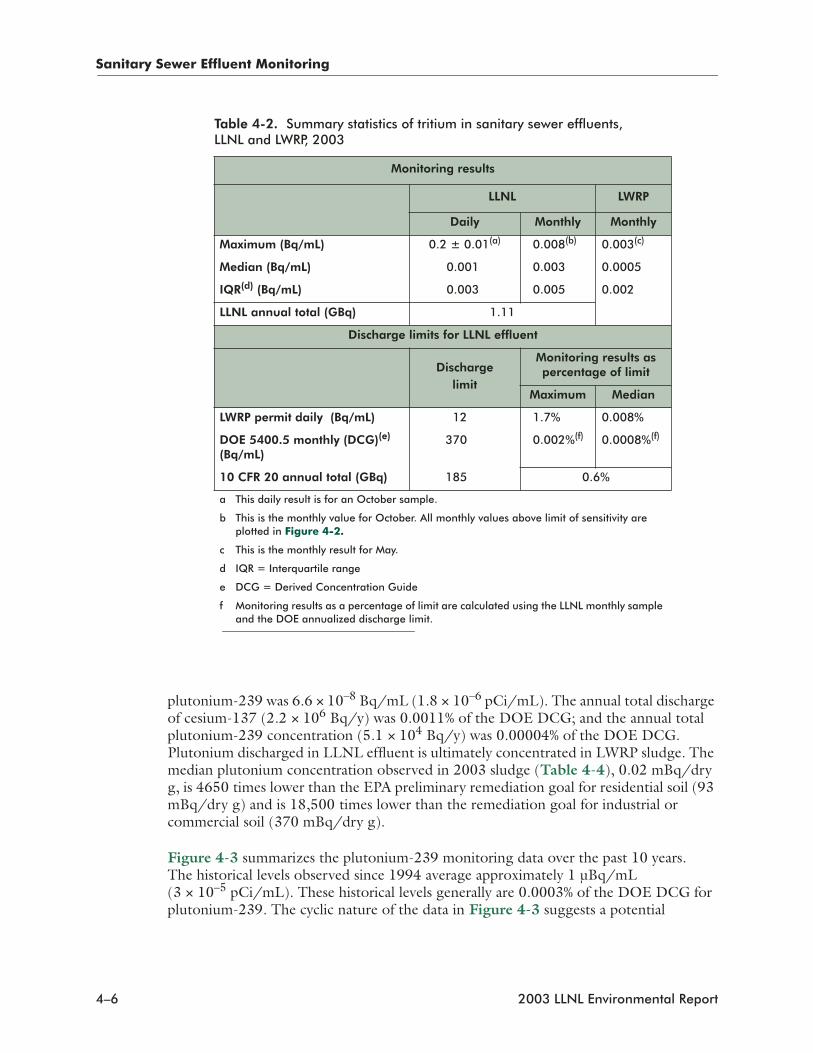
The annual mean concentration tritium samples in LLNL sanitary sewer effluent was 0.003 Bq/mL (0.081 pCi/mL). Summary results and statistics for tritium measured in the sanitary sewer effluent from LLNL and LWRP are presented in Table 4-2. The total monthly activity is calculated by multiplying each monthly concentration by the total flow volume over which the sample was collected. (Per DOE guidance, all total annual results presented in this chapter for radioactive emitters are calculated by using the analytical results regardless of whether they were above or below the detection limit. [U.S. DOE 1991])
As shown in Table 4-2, the median monthly concentration of tritium in LLNL sanitary sewer effluent (0.003 Bq/mL) was 0.0008% of the DOE DCG (370 Bq/mL), and the maximum monthly average concentration of tritium (0.008 Bq/mL) was 0.002% of the DCG (370 Bq/mL). The maximum daily concentration for tritium (0.2 Bq/mL) was 1.7% of the permit discharge limit (12 Bq/mL).
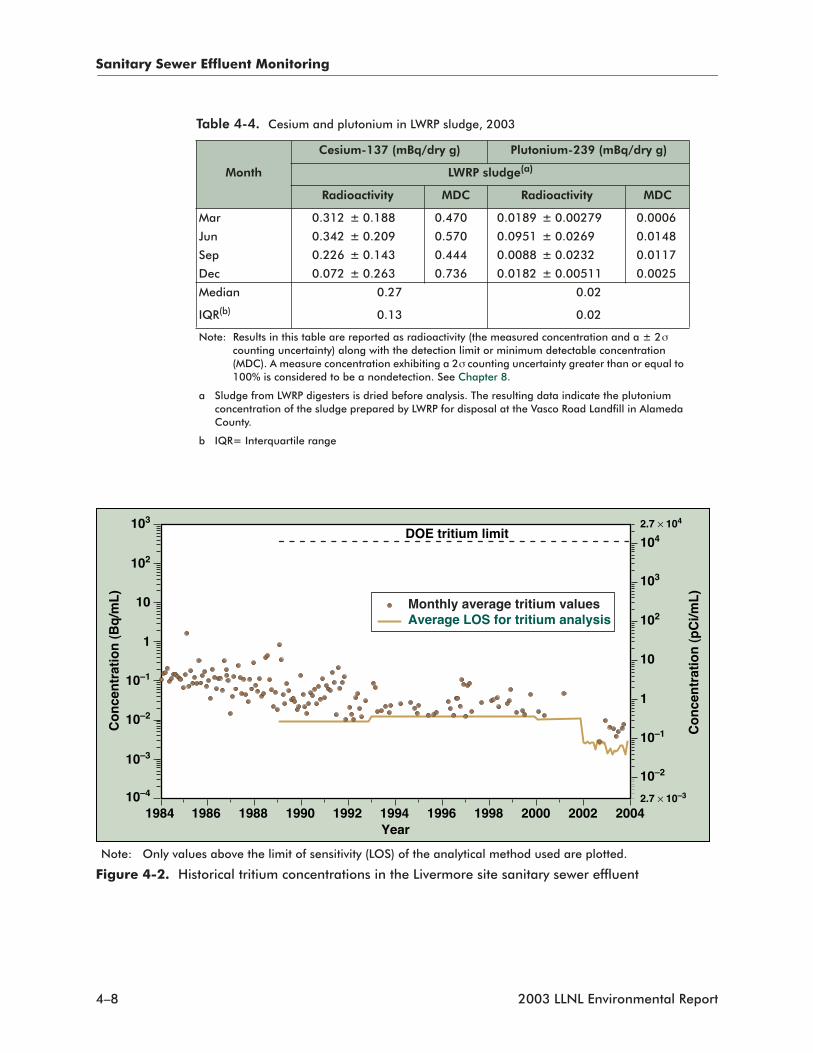
The historical trend in the monthly concentration of tritium is shown in Figure 4-2 (before 2002, the figure shows the calculated monthly average). Also included in the figure are the limit of sensitivity (LOS) values for the tritium analysis and the DOE tritium limit (370 Bq/mL). Note that starting in 2002 the LOS values are approximately four times lower than previous years due to an improved analytical technique.
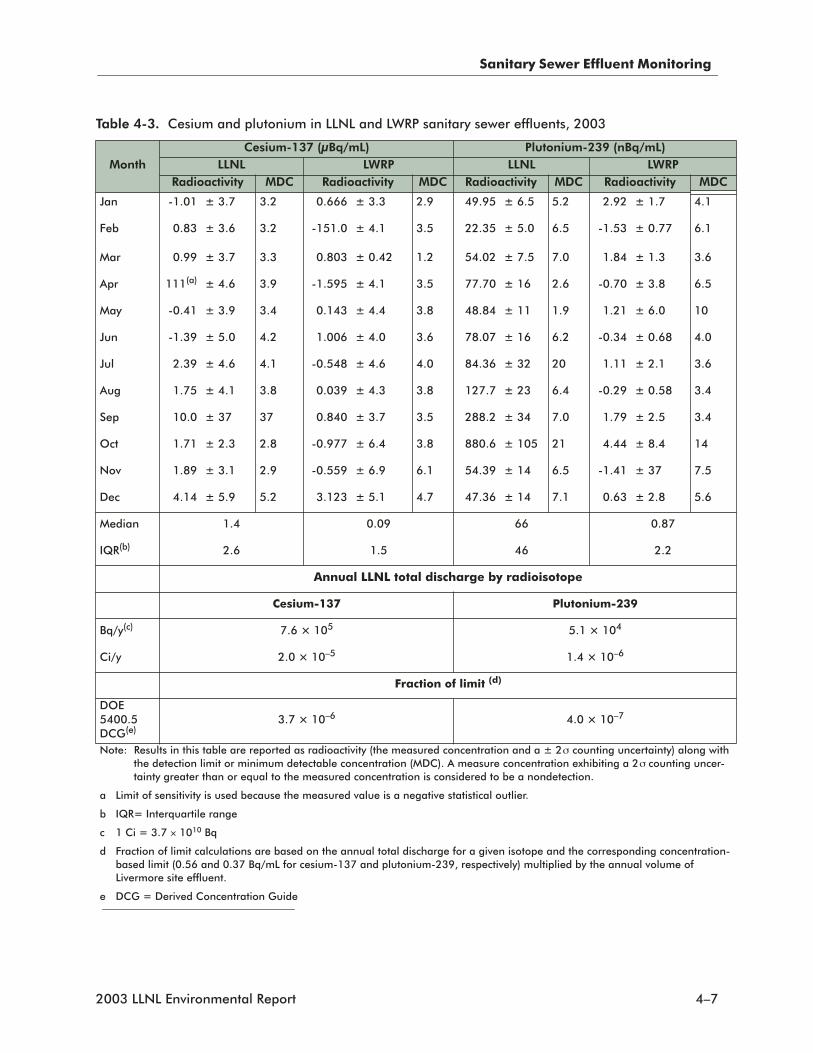
The concentrations of plutonium-239 and cesium-137 measured in the sanitary sewer effluent from LLNL and LWRP, and LWRP sludge are presented in Tables 4-3 and 4-4. The plutonium and cesium results are from monthly composite samples of LLNL and LWRP effluent, and quarterly composites of LWRP sludge. For 2003, the annual median concentration of cesium-137 in LLNL sanitary sewer effluent was 1.4 × 10⁻⁶ Bq/mL (3.7 × 10⁻⁵ pCi/mL); the annual median concentration of
Table 4-1. Estimated total radioactivity in LLNL sanitary sewer effluent, 2003
Radioactive emitter
Estimate based on effluent activity
(GBq)(a)
Limit of sensitivity
(GBq)
Tritium 1.11 0.73
Gross alpha sources 0.008 0.044
Gross beta sources 0.19 0.039
a 37 GBq = 3.7 × 10¹⁰ Bq = 1 Ci
2003 LLNL Environmental Report 4–5
Sanitary Sewer Effluent Monitoring
plutonium-239 was 6.6 × 10⁻⁸ Bq/mL (1.8 × 10⁻⁶ pCi/mL). The annual total discharge of cesium-137 (2.2 × 10⁶ Bq/y) was 0.0011% of the DOE DCG; and the annual total plutonium-239 concentration (5.1 × 10⁴ Bq/y) was 0.00004% of the DOE DCG. Plutonium discharged in LLNL effluent is ultimately concentrated in LWRP sludge. The median plutonium concentration observed in 2003 sludge (Table 4-4), 0.02 mBq/dry g, is 4650 times lower than the EPA preliminary remediation goal for residential soil (93 mBq/dry g) and is 18,500 times lower than the remediation goal for industrial or commercial soil (370 mBq/dry g).
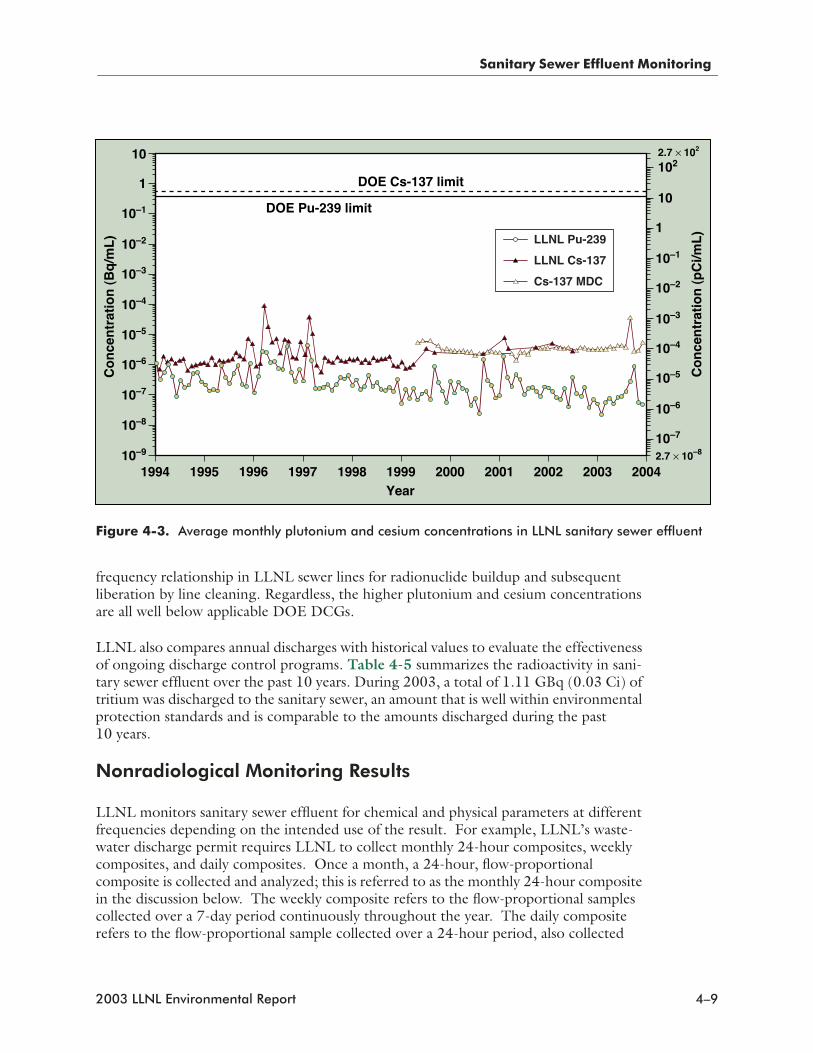
Figure 4-3 summarizes the plutonium-239 monitoring data over the past 10 years. The historical levels observed since 1994 average approximately 1 µBq/mL (3 × 10⁻⁵ pCi/mL). These historical levels generally are 0.0003% of the DOE DCG for plutonium-239. The cyclic nature of the data in Figure 4-3 suggests a potential
Table 4-2. Summary statistics of tritium in sanitary sewer effluents, LLNL and LWRP, 2003
Monitoring results
LLNL LWRP
Daily Monthly Monthly
Maximum (Bq/mL) 0.2 ± 0.01(a) 0.008(b) 0.003(c)
Median (Bq/mL) 0.001 0.003 0.0005
IQR(d) (Bq/mL) 0.003 0.005 0.002
LLNL annual total (GBq) 1.11
Discharge limits for LLNL effluent
Dischargelimit
Monitoring results as percentage of limit
Maximum Median
LWRP permit daily (Bq/mL) 12 1.7% 0.008%
DOE 5400.5 monthly (DCG)(e) (Bq/mL)
370 0.002%(f) 0.0008%(f)
10 CFR 20 annual total (GBq) 185 0.6%
a This daily result is for an October sample.
b This is the monthly value for October. All monthly values above limit of sensitivity are plotted in Figure 4-2.
c This is the monthly result for May.
d IQR = Interquartile range
e DCG = Derived Concentration Guide
f Monitoring results as a percentage of limit are calculated using the LLNL monthly sample and the DOE annualized discharge limit.
4–6 2003 LLNL Environmental Report
Sanitary Sewer Effluent Monitoring
Table 4-3. Cesium and plutonium in LLNL and LWRP sanitary sewer effluents, 2003
MonthCesium-137 (µBq/mL) Plutonium-239 (nBq/mL)
LLNL LWRP LLNL LWRPRadioactivity MDC Radioactivity MDC Radioactivity MDC Radioactivity MDC
Jan -1.01 ± 3.7 3.2 0.666 ± 3.3 2.9 49.95 ± 6.5 5.2 2.92 ± 1.7 4.1
Feb 0.83 ± 3.6 3.2 -151.0 ± 4.1 3.5 22.35 ± 5.0 6.5 -1.53 ± 0.77 6.1
Mar 0.99 ± 3.7 3.3 0.803 ± 0.42 1.2 54.02 ± 7.5 7.0 1.84 ± 1.3 3.6
Apr 111(a) ± 4.6 3.9 -1.595 ± 4.1 3.5 77.70 ± 16 2.6 -0.70 ± 3.8 6.5
May -0.41 ± 3.9 3.4 0.143 ± 4.4 3.8 48.84 ± 11 1.9 1.21 ± 6.0 10
Jun -1.39 ± 5.0 4.2 1.006 ± 4.0 3.6 78.07 ± 16 6.2 -0.34 ± 0.68 4.0
Jul 2.39 ± 4.6 4.1 -0.548 ± 4.6 4.0 84.36 ± 32 20 1.11 ± 2.1 3.6
Aug 1.75 ± 4.1 3.8 0.039 ± 4.3 3.8 127.7 ± 23 6.4 -0.29 ± 0.58 3.4
Sep 10.0 ± 37 37 0.840 ± 3.7 3.5 288.2 ± 34 7.0 1.79 ± 2.5 3.4
Oct 1.71 ± 2.3 2.8 -0.977 ± 6.4 3.8 880.6 ± 105 21 4.44 ± 8.4 14
Nov 1.89 ± 3.1 2.9 -0.559 ± 6.9 6.1 54.39 ± 14 6.5 -1.41 ± 37 7.5
Dec 4.14 ± 5.9 5.2 3.123 ± 5.1 4.7 47.36 ± 14 7.1 0.63 ± 2.8 5.6
Median 1.4 0.09 66 0.87
IQR(b) 2.6 1.5 46 2.2
Annual LLNL total discharge by radioisotope
Cesium-137 Plutonium-239
Bq/y(c) 7.6 × 10⁵ 5.1 × 10⁴
Ci/y 2.0 × 10⁻⁵ 1.4 × 10⁻⁶
Fraction of limit (d)
DOE 5400.5DCG(e)
3.7 × 10⁻⁶ 4.0 × 10⁻⁷
Note: Results in this table are reported as radioactivity (the measured concentration and a ± 2σ counting uncertainty) along with the detection limit or minimum detectable concentration (MDC). A measure concentration exhibiting a 2σ counting uncer-tainty greater than or equal to the measured concentration is considered to be a nondetection.
a Limit of sensitivity is used because the measured value is a negative statistical outlier.
b IQR= Interquartile range
c 1 Ci = 3.7 × 10¹⁰ Bq
d Fraction of limit calculations are based on the annual total discharge for a given isotope and the corresponding concentration-based limit (0.56 and 0.37 Bq/mL for cesium-137 and plutonium-239, respectively) multiplied by the annual volume of Livermore site effluent.
e DCG = Derived Concentration Guide
2003 LLNL Environmental Report 4–7
Sanitary Sewer Effluent Monitoring
Table 4-4. Cesium and plutonium in LWRP sludge, 2003
Month
Cesium-137 (mBq/dry g) Plutonium-239 (mBq/dry g)
LWRP sludge(a)
Radioactivity MDC Radioactivity MDC
Mar 0.312 ± 0.188 0.470 0.0189 ± 0.00279 0.0006
Jun 0.342 ± 0.209 0.570 0.0951 ± 0.0269 0.0148
Sep 0.226 ± 0.143 0.444 0.0088 ± 0.0232 0.0117
Dec 0.072 ± 0.263 0.736 0.0182 ± 0.00511 0.0025
Median 0.27 0.02
IQR(b) 0.13 0.02
Note: Results in this table are reported as radioactivity (the measured concentration and a ± 2σ counting uncertainty) along with the detection limit or minimum detectable concentration (MDC). A measure concentration exhibiting a 2σ counting uncertainty greater than or equal to 100% is considered to be a nondetection. See Chapter 8.
a Sludge from LWRP digesters is dried before analysis. The resulting data indicate the plutonium concentration of the sludge prepared by LWRP for disposal at the Vasco Road Landfill in Alameda County.
b IQR= Interquartile range
Note: Only values above the limit of sensitivity (LOS) of the analytical method used are plotted.
Figure 4-2. Historical tritium concentrations in the Livermore site sanitary sewer effluent
10–4
10–3
10–2
10–1
102
103
10
1
10–2
10–1
102
103
104
10
1
2.7 × 10⁴
2.7 × 10⁻³
Year
Co
nce
ntr
atio
n (
Bq
/mL
)
DOE tritium limit
Co
nce
ntr
atio
n (
pC
i/mL
)
1984 1986 1988 1990 1992 1994 1996 1998 2000 2002 2004
Monthly average tritium valuesAverage LOS for tritium analysis
4–8 2003 LLNL Environmental Report
Sanitary Sewer Effluent Monitoring
frequency relationship in LLNL sewer lines for radionuclide buildup and subsequent liberation by line cleaning. Regardless, the higher plutonium and cesium concentrations are all well below applicable DOE DCGs.
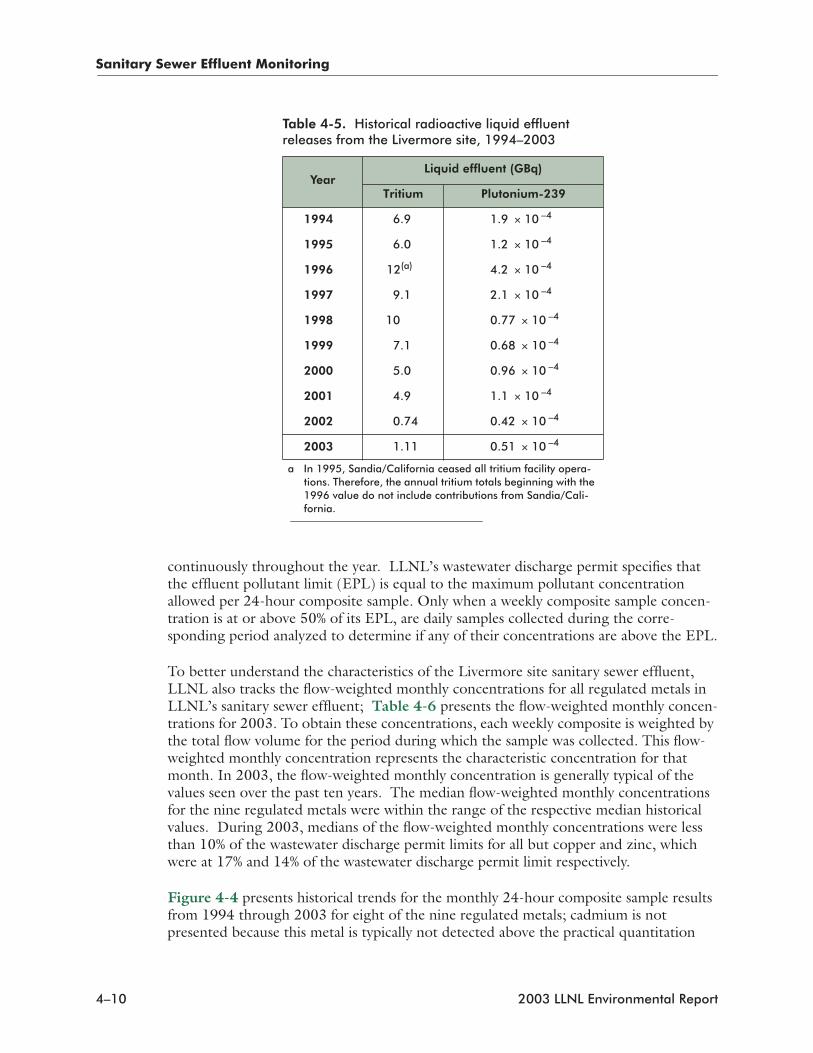
LLNL also compares annual discharges with historical values to evaluate the effectiveness of ongoing discharge control programs. Table 4-5 summarizes the radioactivity in sani-tary sewer effluent over the past 10 years. During 2003, a total of 1.11 GBq (0.03 Ci) of tritium was discharged to the sanitary sewer, an amount that is well within environmental protection standards and is comparable to the amounts discharged during the past 10 years.
Nonradiological Monitoring Results
LLNL monitors sanitary sewer effluent for chemical and physical parameters at different frequencies depending on the intended use of the result. For example, LLNL’s waste-water discharge permit requires LLNL to collect monthly 24-hour composites, weekly composites, and daily composites. Once a month, a 24-hour, flow-proportional composite is collected and analyzed; this is referred to as the monthly 24-hour composite in the discussion below. The weekly composite refers to the flow-proportional samples collected over a 7-day period continuously throughout the year. The daily composite refers to the flow-proportional sample collected over a 24-hour period, also collected
Figure 4-3. Average monthly plutonium and cesium concentrations in LLNL sanitary sewer effluent
10–9 2.7 × 10–810–7
10–6
10–5
10–4
10–3
10–2
10–1
1
102
10
2.7 × 10²
10–8
10–7
10–6
10–5
10–4
10–3
10–2
10–1
1
10
Year
Co
nce
ntr
atio
n (
pC
i/mL
)
Co
nce
ntr
atio
n (
Bq
/mL
)
2001 2002 2003 20041999 20001994 1995 1996 1997 1998
LLNL Pu-239
LLNL Cs-137
Cs-137 MDC
DOE Cs-137 limit
DOE Pu-239 limit
2003 LLNL Environmental Report 4–9
Sanitary Sewer Effluent Monitoring
continuously throughout the year. LLNL’s wastewater discharge permit specifies that the effluent pollutant limit (EPL) is equal to the maximum pollutant concentration allowed per 24-hour composite sample. Only when a weekly composite sample concen-tration is at or above 50% of its EPL, are daily samples collected during the corre-sponding period analyzed to determine if any of their concentrations are above the EPL.
To better understand the characteristics of the Livermore site sanitary sewer effluent, LLNL also tracks the flow-weighted monthly concentrations for all regulated metals in LLNL’s sanitary sewer effluent; Table 4-6 presents the flow-weighted monthly concen-trations for 2003. To obtain these concentrations, each weekly composite is weighted by the total flow volume for the period during which the sample was collected. This flow-weighted monthly concentration represents the characteristic concentration for that month. In 2003, the flow-weighted monthly concentration is generally typical of the values seen over the past ten years. The median flow-weighted monthly concentrations for the nine regulated metals were within the range of the respective median historical values. During 2003, medians of the flow-weighted monthly concentrations were less than 10% of the wastewater discharge permit limits for all but copper and zinc, which were at 17% and 14% of the wastewater discharge permit limit respectively.
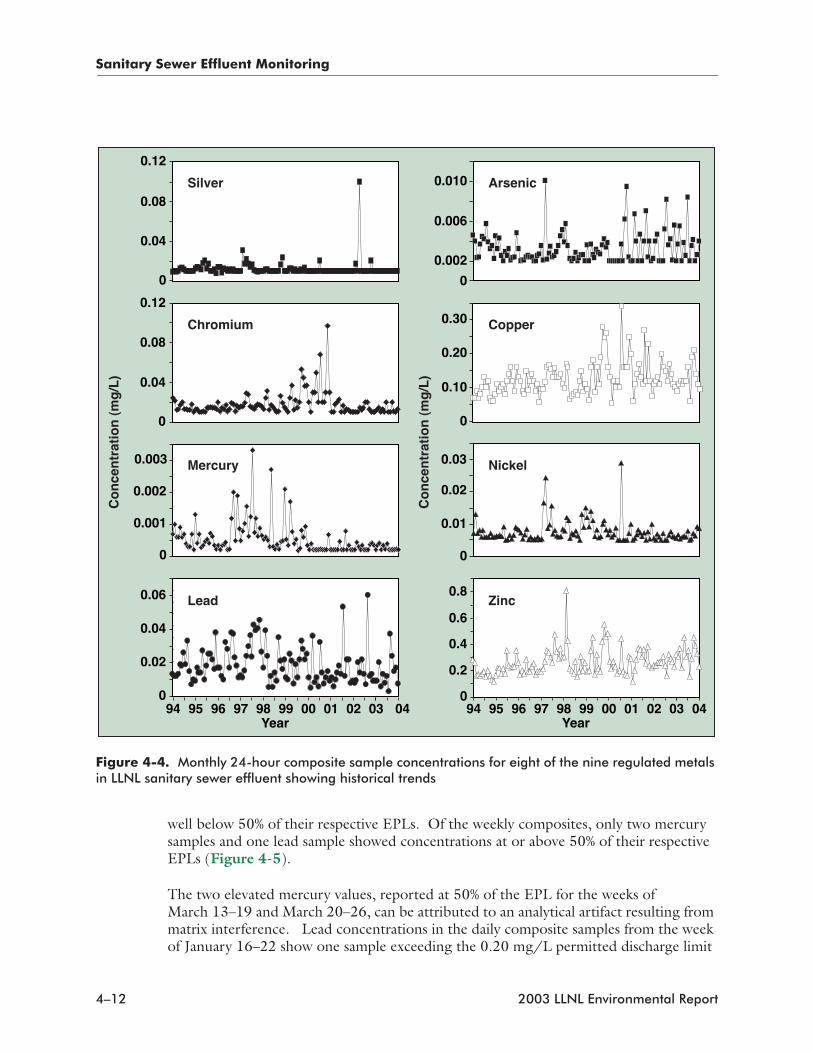
Figure 4-4 presents historical trends for the monthly 24-hour composite sample results from 1994 through 2003 for eight of the nine regulated metals; cadmium is not presented because this metal is typically not detected above the practical quantitation
Table 4-5. Historical radioactive liquid effluent releases from the Livermore site, 1994–2003
YearLiquid effluent (GBq)
Tritium Plutonium-239
1994 6.9 1.9 × 10 –4
1995 6.0 1.2 × 10 –4
1996 12(a) 4.2 × 10 –4
1997 9.1 2.1 × 10 –4
1998 10 0.77 × 10 –4
1999 7.1 0.68 × 10 –4
2000 5.0 0.96 × 10 –4
2001 4.9 1.1 × 10 –4
2002 0.74 0.42 × 10 –4
2003 1.11 0.51 × 10 –4
a In 1995, Sandia/California ceased all tritium facility opera-tions. Therefore, the annual tritium totals beginning with the 1996 value do not include contributions from Sandia/Cali-fornia.
4–10 2003 LLNL Environmental Report

Sanitary Sewer Effluent Monitoring
limit of 0.005 mg/L. All of the monthly 24-hour composite samples were in compliance with LLNL’s wastewater discharge permit limits. As noted in recent years, arsenic, copper, lead, and zinc continue to show an occasional elevated concentration. These elevated values, however, never exceeded 15% of the EPL in 2003; except for copper, which peaked at 21% of the EPL. The other metals (silver, chromium, nickel, and mercury), which in past years have shown one or more elevated concentrations, exhib-ited no discernible trends in the 2003 monthly 24-hour composite concentrations.
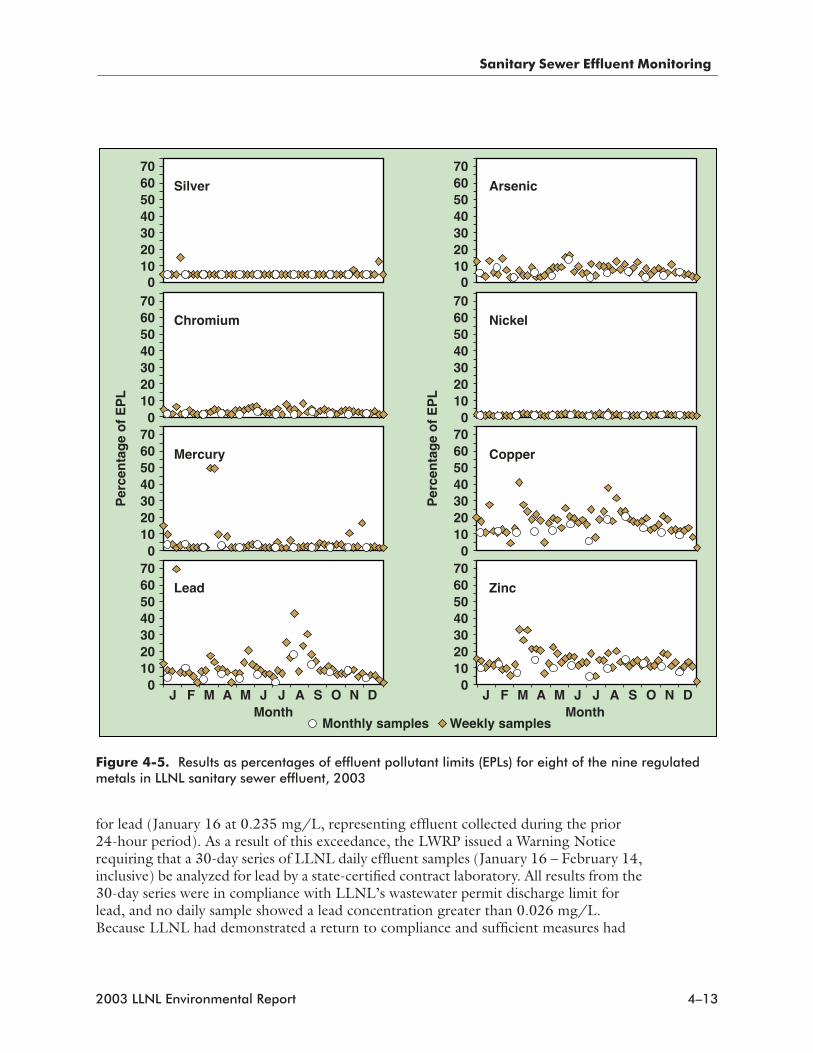
The monthly 24-hour composite and weekly composite concentrations for 2003 are presented in Figure 4-5 for eight of nine regulated metals as a percentage of the corre-sponding EPL; cadmium results are not presented because the metal was not detected above the practical quantitation limit of 0.005 mg/L in any of the weekly or monthly samples. As previously mentioned, all of the monthly 24-hour composite samples are
Table 4-6. Monthly average results for regulated metals in LLNL sanitary sewer effluent (mg/L), 2003
Month Ag As Cd Cr Cu Hg Ni Pb Zn
Jan 0.015 0.0044 <0.0050 0.019 0.17 0.00048 0.0080 0.044 0.37
Feb <0.010 0.0047 <0.0050 0.015 0.10 0.00023 0.0061 0.010 0.29
Mar <0.010 0.0034 <0.0050 0.020 0.27 0.0026 0.012 0.024 0.81
Apr <0.010 0.0030 <0.0050 0.017 0.16 0.00046 0.0090 0.013 0.48
May <0.010 0.0069 <0.0050 0.032 0.20 0.00031 0.012 0.026 0.53
Jun <0.010 0.0049 <0.0050 0.020 0.18 0.00024 0.010 0.014 0.43
Jul <0.010 0.0054 <0.0050 0.028 0.19 0.00037 0.0093 0.030 0.40
Aug <0.010 0.0060 <0.0050 0.029 0.27 0.00026 0.011 0.050 0.47
Sep <0.010 0.0052 <0.0050 0.023 0.18 0.00034 0.0079 0.022 0.39
Oct <0.010 0.0045 <0.0050 0.021 0.16 0.00039 0.0077 0.016 0.40
Nov 0.011 0.0045 <0.0050 0.019 0.15 0.00070 0.0090 0.013 0.42
Dec 0.014 0.0030 <0.0050 0.015 0.10 0.00022 0.0070 0.0080 0.30
Median <0.010 0.0046 <0.0050 0.020 0.17 0.00036 0.0090 0.019 0.41
IQR(a) —(b) 0.0011 —(b) 0.0057 0.035 0.00021 0.0026 0.014 0.091
EPL(c) 0.20 0.06 0.14 0.62 1.0 0.01 0.61 0.20 3.00
Median fraction of EPL
<0.05 0.08 <0.04 0.03 0.17 0.04 0.01 0.09 0.14
Note: Monthly values are presented with less-than signs when all weekly composite sample results for the month are below the detectable concentration.
a IQR = Interquartile range
b Because of the large number of nondetects, the interquartile range cannot be calculated. See Chapter 8.
c Effluent pollutant limit (LLNL Wastewater Discharge Permit 1250, 2002/2003, and 2003/2004)
2003 LLNL Environmental Report 4–11
Sanitary Sewer Effluent Monitoring
well below 50% of their respective EPLs. Of the weekly composites, only two mercury samples and one lead sample showed concentrations at or above 50% of their respective EPLs (Figure 4-5).
The two elevated mercury values, reported at 50% of the EPL for the weeks of March 13–19 and March 20–26, can be attributed to an analytical artifact resulting from matrix interference. Lead concentrations in the daily composite samples from the week of January 16–22 show one sample exceeding the 0.20 mg/L permitted discharge limit
Figure 4-4. Monthly 24-hour composite sample concentrations for eight of the nine regulated metals in LLNL sanitary sewer effluent showing historical trends
0
0.04
0.08
0.12
0
0
0.002
0.006
0.010
Co
nce
ntr
atio
n (
mg
/L)
Co
nce
ntr
atio
n (
mg
/L)
0
0.04
0.08
0.12
0.10
0.30
0
0.001
0.002
0.003
0
0.01
0.02
0.03
0
0.02
0.04
0.06
Year
0
0.2
0.4
0.6
0.8
Year
Silver
Chromium
Mercury
Lead
Arsenic
Copper
Nickel
Zinc
0.20
94 95 96 97 98 99 00 01 0302 04 94 95 96 97 98 99 00 01 0302 04
4–12 2003 LLNL Environmental Report
Sanitary Sewer Effluent Monitoring
for lead (January 16 at 0.235 mg/L, representing effluent collected during the prior 24-hour period). As a result of this exceedance, the LWRP issued a Warning Notice requiring that a 30-day series of LLNL daily effluent samples (January 16 – February 14, inclusive) be analyzed for lead by a state-certified contract laboratory. All results from the 30-day series were in compliance with LLNL’s wastewater permit discharge limit for lead, and no daily sample showed a lead concentration greater than 0.026 mg/L. Because LLNL had demonstrated a return to compliance and sufficient measures had
Figure 4-5. Results as percentages of effluent pollutant limits (EPLs) for eight of the nine regulated metals in LLNL sanitary sewer effluent, 2003
Per
cen
tag
e o
f E
PL
Per
cen
tag
e o
f E
PL
J F M A M J JMonth Month
A S O N D J F M A M J J A S O N D
Chromium
Silver
Nickel
Monthly samples Weekly samples
40506070
2030
010
Arsenic
Zinc
Copper
Lead
Mercury
40506070
2030
010
40506070
2030
010
40506070
2030
010
40506070
2030
010
40506070
2030
010
40506070
2030
010
40506070
2030
010
2003 LLNL Environmental Report 4–13

Sanitary Sewer Effluent Monitoring
been taken to investigate this inadvertent discharge, no corrective action was required by the LWRP. Although this incident was reported to the LWRP, it did not represent a threat to the integrity of the LWRP operations.
Detections of anions, metals, and organic compounds and summary data concerning other physical and chemical characteristics of the sanitary sewer effluent are provided in Table 4-7. (All analytical results are included in the file “Ch4 LV Wastewater” provided
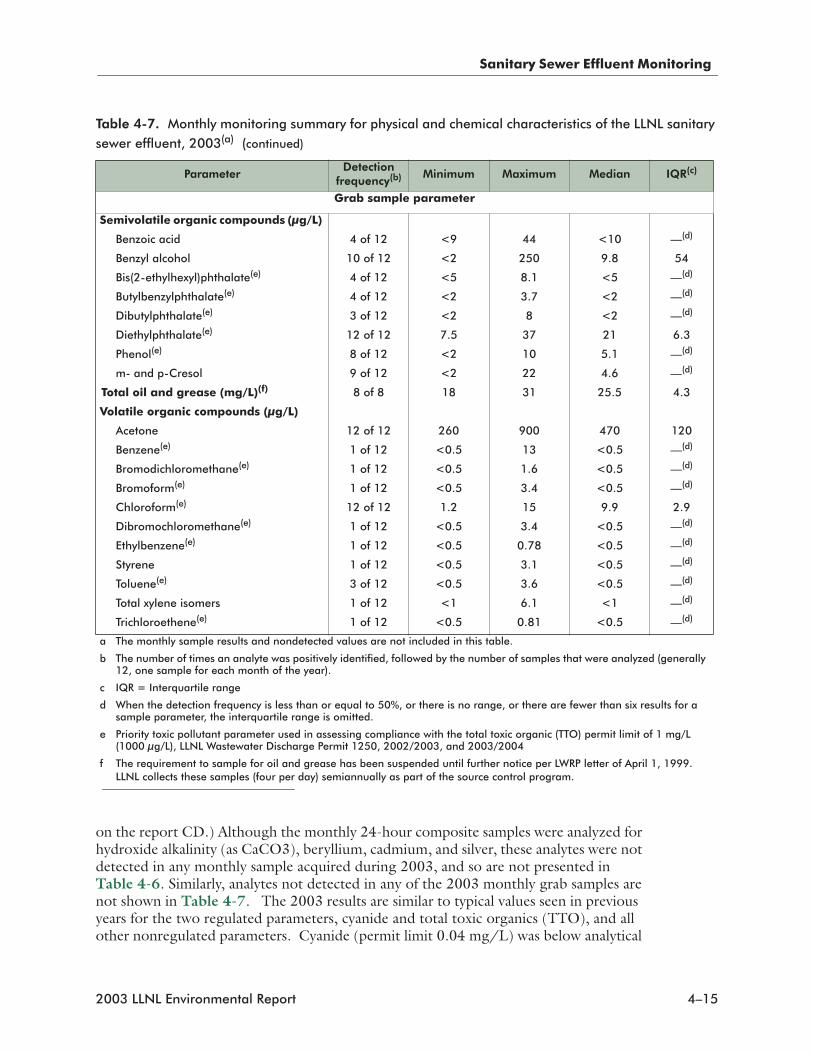
Table 4-7. Monthly monitoring summary for physical and chemical characteristics of the LLNL sanitary sewer effluent, 2003(a)
Parameter Detection
frequency(b) Minimum Maximum Median IQR(c)
24-hour composite sample parameter (mg/L)
AlkalinityBicarbonate alkalinity (as CaCO3) 12 of 12 220 280 255 15Carbonate alkalinity (as CaCO3) 3 of 12 <5 49 <5 —(d)
Total alkalinity (as CaCO3) 12 of 12 240 280 260 20Anions
Bromide 11 of 12 <0.1 0.7 0.25 0.2Chloride 12 of 12 47 250 54 7Fluoride 12 of 12 0.11 1.3 0.19 0.088Nitrate (as N) 2 of 12 <0.1 0.7 <0.1 —(d)
Nitrate (as NO3) 2 of 12 <0.4 3.1 <0.4 —(d)
Nitrate plus Nitrite (as N) 3 of 12 <0.1 0.7 <0.1 —(d)
Nitrite (as N) 6 of 12 <0.02 0.31 <0.022 —(d)
Nitrite (as NO2) 6 of 12 <0.065 1 <0.071 —(d)
Orthophosphate 12 of 12 12 25 19 3Sulfate 12 of 12 9.7 52 13 3.8
Nutrients Ammonia nitrogen (as N) 12 of 12 29 63 49 7.5Total Kjeldahl nitrogen 12 of 12 50 84 70 11Total phosphorus (as P) 12 of 12 7 15 11 3.3
Oxygen demand Biochemical oxygen demand 12 of 12 101 360 248 105Chemical oxygen demand 12 of 12 286 908 682 195
Solids Settleable solids 11 of 12 <0.5 46 35 8Total dissolved solids (TDS) 12 of 12 230 720 295 54.5Total suspended solids (TSS) 12 of 12 78 550 340 133Volatile solids 12 of 12 180 513 440 39.8
Total metals Aluminum 11 of 12 <0.2 0.96 0.6 0.36Calcium 12 of 12 13 45 20 5.3Iron 12 of 12 0.55 3.1 2 0.8Magnesium 12 of 12 2.3 19 3.2 0.65Potassium 12 of 12 20 27 24 3Selenium 1 of 12 <0.002 0.0024 <0.002 —(d)
Sodium 12 of 12 40 160 45 9.5Total organic carbon (TOC) 12 of 12 39 87 60 6.8
4–14 2003 LLNL Environmental Report
Sanitary Sewer Effluent Monitoring
on the report CD.) Although the monthly 24-hour composite samples were analyzed for hydroxide alkalinity (as CaCO3), beryllium, cadmium, and silver, these analytes were not detected in any monthly sample acquired during 2003, and so are not presented in Table 4-6. Similarly, analytes not detected in any of the 2003 monthly grab samples are not shown in Table 4-7. The 2003 results are similar to typical values seen in previous years for the two regulated parameters, cyanide and total toxic organics (TTO), and all other nonregulated parameters. Cyanide (permit limit 0.04 mg/L) was below analytical
Grab sample parameter
Semivolatile organic compounds (µg/L)
Benzoic acid 4 of 12 <9 44 <10 —(d)
Benzyl alcohol 10 of 12 <2 250 9.8 54
Bis(2-ethylhexyl)phthalate(e) 4 of 12 <5 8.1 <5 —(d)
Butylbenzylphthalate(e) 4 of 12 <2 3.7 <2 —(d)
Dibutylphthalate(e) 3 of 12 <2 8 <2 —(d)
Diethylphthalate(e) 12 of 12 7.5 37 21 6.3
Phenol(e) 8 of 12 <2 10 5.1 —(d)
m- and p-Cresol 9 of 12 <2 22 4.6 —(d)
Total oil and grease (mg/L)(f) 8 of 8 18 31 25.5 4.3
Volatile organic compounds (µg/L)
Acetone 12 of 12 260 900 470 120
Benzene(e) 1 of 12 <0.5 13 <0.5 —(d)
Bromodichloromethane(e) 1 of 12 <0.5 1.6 <0.5 —(d)
Bromoform(e) 1 of 12 <0.5 3.4 <0.5 —(d)
Chloroform(e) 12 of 12 1.2 15 9.9 2.9
Dibromochloromethane(e) 1 of 12 <0.5 3.4 <0.5 —(d)
Ethylbenzene(e) 1 of 12 <0.5 0.78 <0.5 —(d)
Styrene 1 of 12 <0.5 3.1 <0.5 —(d)
Toluene(e) 3 of 12 <0.5 3.6 <0.5 —(d)
Total xylene isomers 1 of 12 <1 6.1 <1 —(d)
Trichloroethene(e) 1 of 12 <0.5 0.81 <0.5 —(d)
a The monthly sample results and nondetected values are not included in this table.
b The number of times an analyte was positively identified, followed by the number of samples that were analyzed (generally 12, one sample for each month of the year).
c IQR = Interquartile range
d When the detection frequency is less than or equal to 50%, or there is no range, or there are fewer than six results for a sample parameter, the interquartile range is omitted.
e Priority toxic pollutant parameter used in assessing compliance with the total toxic organic (TTO) permit limit of 1 mg/L (1000 µg/L), LLNL Wastewater Discharge Permit 1250, 2002/2003, and 2003/2004
f The requirement to sample for oil and grease has been suspended until further notice per LWRP letter of April 1, 1999. LLNL collects these samples (four per day) semiannually as part of the source control program.
Table 4-7. Monthly monitoring summary for physical and chemical characteristics of the LLNL sanitary sewer effluent, 2003(a) (continued)
Parameter Detection
frequency(b) Minimum Maximum Median IQR(c)
2003 LLNL Environmental Report 4–15

Sanitary Sewer Effluent Monitoring
detection limits (0.02 mg/L) in both the January and July semiannual samples, and in the annual (October 2003) joint LLNL/LWRP co-sampling. The monthly TTO values ranged from 0.013 mg/L to 0.045 mg/L (with a TTO median value of 0.023 mg/L), well below the TTO permit limit of 1.0 mg/L. In addition to the organic compounds regulated under the TTO standard, six nonregulated organics were also detected in LLNL’s sanitary sewer effluent: three volatile organic compounds (acetone, styrene, and xylene) and three semivolatile organic compounds (benzoic acid, benzyl alcohol, and 3- & 4-methylphenol).
In 2003, the SMS continuous monitoring system detected a total of two inadvertent discharges outside the permitted pH range of 5 to 10. One of these events, with a pH below 5, was completely captured by the SDF. The other event, also with a pH below 5, occurred off-hours (Sunday, May 4, 2003) when the upstream pHMS was off-line. As a result, a front-end volume of low pH sanitary effluent was released to the LWRP system before a diversion to the SDF could be made. The LWRP was immediately notified of this low pH discharge; however, this incident did not represent a threat to the integrity of the operations of the LWRP, nor was it considered an enforceable exceedance of permit conditions. The lowest pH recorded for effluent contained in the May 4 release was 4.8.
Categorical Processes
The U.S. Environmental Protection Agency (EPA) publishes Categorical standards for broad categories of specific industrial processes determined to be the most significant contributors to point-source water pollution. These standards contain specific numerical limits for the discharge of industry-specific pollutants from individual processes. At LLNL, the federal Categorical requirements are incorporated into the wastewater discharge permit, which is administered by the LWRP. The number of processes at LLNL using these pollutants is subject to change as programmatic requirements dictate. During 2003, the LWRP identified 14 specific LLNL wastewater-generating processes that fall under the definition of two categorical standards: Electrical and Electronic Components (40 CFR 469), and Metal Finishing (40 CFR 433). Only those processes that discharge to the sanitary sewer require sampling, inspection, and reporting. Three of the 14 identified processes meet these criteria. In 2003, LLNL analyzed compliance samples for all regulated parameters from these three processes and demonstrated compliance with all federal Categorical discharge limits. Other processes that do not discharge to the sanitary sewer but would otherwise be regulated under the Metal-Finishing Point Source Category include printed circuit board manufacturing, electrol-ysis plating, chemical etching, electroplating, anodizing, coating, electrical discharge machining, and abrasive jet machining. These 11 nondischarging processes are evaluated semiannually. Wastewater from these nondischarging processes is either recycled or contained for eventual removal and appropriate disposal by LLNL’s RHWM Division. Because these processes do not discharge directly or indirectly to the sanitary sewer, they are not subject to the monitoring and reporting requirements contained in 40 CFR Part 433.
4–16 2003 LLNL Environmental Report
Sanitary Sewer Effluent Monitoring
During 2003, discharging Categorical processes were sampled semiannually and inspected and sampled annually by the LWRP staff. These samples were analyzed for all regulated parameters and were all within federal Categorical discharge limits. As part of normal operations, LLNL retains and analyzes all discharges from the Building 153 Categorical processes prior to discharge to the sanitary sewer. All monitoring data is reported to the LWRP in semiannual reports each January and July (Grayson and Brigdon 2003, 2004).
Discharges of Treated Groundwater
LLNL’s groundwater discharge permit (1510G, 2002-2004) allows treated ground-water from the Livermore site Ground Water Project (GWP) to be discharged in the City of Livermore sewer system. (See Chapter 7 for more information on the GWP.) During 2003, there were ten discharges to the sanitary sewer from the GWP. The total volume of treated groundwater discharged to sewer was 32,705 liters. In each of these discharge events, the groundwater released to the sanitary sewer originated from the lower zone, beneath the LLNL site. These volumes of groundwater (except the two cases noted below) were acquired at one of the on-site treatment facilities and used to condition new ion exchange resin columns. The two exceptions are 1) a volume of water that was collected directly from a well (rather than at a treatment unit) to study the production capacity of that well location and 2) a volume of water that was collected from a portable treatment unit and used as input to an electrocoagulation experiment. These ten events were separately sampled and discharged to the sewer during 2003, all in compliance with self-monitoring permit provisions and discharge limits of the permit. Complete moni-toring data are presented in the Ground Water Discharge Annual Self-Monitoring Report for 2003 (Revelli 2004a).
Environmental Impact on Sanitary Sewer Effluent
During 2003, no discharges exceeded any discharge limits for release of radioactive materials to the sanitary sewer. The data are comparable to the lowest historical values. All the values reported are a fraction of a percent of their corresponding limits with the exception of the maximum daily tritium value, which is 1.74%. The data demonstrate that LLNL has continued the trend of excellent control of radiological and nonradiolog-ical discharges to the sanitary sewer.
Monitoring results for 2003 reflect an extremely effective year for LLNL’s wastewater discharge control program and indicate no adverse impact to the LWRP or the environ-ment from LLNL sanitary sewer discharges. Overall, LLNL achieved greater than 99% compliance with the provisions of its wastewater discharge permit.
2003 LLNL Environmental Report 4–17
Site 300 Sewage Ponds and Surface Impoundments
SITE 300 SEWAGE PONDS AND SURFACE IMPOUNDMENTS
Wastewater samples from the sewage evaporation pond influent and overflow, photo-graphic Chemistry and Explosives Process Areas, and discharges to the Class II surface impoundments were obtained in accordance with the written standardized procedures summarized in the Environmental Monitoring Plan (Woods 2002). Standard sample handling and hygiene procedures were employed to prevent cross-contamination (e.g., wearing disposable gloves, decontaminating equipment between uses, and maintaining samples at 4 ± 2 °C). Duplicates, field blanks, and trip blanks were obtained for quality assurance/quality control (QA/QC) purposes.
Sewage Evaporation and Percolation Ponds
Sewage generated at buildings in the General Services Area is discharged into a lined evaporation pond. The wastewater is disposed of through evaporation from the pond. However, during rare periods of high rainfall, treated wastewater may overflow into an unlined percolation pond, where it enters the ground and the shallow groundwater.
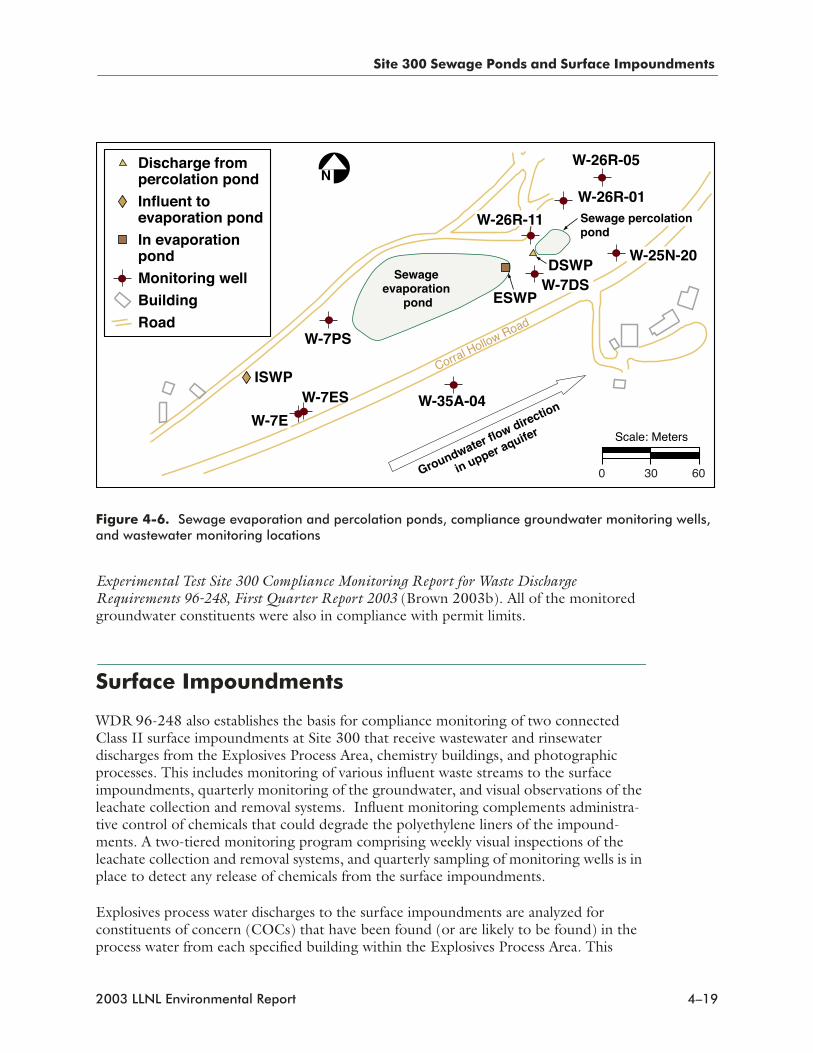
The environmental monitoring requirements for the sewage evaporation and percolation ponds (hereafter collectively referred to as sewage ponds) are specified in the Monitoring and Reporting Program (MRP) for Waste Discharge Requirements Order No. 96-248 (WDR 96-248). The monitoring requirements include both wastewater monitoring and groundwater monitoring to detect potential impacts of the sewage on groundwater quality. Wastewater is sampled quarterly at a pond influent location (ISWP) and within the sewage evaporation pond (ESWP). Overflows into the adjacent percolation pond are also permitted under WDR 96-248 and are sampled as needed at discharge location DSWP. Nine groundwater monitoring wells are sampled semiannually to provide infor-mation on the groundwater quality in the vicinity of the sewage ponds. All sampling locations are shown in Figure 4-6. The wells are screened in three different geological formations: Qal, Tnbs1, and Tnsc1 (see Chapter 7). Tnbs1 (Neroly Formation lower blue sandstone unit) is the regional aquifer.
All wastewater parameters for the sewage evaporation and percolation ponds complied with permit provisions and specifications throughout 2003. There was one continuous overflow to the percolation pond that began in December 2002 and continued into the first quarter of 2003. This permitted discharge was sampled twice and reported to the Central Valley Regional Water Quality Control Board (CVRWQCB). For details, see LLNL Experimental Test Site 300 Compliance Monitoring Report for Waste Discharge Requirements 96-248, Annual/Fourth Quarter Report 2002 (Brown 2003a) and LLNL
4–18 2003 LLNL Environmental Report
Site 300 Sewage Ponds and Surface Impoundments
Experimental Test Site 300 Compliance Monitoring Report for Waste Discharge Requirements 96-248, First Quarter Report 2003 (Brown 2003b). All of the monitored groundwater constituents were also in compliance with permit limits.
Surface Impoundments
WDR 96-248 also establishes the basis for compliance monitoring of two connected Class II surface impoundments at Site 300 that receive wastewater and rinsewater discharges from the Explosives Process Area, chemistry buildings, and photographic processes. This includes monitoring of various influent waste streams to the surface impoundments, quarterly monitoring of the groundwater, and visual observations of the leachate collection and removal systems. Influent monitoring complements administra-tive control of chemicals that could degrade the polyethylene liners of the impound-ments. A two-tiered monitoring program comprising weekly visual inspections of the leachate collection and removal systems, and quarterly sampling of monitoring wells is in place to detect any release of chemicals from the surface impoundments.
Explosives process water discharges to the surface impoundments are analyzed for constituents of concern (COCs) that have been found (or are likely to be found) in the process water from each specified building within the Explosives Process Area. This
Figure 4-6. Sewage evaporation and percolation ponds, compliance groundwater monitoring wells, and wastewater monitoring locations
Scale: Meters
W-7DS
W-26R-11
W-35A-04W-7E
W-7ES
W-7PS
W-26R-01
W-25N-20
W-26R-05
ISWP
ESWP
Groundwater flow direction
in upper aquifer
DSWP
Corral Hollow Road
N
Sewage percolationpond
0 30 60
Sewage evaporation
pond
2003 LLNL Environmental Report 4–19
Site 300 Sewage Ponds and Surface Impoundments
monitoring program includes process wastewater from Buildings 806/807, 809, and 817. WDR 96-248 requires annual analysis of this waste stream. WDR 96-248 also establishes limits for discharges of COCs into the surface impoundments and requires monitoring of the photographic process and Chemistry Area wastewater retention tanks that discharge to the surface impoundments. Influent streams are monitored at a prescribed frequency for area-specific COCs. Retention tanks containing photographic process rinsewater from Buildings 801, 823, and 851 are regulated by effluent discharge limits specified in WDR 96-248. Discharges to the surface impoundments occur after samples are obtained, except for rinsewater from the Building 823 retention tanks, which is discharged automatically to the surface impoundments and sampled quarterly. Samples of process wastewater from the Chemistry Area (Buildings 825, 826, and 827 Complex) are collected when the retention tanks are ready for discharge to the surface impoundments. The wastewater is held in retention tanks until analytical results indicate compliance with WDR 96-248.
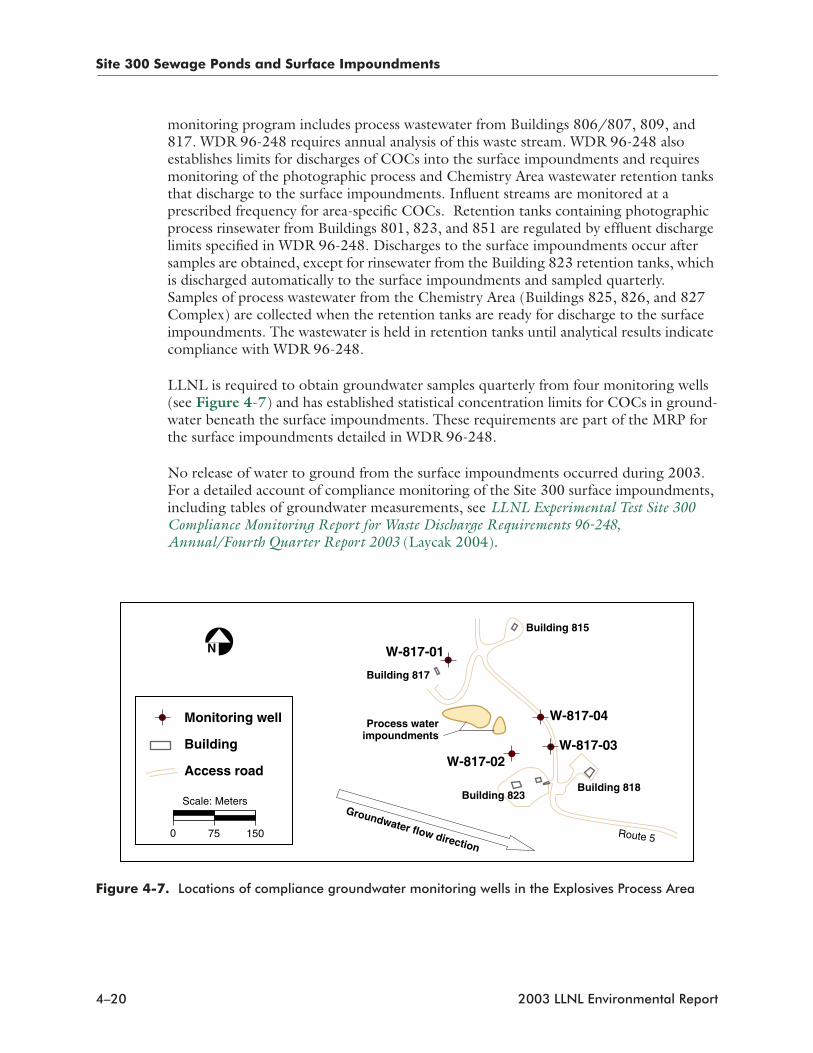
LLNL is required to obtain groundwater samples quarterly from four monitoring wells (see Figure 4-7) and has established statistical concentration limits for COCs in ground-water beneath the surface impoundments. These requirements are part of the MRP for the surface impoundments detailed in WDR 96-248.
No release of water to ground from the surface impoundments occurred during 2003. For a detailed account of compliance monitoring of the Site 300 surface impoundments, including tables of groundwater measurements, see LLNL Experimental Test Site 300 Compliance Monitoring Report for Waste Discharge Requirements 96-248, Annual/Fourth Quarter Report 2003 (Laycak 2004).
Figure 4-7. Locations of compliance groundwater monitoring wells in the Explosives Process Area
Building 823Groundwater flow direction
Building 818
Building 815
W-817-01
Building 817
W-817-02
Process waterimpoundments
W-817-03
W-817-04
Route 5
Monitoring well
Building
Access road
150
Scale: Meters
0 75
N
4–20 2003 LLNL Environmental Report
Site 300 Sewage Ponds and Surface Impoundments
During 2003, all discharges into the surface impoundments were in compliance with discharge effluent limits. Groundwater concentrations of some inorganic COCs were higher than the statistical limits during 2003. LLNL determined that the elevated concentrations of these COCs do not originate from leakage from the surface impound-ments to the groundwater. LLNL continues to monitor and to track these concentra-tions. For details, see Laycak (2004).
The two leachate collection and removal systems were monitored weekly for the pres-ence of liquids to identify potential leaks. None was observed during 2003. No water has been observed in the leachate collection and removal system since liner repairs were made in 1997.
Explosive compounds (HMX, RDX, and breakdown products) and perchlorate are the compounds most indicative of discharges to groundwater from the Explosives Process Area surface impoundments. However, prior to 1985, explosives wastewater was discharged into unlined ponds in the vicinity of the present surface impoundments where it infiltrated the soil; some of the explosives wastewater reached groundwater. Because of this past practice, it is necessary under regulations to discriminate between new releases from the surface impoundments and past releases from the unlined ponds.
Percolation Pits
Percolation pits that are designed to accept discharges from mechanical equipment are located at Site 300 Buildings 806A, 827A, 827C, 827D, and 827E. In other remote Site 300 facilities, these types of waste streams are discharged to septic systems. These discharges are permitted by WDR 96-248, which specifies monthly observations and monitoring requirements for overflows. Overflows of the percolation pits, should they occur, are sampled and analyzed to determine the concentrations of any metals present. During 2003, the percolation pits at Buildings 806A, 827C, 827D, and 827E operated normally with no overflows (Laycak 2004).
Environmental Impact on Sewage Ponds and Surface Impoundments
All discharges from the Site 300 sewage evaporation and percolation ponds, as well as discharges to the Class II surface impoundments from the Explosives Process Area, were in compliance with discharge limits. Groundwater monitoring related to these areas indicates that there were no measurable impacts to the groundwater from these LLNL wastewater discharges.
2003 LLNL Environmental Report 4–21
Storm Water Compliance and Surveillance Monitoring
STORM WATER COMPLIANCE AND SURVEILLANCE MONITORING
To assess compliance with permit requirements, LLNL monitors storm water at the Livermore site in accordance with WDR 95-174, National Pollutant Discharge Elimina-tion System (NPDES) Permit No. CA0030023, issued in 1995 by the San Francisco Bay Regional Water Quality Control Board (SFBRWQCB 1995). LLNL monitors storm water discharges at Site 300 in accordance with the California NPDES General Permit for Storm Water Discharges Associated with Industrial Activity (WDR 97-03-DWQ), NPDES Permit No. CAS000001, State Water Resources Control Board (SWRCB 1997). In 2003, for construction projects that disturb 0.4 hectares (1 acre) of land or more LLNL also met the storm water compliance monitoring requirements of the California NPDES General Permit for Storm Water Discharges Associated with Construction Activity (WDR 99-08-DWQ, NPDES Permit No. CAS000002) (SWRCB 1999) and subsequent modifications.
In addition, Site 300 storm water monitoring meets the requirements of the Post-Closure Plan for the Pit 6 Landfill Operable Unit (Ferry et al. 1998), which includes specific monitoring and reporting requirements. In addition to the storm water quality constitu-ents required by the closure plan, LLNL monitors other constituents to provide a more complete water quality profile. Appendix A includes the current list of analyses conducted on storm water, including analytical methods and typical reporting limits.
Storm water monitoring at both sites also follows the requirements in the Environmental Regulatory Guide for Radiological Effluent Monitoring and Environmental Surveillance (U.S. DOE 1991) and meets the applicable requirements of DOE Order 5400.5, Radiation Protection of the Public and the Environment.
At all monitoring locations at both the Livermore site and Site 300, grab samples are collected from the storm water runoff flowing in the storm drains and stream channels. Grab samples are collected by partially submerging sample bottles directly into the water and allowing them to fill with the sample water. If the water to be sampled is not directly accessible, a stainless-steel bucket or an automatic water sampler is used for sampling. The bucket is triple-rinsed with the water to be sampled, then dipped or submerged into the water and withdrawn in a smooth motion. Sampling is conducted away from the edge of the arroyo to prevent the collection of sediment into the water samples. Sample vials for volatile organics are filled before sample bottles for all other constituents and parameters. In addition to chemical monitoring, LLNL is required by NPDES permit WDR 95-174 to conduct acute and chronic fish toxicity testing on samples from the Arroyo Las Positas (Livermore site) once per wet season. LLNL is not required to test for fish toxicity at Site 300.
4–22 2003 LLNL Environmental Report

Storm Water Compliance and Surveillance Monitoring
For the purpose of evaluating the overall impact of the Livermore site and Site 300 operations on storm water quality, storm water flows are sampled at upstream and down-stream locations. Because of flow patterns at the Livermore site, storm water at sampling locations includes runoff from other sources, such as neighboring agricultural land, parking lots, and landscaped areas. In contrast, storm water at Site 300 is sampled at locations that target specific on-site activities with no run-on from off-site sources. These samples provide information used to evaluate the effectiveness of LLNL’s storm water pollution control program.
NPDES permits for storm water require that LLNL sample effluent two times per year. In addition, LLNL is required to visually inspect the storm drainage system during the first hour of one storm event per month in the wet season (defined as October of one year through April [Livermore site] or May [Site 300] of the following year) to observe runoff quality and twice during the dry season to identify any dry weather flows. Influent sampling is also required at the Livermore site. LLNL monitors up to four storm events each year at the Livermore site in support of DOE Order 5400.5. In addition, annual facility inspections are required to ensure that the best management practices (BMPs) to control storm water pollution are implemented and adequate.
Constituent Criteria
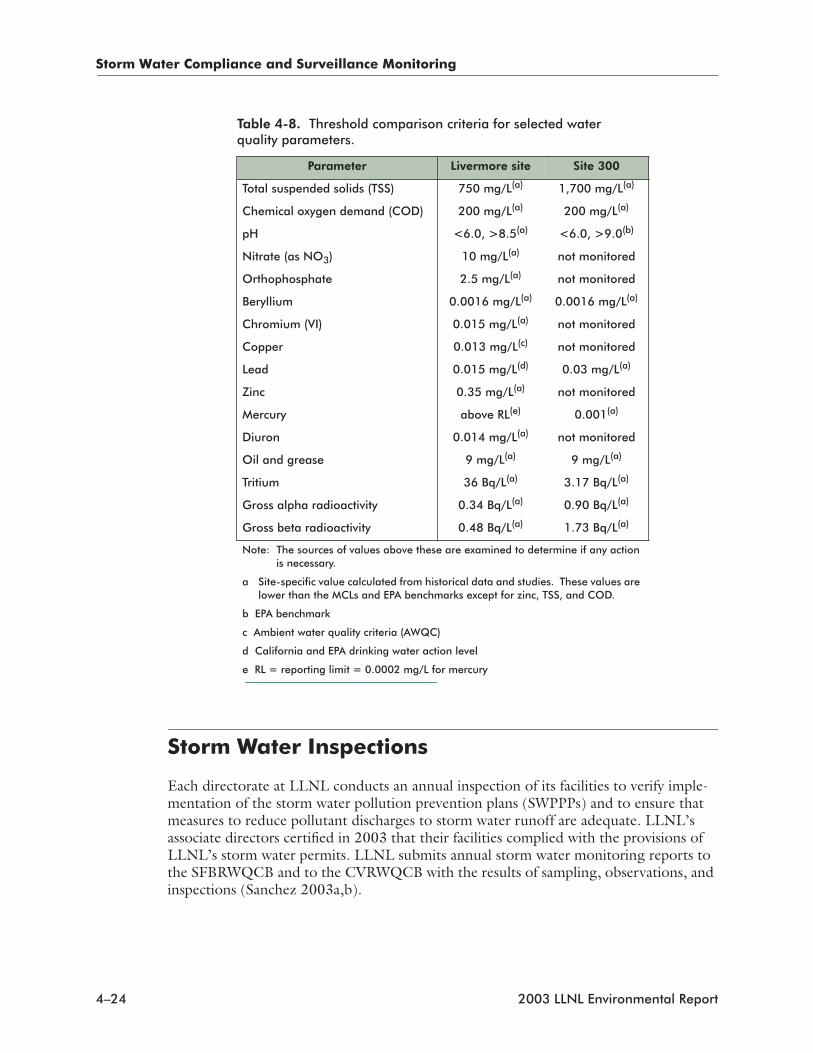
There are no numeric criteria that limit concentrations of specific constituents in LLNL’s storm water effluent. The U.S. Environmental Protection Agency (EPA) established parameter benchmark values, but stressed that these concentrations are not intended to be interpreted as effluent limits (U.S. EPA 2000). Rather, the values are levels that the EPA has used to determine if storm water discharged from any given facility merits further monitoring. Although these criteria are not directly applicable, they are used as comparison criteria to help evaluate LLNL’s storm water management program. To further evaluate the storm water management program, LLNL established or calculated site-specific threshold comparison criteria for a select group of parameters. A value exceeds the threshold if it is greater than the 95% confidence limit computed for the historical mean value for a specific parameter (Table 4-8). The threshold comparison criteria are used to identify out-of-the-ordinary data that merit further investigation to determine if concentrations of that parameter are increasing in the storm water runoff. For a better understanding of how LLNL storm water data relate to other target values, water samples are also compared with criteria listed in the Water Quality Control Plan, San Francisco Bay Basin (SFBRWQCB 1995), The Water Quality Control Plan (Basin Plan) for the California Regional Water Quality Control Board, Central Valley Region, Sacramento and San Joaquin River Basins (CVRWQCB 1998), state and federal maximum contaminant levels (MCLs), and ambient water quality criteria (AWQC). The greatest importance is placed on the site-specific comparison criteria calculated from historical concentrations in storm runoff.
2003 LLNL Environmental Report 4–23
Storm Water Compliance and Surveillance Monitoring
Storm Water Inspections
Each directorate at LLNL conducts an annual inspection of its facilities to verify imple-mentation of the storm water pollution prevention plans (SWPPPs) and to ensure that measures to reduce pollutant discharges to storm water runoff are adequate. LLNL’s associate directors certified in 2003 that their facilities complied with the provisions of LLNL’s storm water permits. LLNL submits annual storm water monitoring reports to the SFBRWQCB and to the CVRWQCB with the results of sampling, observations, and inspections (Sanchez 2003a,b).
Table 4-8. Threshold comparison criteria for selected water quality parameters.
Parameter Livermore site Site 300
Total suspended solids (TSS) 750 mg/L(a) 1,700 mg/L(a)
Chemical oxygen demand (COD) 200 mg/L(a) 200 mg/L(a)
pH <6.0, >8.5(a) <6.0, >9.0(b)
Nitrate (as NO3) 10 mg/L(a) not monitored
Orthophosphate 2.5 mg/L(a) not monitored
Beryllium 0.0016 mg/L(a) 0.0016 mg/L(a)
Chromium (VI) 0.015 mg/L(a) not monitored
Copper 0.013 mg/L(c) not monitored
Lead 0.015 mg/L(d) 0.03 mg/L(a)
Zinc 0.35 mg/L(a) not monitored
Mercury above RL(e) 0.001(a)
Diuron 0.014 mg/L(a) not monitored
Oil and grease 9 mg/L(a) 9 mg/L(a)
Tritium 36 Bq/L(a) 3.17 Bq/L(a)
Gross alpha radioactivity 0.34 Bq/L(a) 0.90 Bq/L(a)
Gross beta radioactivity 0.48 Bq/L(a) 1.73 Bq/L(a)
Note: The sources of values above these are examined to determine if any action is necessary.
a Site-specific value calculated from historical data and studies. These values are lower than the MCLs and EPA benchmarks except for zinc, TSS, and COD.
b EPA benchmark
c Ambient water quality criteria (AWQC)
d California and EPA drinking water action level
e RL = reporting limit = 0.0002 mg/L for mercury
4–24 2003 LLNL Environmental Report
Storm Water Compliance and Surveillance Monitoring
For each construction project permitted by WDR 99-08-DWQ, LLNL conducts visual observations of construction sites before, during, and after storms to assess the effective-ness of BMPs. Annual compliance certifications summarize these inspections. Annual compliance certifications for 2003 covered the period of June 2002 through May 2003. When requested by the respective regional water quality control board (RWQCB), LLNL completes annual compliance status reports that cover the same reporting period. During the 2002/2003 reporting period, LLNL had active permits for seven projects located at the Livermore site (see Table 2-2). The SFBRWQCB requested completion of compliance status reports for all the Livermore site construction projects in 2003.
Livermore Site
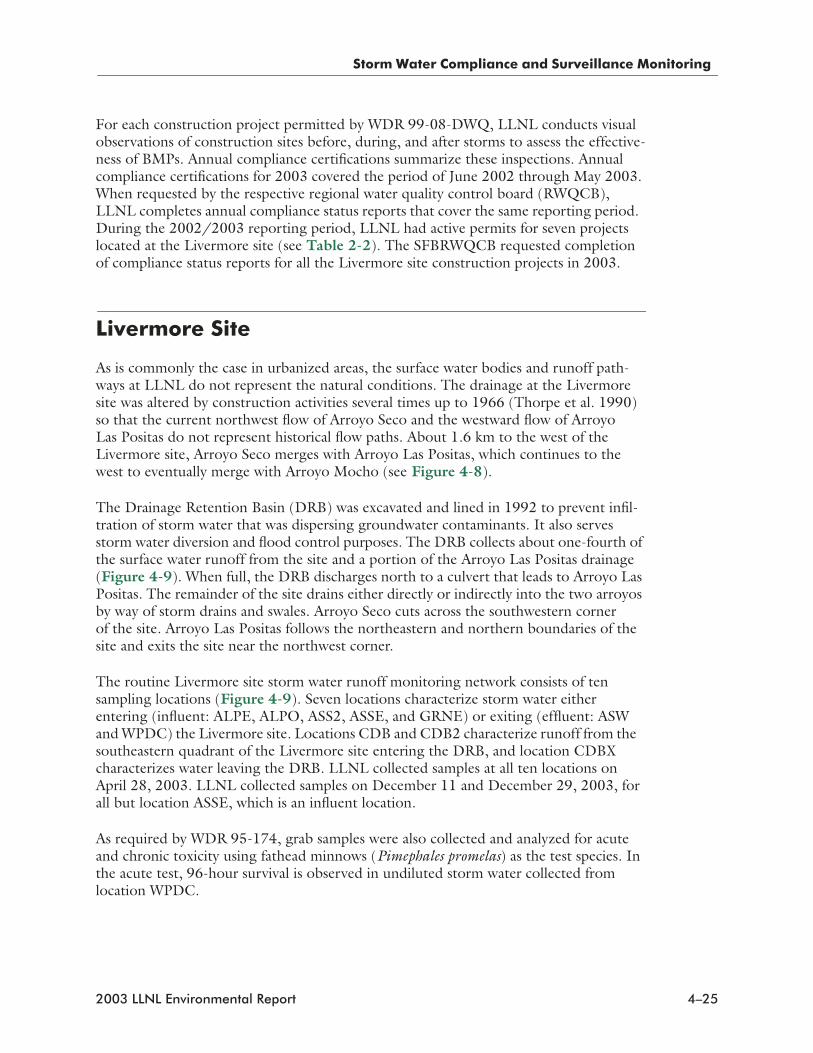
As is commonly the case in urbanized areas, the surface water bodies and runoff path-ways at LLNL do not represent the natural conditions. The drainage at the Livermore site was altered by construction activities several times up to 1966 (Thorpe et al. 1990) so that the current northwest flow of Arroyo Seco and the westward flow of Arroyo Las Positas do not represent historical flow paths. About 1.6 km to the west of the Livermore site, Arroyo Seco merges with Arroyo Las Positas, which continues to the west to eventually merge with Arroyo Mocho (see Figure 4-8).
The Drainage Retention Basin (DRB) was excavated and lined in 1992 to prevent infil-tration of storm water that was dispersing groundwater contaminants. It also serves storm water diversion and flood control purposes. The DRB collects about one-fourth of the surface water runoff from the site and a portion of the Arroyo Las Positas drainage (Figure 4-9). When full, the DRB discharges north to a culvert that leads to Arroyo Las Positas. The remainder of the site drains either directly or indirectly into the two arroyos by way of storm drains and swales. Arroyo Seco cuts across the southwestern corner of the site. Arroyo Las Positas follows the northeastern and northern boundaries of the site and exits the site near the northwest corner.
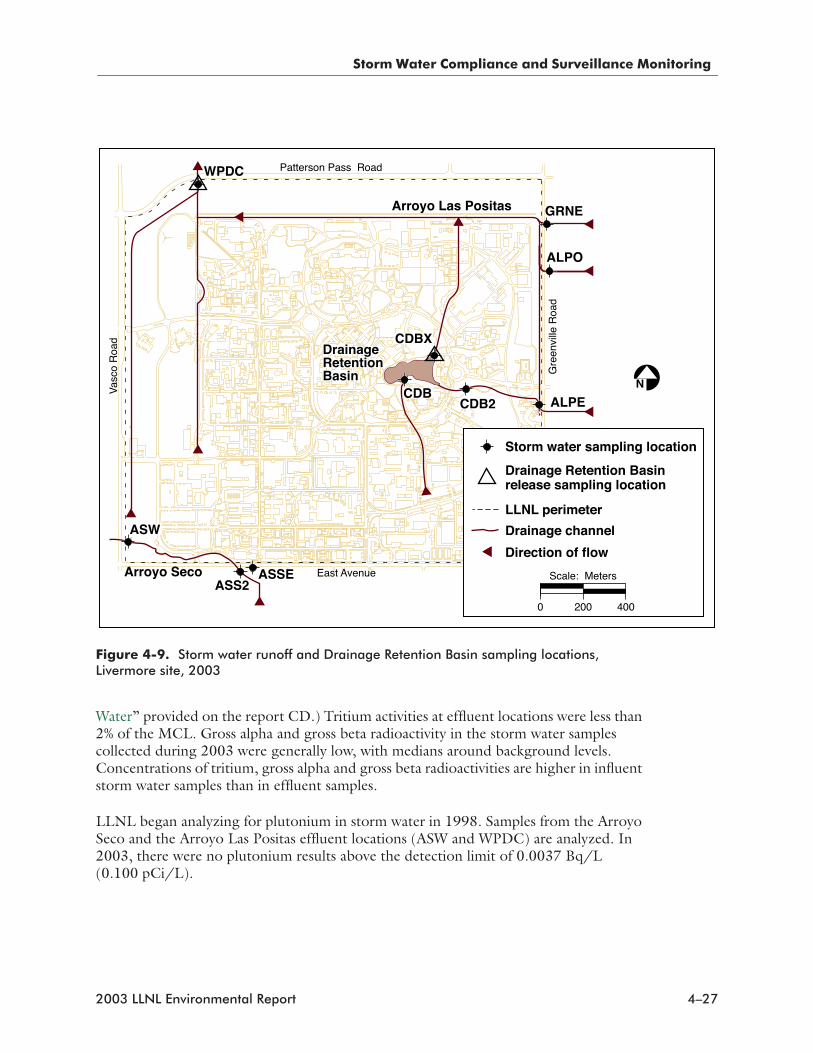
The routine Livermore site storm water runoff monitoring network consists of ten sampling locations (Figure 4-9). Seven locations characterize storm water either entering (influent: ALPE, ALPO, ASS2, ASSE, and GRNE) or exiting (effluent: ASW and WPDC) the Livermore site. Locations CDB and CDB2 characterize runoff from the southeastern quadrant of the Livermore site entering the DRB, and location CDBX characterizes water leaving the DRB. LLNL collected samples at all ten locations on April 28, 2003. LLNL collected samples on December 11 and December 29, 2003, for all but location ASSE, which is an influent location.
As required by WDR 95-174, grab samples were also collected and analyzed for acute and chronic toxicity using fathead minnows (Pimephales promelas) as the test species. In the acute test, 96-hour survival is observed in undiluted storm water collected from location WPDC.
2003 LLNL Environmental Report 4–25

Storm Water Compliance and Surveillance Monitoring
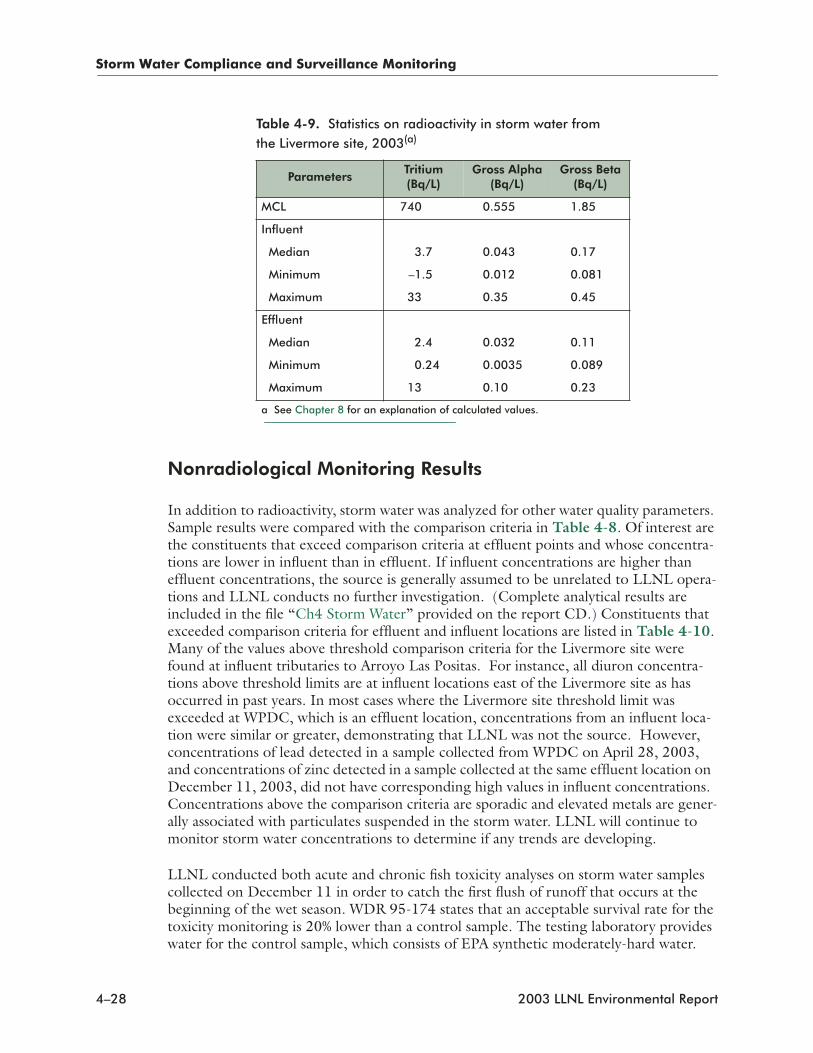
Radiological Monitoring Results
Storm water sampling and analysis were performed for gross alpha, gross beta, pluto-nium, and tritium. Storm water gross alpha, gross beta, and tritium results are summa-rized in Table 4-9. (Complete analytical results are included in the file “Ch4 Storm
Figure 4-8. Surface waterways in the vicinity of the Livermore site
East Avenue
Southern Pacific Railro
ad
Arroyo Seco
Va
sco
Ro
ad
Patterson Pass Road
Gre
en
ville
Ro
ad
South Livermore Avenue
Arroyo Mocho
Springtown
Tesla Road
Arroyo
Las Positas
SandiaNational
Laboratories/California
SandiaNational
Laboratories/California
To Arroyo Mocho
LawrenceLivermoreNational
Laboratory
0 1 2
Scale: Kilometers
N
580
4–26 2003 LLNL Environmental Report
Storm Water Compliance and Surveillance Monitoring
Water” provided on the report CD.) Tritium activities at effluent locations were less than 2% of the MCL. Gross alpha and gross beta radioactivity in the storm water samples collected during 2003 were generally low, with medians around background levels. Concentrations of tritium, gross alpha and gross beta radioactivities are higher in influent storm water samples than in effluent samples.
LLNL began analyzing for plutonium in storm water in 1998. Samples from the Arroyo Seco and the Arroyo Las Positas effluent locations (ASW and WPDC) are analyzed. In 2003, there were no plutonium results above the detection limit of 0.0037 Bq/L (0.100 pCi/L).
Figure 4-9. Storm water runoff and Drainage Retention Basin sampling locations, Livermore site, 2003
N
ALPE
ALPO
ASS2
ASW
WPDC
GRNE
CDBCDB2
CDBXDrainageDrainageRetentionRetentionBasinBasin
DrainageRetentionBasin
ASSE
Patterson Pass Road
Gre
envi
lle R
oad
Vas
co R
oad
East Avenue Scale: Meters
4002000
Arroyo Las Positas
Arroyo Seco
2003 LLNL Environmental Report 4–27
Storm Water Compliance and Surveillance Monitoring
Nonradiological Monitoring Results
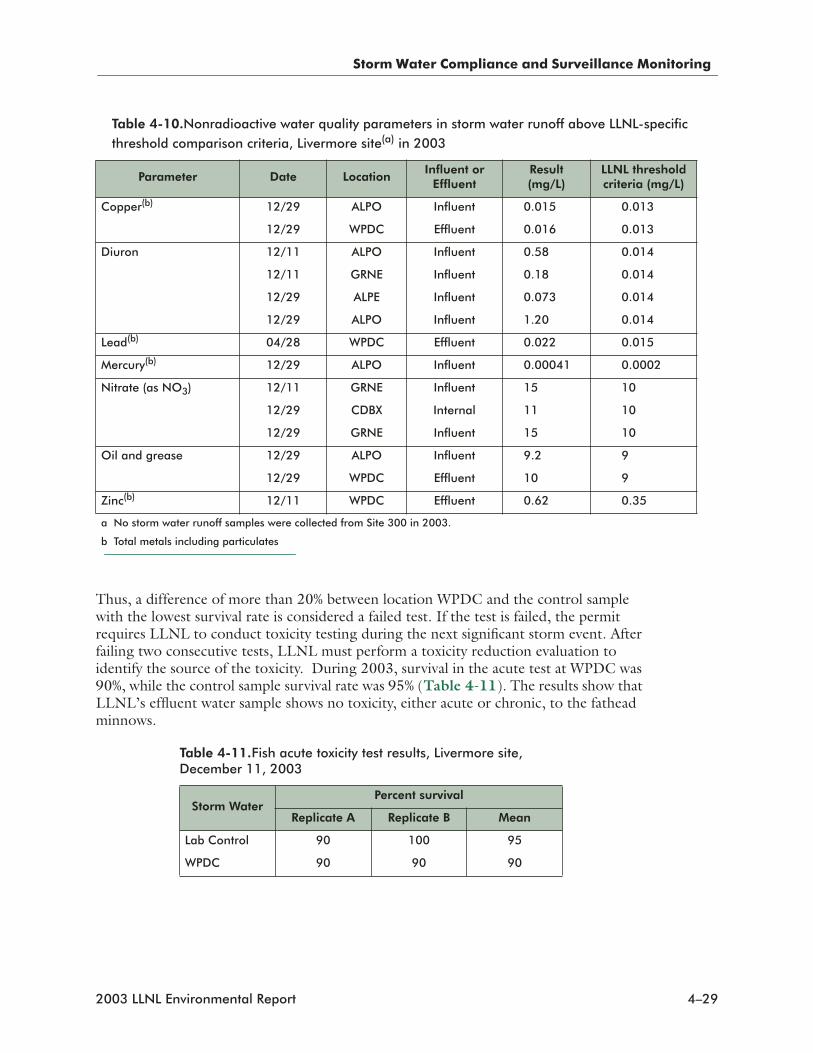
In addition to radioactivity, storm water was analyzed for other water quality parameters. Sample results were compared with the comparison criteria in Table 4-8. Of interest are the constituents that exceed comparison criteria at effluent points and whose concentra-tions are lower in influent than in effluent. If influent concentrations are higher than effluent concentrations, the source is generally assumed to be unrelated to LLNL opera-tions and LLNL conducts no further investigation. (Complete analytical results are included in the file “Ch4 Storm Water” provided on the report CD.) Constituents that exceeded comparison criteria for effluent and influent locations are listed in Table 4-10. Many of the values above threshold comparison criteria for the Livermore site were found at influent tributaries to Arroyo Las Positas. For instance, all diuron concentra-tions above threshold limits are at influent locations east of the Livermore site as has occurred in past years. In most cases where the Livermore site threshold limit was exceeded at WPDC, which is an effluent location, concentrations from an influent loca-tion were similar or greater, demonstrating that LLNL was not the source. However, concentrations of lead detected in a sample collected from WPDC on April 28, 2003, and concentrations of zinc detected in a sample collected at the same effluent location on December 11, 2003, did not have corresponding high values in influent concentrations. Concentrations above the comparison criteria are sporadic and elevated metals are gener-ally associated with particulates suspended in the storm water. LLNL will continue to monitor storm water concentrations to determine if any trends are developing.
LLNL conducted both acute and chronic fish toxicity analyses on storm water samples collected on December 11 in order to catch the first flush of runoff that occurs at the beginning of the wet season. WDR 95-174 states that an acceptable survival rate for the toxicity monitoring is 20% lower than a control sample. The testing laboratory provides water for the control sample, which consists of EPA synthetic moderately-hard water.
Table 4-9. Statistics on radioactivity in storm water from the Livermore site, 2003(a)
ParametersTritium (Bq/L)
Gross Alpha (Bq/L)
Gross Beta (Bq/L)
MCL 740 0.555 1.85
Influent
Median 3.7 0.043 0.17
Minimum –1.5 0.012 0.081
Maximum 33 0.35 0.45
Effluent
Median 2.4 0.032 0.11
Minimum 0.24 0.0035 0.089
Maximum 13 0.10 0.23
a See Chapter 8 for an explanation of calculated values.
4–28 2003 LLNL Environmental Report
Storm Water Compliance and Surveillance Monitoring
Thus, a difference of more than 20% between location WPDC and the control sample with the lowest survival rate is considered a failed test. If the test is failed, the permit requires LLNL to conduct toxicity testing during the next significant storm event. After failing two consecutive tests, LLNL must perform a toxicity reduction evaluation to identify the source of the toxicity. During 2003, survival in the acute test at WPDC was 90%, while the control sample survival rate was 95% (Table 4-11). The results show that LLNL’s effluent water sample shows no toxicity, either acute or chronic, to the fathead minnows.
Table 4-10.Nonradioactive water quality parameters in storm water runoff above LLNL-specific threshold comparison criteria, Livermore site(a) in 2003
Parameter Date LocationInfluent or
EffluentResult (mg/L)
LLNL threshold criteria (mg/L)
Copper(b) 12/29 ALPO Influent 0.015 0.013
12/29 WPDC Effluent 0.016 0.013
Diuron 12/11 ALPO Influent 0.58 0.014
12/11 GRNE Influent 0.18 0.014
12/29 ALPE Influent 0.073 0.014
12/29 ALPO Influent 1.20 0.014
Lead(b) 04/28 WPDC Effluent 0.022 0.015
Mercury(b) 12/29 ALPO Influent 0.00041 0.0002
Nitrate (as NO3) 12/11 GRNE Influent 15 10
12/29 CDBX Internal 11 10
12/29 GRNE Influent 15 10
Oil and grease 12/29 ALPO Influent 9.2 9
12/29 WPDC Effluent 10 9
Zinc(b) 12/11 WPDC Effluent 0.62 0.35
a No storm water runoff samples were collected from Site 300 in 2003.
b Total metals including particulates
Table 4-11.Fish acute toxicity test results, Livermore site, December 11, 2003
Storm Water Percent survival
Replicate A Replicate B Mean
Lab Control 90 100 95
WPDC 90 90 90
2003 LLNL Environmental Report 4–29
Storm Water Compliance and Surveillance Monitoring
Site 300
Surface water at Site 300 consists of seasonal runoff, springs, and natural and man-made ponds. The primary waterway in the Site 300 area is Corral Hollow Creek, an ephemeral stream that borders the site to the south and southeast. No naturally continuously flowing streams are present in the Site 300 area. Elk Ravine is the major drainage for most of Site 300; it extends from the northwest portion of the site to the east–central area. Elk Ravine drains the center of the site into Corral Hollow Creek, which drains eastward toward the San Joaquin River Basin. Some smaller canyons in the northeast portion of the site drain to the north and east toward Tracy.
There are at least 23 springs at Site 300. Nineteen are perennial, and four are intermit-tent. Most of the springs have very low flow rates and are recognized only by small marshy areas, pools of water, or vegetation. Several artificial surface water bodies at Site 300 that are in fact wastewater treatment units are discussed above. Three wetlands created by now-discontinued flows from cooling towers located at Buildings 827, 851, and 865 were maintained in 2003 by discharges of potable water.
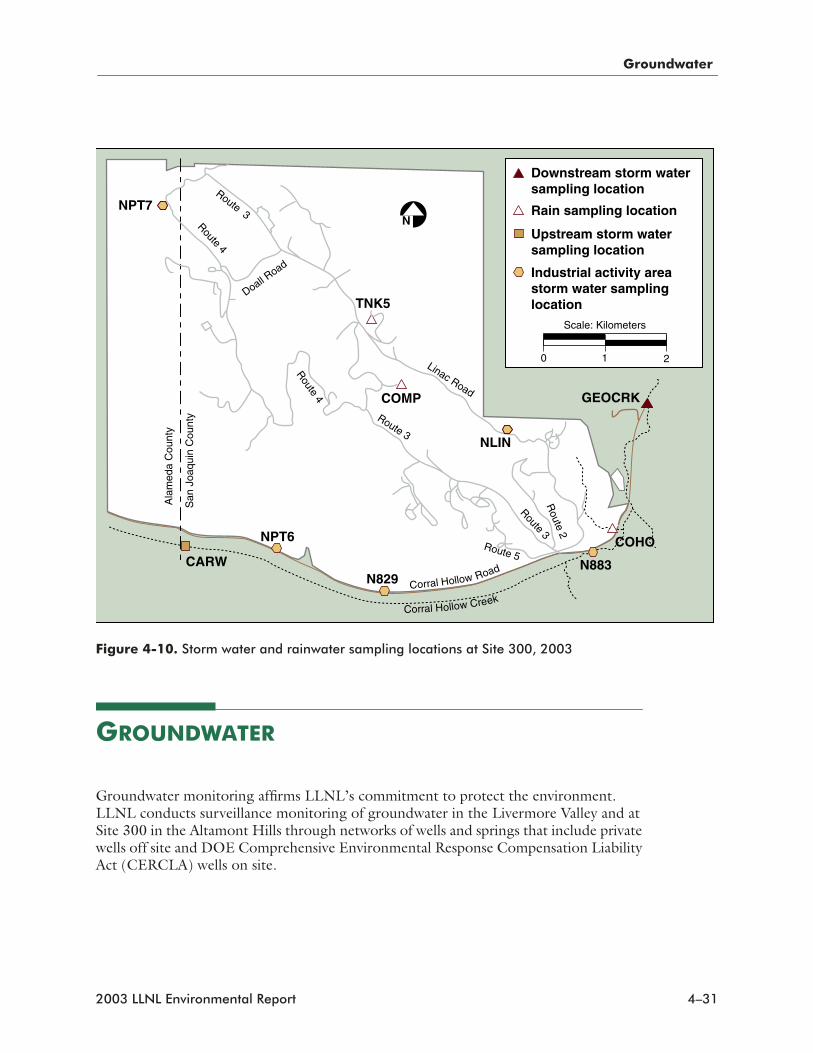
Seven on-site Site 300 storm water sampling locations were selected to characterize storm water runoff at locations that could be affected by specific Site 300 activities. Off-site location CARW is used to characterize Corral Hollow Creek upstream and therefore is unaffected by Site 300 industrial storm water discharges. Location GEOCRK is used to characterize Corral Hollow Creek downstream of Site 300. These locations are shown in Figure 4-10.
The Site 300 storm water permit specifies sampling a minimum of two storms per rainy season. Typically, a single storm does not produce runoff at all Site 300 locations because Site 300 receives relatively little rainfall and is largely undeveloped with few paved areas. Therefore, at many locations, a series of large storms is required to saturate the ground before runoff can occur. At some of the sampling locations in some years, there is not enough rain to generate runoff over an entire rainy season. In 2003, no storm water runoff samples were collected from Site 300 drainages. Runoff did occur on December 29, 2003, but no runoff was collected for sampling because there was insuffi-cient staff.
Environmental Impact on Storm Water
Storm water runoff from the Livermore site did not have any apparent environmental impacts in 2003. Tritium activities in storm water runoff effluent were less than 2% of the drinking water MCL. Gross alpha and gross beta activities in effluent samples were both less than 20% of their respective MCLs. The fish toxicity tests showed no discern-ible toxicity in Livermore site storm water runoff.
4–30 2003 LLNL Environmental Report
Groundwater
GROUNDWATER
Groundwater monitoring affirms LLNL’s commitment to protect the environment. LLNL conducts surveillance monitoring of groundwater in the Livermore Valley and at Site 300 in the Altamont Hills through networks of wells and springs that include private wells off site and DOE Comprehensive Environmental Response Compensation Liability Act (CERCLA) wells on site.
Figure 4-10. Storm water and rainwater sampling locations at Site 300, 2003
Corral Hollow CreekCorral Hollow Road
N
Scale: Kilometers
0 1 2
Route 4
Route 3
Route 4
Route 5
Route 3
Linac Road
Route 3R
oute 2
Doall Road
Ala
med
a C
ount
y
San
Joa
quin
Cou
nty
Upstream storm watersampling location
Industrial activity area storm water samplinglocation
Rain sampling location
Downstream storm watersampling location
NPT6
CARW
COMP
TNK5
N829N883
NPT7
GEOCRK
COHO
NLIN
2003 LLNL Environmental Report 4–31
Groundwater
The groundwaters of the two monitored areas are not connected; they are separated by a major drainage divide and numerous faults. The Livermore site in the Livermore Valley drains to the San Francisco Bay via Alameda Creek. Most of Site 300 drains to the San Joaquin River Basin via Corral Hollow Creek, with a small undeveloped portion in the north draining to the north and east onto grazing land.
To maintain a comprehensive, cost-effective monitoring program, LLNL determines the number and locations of surveillance wells, the analytes to be monitored, the frequency of sampling, and the analytical methods to be used. A wide range of analytes is moni-tored to assess the impact, if any, of current LLNL operations on local groundwater resources. Because surveillance monitoring is geared to detecting substances at very low concentrations in groundwater, it can detect contamination before it significantly impacts groundwater resources. Wells at the Livermore site, in the Livermore Valley, and at Site 300 in the Altamont Hills are included in LLNL’s surveillance monitoring plan.
Historically, the surveillance and compliance monitoring programs have detected higher than natural background concentrations of various metals, nitrate, perchlorate, and depleted uranium (uranium-238) in groundwater at Site 300. Subsequent CERCLA studies have linked several of these contaminants, including uranium-238, to past opera-tions, while the sources of other contaminants, such as nitrate and perchlorate, are the objects of continuing study.
Beginning in January 2003, LLNL implemented a new CERCLA comprehensive compliance monitoring plan at Site 300 (Ferry et al. 2002) that adequately covers the DOE requirements for on-site groundwater surveillance; LLNL monitoring related to CERCLA activities are described in Chapter 7. Additional compliance monitoring programs at Site 300 comply with numerous federal and state controls such as state-issued permits associated with closed landfills containing solid wastes and with continuing discharges of liquid waste to surface impoundments, sewage ponds, and percolation pits, the latter discussed previously in this chapter. Compliance monitoring is specified in WDRs issued by the CVRWQCB and in landfill closure and post-closure monitoring plans. (See Table 2-2 for a summary of LLNL permits.)
The WDRs and post-closure plans specify wells and effluents to be monitored, COCs and parameters to be measured, frequency of measurement, inspections to be conducted, and the frequency and form of required reports. These monitoring programs include quarterly and semiannual monitoring of groundwater, monitoring of various influent waste streams, and visual inspections. LLNL performs the maintenance necessary to ensure the physical integrity of closed facilities and their monitoring networks. As described in a previous section, LLNL conducts additional operational monitoring of wastewater effluents discharged to surface impoundments and sewage evaporation and percolation ponds to comply with WDRs. Quarterly and annual written reports of analytical results, inspection findings, and maintenance activities are required for each compliance monitoring network.
Typically, analytical methods approved by EPA are used to measure dissolved constitu-ents in water because they are both accurate and sensitive. Appendix A lists the analytical methods and reporting limits that are used to detect organic and inorganic constituents
4–32 2003 LLNL Environmental Report
Groundwater
in groundwater (including specific radioisotopes analyzed by alpha spectroscopy and other sensitive methods). The listed methods are not all used at each groundwater monitoring location. Rather, for cost effectiveness, each groundwater sampling location monitors only those contaminants that have been detected historically or that might result from continuing LLNL operations. However, present-day administrative, engi-neering, and maintenance controls at both LLNL sites are specifically tailored to prevent releases of potential contaminants to the environment.
During 2003, representative samples of groundwater were obtained from monitoring wells in accordance with the LLNL Livermore Site and Site 300 Environmental Restoration Project Standard Operating Procedures (SOPs) (Goodrich and Depue 2003). These protocols cover sampling techniques and specific information concerning the chemicals that are routinely searched for in groundwater. Different sampling tech-niques were applied to different wells depending on whether they were fitted with submersible pumps, or had to be bailed. All of the chemical and radioactivity analyses of groundwater samples were performed by California-certified analytical laboratories. For comparison purposes only, some of the results are compared with drinking water limits (MCLs); however, the MCLs do not apply as regulatory limits to any of these groundwaters.
Livermore Site and Environs
Livermore Valley
LLNL has monitored tritium in water hydrologically downgradient of the Livermore site since 1988. Tritiated water (HTO) is potentially the most mobile groundwater contami-nant from LLNL. Rain and storm water runoff in the Livermore Valley, which recharge local aquifers, contain small amounts of HTO from natural sources, past worldwide atmospheric nuclear weapons tests, and atmospheric emissions from LLNL. (See Chapters 3 and 6 for further discussion of air emissions, and other parts of this chapter for further discussion of rain and storm water runoff.)
Groundwater is recharged at the Livermore site, primarily from arroyos by rainfall. Groundwater flow beneath the Livermore site is generally southwestward. Groundwater flow is discussed generally in Chapter 1 and in detail in the CERCLA Remedial Investi-gation Report for the LLNL Livermore Site (Thorpe et al. 1990) and in the LLNL Ground Water Project 2003 Annual Report (Karachewski et al. 2004).
Groundwater samples were obtained during 2003 from 23 of 25 water wells in the Livermore Valley (see Figure 4-11) and measured for tritium activity. Two wells were either dry or could not be sampled during 2003.
Tritium measurements of Livermore Valley groundwaters are contained in the file “Ch4 LV Groundwater” provided on the report CD. They continue to show very low and decreasing activities compared with the 740 Bq/L (20,000 pCi/L) MCL established for
2003 LLNL Environmental Report 4–33
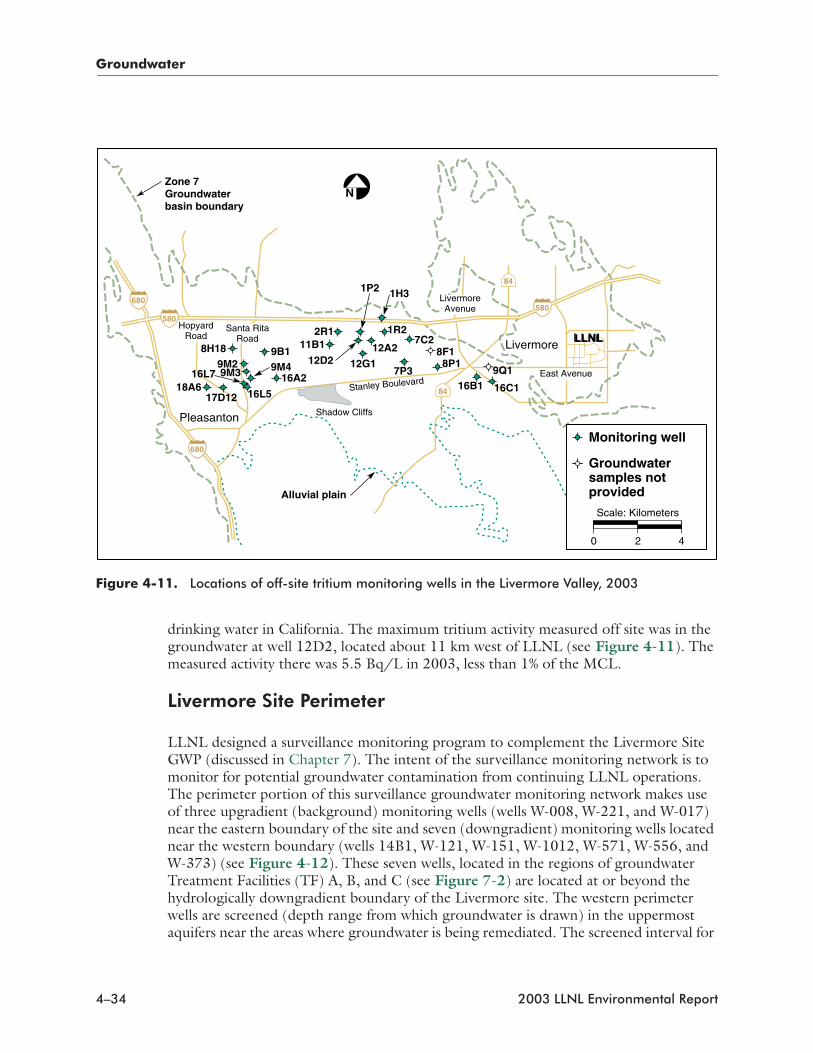
Groundwater
drinking water in California. The maximum tritium activity measured off site was in the groundwater at well 12D2, located about 11 km west of LLNL (see Figure 4-11). The measured activity there was 5.5 Bq/L in 2003, less than 1% of the MCL.
Livermore Site Perimeter
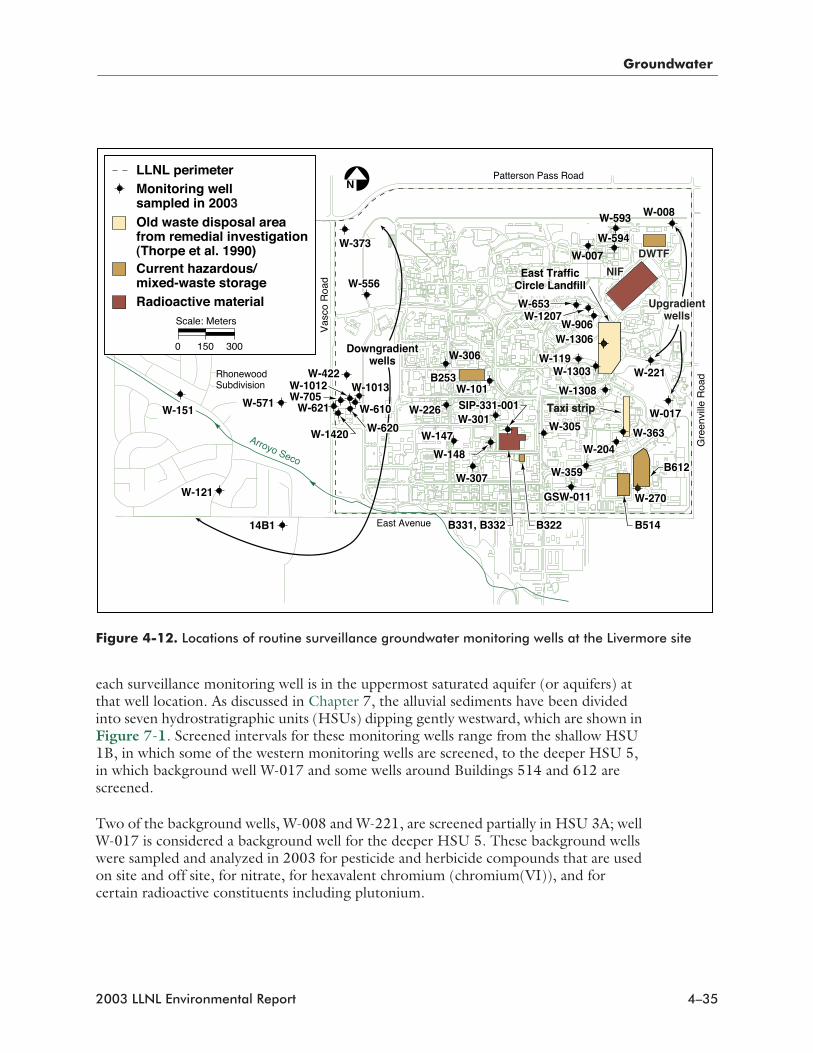
LLNL designed a surveillance monitoring program to complement the Livermore Site GWP (discussed in Chapter 7). The intent of the surveillance monitoring network is to monitor for potential groundwater contamination from continuing LLNL operations. The perimeter portion of this surveillance groundwater monitoring network makes use of three upgradient (background) monitoring wells (wells W-008, W-221, and W-017) near the eastern boundary of the site and seven (downgradient) monitoring wells located near the western boundary (wells 14B1, W-121, W-151, W-1012, W-571, W-556, and W-373) (see Figure 4-12). These seven wells, located in the regions of groundwater Treatment Facilities (TF) A, B, and C (see Figure 7-2) are located at or beyond the hydrologically downgradient boundary of the Livermore site. The western perimeter wells are screened (depth range from which groundwater is drawn) in the uppermost aquifers near the areas where groundwater is being remediated. The screened interval for
Figure 4-11. Locations of off-site tritium monitoring wells in the Livermore Valley, 2003
Shadow Cliffs
Zone 7Groundwaterbasin boundary
Alluvial plain
Livermore
LivermoreAvenue
Santa RitaRoad
Pleasanton
Stanley Boulevard16L7 16A2
2R111B1
1H3
1R2
12A2
16L5
HopyardRoad
N
84
Monitoring well
Groundwatersamples not provided
Scale: Kilometers
0 2 4
8H189M2
9B19M49M3
8P1
16B1 16C1
12G1
18A617D12
9Q17P3
8F17C2
1P2
12D2East Avenue
84
LLNLLLNL
580580
680
680
4–34 2003 LLNL Environmental Report
Groundwater
each surveillance monitoring well is in the uppermost saturated aquifer (or aquifers) at that well location. As discussed in Chapter 7, the alluvial sediments have been divided into seven hydrostratigraphic units (HSUs) dipping gently westward, which are shown in Figure 7-1. Screened intervals for these monitoring wells range from the shallow HSU 1B, in which some of the western monitoring wells are screened, to the deeper HSU 5, in which background well W-017 and some wells around Buildings 514 and 612 are screened.
Two of the background wells, W-008 and W-221, are screened partially in HSU 3A; well W-017 is considered a background well for the deeper HSU 5. These background wells were sampled and analyzed in 2003 for pesticide and herbicide compounds that are used on site and off site, for nitrate, for hexavalent chromium (chromium(VI)), and for certain radioactive constituents including plutonium.
Figure 4-12. Locations of routine surveillance groundwater monitoring wells at the Livermore site
East Avenue
Arroyo Seco
Scale: Meters
0 150 300
N
Taxi stripTaxi strip
East YrafficEast YrafficCircle LandfillCircle Landfill
DWTFDWTFDWTF
NIFNIFNIFEast TrafficCircle Landfill
B322
Patterson Pass Road
Gre
envi
lle R
oad
Vas
co R
oad
DowngradientDowngradientWellsWells
UpgradientUpgradientwellswells
Upgradientwells
Downgradientwells
RhonewoodSubdivision
B322B331, B332B331, B332
W-618W-148
B514
B612B612
W-204W-204
W-1308W-1308
W-363W-363
W-270W-270
W-221W-221
W-017W-017
W-008W-008
W-373W-373
W-556W-556W-556
W-008W-593W-593
W-593
W-594
W-007
W-221
W-147W-147W-305W-305
W-204
W-354W-354W-359
W-363
W-1308
W-119W-119W-119
W-1306W-1306W-1306W-906W-906W-906
W-653W-653W-1207W-1207
W-653W-1207
W-1303W-1303W-1303
W-270GSW-011GSW-011GSW-011
W-373
W-422W-422
W-610W-610
W-1420W-1420
W-422
W-610
W-1013
W-620W-620W-1420
W-621W-705W-1012
W-571W-017
W-307W-307W-307
W-226W-301W-301
W-226
W-101W-101B253B253
W-306
W-121
14B1
W-151 SIP-331-001SIP-331-001
2003 LLNL Environmental Report 4–35
Groundwater
Except for well 14B1, the seven western downgradient wells are screened in shallower HSUs 1B and 2, the uppermost water-bearing HSUs at the western perimeter. (Because it was originally a production well, well 14B1 is screened over a depth range that includes HSUs 2, 3A, and 3B.) These wells were sampled and analyzed at least once for pesticides, herbicides, radioactive constituents, nitrate, and chromium(VI).
Analytical results for the Livermore site background wells and perimeter wells are contained in the file “Ch4 LV Groundwater” provided on the report CD. No pesticide or herbicide organic compounds were detected above analytical reporting limits in the groundwater during 2003. The inorganic compounds detected include dissolved trace metals and minerals, which occur naturally in the groundwater at variable concentra-tions. The concentrations detected in the groundwater samples from the background wells represent background values for 2003, although there have been variations in the concentrations since regular surveillance monitoring began in 1996.
Concentrations of nitrate detected in groundwater samples from downgradient well W-1012 since 1996 have been greater than the MCL of 45 mg/L. Concentrations of nitrate detected in samples from this well in 2003 were 62 to 68 mg/L. Because of the hydrologic influence of TFB that pumps and treats groundwater from HSUs 1B and 2, groundwater with high nitrate concentrations is restrained from moving off site to the west. The highest concentration measured in an off-site well was below the MCL at 42 mg/L, in downgradient monitoring well W-571. Monitoring well W-571 is off site and downgradient to the west, and is screened in HSU 1B. During 2003, concentrations of nitrate in on-site shallow background wells W-008 and W-221 ranged from 22 mg/L to 27 mg/L. Detected concentrations of nitrate in western perimeter wells, with the exception of well W-1012, ranged from 14 mg/L (in well W-373) to 42 mg/L (in well W-571).
Nitrate was not detected at concentrations greater than the MCL in any other western perimeter surveillance monitoring well (besides on-site monitoring well W-1012) during 2003. Fluctuations in nitrate concentrations have occurred since regular surveillance monitoring began in 1996, but nitrate concentrations have not increased overall in groundwater from the western perimeter monitoring wells since 1996. The nitrate may originate as an agricultural residue (Thorpe et al. 1990).
Nitrate concentrations were also analyzed in groundwater samples collected from seven additional monitoring wells (Figure 4-12), screened in HSUs 1B and 2. Other than well W-1012, no groundwater sample had a nitrate concentration greater than the MCL.
Of the selected trace metal analytes, no concentration analyzed in any groundwater sample collected in 2003 exceeded the California or federal MCL.
Livermore Site
Groundwater sampling locations within the Livermore site include areas where releases to the ground may have occurred in the recent past or where previously detected COCs have low concentrations that do not require CERCLA remedial action. Wells selected for
4–36 2003 LLNL Environmental Report
Groundwater
monitoring are screened in the uppermost aquifers, and are situated downgradient from and as near as possible to the potential release locations. Well locations are shown in Figure 4-12. All analytical results are included in the file “Ch4 LV Groundwater” provided on the report CD.
No concentrations of plutonium radioisotopes were detected above the radiological laboratory’s minimum detectable activities. Concentrations of tritium and radium isotopes remain well below drinking water MCLs.
The Taxi Strip and the East Traffic Circle Landfill areas within the Livermore site are two potential sources of groundwater contamination. Samples from monitoring wells screened in HSUs 2 (W-204) and 3A (W-363) downgradient from the Taxi Strip Area were analyzed in 2003 for copper, lead, zinc, americium-241, plutonium-238, plutonium–239, radium-226, radium-228, and tritium. Samples from monitoring wells screened at least partially in HSU 2 (W-119, W-906, W-1303, W-1306, and W-1308) within and downgradient from the East Traffic Circle Landfill were analyzed for the same elements as in the Taxi Strip Area. The trace metals copper, lead, and zinc were not detected in samples from any of these monitoring wells in 2003.
Although the National Ignition Facility (NIF) has not yet begun full operations, LLNL obtains a baseline of groundwater quality prior to start of operations. Analyses were conducted on groundwater samples collected from wells W-653 and W-1207 (screened in HSUs 3A and 2, respectively) downgradient of NIF for minerals, selected metals, gross alpha and beta radiation, radium-226, and tritium. Another potential source of ground-water contamination is the Decontamination and Waste Treatment Facility (DWTF) in the northeastern portion of LLNL. Samples were obtained downgradient from this facility from wells W-007, W-593 (screened in HSU 3A), and W-594 during 2003 and were analyzed for minerals, selected metals, americium-241, plutonium-238, plutonium 239, radium-226, and tritium. Monitoring wells W-007 and W-594 (screened in HSUs 2/3A and 2, respectively) were added to this monitoring network in 2003.
Monitoring results from the wells near NIF and DWTF show very low concentrations of tritium present and only minor concentrations of gross alpha and gross beta radiation in the groundwater samples collected. Monitoring will continue near these facilities to determine baseline conditions.
The old hazardous waste/mixed waste storage facilities around Area 514 and Building 612 are also a potential source of contamination. They are monitored by wells W-270 and W-359 (screened in HSU 5), and well GSW-011 (screened in HSU 3A). Groundwater from these wells was sampled and analyzed for selected trace metals, general minerals, americium-241, plutonium-238, plutonium-239, radium-226, and tritium in 2003. No significant contamination was detected in the groundwater samples collected from wells W-270, W-359, or GSW-011 downgradient from this area in 2003.
Groundwater samples were obtained downgradient from areas where releases of metals to the ground have occurred. Samples were obtained from monitoring well W-307 (screened in HSU 1B), downgradient from a fume hood vent on the roof of Building 322, a metal plating shop. Soil samples obtained from the area show elevated
2003 LLNL Environmental Report 4–37
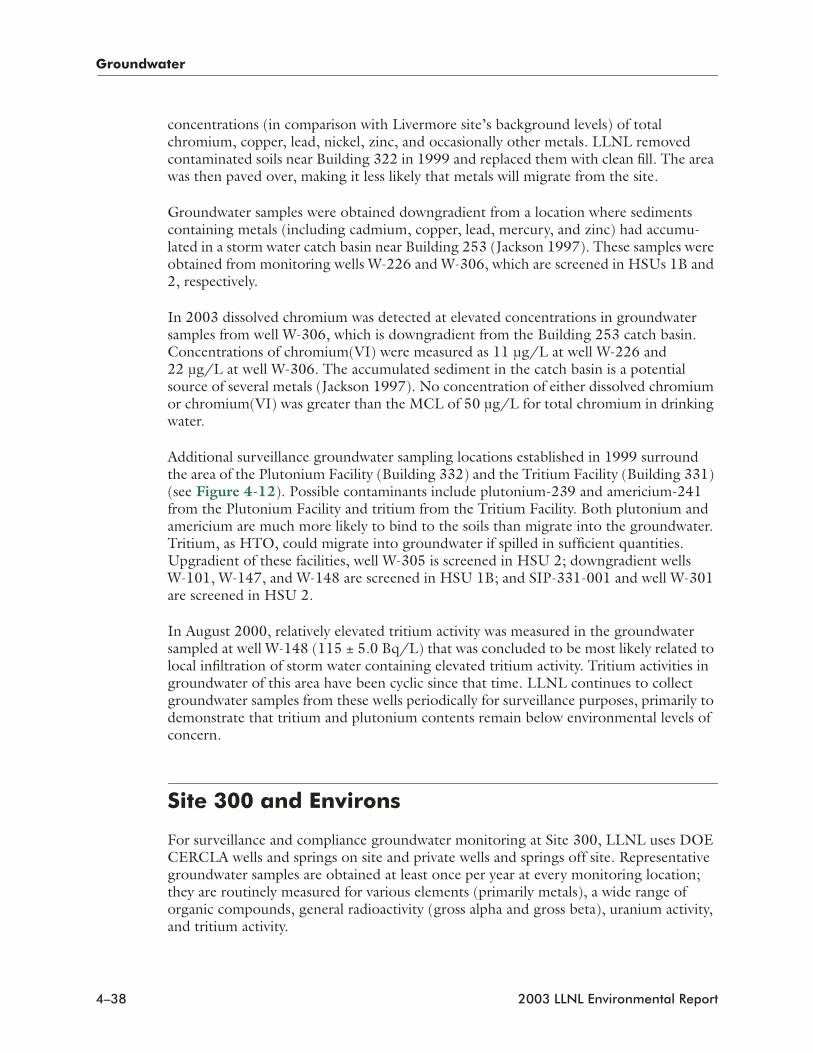
Groundwater
concentrations (in comparison with Livermore site’s background levels) of total chromium, copper, lead, nickel, zinc, and occasionally other metals. LLNL removed contaminated soils near Building 322 in 1999 and replaced them with clean fill. The area was then paved over, making it less likely that metals will migrate from the site.
Groundwater samples were obtained downgradient from a location where sediments containing metals (including cadmium, copper, lead, mercury, and zinc) had accumu-lated in a storm water catch basin near Building 253 (Jackson 1997). These samples were obtained from monitoring wells W-226 and W-306, which are screened in HSUs 1B and 2, respectively.
In 2003 dissolved chromium was detected at elevated concentrations in groundwater samples from well W-306, which is downgradient from the Building 253 catch basin. Concentrations of chromium(VI) were measured as 11 µg/L at well W-226 and 22 µg/L at well W-306. The accumulated sediment in the catch basin is a potential source of several metals (Jackson 1997). No concentration of either dissolved chromium or chromium(VI) was greater than the MCL of 50 µg/L for total chromium in drinking water.
Additional surveillance groundwater sampling locations established in 1999 surround the area of the Plutonium Facility (Building 332) and the Tritium Facility (Building 331) (see Figure 4-12). Possible contaminants include plutonium-239 and americium-241 from the Plutonium Facility and tritium from the Tritium Facility. Both plutonium and americium are much more likely to bind to the soils than migrate into the groundwater. Tritium, as HTO, could migrate into groundwater if spilled in sufficient quantities. Upgradient of these facilities, well W-305 is screened in HSU 2; downgradient wells W-101, W-147, and W-148 are screened in HSU 1B; and SIP-331-001 and well W-301 are screened in HSU 2.
In August 2000, relatively elevated tritium activity was measured in the groundwater sampled at well W-148 (115 ± 5.0 Bq/L) that was concluded to be most likely related to local infiltration of storm water containing elevated tritium activity. Tritium activities in groundwater of this area have been cyclic since that time. LLNL continues to collect groundwater samples from these wells periodically for surveillance purposes, primarily to demonstrate that tritium and plutonium contents remain below environmental levels of concern.
Site 300 and Environs
For surveillance and compliance groundwater monitoring at Site 300, LLNL uses DOE CERCLA wells and springs on site and private wells and springs off site. Representative groundwater samples are obtained at least once per year at every monitoring location; they are routinely measured for various elements (primarily metals), a wide range of organic compounds, general radioactivity (gross alpha and gross beta), uranium activity, and tritium activity.
4–38 2003 LLNL Environmental Report
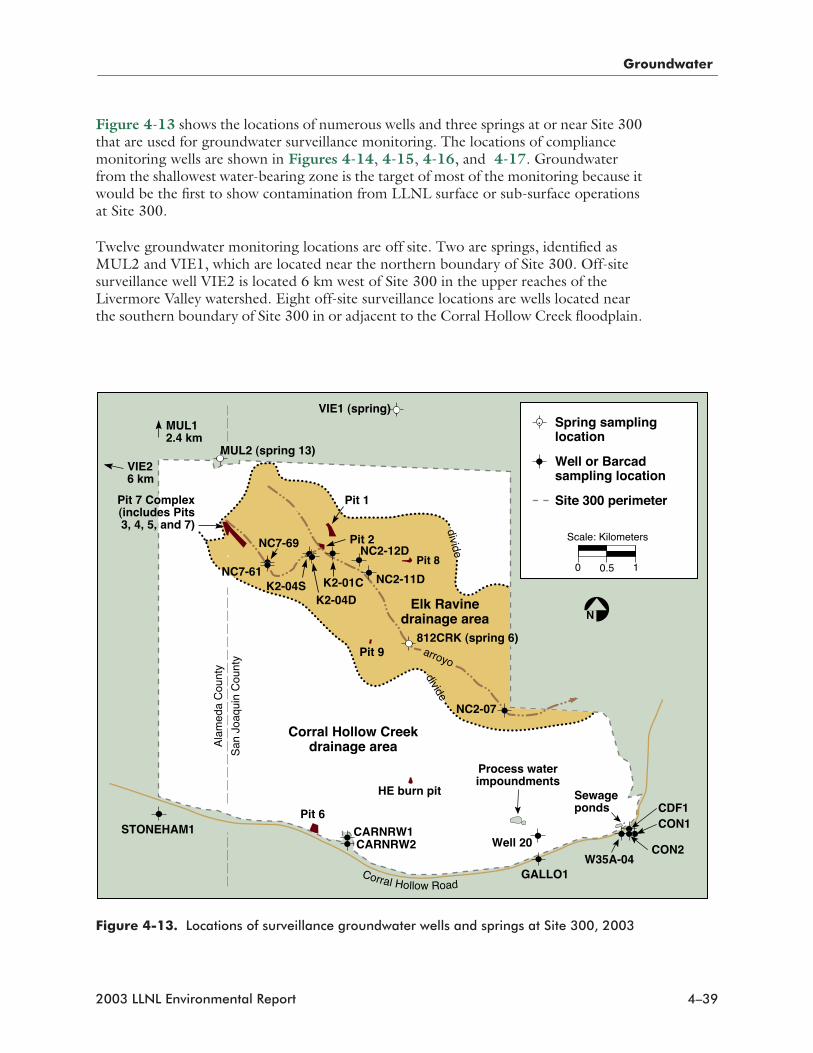
Groundwater
Figure 4-13 shows the locations of numerous wells and three springs at or near Site 300 that are used for groundwater surveillance monitoring. The locations of compliance monitoring wells are shown in Figures 4-14, 4-15, 4-16, and 4-17. Groundwater from the shallowest water-bearing zone is the target of most of the monitoring because it would be the first to show contamination from LLNL surface or sub-surface operations at Site 300.
Twelve groundwater monitoring locations are off site. Two are springs, identified as MUL2 and VIE1, which are located near the northern boundary of Site 300. Off-site surveillance well VIE2 is located 6 km west of Site 300 in the upper reaches of the Livermore Valley watershed. Eight off-site surveillance locations are wells located near the southern boundary of Site 300 in or adjacent to the Corral Hollow Creek floodplain.
Figure 4-13. Locations of surveillance groundwater wells and springs at Site 300, 2003
Ala
med
a C
ount
y
San
Joa
quin
Cou
nty
VIE26 km
MUL12.4 km
MUL2 (spring 13)
STONEHAM1
Corral Hollow Road
CARNRW2
CON1
GALLO1
0 1
Scale: Kilometers
0.5
CARNRW1
CON2W35A-04
Well 20
NC7-69
NC2-11D
NC2-12D
K2-04SK2-04D
K2-01C
Process waterimpoundments
HE burn pit SewagepondsPit 6
Pit 7 Complex(includes Pits3, 4, 5, and 7)
Pit 9
Pit 1
N
VIE1 (spring)
Pit 2
CDF1
Elk Ravinedrainage area
Corral Hollow Creekdrainage area
arroyo
dividedivide
812CRK (spring 6)
NC2-07
NC7-61Pit 8
2003 LLNL Environmental Report 4–39
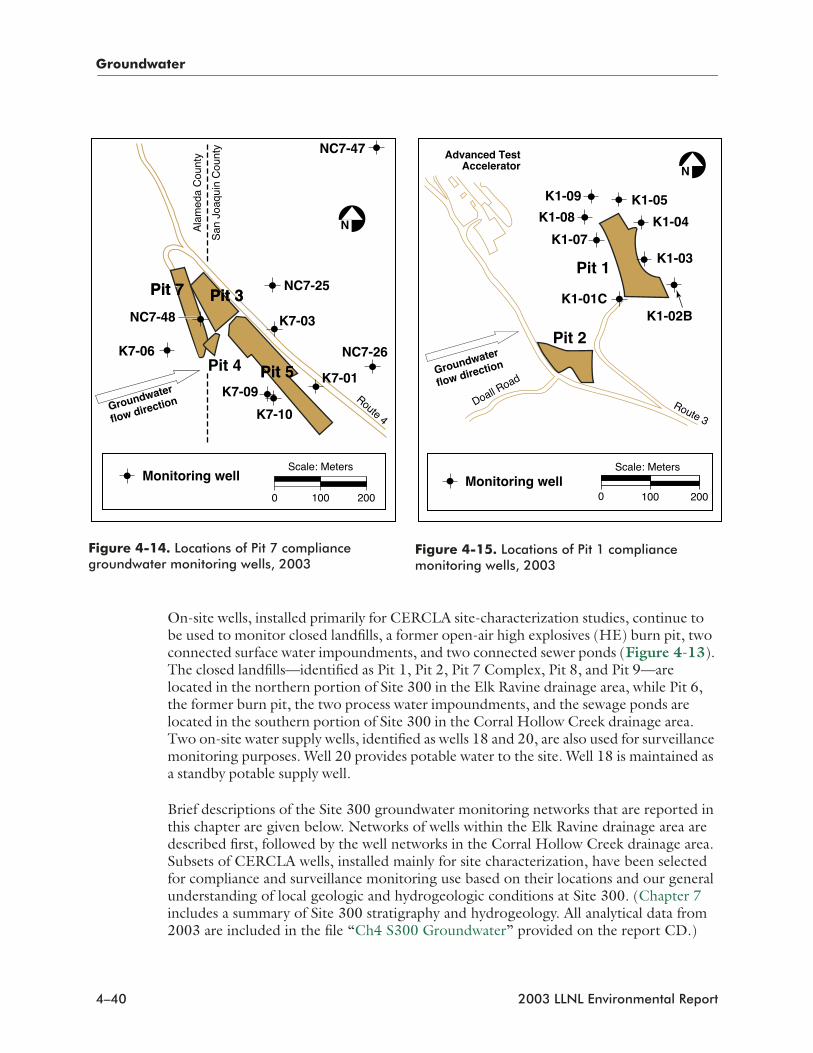
Groundwater
On-site wells, installed primarily for CERCLA site-characterization studies, continue to be used to monitor closed landfills, a former open-air high explosives (HE) burn pit, two connected surface water impoundments, and two connected sewer ponds (Figure 4-13). The closed landfills—identified as Pit 1, Pit 2, Pit 7 Complex, Pit 8, and Pit 9—are located in the northern portion of Site 300 in the Elk Ravine drainage area, while Pit 6, the former burn pit, the two process water impoundments, and the sewage ponds are located in the southern portion of Site 300 in the Corral Hollow Creek drainage area. Two on-site water supply wells, identified as wells 18 and 20, are also used for surveillance monitoring purposes. Well 20 provides potable water to the site. Well 18 is maintained as a standby potable supply well.
Brief descriptions of the Site 300 groundwater monitoring networks that are reported in this chapter are given below. Networks of wells within the Elk Ravine drainage area are described first, followed by the well networks in the Corral Hollow Creek drainage area. Subsets of CERCLA wells, installed mainly for site characterization, have been selected for compliance and surveillance monitoring use based on their locations and our general understanding of local geologic and hydrogeologic conditions at Site 300. (Chapter 7 includes a summary of Site 300 stratigraphy and hydrogeology. All analytical data from 2003 are included in the file “Ch4 S300 Groundwater” provided on the report CD.)
Figure 4-14. Locations of Pit 7 compliance groundwater monitoring wells, 2003
Figure 4-15. Locations of Pit 1 compliance monitoring wells, 2003
Pit 3Pit 7 NC7-25
Pit 4
K7-10
K7-03
NC7-47
K7-06 NC7-26
Monitoring well
Pit 5
Pit 3Pit 7
Pit 5Route 4
NC7-48
K7-01K7-09
Ala
med
a C
ount
y
San
Joa
quin
Cou
nty
N
0 200100
Scale: Meters
Groundwater
flow direction Route 3
Doall Road
Advanced TestAccelerator
Pit 2
Pit 1
K1-01C
K1-07
K1-08
K1-09 K1-05
K1-04
K1-03
K1-02B
N
Monitoring wellScale: Meters
2001000
Groundwater
flow direction
4–40 2003 LLNL Environmental Report

Groundwater
Elk Ravine Drainage Area
The Elk Ravine drainage area, a branch of the Corral Hollow Creek drainage system, includes most of northern Site 300 (see Figure 4-13). Storm water runoff in the Elk Ravine drainage area collects in arroyos and quickly infiltrates into the ground. Ground-water from wells in the Elk Ravine drainage area is monitored for COCs because of the system of surface and underground flows that connects the entire Elk Ravine drainage area. The area contains eight closed landfills known as Pits 1 through 5 and 7 through 9 and firing tables where explosives tests are conducted. None of the closed landfills has a liner, which is consistent with disposal practices in the past when the landfills were constructed. The following descriptions of monitoring networks within Elk Ravine begin with the headwaters area and proceed downstream. (See Chapter 7 for a review of groundwater contamination in this drainage area as determined from numerous CERCLA remedial investigations.)
Figure 4-16. Locations of Pit 6 compliance groundwater monitoring wells and springs, 2003
N
Carnegie SVRAresidence area
Pond
Site 300 boundary
Carnegie SVRAHeadquarters
Corral Hollow Road
Pit 6 cover
Approximate northern
limit of fault zone
K6-04
K6-15
K6-03
K6-24
K6-33K6-22
K6-14
K6-18
BC6-13 K6-17 K6-23
Spring 15W-33C-01CARNRW4
CARNRW2
CARNRW1
CARNRW3
K6-16
K6-32
K6-35
EP6-09EP6-06
EP6-08
K6-19
W-Pit6-1819K6-01
K6-26 K6-27K6-34
K6-25
EP6-07
K6-36
BC6-10
Spring 7
K6-21K6-01S
Scale: Meters
0 10050
K6-18
S-15
K6-19 Release detection monitor well
Corrective action monitor well
Active water-supply well
Inactive water-supply well
Intermittent spring
Building or Trailer
Approximate locations of disposal trenches or animal burial pits
2003 LLNL Environmental Report 4–41
Groundwater
Pit 7 ComplexMonitoring requirements for the Pit 7 landfill, which was closed under the Resource Conservation and Recovery Act (RCRA) in 1993, are specified in WDR 93-100 admin-istered by the CVRWQCB (1993 and 1998) and in LLNL Site 300 RCRA Closure and Post-Closure Plans—Landfill Pits 1 and 7 (Rogers/Pacific Corporation 1990). The main objective of this monitoring is the early detection of any new release of COCs from Pit 7 to groundwater.
The Pit 7 Complex area is located at an elevation of about 400 m in the most elevated portion of the Elk Ravine drainage area. The complex consists of four adjacent landfills identified as Pits 3, 4, 5, and 7 (see Figure 4-14). From 1963 to 1988, the landfills received waste gravels and debris from hydrodynamic tests of explosive devices conducted on firing tables at Site 300. The gravels contained concrete, cable, plastic,
Figure 4-17. Locations of Building 829 closed burn pit compliance groundwater monitoring wells
800
850
1000
1100900
900
W-829-22
829 capboundary
Building 827Complex
N
W-829-1938
W-829-15
Building828
Approximate regional
groundwater flow direction
900 Ground elevation contour(ft above mean sea level)
Monitoring well
Scale: Meters
0 200100
4–42 2003 LLNL Environmental Report
Groundwater
wood, tritium, uranium-238, beryllium, lead, and other metals in trace amounts. In 1988, 9440 m3 of gravel were removed from six firing tables at Site 300 and placed in Pit 7 (Lamarre and Taffet 1989). These were the last solid wastes to be placed in any landfill at Site 300. Figure 4-13 shows the locations of surveillance groundwater wells and springs at Site 300.
As planned for compliance purposes, LLNL obtained groundwater samples quarterly during 2003 from the Pit 7 monitoring well network. Samples were analyzed for inor-ganic COCs (mostly metallic elements), general radioactivity (gross alpha and beta), activity of certain radioisotopes (tritium, radium, uranium, and thorium), explosive compounds (HMX and RDX), and volatile organic compounds (VOCs). Field measure-ments of groundwater depth, temperature, pH, and specific conductance were obtained at each well at the time of sample collection.
No new release of COCs to groundwater from Pit 7 is evident in the chemical data obtained during 2003. The COCs detected in groundwater include several metals, depleted uranium, tritium, and several VOCs. These are associated with releases that occurred prior to 2003. The primary sources of COCs detected by the network of Pit 7 monitoring wells are the closed landfills known as Pits 3 and 5, which are adjacent to Pit 7 (Figure 4-14). Natural sources in the rocks and sediments surrounding Pit 7 also have contributed arsenic, barium, uranium, and, possibly nitrate to the groundwater. In the past, especially during the El Niño winters of 1982/1983 and 1997/1998, excessive seasonal rainfall caused groundwater levels to rise into Pit 3 and Pit 5 from beneath, leading to the release of COCs, mainly tritium in the form of HTO. Because of reduced rainfall since 1998, groundwater elevations have fallen generally at Site 300, thus reducing the potential for releases to occur by this mechanism. CERCLA modeling studies indicate that tritium and other COCs released in the past will not reach off-site aquifers at concentrations above MCLs. See Chapter 7 for a review of CERCLA activities regarding groundwater contamination in the upper reaches of the Elk Ravine drainage area. For a detailed account of Pit 7 compliance monitoring during 2003, including tables and graphs of groundwater COC analytical data, see LLNL Experimental Test Site 300 Compliance Monitoring Program for RCRA-Closed Landfill Pits 1 and 7, Annual Report for 2003 (Christofferson and MacQueen 2004).
Elk RavineGroundwater samples were obtained twice during 2003 from the widespread Elk Ravine surveillance monitoring network (see Figure 4-13). Samples were analyzed for inorganic constituents (mostly metallic elements), VOCs, general radioactivity (gross alpha and beta), tritium and uranium activity, and explosive compounds (HMX and RDX).
As in past years, no new release of COCs from LLNL operations in Elk Ravine to groundwater is indicated by the chemical and radioactivity data obtained during 2003. The major source of contaminated groundwater beneath Elk Ravine is from historical operations in the Building 850 firing table area (Webster-Scholten 1994; Taffet et al. 1996). Constituent measurements for the Elk Ravine drainage area surveillance moni-toring network are listed in Appendix A.
2003 LLNL Environmental Report 4–43
Groundwater
Concentrations of arsenic range up to 43 µg/L (well NC2-07) in Elk Ravine monitoring wells. Earlier CERCLA characterization studies determined that the arsenic is from natural sources, particularly from the dissolution of the mineral arsenopyrite, which is a component of the underlying volcanogenic sediments and sedimentary rocks (Raber and Carpenter 1983). It should be noted that there are no wells in this area that are used for potable domestic, livestock, or industrial water supply. However, a perennial spring in Elk Ravine (location 812CRK on Figure 4-13), which is used by the indigenous wildlife there, contains concentrations of naturally occurring arsenic (28 µg/L arsenic in 2003).
Tritium activity was relatively elevated in many of the shallow groundwater surveillance samples obtained during 2003 from Elk Ravine. Tritium, as HTO, has been released in the past in the vicinity of Building 850. The largest HTO plume, which extends eastward more than a kilometer from a source beneath the Building 850 firing table area to the vicinity of Pits 1 and 2, is confined to shallow depths in the Neroly lower blue sandstone unit and overlying alluvium.
The majority of the Elk Ravine surveillance network tritium measurements made during 2003 support earlier CERCLA studies that show that the tritium in the plume is dimin-ishing over time because of natural decay and dispersion (Ziagos and Reber-Cox 1998). For example, tritium activity in groundwater at well NC7-61 has decreased from 6500 Bq/L in 1996 to 1600 Bq/L in 2003. CERCLA modeling studies indicate that the tritium will decay to background levels before it can reach a site boundary. Note that the tritium plume has not yet reached the surveillance monitoring perennial spring location 812CRK, which is approximately one mile upstream from where the Site 300 boundary crosses Elk Ravine.
Except in the immediate vicinity of Pit 7, groundwater surveillance measurements of gross alpha, gross beta, and uranium radioactivity in Elk Ravine are all low and are indis-tinguishable from background levels. (Note that gross beta measurements do not detect the low-energy beta emission from tritium decay.) Additional detections of nonradioac-tive elements including arsenic, barium, chromium, selenium, vanadium, and zinc are all within the natural ranges of concentrations typical of groundwater elsewhere in the Altamont Hills.
Pit 1Monitoring requirements for the Pit 1 landfill, which was closed under RCRA in 1993, are also specified in WDR 93-100 administered by the CVRWQCB (1993 and 1998) and in (Rogers/Pacific Corporation 1990). The main objective of this monitoring is the early detection of any release of COCs from Pit 1 to groundwater.
Pit 1 lies in the Elk Ravine drainage area about 330 m above sea level. The Pit 1 landfill and the positions of the eight groundwater wells used to monitor it are shown in Figure 4-15. The eight wells are K1-01C, K1-02B, K1-03, K1-04, K1-05, K1-07, K1-08, and K1-09.
As planned for compliance purposes, LLNL obtained groundwater samples quarterly during 2003 from the Pit 1 monitoring well network. Samples were analyzed for inorganic COCs (mostly metallic elements), general radioactivity (gross alpha and beta),
4–44 2003 LLNL Environmental Report
Groundwater
activity of certain radioisotopes (tritium, radium, uranium, and thorium), explosive compounds (HMX and RDX), and VOCs (EPA method 601). Every other quarter, analyses were conducted for an additional seven elements. Additional annual analyses were conducted on fourth-quarter samples for extractable organics (EPA method 625), pesticides and PCBs (EPA method 608), and herbicides (EPA method 615). Field measurements of groundwater depth, temperature, pH, and specific conductance were obtained at each well at the time of quarterly sample collection.
As in past years, no release of COCs to groundwater from Pit 1 is evident in the moni-toring data collected during 2003. A detailed account of Pit 1 compliance monitoring during 2003, including tables and graphs of groundwater COC analytical data, appears in Christofferson and MacQueen (2004).
Tritium activity measured above background level (about 4 Bq/L) in the groundwater at Pit 1 monitoring wells K1-01C (24 Bq/L), K1-02B (150 Bq/L), K1-03 (23 Bq/L), and K1-08 (9.0 Bq/L) during 2003. The tritium activity in the groundwater sampled at these wells represents a distal lobe of the Building 850 tritium plume. Measurements of radium, thorium, and uranium made during 2003 in groundwater samples from Pit 1 compliance monitoring wells showed low activities indistinguishable from background levels.
The VOC 1,1,2-trichloro-1,2,2-trifluoroethane (Freon 113) decreased from a maximum concentration of 140 µg/L measured in 1999 to 41 µg/L in 2003 in groundwater at Pit 1 monitoring wells K1-05 (13 µg/L), K1-08 (19 µg/L), and K1-09 (41 µg/L). The drinking water MCL for this VOC is 1200 µg/L. Previous CERCLA investigations have linked the Freon 113 detected in Pit 1 monitoring wells to past spills of Freon in the Advanced Test Accelerator area, about 200 m northwest of the affected wells (Webster-Scholten 1994; Taffet et al. 1996).
Corral Hollow Creek Drainage Area
Pit 6Compliance monitoring requirements for the closed Pit 6 landfill in the Corral Hollow Creek drainage area are specified in the Post-Closure Plan for the Pit 6 Landfill Operable Unit Lawrence Livermore National Laboratory Site 300 (Ferry et al. 1998) and in the Compliance Monitoring Plan/Contingency Plan for Interim Remedies at Lawrence Livermore National Laboratory Site 300 (Ferry et al. 2002). The closed Pit 6 landfill covers an area of about 1 hectare (2.5 acres), at an elevation of approximately 215 m above sea level. From 1964 to 1973, approximately 1500 m3 of solid wastes were buried there in nine separate trenches. The trenches were not lined, consistent with historical disposal practices. Three larger trenches contain 1300 m3 of solid waste that includes empty drums, glove boxes, lumber, ducting, and capacitors. Six smaller trenches contain 230 m3 of biomedical waste, including animal carcasses and animal waste. During 1997, a multilayered cap was constructed over all the trenches, and a storm water drainage control system was installed around the cap. The cap and the drainage control system are engineered to keep rainwater from contacting the buried waste (Ferry et al. 1998).
2003 LLNL Environmental Report 4–45
Groundwater
The Pit 6 disposal trenches were constructed in Quaternary terrace deposits (Qt) north of the Corral Hollow Creek flood plain. Surface runoff from the pit area flows southward to Corral Hollow Creek. The Carnegie-Corral Hollow Fault zone extends beneath the southern third of Pit 6. The northern limit of the fault zone is shown in Figure 4-16. Beneath the northern two-thirds of Pit 6, groundwater flows south-southeast, following the inclination of the underlying sedimentary rocks. Groundwater seepage velocities are less than 10 m/y. Depths to the water table range from 10 to 20 m. Beneath the southern third of Pit 6, a trough containing terrace gravel within the fault zone provides a channel for groundwater to flow southeast, parallel to the Site 300 boundary fence (Webster-Scholten 1994).
Two Pit 6 groundwater monitoring programs, which operate under CERCLA, ensure compliance with all regulations. They are (1) the Detection Monitoring Program (DMP), designed to detect any new release of COCs to groundwater from wastes buried in the Pit 6 landfill, and (2) the Corrective Action Monitoring Program (CAMP), which monitors the movement and fate of historical releases. Figure 4-16 shows the locations of Pit 6 and the wells used to monitor the groundwater there.
To comply with monitoring requirements, LLNL obtained groundwater samples monthly, quarterly, semiannually, and annually during 2003 from specified Pit 6 moni-toring wells. DMP samples were obtained quarterly and were analyzed for beryllium and mercury, general radioactivity (gross alpha and beta), tritium and uranium activity, speci-fied VOCs, nitrate and perchlorate. CAMP samples were measured for VOCs, tritium activity, nitrate and perchlorate. Field measurements of groundwater depth, temperature, pH, and specific conductance were obtained at each well at the time of sample collection.
No new release of COCs from Pit 6 is indicated by the chemical analyses of groundwater samples obtained from Pit 6 monitoring wells during 2003. COCs that were released prior to constructing an impermeable cap over the closed landfill in 1997 continued to be detected in the groundwater at low concentrations during 2003. These COCs include tritium, perchlorate, trichloroethylene (TCE), perchloroethylene (PCE), and cis-1,2-dichloroethene (cis-1,2-DCE). All contaminant plumes associated with Pit 6 are confined to shallow depths. None has been detected beyond the Site 300 boundary. For a detailed account of Pit 6 compliance monitoring during 2003, including tables of groundwater analytical data and map figures showing the distribution of COC plumes, see LLNL Experimental Test Site 300 Compliance Monitoring Program for the CERCLA-Closed Pit 6 Landfill, Annual Report for 2003 (Christofferson and Blake 2004).
Buildling 829 Closed HE Burn FacilityCompliance monitoring requirements for the closed burn pits in the Corral Hollow Creek drainage area are specified in the Final Closure Plan for the High-Explosives Open Burn Treatment Facility at Lawrence Livermore National Laboratory Experimental Test Site 300 (Mathews and Taffet 1997), and in the Revisions to the Post-Closure Permit Application for the Building 829 HE Open Burn Facility – Volume 1 (LLNL 2001) as modified by the Hazardous Waste Facility Post-Closure Permit for the Building 829 HE Open Burn Facility (DTSC 2003).
4–46 2003 LLNL Environmental Report
Groundwater
The former HE Open Burn Treatment Facility, part of the Building 829 Complex, is located on a ridge within the southeast portion of Site 300 at an elevation of about 320 m. The facility included three shallow, unlined pits constructed in unconsolidated sediments that cap the ridge (Tps formation). The facility was used to thermally treat explosives process waste generated by operations at Site 300 and similar waste from explosives research operations at the Livermore site. The facility was covered with an impervious cap in 1998 following RCRA guidance.
Surface water drains southward from the facility toward Corral Hollow Creek. The nearest site boundary lies about 1.6 km to the south at Corral Hollow Road. Stratified rocks of the Neroly (Tn) formation underlie the facility and dip southeasterly. Two water-bearing zones exist at different depths beneath the facility. The shallower zone, at a depth of about 30 m, is perched within the Neroly upper siltstone/claystone aquitard (Tnsc2). The deeper zone, at a depth of about 120 m, represents a regional aquifer within the Neroly upper sandstone member (Tnbs2).
Based on groundwater samples recovered from boreholes, previous CERCLA remedial investigations determined that the perched groundwater near the burn facility was contaminated with VOCs, primarily TCE, but that the deeper regional aquifer was free of any contamination stemming from operation of the facility (Webster-Scholten 1994). Subsequent assays of soil samples obtained from shallow boreholes prior to closure revealed that low concentrations of HE compounds, VOCs, and metals exist beneath the burn pits (Mathews and Taffet 1997). Conservative transport modeling indicates that the shallow contamination will not adversely impact the regional aquifer primarily because its downward movement is blocked by more than 100 m of unsaturated Neroly Formation sediments that include interbeds of claystone and siltstone.
Beginning in 1999, LLNL implemented the intensive groundwater monitoring program for this area described in the post-closure plan (Mathews and Taffet 1997) to track the fate of contaminants in the soil and the perched water-bearing zone, and to monitor the deep regional aquifer for the appearance of any potential contaminants from the closed burn facility.
This monitoring program remained in effect through the first quarter of 2003, at which time LLNL began implementation of the provisions specified in the Hazardous Waste Facility Post-Closure Permit for the B829 Facility (DTSC 2003). Following the guidance outlined in the DTSC Technical Completeness (DTSC 2002) assessment, LLNL installed one additional groundwater monitoring well at the point of compliance (POC) within three meters of the edge of the capped High Explosive Open Burn Treatment Facility. This well (W-829-1938) was screened in the regional aquifer, the uppermost aquifer beneath the Building 829 Facility. This new well will be sampled as part of the permit-specified groundwater monitoring network (Figure 4-17), beginning in the first quarter of 2004. Also shown in Figure 4-17 are two previously existing wells (W-829-15 and W-829-22) that were used throughout 2003 for quarterly collection of groundwater samples from the regional aquifer. Two other deep wells (W-827-04 and W-827-05), which had been sampled under the B-829 Final Closure Plan (Mathews and Taffet
2003 LLNL Environmental Report 4–47
Groundwater
1997), were removed from the groundwater monitoring network specified in the permit; therefore, these wells were sampled only during the first quarter of 2003. As in past years of this monitoring program, well W-827-04 was dry.
As planned for compliance purposes, LLNL obtained groundwater samples quarterly during 2003 from the Building 829 monitoring well network. Groundwater samples from the wells screened in the deep regional aquifer were analyzed quarterly for inor-ganic COCs (mostly metals), general minerals, turbidity, explosive compounds (HMX, RDX, and TNT), VOCs (EPA method 624), extractable organics (EPA method 625), pesticides (EPA method 608), herbicides (EPA method 615), general radioactivity (gross alpha and beta), radium activity, total organic carbon (TOC), total organic halides (TOX), and coliform bacteria.
During the first quarter of 2003, groundwater samples from the two wells (W-829-06 and W–829-08) screened in the shallow perched water-bearing zone were collected and analyzed for explosive compounds and VOCs. These two shallow wells, which had been sampled under the B-829 Final Closure Plan (Mathews and Taffet 1997), were also removed from the groundwater monitoring network specified in the permit (DTSC 2003).
No new release of COCs to groundwater from the closed HE burn facility is indicated by the monitoring data obtained during 2003. For a detailed account of compliance monitoring of the closed HE burn pit during 2003, including tables and graphs of groundwater COC analytical data, see LLNL Experimental Test Site 300—Compliance Monitoring Program for the Closed Building 829 Facility— Annual Report 2003 (Revelli 2004b).
The two shallow wells, W-829-06 and W-829-08, were sampled as part of this ground-water monitoring network only during the first quarter of 2003. (Beginning in the second quarter of 2003, LLNL’s CERCLA Compliance Monitoring Program took responsibility for sampling these two wells.) The primary contaminant in the perched groundwater is TCE. The maximum TCE concentration measured during 2003 was 210 µg/L, in a first quarter sample from W-829-06. This sample also contained the other contaminant detected in 2003, 1,2-dichloroethene (1,2-DCE), measured at 1.2 µg/L.
Wells W-827-05, W-829-15, and W-829-22 were all sampled during the first quarter of 2003; quarterly sampling of W-829-15 and W-829-22 continued throughout the year. The analytical results from these wells, used to monitor the deep regional aquifer beneath the Building 829 facility, are generally typical of the values seen in previous years. The inorganic constituents that were detected during 2003 show concentrations that represent background level concentrations of substances dissolved from natural sources in the underlying rocks. Only selenium was detected at a concentration slightly above its statistical limit in first-quarter samples. However, this constituent (found at Site 300 in naturally occurring minerals) is present in other uncontaminated Site 300 wells at background levels above those reported for the HE Burn Area. Selenium was not detected in the subsequent second-, third-, and fourth-quarter samples from well W-829-22.
4–48 2003 LLNL Environmental Report
Groundwater
Water Supply WellWater supply well 20, located in the southeastern part of Site 300 (Figure 4-13), is a deep, high-production well. The well is screened in the Neroly lower sandstone aquifer (Tnbs1) and can produce up to 1500 L/min of potable water. As planned for surveil-lance purposes, LLNL obtained groundwater samples quarterly during 2003 from well 20. Groundwater samples were analyzed for inorganic COCs (mostly metals), VOCs, general radioactivity (gross alpha and gross beta), and tritium activity.
Quarterly measurements of groundwater from well 20 do not differ significantly from previous years. As in past years, the primary potable water supply well at Site 300 showed no evidence of contamination. Gross alpha, gross beta, and tritium activities were very low and are indistinguishable from background level activities.
Off-site Surveillance Wells and Springs
As planned for surveillance purposes, LLNL obtained groundwater samples from two off-site springs and ten off-site wells during 2003. With the exception of one well, all off-site monitoring locations are near Site 300. The exception, well VIE2, is located at a private residence 6 km west of the site. It represents a typical potable water supply well in the Altamont Hills. One stock watering well, MUL1, and two stock watering springs, MUL2 and VIE1, are adjacent to Site 300 on the north. Eight wells, CARNRW1, CARNRW2, CDF1, CON1, CON2, GALLO1, STONEHAM1, and W35A-04, are adjacent to the site on the south (Figure 4-13). Well W35A-04 is a DOE CERCLA well that was installed off site for monitoring purposes only. The remaining seven wells south of Site 300 are privately owned and were constructed to supply water either for human consumption, stock watering, or fire suppression. They are monitored to determine the concentrations of dissolved constituants in the groundwater beneath the Corral Hollow Creek flood plain.
Groundwater samples were obtained quarterly during 2003 at six of the off-site surveil-lance well locations south of Site 300. As planned, CARNRW1 and CON2 samples were analyzed only for VOCs. Samples from CARNRW2, CDF1, CON1, and GALLO1 were analyzed quarterly for inorganic COCs (mostly metals), general radioactivity (gross alpha and beta), tritium activity, explosive compounds (HMX and RDX), and VOCs (EPA method 502.2). Additional annual analyses were conducted on third-quarter samples for uranium activity and extractable organic compounds (EPA method 625).
Groundwater samples were obtained once (annually) during 2003 from the remaining off-site surveillance monitoring locations—MUL1, MUL2, and VIE1 (north of Site 300); VIE2 (west of Site 300); and STONEHAM1 and W-35A-04 (south of Site 300). Samples were analyzed for inorganic COCs (mostly metals), general radioactivity (gross alpha and beta), tritium and uranium activity, explosive compounds (HMX and RDX), VOCs, and extractable organic compounds (EPA method 625).
Generally, no COC attributable to LLNL operations at Site 300 was detected in the off-site groundwater samples. Arsenic and barium were widely detected at the off-site loca-tions, but their concentrations were below MCLs and their occurrence is consistent with
2003 LLNL Environmental Report 4–49

Other Monitoring Programs
natural sources in the rocks. Scattered detections of metals are probably related to metals used in pumps and supply piping. As in past years, TCE was detected at concentrations of less than 1 µg/L in the groundwater samples obtained from well GALLO1. Previous CERCLA remedial investigations concluded that the TCE in the GALLO1 well water was likely caused by a localized surface spill on the property, possibly solvents used to service the private well (Webster-Scholten 1994). (Surveillance monitoring of a similarly sited well, GALLO2, was terminated in 1991 because of contamination from chemicals leaking from the pumping apparatus.) Radioactivity measurements of off-site ground-water are all indistinguishable from background activities.
Environmental Impact on Groundwater
Groundwater monitoring at and the surrounding environs of the Livermore site and Site 300 indicates that LLNL operations have minimal impact on groundwater beyond the site boundaries. During 2003, neither radioactivity nor concentrations of elements or compounds detected in groundwater were confirmed to be above potable water MCLs.
OTHER MONITORING PROGRAMS
Rainwater
Rainwater is sampled and analyzed for tritium activity in support of DOE Order 5400.5, Radiation Protection of the Public and the Environment. LLNL collects rainwater samples according to written standardized procedures which are summarized in the Environmental Monitoring Plan (Woods 2002). Rainwater is simply collected in stainless-steel buckets at fixed locations. The buckets are in open areas and are mounted about 1 m above the ground to prevent collection of splashback water. Rainwater samples are decanted into 250 mL amber glass bottles with Teflon-lined lids. The tritium activity of each sample is measured at a contracted laboratory by a scintillation counting method equivalent to EPA Method 906 that has a low reporting limit of about 3.7 Bq/L. All analytical results are included in the file “Ch4 Other Waters” provided on the report CD.
Livermore Site and Environs
Historically, the tritium activity measured in rainwater in the Livermore Valley was caused by atmospheric emissions of HTO from stacks at LLNL’s Tritium Facility (Building 331), and prior to 1995, from the former Tritium Research Laboratory at Sandia/California (see Chapter 3). During 2003, tritium activity in air-moisture and,
4–50 2003 LLNL Environmental Report
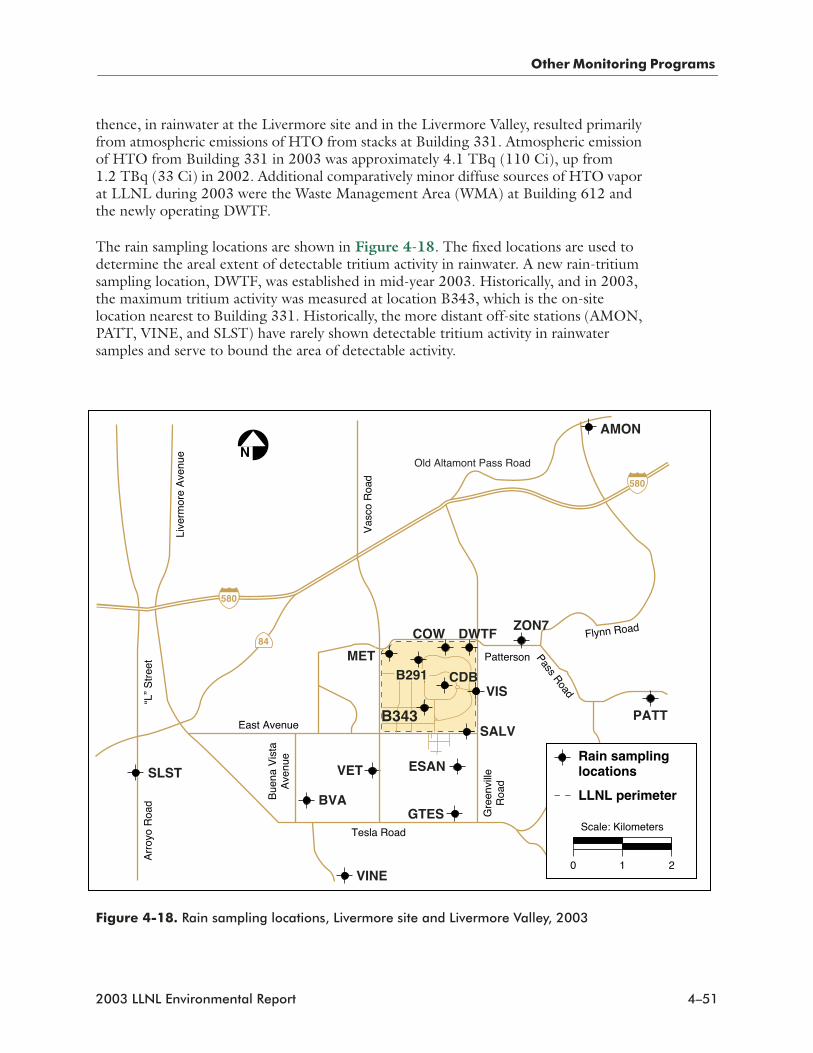
Other Monitoring Programs
thence, in rainwater at the Livermore site and in the Livermore Valley, resulted primarily from atmospheric emissions of HTO from stacks at Building 331. Atmospheric emission of HTO from Building 331 in 2003 was approximately 4.1 TBq (110 Ci), up from 1.2 TBq (33 Ci) in 2002. Additional comparatively minor diffuse sources of HTO vapor at LLNL during 2003 were the Waste Management Area (WMA) at Building 612 and the newly operating DWTF.
The rain sampling locations are shown in Figure 4-18. The fixed locations are used to determine the areal extent of detectable tritium activity in rainwater. A new rain-tritium sampling location, DWTF, was established in mid-year 2003. Historically, and in 2003, the maximum tritium activity was measured at location B343, which is the on-site location nearest to Building 331. Historically, the more distant off-site stations (AMON, PATT, VINE, and SLST) have rarely shown detectable tritium activity in rainwater samples and serve to bound the area of detectable activity.
Figure 4-18. Rain sampling locations, Livermore site and Livermore Valley, 2003
Tesla Road
East Avenue
Gre
envi
lleR
oad
Vas
co R
oad
Live
rmor
e A
venu
e
Flynn Road
Bue
na V
ista
Ave
nue
Arr
oyo
Roa
d“L
” S
tree
t
CDBVIS
SLST
ZON7
AMON
B291MET
B343
ESAN
Patterson PassRoad
SALV
COW DWTF
580
580
84
N
VET
BVA
VINE
GTES
PATT
Old Altamont Pass Road
0 1
Rain sampling locations
2
LLNL perimeter
Scale: Kilometers
2003 LLNL Environmental Report 4–51
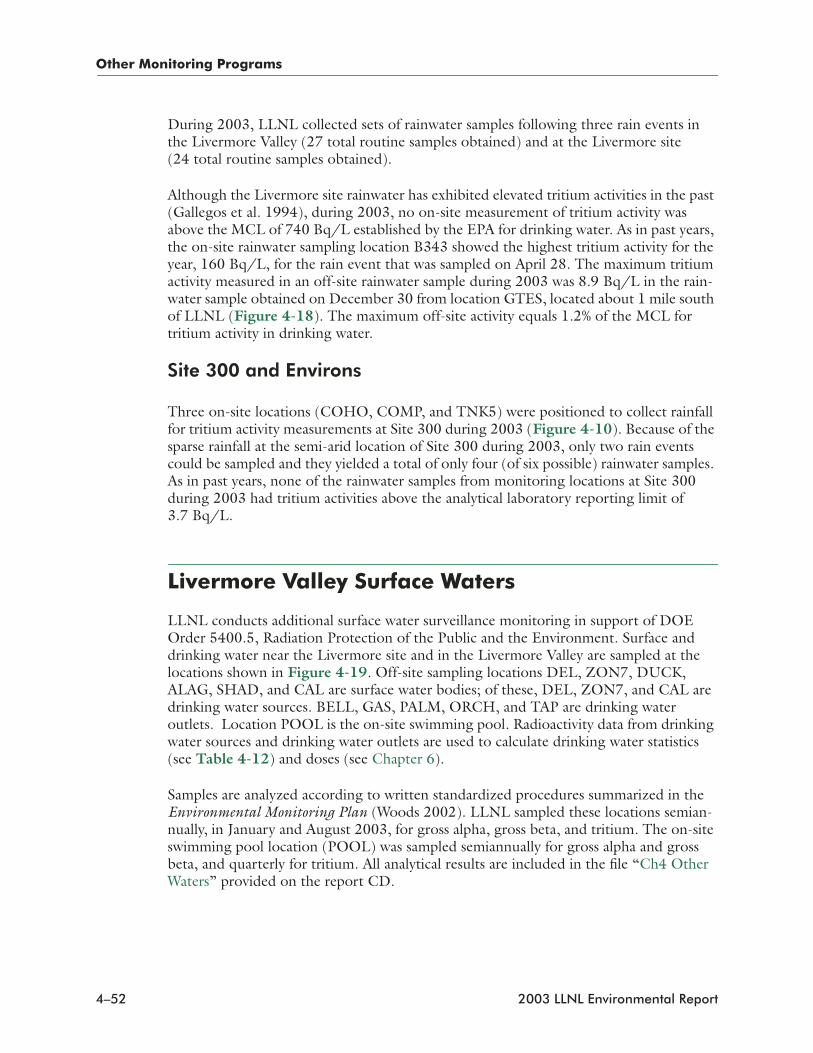
Other Monitoring Programs
During 2003, LLNL collected sets of rainwater samples following three rain events in the Livermore Valley (27 total routine samples obtained) and at the Livermore site (24 total routine samples obtained).
Although the Livermore site rainwater has exhibited elevated tritium activities in the past (Gallegos et al. 1994), during 2003, no on-site measurement of tritium activity was above the MCL of 740 Bq/L established by the EPA for drinking water. As in past years, the on-site rainwater sampling location B343 showed the highest tritium activity for the year, 160 Bq/L, for the rain event that was sampled on April 28. The maximum tritium activity measured in an off-site rainwater sample during 2003 was 8.9 Bq/L in the rain-water sample obtained on December 30 from location GTES, located about 1 mile south of LLNL (Figure 4-18). The maximum off-site activity equals 1.2% of the MCL for tritium activity in drinking water.
Site 300 and Environs
Three on-site locations (COHO, COMP, and TNK5) were positioned to collect rainfall for tritium activity measurements at Site 300 during 2003 (Figure 4-10). Because of the sparse rainfall at the semi-arid location of Site 300 during 2003, only two rain events could be sampled and they yielded a total of only four (of six possible) rainwater samples. As in past years, none of the rainwater samples from monitoring locations at Site 300 during 2003 had tritium activities above the analytical laboratory reporting limit of 3.7 Bq/L.
Livermore Valley Surface Waters
LLNL conducts additional surface water surveillance monitoring in support of DOE Order 5400.5, Radiation Protection of the Public and the Environment. Surface and drinking water near the Livermore site and in the Livermore Valley are sampled at the locations shown in Figure 4-19. Off-site sampling locations DEL, ZON7, DUCK, ALAG, SHAD, and CAL are surface water bodies; of these, DEL, ZON7, and CAL are drinking water sources. BELL, GAS, PALM, ORCH, and TAP are drinking water outlets. Location POOL is the on-site swimming pool. Radioactivity data from drinking water sources and drinking water outlets are used to calculate drinking water statistics (see Table 4-12) and doses (see Chapter 6).
Samples are analyzed according to written standardized procedures summarized in the Environmental Monitoring Plan (Woods 2002). LLNL sampled these locations semian-nually, in January and August 2003, for gross alpha, gross beta, and tritium. The on-site swimming pool location (POOL) was sampled semiannually for gross alpha and gross beta, and quarterly for tritium. All analytical results are included in the file “Ch4 Other Waters” provided on the report CD.
4–52 2003 LLNL Environmental Report
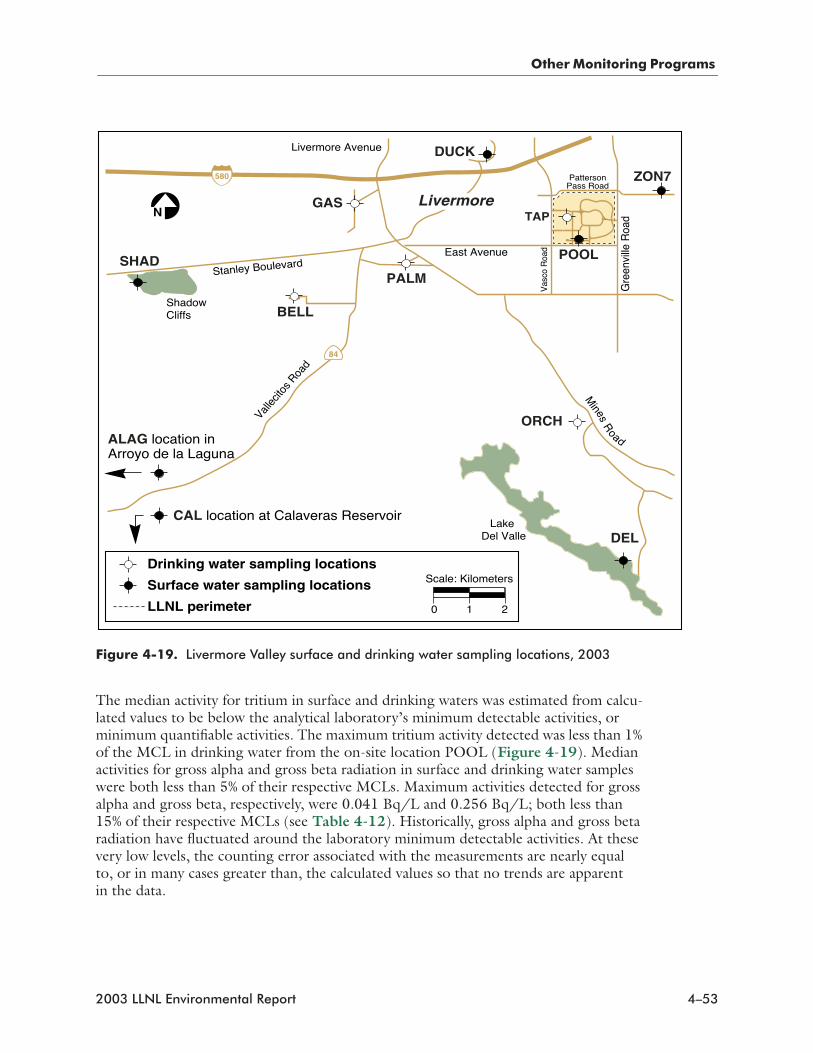
Other Monitoring Programs
The median activity for tritium in surface and drinking waters was estimated from calcu-lated values to be below the analytical laboratory’s minimum detectable activities, or minimum quantifiable activities. The maximum tritium activity detected was less than 1% of the MCL in drinking water from the on-site location POOL (Figure 4-19). Median activities for gross alpha and gross beta radiation in surface and drinking water samples were both less than 5% of their respective MCLs. Maximum activities detected for gross alpha and gross beta, respectively, were 0.041 Bq/L and 0.256 Bq/L; both less than 15% of their respective MCLs (see Table 4-12). Historically, gross alpha and gross beta radiation have fluctuated around the laboratory minimum detectable activities. At these very low levels, the counting error associated with the measurements are nearly equal to, or in many cases greater than, the calculated values so that no trends are apparent in the data.
Figure 4-19. Livermore Valley surface and drinking water sampling locations, 2003
DUCK
Lake Del Valle
Vallec
itos R
oad
Stanley Boulevard
Livermore Avenue
Gre
envi
lle R
oad
PattersonPass Road
ShadowCliffs
PALM
GAS
BELL
SHAD
ORCH
Mines
Road
ZON7
ALAG location in Arroyo de la Laguna
East Avenue
84
Livermore
580
CAL location at Calaveras Reservoir
TAP
POOL
DEL
Drinking water sampling locations
Surface water sampling locations
LLNL perimeter
Scale: Kilometers
0 21
N
Vas
co R
oad
2003 LLNL Environmental Report 4–53
Other Monitoring Programs
Historical median tritium values in surface and drinking waters in the Livermore Valley since 1988 are shown in Figure 4-20. Since 1988, when measurements began, water in the LLNL swimming pool has had the highest tritium activities because it is close to tritium sources within LLNL.
Drainage Retention Basin Release
The DRB was constructed and lined in 1992 after remedial action studies indicated that infiltration of storm water from the existing basin increased dispersal of groundwater contaminants. Located in the center of the Livermore site, the DRB can hold approxi-mately 45.6 ML (37 acre-feet) of water. Previous Environmental Reports detail the history of the construction and management of the DRB (see Harrach et al. 1995, 1996, 1997). Beginning in 1997, LLNL discharges to the DRB included routine treated groundwater from TFD and TFE, and from related portable treatment units. These discharges contribute a year-round source of water entering and exiting the DRB. Discharge rate is approximately 100 gpm. Storm water runoff still dominates wet weather flows through the DRB, but discharges from the treatment facilities now consti-tute a substantial portion of the total water passing through the DRB.
The SFBRWQCB regulates discharges from the DRB. The document Drainage Retention Basin Monitoring Plan Change (Jackson 2002) lists constituents of interest, sample frequencies, and discharge limits based on the Livermore site CERCLA Record of Decision (ROD) (U.S. DOE 1993), as modified by the Explanation of Significant Differences for Metals Discharge Limits at the Lawrence Livermore National Laboratory
Table 4-12.Radioactivity in surface and drinking waters in the Livermore Valley, 2003
LocationsTritium (Bq/L)
Gross alpha (Bq/L)
Gross beta (Bq/L)
All locations
Median -0.457 0.003 0.083
Minimum -2.59 -0.143 0.007
Maximum 5.74 0.041 0.256
Interquartile range 3.24 0.019 0.057
Drinking water locations
Median -0.775 -0.001 0.079
Minimum -2.59 -0.01 0.01
Maximum 1.52 0.04 0.26
Interquartile range 1.32 0.01 0.063
Drinking water MCL 740 0.555 1.85
Note: A negative number means the sample radioactivity was less than the background radioactivity.
4–54 2003 LLNL Environmental Report

Other Monitoring Programs
Livermore Site (Berg et al. 1997). The ROD established discharge limits for all remedial activities at the Livermore site to meet applicable, relevant, and appropriate requirements derived from laws and regulations identified in the ROD, including federal Clean Water Act, federal and state Safe Drinking Water Acts, and the California Porter-Cologne Water Quality Control Act.
The DRB sampling program implements requirements established by the SFBRWQCB. The program consists of monitoring wet and dry weather releases for compliance with discharge limits and performing routine reporting. For purposes of determining discharge monitoring requirements and frequency, the wet season is defined as October 1 through May 31, the period when rain-related discharges usually occur (Galles 1997). Discharge limits are applied to the wet and dry seasons as defined in the Explanation of Significant Differences for Metals Discharge Limits at the Lawrence Livermore National Laboratory Livermore Site (Berg et al. 1997) (wet season December 1 through March 31, dry season April 1 through November 30).
Figure 4-20. Annual median tritium activity in Livermore Valley surface and drinking water, 1988 to 2003
11988 1990 1992 1994
Year1996 1998 2000 2002
10
100
Tri
tiu
m a
ctiv
ity
(Bq
/L) POOL
Surface waterDrinking water
MCL = 740 Bq/L
Notes: • Values for surface water and drinking water for 2000 through 2003 were not detected and are plotted at minimum detectable levels. • Activities that are less than 1.0 Bq/L are plotted at a value of 1.0 Bq/L.
2003 LLNL Environmental Report 4–55
Other Monitoring Programs
To characterize wet-season discharges, LLNL samples DRB discharges at location CDBX and the Livermore site outfall at location WPDC during the first release of the rainy season, and from a minimum of one additional release (chosen in conjunction with storm water runoff sampling). During the dry season, samples are collected from each discrete discharge event or monthly while discharge is continuous. Discharge sampling locations CDBX and WPDC are shown in Figure 4-9. LLNL collects samples at CDBX to determine compliance with discharge limits. Sampling at WPDC is done to identify any change in water quality as the DRB discharges travel through the LLNL storm water drainage system and leave the site.
Written standardized sample collection procedures are summarized in the Environmental Monitoring Plan (Woods 2002). All samples of DRB release water are collected as grab samples. Field measurements for turbidity are collected with a calibrated field instru-ment. Field Tracking Forms are used to record all information about sampling events including instrument measurements and sample times. A chain of custody is used to track custody of all samples as they move from the sampler to the analytical lab and then the data as it moves from the analytical laboratory back to ORAD data management personnel for review, reporting and archival. State-certified laboratories analyze the collected samples for chemical and physical parameters. All analytical results are included in the file “Ch4 Other Waters” provided on the report CD.
Water releases occurred continuously to maintain relatively low nutrient levels in the DRB. Samples collected at CDBX and WPDC exceeded only the pH discharge limits. The higher pH readings seen in the DRB discharge samples during the summer and fall correspond to the peak of the summer and fall algae blooms within the DRB. During 2003, total dissolved solids and specific conductance continued to reflect the levels found in groundwater discharged to the DRB. While some metals were detected, none were above discharge limits. All organics, pesticides, and PCBs were below analytical reporting limits. Gross alpha, gross beta, and tritium levels were well below discharge limits.
LLNL collects and analyzes samples for acute fish toxicity using fathead minnow (Pimphales promelas) and for chronic toxicity using three species (fathead minnow, water flea daphnid [Ceriodaphnia dubia], and green algae [Selanastrum capricomutum]). LLNL collects acute toxicity samples at the first wet-season release and from each discrete dry season release from location CDBX. Samples for chronic fish toxicity are collected at location CDBX at the first wet-season release. Aquatic bioassay for toxicity showed no toxicity effects in DRB discharge water. One sample at location WPDC showed 50% survival for the acute test. The reason for the toxicity result is unknown. Two follow-up samples from location WPDC showed 100% survival.
4–56 2003 LLNL Environmental Report
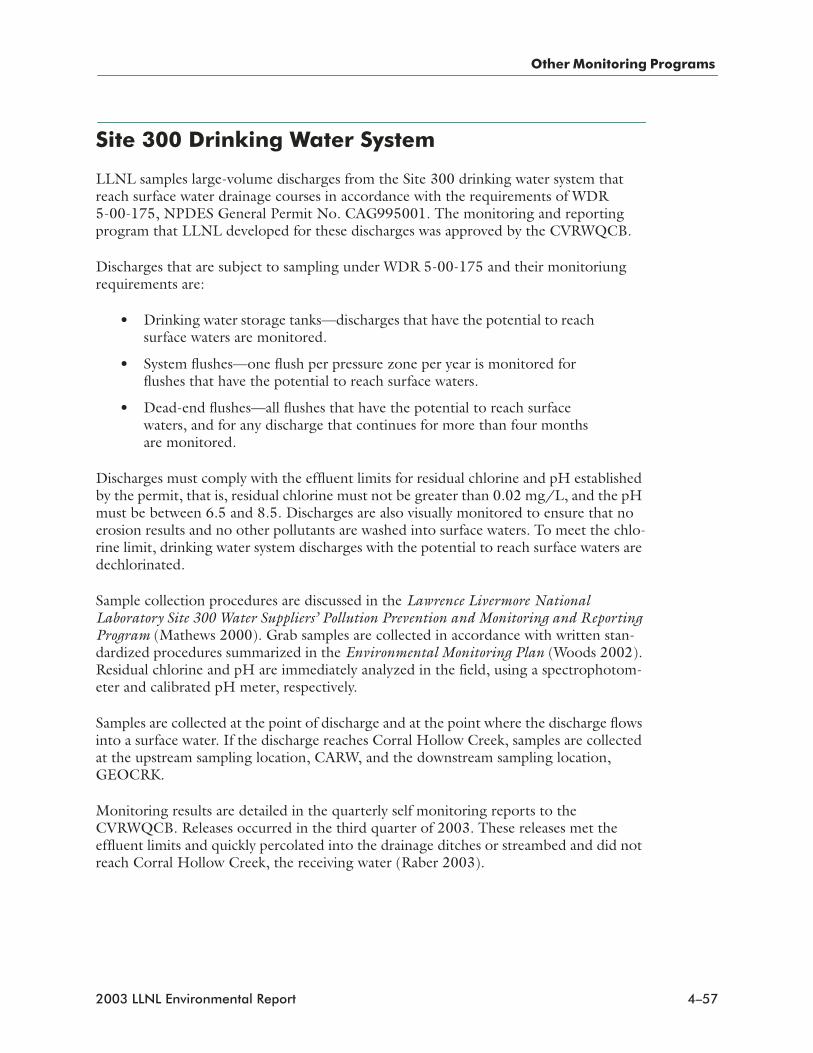
Other Monitoring Programs
Site 300 Drinking Water System
LLNL samples large-volume discharges from the Site 300 drinking water system that reach surface water drainage courses in accordance with the requirements of WDR 5-00-175, NPDES General Permit No. CAG995001. The monitoring and reporting program that LLNL developed for these discharges was approved by the CVRWQCB.
Discharges that are subject to sampling under WDR 5-00-175 and their monitoriung requirements are:
• Drinking water storage tanks—discharges that have the potential to reach surface waters are monitored.
• System flushes—one flush per pressure zone per year is monitored for flushes that have the potential to reach surface waters.
• Dead-end flushes—all flushes that have the potential to reach surface waters, and for any discharge that continues for more than four months are monitored.
Discharges must comply with the effluent limits for residual chlorine and pH established by the permit, that is, residual chlorine must not be greater than 0.02 mg/L, and the pH must be between 6.5 and 8.5. Discharges are also visually monitored to ensure that no erosion results and no other pollutants are washed into surface waters. To meet the chlo-rine limit, drinking water system discharges with the potential to reach surface waters are dechlorinated.
Sample collection procedures are discussed in the Lawrence Livermore National Laboratory Site 300 Water Suppliers’ Pollution Prevention and Monitoring and Reporting Program (Mathews 2000). Grab samples are collected in accordance with written stan-dardized procedures summarized in the Environmental Monitoring Plan (Woods 2002). Residual chlorine and pH are immediately analyzed in the field, using a spectrophotom-eter and calibrated pH meter, respectively.
Samples are collected at the point of discharge and at the point where the discharge flows into a surface water. If the discharge reaches Corral Hollow Creek, samples are collected at the upstream sampling location, CARW, and the downstream sampling location, GEOCRK.
Monitoring results are detailed in the quarterly self monitoring reports to the CVRWQCB. Releases occurred in the third quarter of 2003. These releases met the effluent limits and quickly percolated into the drainage ditches or streambed and did not reach Corral Hollow Creek, the receiving water (Raber 2003).
2003 LLNL Environmental Report 4–57
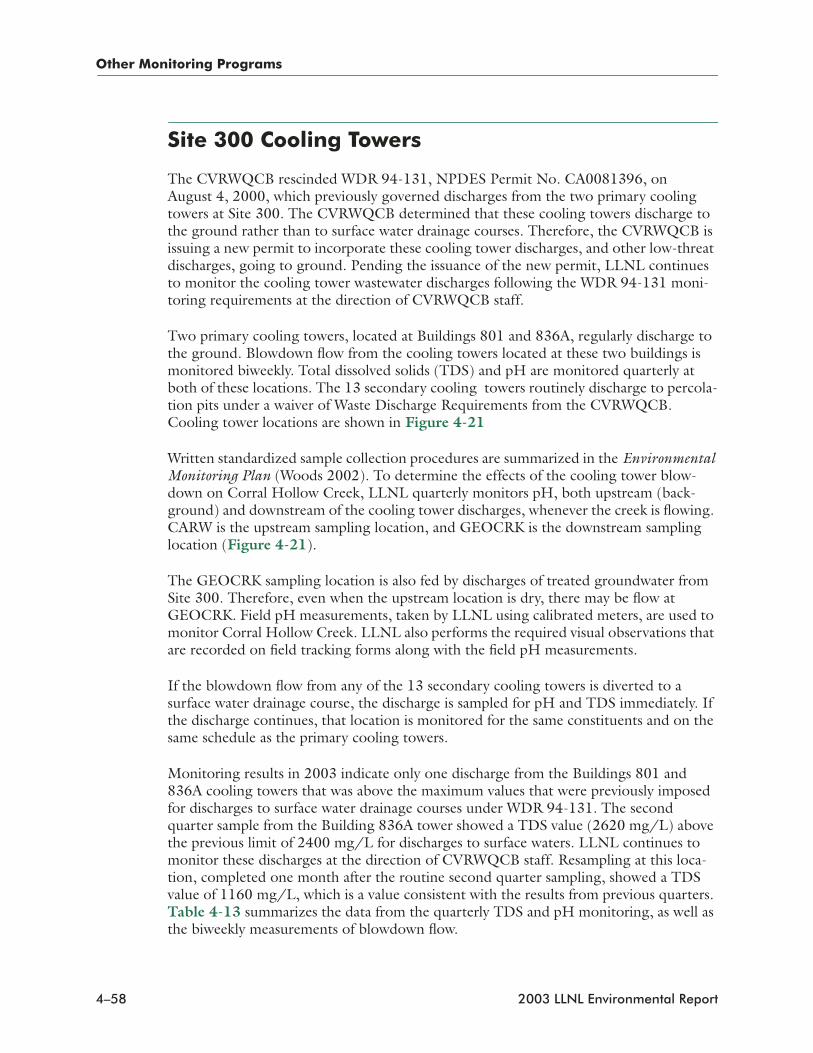
Other Monitoring Programs
Site 300 Cooling Towers
The CVRWQCB rescinded WDR 94-131, NPDES Permit No. CA0081396, on August 4, 2000, which previously governed discharges from the two primary cooling towers at Site 300. The CVRWQCB determined that these cooling towers discharge to the ground rather than to surface water drainage courses. Therefore, the CVRWQCB is issuing a new permit to incorporate these cooling tower discharges, and other low-threat discharges, going to ground. Pending the issuance of the new permit, LLNL continues to monitor the cooling tower wastewater discharges following the WDR 94-131 moni-toring requirements at the direction of CVRWQCB staff.
Two primary cooling towers, located at Buildings 801 and 836A, regularly discharge to the ground. Blowdown flow from the cooling towers located at these two buildings is monitored biweekly. Total dissolved solids (TDS) and pH are monitored quarterly at both of these locations. The 13 secondary cooling towers routinely discharge to percola-tion pits under a waiver of Waste Discharge Requirements from the CVRWQCB. Cooling tower locations are shown in Figure 4-21
Written standardized sample collection procedures are summarized in the Environmental Monitoring Plan (Woods 2002). To determine the effects of the cooling tower blow-down on Corral Hollow Creek, LLNL quarterly monitors pH, both upstream (back-ground) and downstream of the cooling tower discharges, whenever the creek is flowing. CARW is the upstream sampling location, and GEOCRK is the downstream sampling location (Figure 4-21).
The GEOCRK sampling location is also fed by discharges of treated groundwater from Site 300. Therefore, even when the upstream location is dry, there may be flow at GEOCRK. Field pH measurements, taken by LLNL using calibrated meters, are used to monitor Corral Hollow Creek. LLNL also performs the required visual observations that are recorded on field tracking forms along with the field pH measurements.
If the blowdown flow from any of the 13 secondary cooling towers is diverted to a surface water drainage course, the discharge is sampled for pH and TDS immediately. If the discharge continues, that location is monitored for the same constituents and on the same schedule as the primary cooling towers.
Monitoring results in 2003 indicate only one discharge from the Buildings 801 and 836A cooling towers that was above the maximum values that were previously imposed for discharges to surface water drainage courses under WDR 94-131. The second quarter sample from the Building 836A tower showed a TDS value (2620 mg/L) above the previous limit of 2400 mg/L for discharges to surface waters. LLNL continues to monitor these discharges at the direction of CVRWQCB staff. Resampling at this loca-tion, completed one month after the routine second quarter sampling, showed a TDS value of 1160 mg/L, which is a value consistent with the results from previous quarters. Table 4-13 summarizes the data from the quarterly TDS and pH monitoring, as well as the biweekly measurements of blowdown flow.
4–58 2003 LLNL Environmental Report
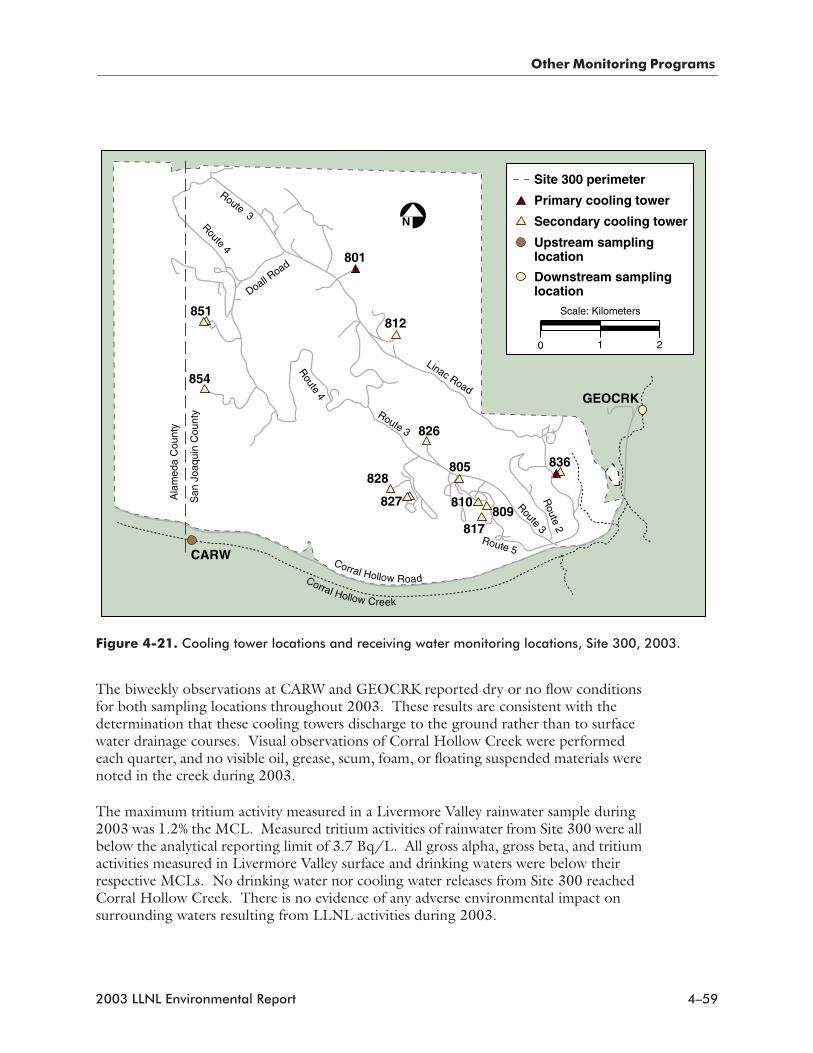
Other Monitoring Programs
The biweekly observations at CARW and GEOCRK reported dry or no flow conditions for both sampling locations throughout 2003. These results are consistent with the determination that these cooling towers discharge to the ground rather than to surface water drainage courses. Visual observations of Corral Hollow Creek were performed each quarter, and no visible oil, grease, scum, foam, or floating suspended materials were noted in the creek during 2003.
The maximum tritium activity measured in a Livermore Valley rainwater sample during 2003 was 1.2% the MCL. Measured tritium activities of rainwater from Site 300 were all below the analytical reporting limit of 3.7 Bq/L. All gross alpha, gross beta, and tritium activities measured in Livermore Valley surface and drinking waters were below their respective MCLs. No drinking water nor cooling water releases from Site 300 reached Corral Hollow Creek. There is no evidence of any adverse environmental impact on surrounding waters resulting from LLNL activities during 2003.
Figure 4-21. Cooling tower locations and receiving water monitoring locations, Site 300, 2003.
828
Route 4
Route 3
Route 4
Route 5
Route 3
Linac Road
Route 3R
oute 2
Doall Road
Ala
med
a C
ount
y
San
Joa
quin
Cou
nty
Corral Hollow RoadCorral Hollow Creek
854
851812
801
827
826
817
805 836
809
Upstream sampling location
CARW
GEOCRK
Secondary cooling tower
Downstream samplinglocation
Primary cooling tower
Site 300 perimeter
810810
N
Scale: Kilometers
0 1 2
2003 LLNL Environmental Report 4–59
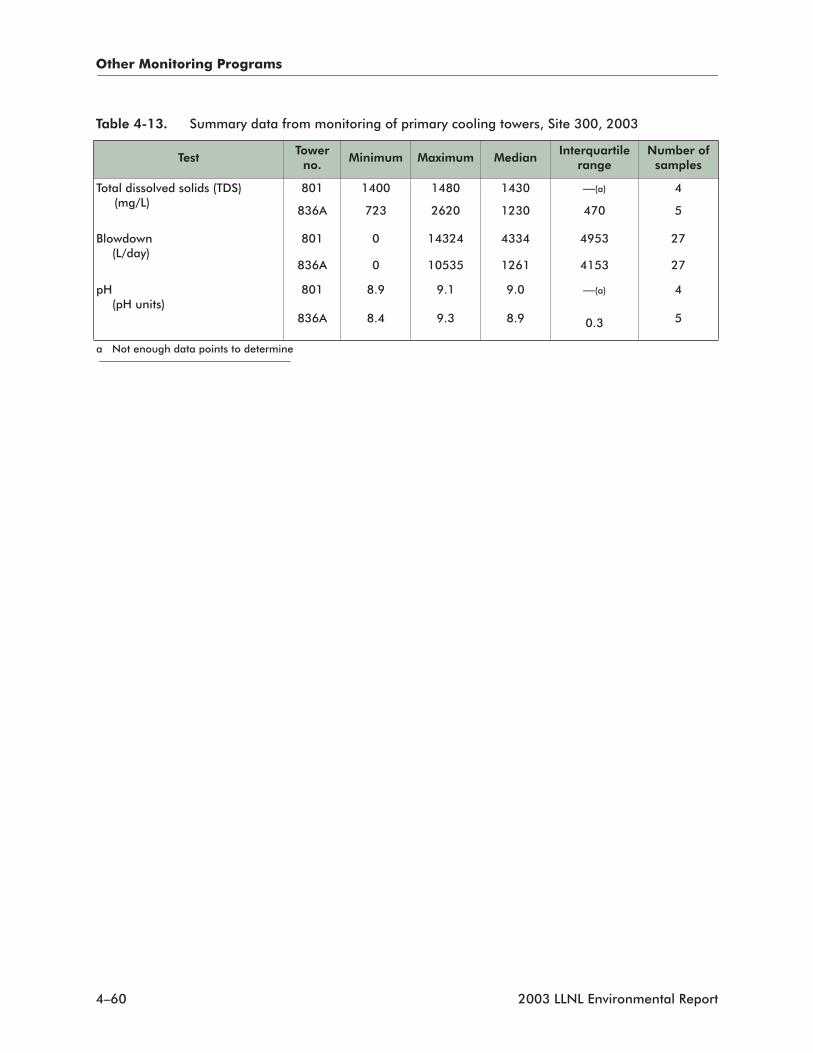
Other Monitoring Programs
Table 4-13. Summary data from monitoring of primary cooling towers, Site 300, 2003
Test Tower
no. Minimum Maximum Median
Interquartile range
Number of samples
Total dissolved solids (TDS) (mg/L)
801 1400 1480 1430 —(a) 4
836A 723 2620 1230 470 5
Blowdown(L/day)
801 0 14324 4334 4953 27
836A 0 10535 1261 4153 27
pH (pH units)
801 8.9 9.1 9.0 —(a) 4
836A 8.4 9.3 8.9 0.3 5
a Not enough data points to determine
4–60 2003 LLNL Environmental Report