sanitary sewer capital facilities plan and impact fee...
TRANSCRIPT

Sanitary Sewer
Capital Facilities Plan and
Impact Fee Facilities Plan
June 2017
Prepared by
JONES & ASSOCIATES Consulting Engineers
South Weber City Corporation
SANITARY SEWER
CAPITAL FACILITIES PLAN AND
IMPACT FEE FACILITIES PLAN
for
SOUTH WEBER CITY
June 2, 2017
Prepared by
JONES & ASSOCIATES
Consulting Engineers
1716 East 5600 South
South Ogden, Utah 84403
801-476-9767

Sanitary Sewer Capital Facilities Plan SOUTH WEBER CITY and Impact Fee Facilities Plan
Page i JONES & ASSOCIATES CONSULTING ENGINEERS
TABLE OF CONTENTS 1.0 EXECUTIVE SUMMARY ...................................................................................................................... 1
2.0 INTRODUCTION ................................................................................................................................. 2
2.1 Background ................................................................................................................................... 2
2.2 Service Area and Land Use ............................................................................................................ 2
2.3 System Overview........................................................................................................................... 2
3.0 ERU AND POPULATION ESTIMATES .................................................................................................. 4
3.1 Introduction .................................................................................................................................. 4
3.2 Population and Growth Estimates, and ERUs ............................................................................... 4
4.0 ANALYSIS INFORMATION .................................................................................................................. 7
4.1 Analysis Background and Data ...................................................................................................... 7
4.2 Flows Used in Analysis .................................................................................................................. 7
4.3 Peaking Factors and Time Patterns ............................................................................................... 8
4.4 Considerations for Sewer Modeled Data .................................................................................... 11
5.0 EXISTING COLLECTION SYSTEM....................................................................................................... 12
5.1 Existing System Model and Analysis ........................................................................................... 12
5.2 Existing System Deficiencies and Recommendations ................................................................. 12
6.0 FUTURE COLLECTION SYSTEM ........................................................................................................ 14
6.1 Future System Model and Analysis ............................................................................................. 14
6.2 Future System Capacity Needs and Recommendations ............................................................. 14
7.0 CAPITAL FACILITIES PLAN ................................................................................................................ 16
7.1 Summary and Recommendations ............................................................................................... 16
7.2 Projects ....................................................................................................................................... 16
8.0 IMPACT FEE FACILITIES PLAN .......................................................................................................... 18
8.1 Introduction ................................................................................................................................ 18
8.2 Growth Projections ..................................................................................................................... 18
8.3 Service Area ................................................................................................................................ 18
8.4 Level of Service ........................................................................................................................... 19
8.5 Excess Capacity ........................................................................................................................... 19
8.6 Future Development Needs ........................................................................................................ 20
8.6 Certification ................................................................................................................................. 21
Works Cited ................................................................................................................................................. 22
Sanitary Sewer Capital Facilities Plan SOUTH WEBER CITY and Impact Fee Facilities Plan
Page ii JONES & ASSOCIATES CONSULTING ENGINEERS
LIST OF TABLES AND FIGURES Table 1.1 – Projects Cost Summary
Table 2.1 – Sanitary Sewer Collection System Summary
Table 3.1 –Population Data
Figure 3.2 –Population and Growth
Table 3.3 – Population and ERU Projections
Table 4.1 – Residential Time Pattern
Table 4.2 – Commercial Time Pattern
Figure 4.1 – Residential Time Pattern
Figure 4.2 – Commercial/Industrial Time Pattern
Table 7.1 – Estimated Capital Improvement Projects Construction Dates
Table 7.2 – Summary of Capital Improvement Projects
Table 8.1 – Population and ERU Projections (IFFP)
Table 8.2 – IFFP Project
LIST OF EXHIBITS
1 Sanitary Sewer Collection System
2 General Land Use and Boundaries
3 Developable Ground and ERUs
4 Projects Map
LIST OF APPENDICES A Projects Cost Estimates
Sanitary Sewer Capital Facilities Plan SOUTH WEBER CITY and Impact Fee Facilities Plan
Page iii JONES & ASSOCIATES CONSULTING ENGINEERS
LIST OF ACRONYMS CFP Capital Facilities Plan
CWSID Central Weber Sewer Improvement District
DWQ Division of Water Quality
d/D (flow) depth to (pipe) Diameter ratio
ERU Equivalent Residential Unit
GIS Geographic Information System
gpcpd gallons per capita per day
gpd gallons per day
gpm gallons per minute
IFA Impact Fee Analysis
IFFP Impact Fee Facilities Plan
lf linear foot or linear feet
SSA (Autodesk®) Storm and Sanitary Analysis
UAC Utah Administrative Code
UDEQ Utah Department of Environmental Quality
Sanitary Sewer Capital Facilities Plan SOUTH WEBER CITY and Impact Fee Facilities Plan
Page 1 JONES & ASSOCIATES CONSULTING ENGINEERS
1.0 EXECUTIVE SUMMARY South Weber City’s sanitary sewer collection system was analyzed to check for compliance with State
regulations. A model of the existing system was created to analyze current conditions and identify
deficiencies. State-mandated flows were utilized. Then, estimated future flows were added based on
the City’s Future Land Use Map to identify where deficiencies will occur with development.
Based on the model, the existing sewer system’s main trunk line contains many segments that are
unable to carry the theoretical flows. These segments are located on Old Fort Road, Canyon Drive, 1700
East, and South Weber Drive. Nearly the entirety of this line will become deficient as development
occurs. Other segments in the system that show to be unable to convey the existing flows are 1900 East
between 7550 S and South Weber Drive, and along 2100 East between Cherry Farm Park and about
7875 South. Three (3) other areas are expected to become deficient as development occurs.
Costs of projects needed to correct existing problems are used in the calculation of user rates. Costs of
projects needed to accommodate future development are used in the calculation of impact fees. A full
list of recommended projects is found in Section 7 of this report.
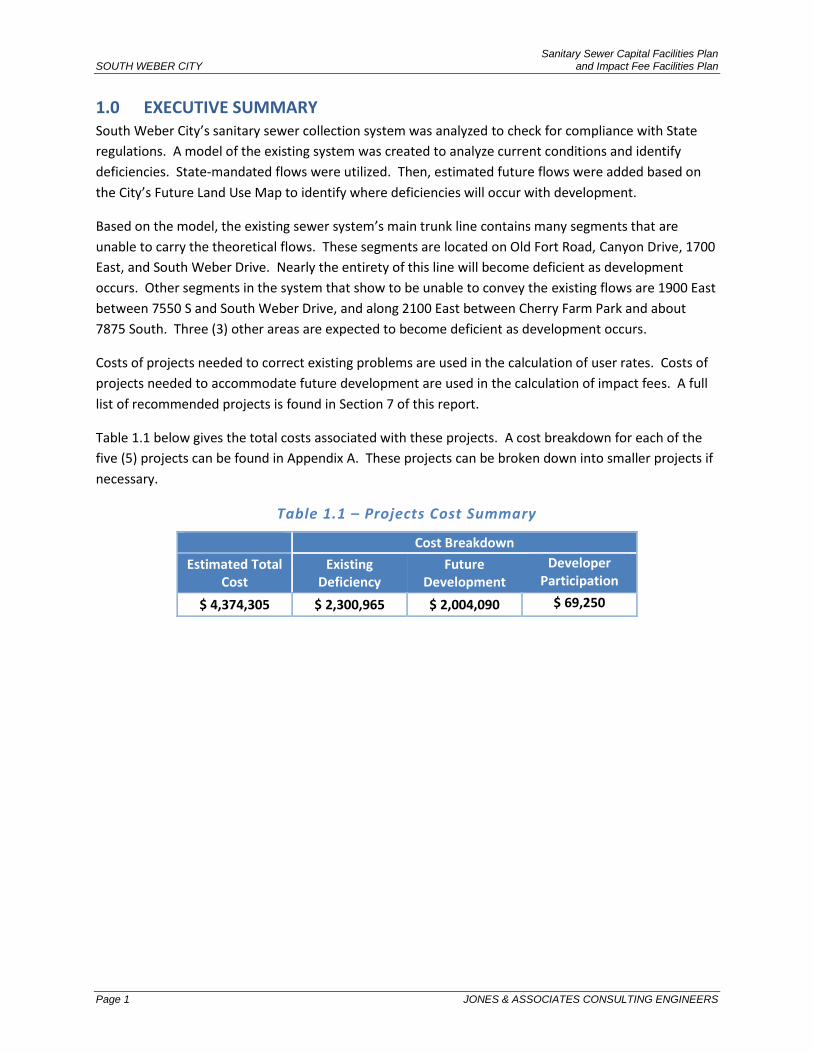
Table 1.1 below gives the total costs associated with these projects. A cost breakdown for each of the
five (5) projects can be found in Appendix A. These projects can be broken down into smaller projects if
necessary.
Table 1.1 – Projects Cost Summary
Cost Breakdown
Estimated Total Cost
Existing Deficiency
Future Development
Developer Participation
$ 4,374,305 $ 2,300,965 $ 2,004,090 $ 69,250

Sanitary Sewer Capital Facilities Plan SOUTH WEBER CITY and Impact Fee Facilities Plan
Page 2 JONES & ASSOCIATES CONSULTING ENGINEERS
2.0 INTRODUCTION
2.1 Background The Utah Code 11-36a, Impact Fees Act, requires jurisdictions, which desire to charge impact fees, to
adopt an Impact Fee Facilities Plan (IFFP) and Impact Fee Analysis (IFA). The IFFP and IFA must serve as
a basis for justification of any impact fees currently in place or to be imposed in the future. Therefore,
South Weber City requested that Jones and Associates Consulting Engineers develop a Capital Facilities
Plan (CFP) and Impact Fee Facilities Plan for the City’s sanitary sewer collection system, in preparation
for an IFA based upon the findings of the plan.
Since that time, Jones and Associates has met with South Weber City to discuss details of the existing
and proposed sanitary sewer system in order to analyze existing functionality and plan for future
expansion.
2.2 Land Use and Service Area South Weber City is located in northeast Davis County at the mouth of Weber Canyon. It is bounded by
the Weber River on the north and Layton City on the south. Highway 89 and Interstate 84 are the two
major transportation corridors that pass through the City. Land use is primarily residential with some
agriculture and commercial uses. The City’s vision for future land use remains primarily residential;
however, the City would like to include a higher percentage of commercial development than they have
had in the past.
The City provides sanitary sewer collection service within the current city boundaries and will eventually
serve the areas identified for future annexation. Future needs have been estimated based on currently
planned land use classifications. It is understood that the service boundary or the proposed land use
densities may change depending upon development. Changes in land use and annexation areas may
require periodic adjustments to this plan and the recommended sanitary sewer capital facilities projects.
2.3 System Overview South Weber City converted from septic systems to a sanitary sewer collection system in the early
1990s. Compared to other cities’ collection systems, South Weber’s system is relatively young.
The sanitary sewer system generally flows from the southeast to the northwest via collection lines and
larger interceptor or trunk lines. All of the City’s wastewater eventually flows into Central Weber Sewer
Improvement District’s (CWSID) trunk line which crosses I-84 from Uintah City near the Posse Grounds,
follows 6650 S to 475 E, then continues northwestwardly, generally following I-84. The City operates
one lift station located on Cottonwood Drive. This lift station collects the wastewater from the residents
on that street, and then lifts the sewage into the CWSID trunk line. A schematic of the sewer system can
be found in Exhibit 1.

Sanitary Sewer Capital Facilities Plan SOUTH WEBER CITY and Impact Fee Facilities Plan
Page 3 JONES & ASSOCIATES CONSULTING ENGINEERS
The following table is a summary of the collection system’s components and ownership:
Table 2.1 – Sanitary Sewer Collection System Summary
Component Size Quantity (miles) Jurisdiction
Pipe 8-inch 30.1 South Weber City
Pipe 10-inch 2.1 South Weber City
Pipe 12-inch 0.8 South Weber City
Pipe 15-inch 1.4 South Weber City
Pipe 18-inch 0.25 South Weber City
Pipe 21-inch 0.5 South Weber City
Pipe 21-inch 0.2 CWSID
Pipe 30-inch 2.2 CWSID
Manhole 4-ft & 5-ft diameter 829 South Weber City
Manhole 5-ft diameter 25 CWSID
Lift Station n/a 1 South Weber City
The City’s wastewater is treated at the Central Weber Sewer Improvement District wastewater
treatment plant. CWSID charges a fee to the communities whose wastewater is treated at their facility.
CWSID also charges a sanitary sewer impact fee which is separate from the impact fee charged by the
City. CWSID’s impact fee is not included in this report.
Sanitary Sewer Capital Facilities Plan SOUTH WEBER CITY and Impact Fee Facilities Plan
Page 4 JONES & ASSOCIATES CONSULTING ENGINEERS
3.0 ERU AND POPULATION ESTIMATES
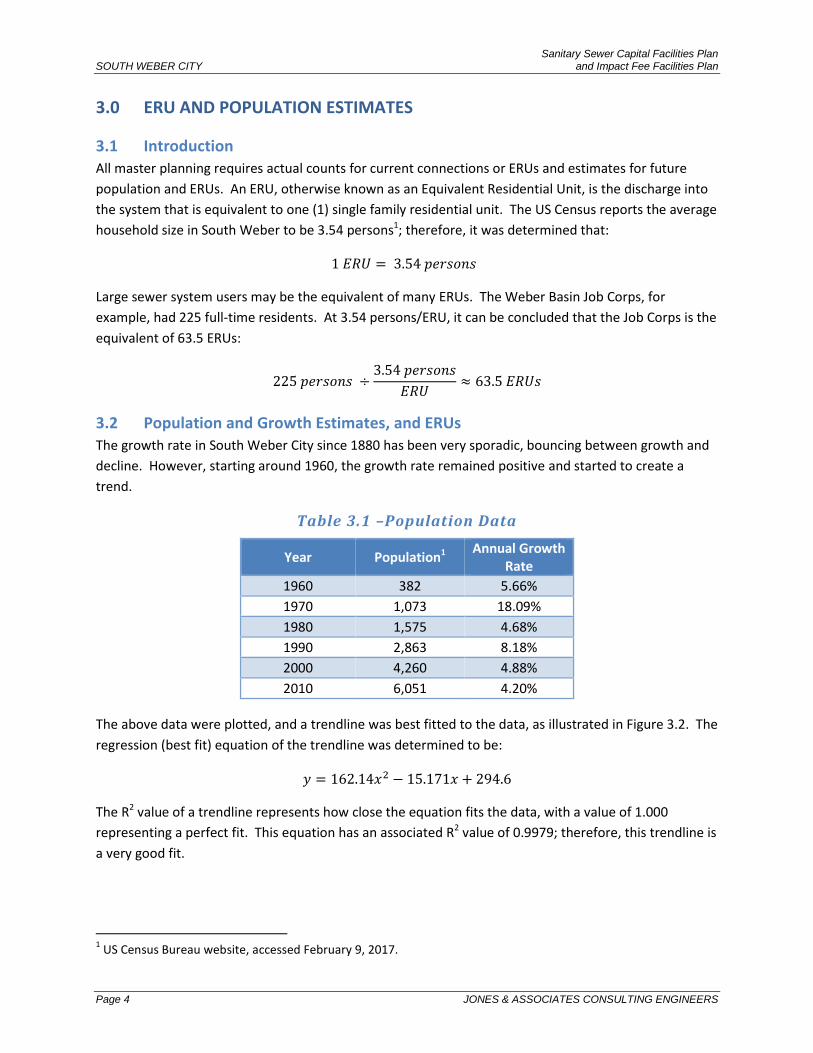
3.1 Introduction All master planning requires actual counts for current connections or ERUs and estimates for future
population and ERUs. An ERU, otherwise known as an Equivalent Residential Unit, is the discharge into
the system that is equivalent to one (1) single family residential unit. The US Census reports the average
household size in South Weber to be 3.54 persons1; therefore, it was determined that:
1 𝐸𝑅𝑈 = 3.54 𝑝𝑒𝑟𝑠𝑜𝑛𝑠
Large sewer system users may be the equivalent of many ERUs. The Weber Basin Job Corps, for
example, had 225 full-time residents. At 3.54 persons/ERU, it can be concluded that the Job Corps is the
equivalent of 63.5 ERUs:
225 𝑝𝑒𝑟𝑠𝑜𝑛𝑠 ÷3.54 𝑝𝑒𝑟𝑠𝑜𝑛𝑠
𝐸𝑅𝑈≈ 63.5 𝐸𝑅𝑈𝑠
3.2 Population and Growth Estimates, and ERUs
The growth rate in South Weber City since 1880 has been very sporadic, bouncing between growth and
decline. However, starting around 1960, the growth rate remained positive and started to create a
trend.
Table 3.1 –Population Data
Year Population1 Annual Growth Rate
1960 382 5.66%
1970 1,073 18.09%
1980 1,575 4.68%
1990 2,863 8.18%
2000 4,260 4.88%
2010 6,051 4.20%
The above data were plotted, and a trendline was best fitted to the data, as illustrated in Figure 3.2. The
regression (best fit) equation of the trendline was determined to be:
𝑦 = 162.14𝑥2 − 15.171𝑥 + 294.6
The R2 value of a trendline represents how close the equation fits the data, with a value of 1.000
representing a perfect fit. This equation has an associated R2 value of 0.9979; therefore, this trendline is
a very good fit.
1 US Census Bureau website, accessed February 9, 2017.

Sanitary Sewer Capital Facilities Plan SOUTH WEBER CITY and Impact Fee Facilities Plan
Page 5 JONES & ASSOCIATES CONSULTING ENGINEERS
Figure 3.2 –Population and Growth
Using this trendline equation, population projections were calculated. These projections are shown
above.
The 2014 South Weber City General Plan estimates a build-out population of about 12,662. Based on
the population projections shown above, this build-out condition should occur around 2038. The
General Plan also estimates that 3,620 residential dwelling units will occupy South Weber City at build-
out. This equates to approximately 3.5 persons/unit, which is consistent with the results of the 2010
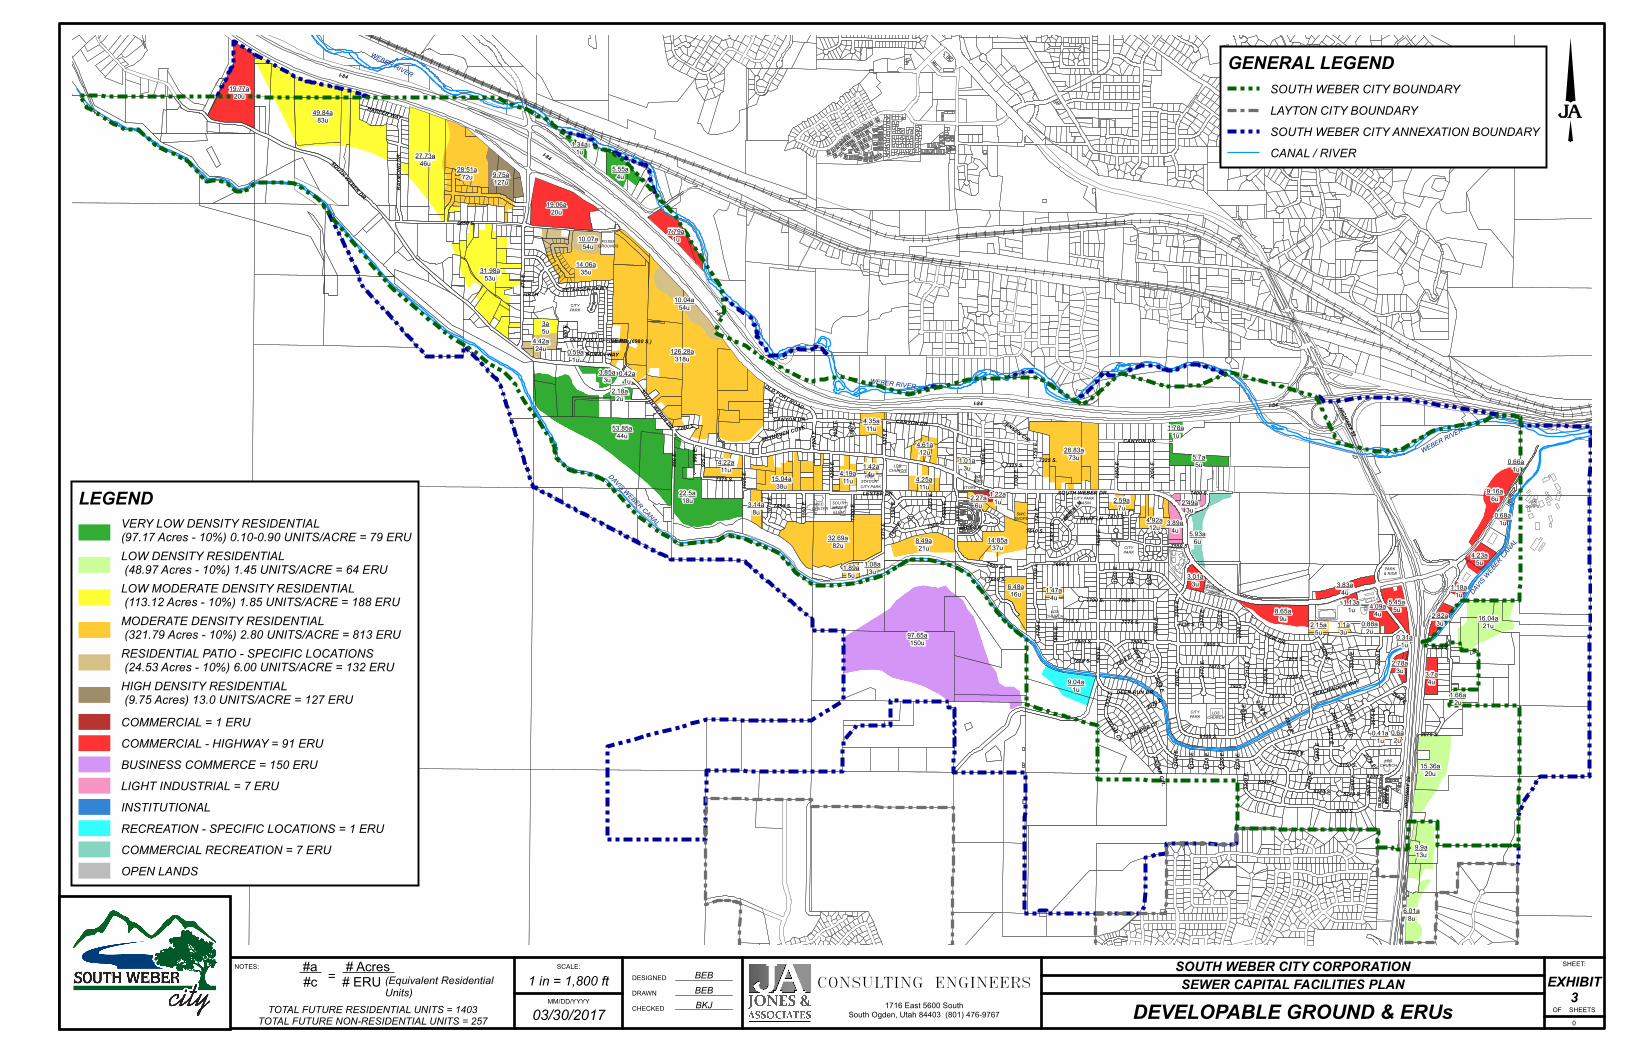
Census. The General Land Use Map and Developable Ground and ERUs Map are Exhibits 2 and 3,
respectively.
The number of non-residential customers will vary greatly and is difficult to estimate; therefore,
assumptions were made in order to estimate the projected ERU values. Metered water usage data
analyzed between 2013 and 2015 showed that non-residential water usage equated to approximately
302 ERUs, with 226 of these ERUs are attributed to the Parsons gravel pit, which uses water for dust
control. Omitting Parsons, as that water is not discharged to the sanitary sewer system, 76 ERUs are
estimated for non-residential use in 2015.
1960 1970 1980 1990 2000 2010 2020 2030 2040
Census 382 1,073 1,575 2,863 4,260 6,051
Projected 6,041 8,133 10,550 13,291
Annual Growth Rate 5.66% 18.09% 4.68% 8.18% 4.88% 4.20% 3.46% 2.97% 2.60%
y = 162.14x2 - 15.171x + 294.6 R² = 0.9979
0
2,000
4,000
6,000
8,000
10,000
12,000
14,000
Po
pu
lati
on

Sanitary Sewer Capital Facilities Plan SOUTH WEBER CITY and Impact Fee Facilities Plan
Page 6 JONES & ASSOCIATES CONSULTING ENGINEERS
Table 3.3 below summarizes the population and ERU projections through build-out. For the purposes of
this study, the Equivalent Residential Unit (ERU) growth, both residential and non-residential, was
projected at the same growth rate as the population.
Table 3.3 – Population and ERU Projections
Year Population Projection
Projected Residential
ERUs
Projected Non-Residential
ERUs
Projected Total ERUs
2015 7,046 2,013 76 2,089
2020 8,133 2,323 88 2,411
2025 9,301 2,657 100 2,757
2030 10,550 3,014 114 3,128
2035 11,880 3,394 128 3,522
2038 (build-out) 12,717 3,633 137 3,770
Overall, it is estimated that the City will reach build-out in about 20 years and add approximately 1,681
ERUs to the existing customers. Due to changes in the economy and growth rate, it is recommended
that this plan be reviewed and updated approximately every five (5) years.
Sanitary Sewer Capital Facilities Plan SOUTH WEBER CITY and Impact Fee Facilities Plan
Page 7 JONES & ASSOCIATES CONSULTING ENGINEERS
4.0 ANALYSIS INFORMATION
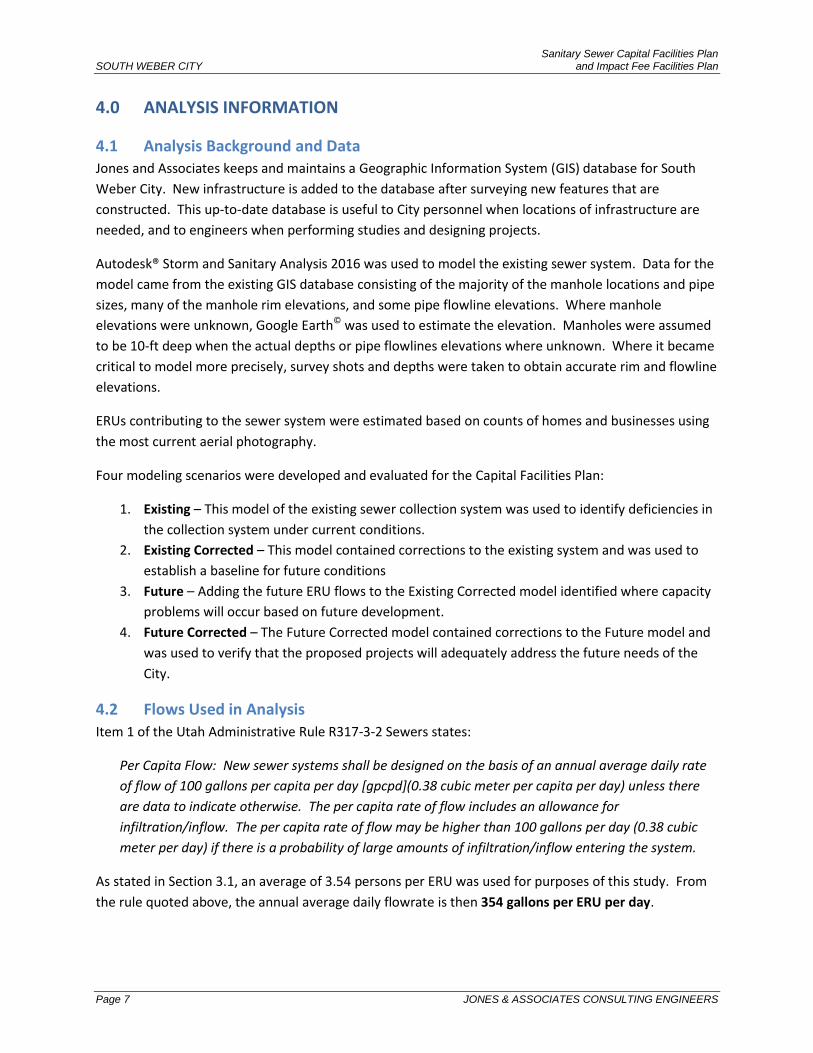
4.1 Analysis Background and Data Jones and Associates keeps and maintains a Geographic Information System (GIS) database for South
Weber City. New infrastructure is added to the database after surveying new features that are
constructed. This up-to-date database is useful to City personnel when locations of infrastructure are
needed, and to engineers when performing studies and designing projects.
Autodesk® Storm and Sanitary Analysis 2016 was used to model the existing sewer system. Data for the
model came from the existing GIS database consisting of the majority of the manhole locations and pipe
sizes, many of the manhole rim elevations, and some pipe flowline elevations. Where manhole
elevations were unknown, Google Earth© was used to estimate the elevation. Manholes were assumed
to be 10-ft deep when the actual depths or pipe flowlines elevations where unknown. Where it became
critical to model more precisely, survey shots and depths were taken to obtain accurate rim and flowline
elevations.
ERUs contributing to the sewer system were estimated based on counts of homes and businesses using
the most current aerial photography.
Four modeling scenarios were developed and evaluated for the Capital Facilities Plan:
1. Existing – This model of the existing sewer collection system was used to identify deficiencies in
the collection system under current conditions.
2. Existing Corrected – This model contained corrections to the existing system and was used to
establish a baseline for future conditions
3. Future – Adding the future ERU flows to the Existing Corrected model identified where capacity
problems will occur based on future development.
4. Future Corrected – The Future Corrected model contained corrections to the Future model and
was used to verify that the proposed projects will adequately address the future needs of the
City.
4.2 Flows Used in Analysis
Item 1 of the Utah Administrative Rule R317-3-2 Sewers states:
Per Capita Flow: New sewer systems shall be designed on the basis of an annual average daily rate
of flow of 100 gallons per capita per day [gpcpd](0.38 cubic meter per capita per day) unless there
are data to indicate otherwise. The per capita rate of flow includes an allowance for
infiltration/inflow. The per capita rate of flow may be higher than 100 gallons per day (0.38 cubic
meter per day) if there is a probability of large amounts of infiltration/inflow entering the system.
As stated in Section 3.1, an average of 3.54 persons per ERU was used for purposes of this study. From
the rule quoted above, the annual average daily flowrate is then 354 gallons per ERU per day.

Sanitary Sewer Capital Facilities Plan SOUTH WEBER CITY and Impact Fee Facilities Plan
Page 8 JONES & ASSOCIATES CONSULTING ENGINEERS
“Infiltration is groundwater entering a sanitary sewer system through joints, porous walls, and cracks.
Inflow is extraneous flow that enters a sanitary sewer from sources other than infiltration such as
connections from roof [downspouts], basement drains, land drains, and manholes covers. Inflow
typically results directly from rainfall or irrigation runoff.” (ASCE/WEF, 2007)
Infiltration in the South Weber sewer system is relatively low due to the system being new and
constructed mainly of plastic pipe. As the system ages, however, more infiltration is typical due to aging
components. Inflow has been kept to a minimum by watching new construction closely for illegal
connections to the sewer system.
4.3 Peaking Factors and Time Patterns
Utah Administrative Rule R317-3-2, item 2 goes on to state:
Design Flow
a. Laterals and collector sewers shall be designed for 400 gallons per capita per day (1.51 cubic
meters per capita per day).
b. Interceptors and outfall sewers shall be designed for 250 gallons per capita per day (0.95
cubic meter per capita per day), or rates of flow established from an approved
infiltration/inflow study.
Since the rules state that the average flow is 100 gpcpd, and the design flow is 400 gpcpd, then it can be
concluded that lateral and collector sewer lines should be designed with a peaking factor of 4, while
interceptor and outfall sewer lines, at 250 gpcpd, should be designed with a peaking factor of 2.5.
While the rules do not specify how to classify a lateral, collector, interceptor (a.k.a. trunk line), or outfall
line, it is generally accepted that a lateral is the service line from the dwelling, the lateral connects into
collector lines, and collector lines come together to interceptors. “Outfall” is generally used to describe
the discharge from a wastewater treatment plant; however, in South Weber’s case, the outfall is where
the City’s interceptor(s) discharge into CWSID’s line.
Although unusual, extraordinary flows do occasionally occur, such as the “Super Bowl® Sunday half-time
flush” and on holidays such as Christmas and Thanksgiving. It was assumed that any unaccounted-for
extraordinary flow events could be accommodated by the reserve pipe capacity provided by the
recommended maximum ratio of flow depth to pipe diameter, or d/D. The recommended d/D for pipe
less than 15-inch is 0.5 and the recommended d/D for pipes 15-inch and greater is 0.7 (ASCE/WEF,
2007). A depth-to-diameter ratio of 0.7 is the equivalent of approximately 82% of flow capacity.
A dynamic model was used for this plan; therefore, time patterns were developed and applied to the
flows as described below.
Studies have found that typical daily residential water use and hence wastewater discharge have the
greatest peak around 7:00 a.m. and a lesser peak at 7:00 p.m., as shown in Table 4.1. This table shows
that the highest average flow multiplier is 1.9. Since the rules require collector sewers to be designed
for a peaking factor of 4, the average time pattern was multiplied by a factor of 2.11 (4.0÷1.9) to achieve

Sanitary Sewer Capital Facilities Plan SOUTH WEBER CITY and Impact Fee Facilities Plan
Page 9 JONES & ASSOCIATES CONSULTING ENGINEERS
the peaking factor of 4.0. This average flow and peak flow time patterns are shown graphically in Figure
4.1.
For commercial and industrial users in the City, the same time pattern concept was applied. While
commercial and industrial use/discharge varies based on the business type, a generalized trend was
created to mimic a standard 8-5 business. This time pattern is shown in Table 4.2 and illustrated in
Figure 4.2.
Table 4.1 – Residential Time Pattern
Time Average Flow
Multiplier Peak Flow Multiplier
12 AM 0.70 1.47
1 AM 0.60 1.26
2 AM 0.40 0.84
3 AM 0.30 0.63
4 AM 0.35 0.74
5 AM 1.00 2.11
6 AM 1.80 3.79
7 AM 1.90 4.00
8 AM 1.80 3.79
9 AM 1.25 2.63
10 AM 0.80 1.68
11 AM 0.70 1.47
12 PM 0.60 1.26
1 PM 0.60 1.26
2 PM 0.60 1.26
3 PM 0.60 1.26
4 PM 1.00 2.11
5 PM 1.40 2.95
6 PM 1.50 3.16
7 PM 1.60 3.37
8 PM 1.50 3.16
9 PM 1.20 2.53
10 PM 1.00 2.11
11 PM 0.80 1.68
Average 1.00 2.11
Table 4.2 – Commercial Time Pattern
Time Average Flow
Multiplier Peak Flow Multiplier
12 AM 0.10 0.20
1 AM 0.10 0.20
2 AM 0.10 0.20
3 AM 0.10 0.20
4 AM 0.10 0.20
5 AM 0.10 0.20
6 AM 0.10 0.20
7 AM 0.70 1.40
8 AM 1.20 2.40
9 AM 2.00 4.00
10 AM 2.00 4.00
11 AM 2.00 4.00
12 PM 2.00 4.00
1 PM 2.00 4.00
2 PM 2.00 4.00
3 PM 2.00 4.00
4 PM 2.00 4.00
5 PM 2.00 4.00
6 PM 1.50 3.00
7 PM 1.00 2.00
8 PM 0.50 1.00
9 PM 0.20 0.40
10 PM 0.10 0.20
11 PM 0.10 0.20
Average 1.00 2.00
x 2.11 =
x 2.0 =

Sanitary Sewer Capital Facilities Plan SOUTH WEBER CITY and Impact Fee Facilities Plan
Page 10 JONES & ASSOCIATES CONSULTING ENGINEERS
Figure 4.1 – Residential Time Pattern
Figure 4.2 – Commercial/Industrial Time Pattern
0
0.5
1
1.5
2
2.5
3
3.5
4
4.5
12
AM
1 A
M
2 A
M
3 A
M
4 A
M
5 A
M
6 A
M
7 A
M
8 A
M
9 A
M
10
AM
11
AM
12
PM
1 P
M
2 P
M
3 P
M
4 P
M
5 P
M
6 P
M
7 P
M
8 P
M
9 P
M
10
PM
11
PM
Pe
akin
g Fa
cto
r AverageFlowMultiplier
Peak FlowMultiplier
0
0.5
1
1.5
2
2.5
3
3.5
4
4.5
12
AM
1 A
M
2 A
M
3 A
M
4 A
M
5 A
M
6 A
M
7 A
M
8 A
M
9 A
M
10
AM
11
AM
12
PM
1 P
M
2 P
M
3 P
M
4 P
M
5 P
M
6 P
M
7 P
M
8 P
M
9 P
M
10
PM
11
PM
Pe
akin
g Fa
cto
r
AverageFlowMultiplier
Peak FlowMultiplier

Sanitary Sewer Capital Facilities Plan SOUTH WEBER CITY and Impact Fee Facilities Plan
Page 11 JONES & ASSOCIATES CONSULTING ENGINEERS
4.4 Considerations for Sewer Modeled Data
It should be noted that the flows used in this analysis may not accurately represent what the system
actually conveys. Reasons are as follows:
1. In the Culinary Water Capital Facilities Plan (Jones & Associates, 2017), it was found that the
average water use for an ERU was 210 gpd, approximately 50% of the State’s estimate of 400
gpd. This likely equates to approximately 50% less wastewater discharge.
2. As stated previously, South Weber’s sewer collection system is relatively new, and is therefore,
likely, in good condition. This means that inflow and infiltration should be relatively low.
However, as the system ages, infiltration will likely to become more relevant when modeling the
system.
This conservative approach identifies potential problems. Actual observations and monitoring should be
considered when looking to implement the results of this report.
As partially quoted previously, paragraph 2 of the Utah Administrative Rule R317-3-2 states:
Design Flow
a. Laterals and collector sewers shall be designed for 400 gallons per capita per day (1.51 cubic
meters per capita per day).
b. Interceptors and outfall sewers shall be designed for 250 gallons per capita per day (0.95
cubic meter per capita per day), or rates of flow established from an approved
infiltration/inflow study.
c. The Director will consider other rates of flow for the design if such basis is justified on the
basis of supporting documentation.
As with the Division of Drinking Water, the Division of Water Quality (DWQ) allows for variances to the
rules, with “supporting documentation.” Presumably for sewer flows, a metering device and data
collection device could be installed to measure and record flows. Data collected would be analyzed to
determine flow per ERU and the peaking factor. If submitted and considered by the Director of the
DWQ, any approved revised flows would likely contain a factor of safety as determined by the Director.
This may account for aging of the system or fluctuations in the data. The approved, revised flows and
peaking factors could then be input into the model, and the model re-run to obtain revised results. This
may or may not change the recommended projects contained in this report.
Sanitary Sewer Capital Facilities Plan SOUTH WEBER CITY and Impact Fee Facilities Plan
Page 12 JONES & ASSOCIATES CONSULTING ENGINEERS
5.0 EXISTING COLLECTION SYSTEM
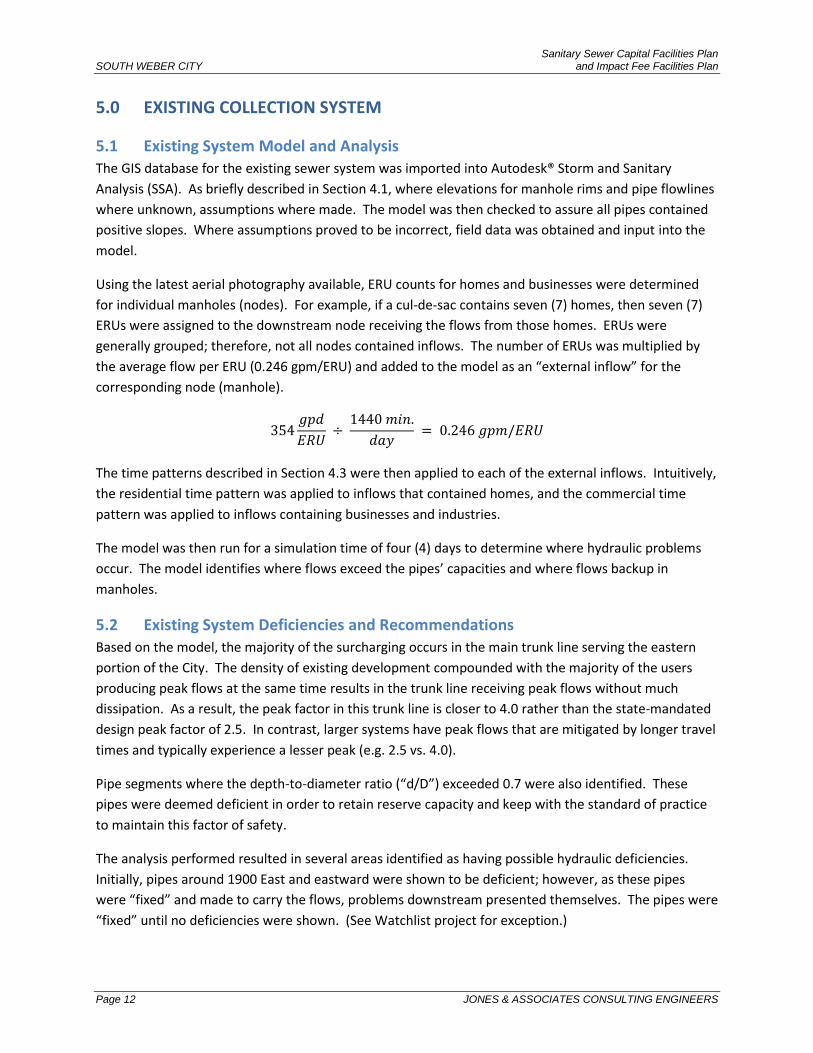
5.1 Existing System Model and Analysis The GIS database for the existing sewer system was imported into Autodesk® Storm and Sanitary
Analysis (SSA). As briefly described in Section 4.1, where elevations for manhole rims and pipe flowlines
where unknown, assumptions where made. The model was then checked to assure all pipes contained
positive slopes. Where assumptions proved to be incorrect, field data was obtained and input into the
model.
Using the latest aerial photography available, ERU counts for homes and businesses were determined
for individual manholes (nodes). For example, if a cul-de-sac contains seven (7) homes, then seven (7)
ERUs were assigned to the downstream node receiving the flows from those homes. ERUs were
generally grouped; therefore, not all nodes contained inflows. The number of ERUs was multiplied by
the average flow per ERU (0.246 gpm/ERU) and added to the model as an “external inflow” for the
corresponding node (manhole).
354𝑔𝑝𝑑
𝐸𝑅𝑈 ÷
1440 𝑚𝑖𝑛.
𝑑𝑎𝑦 = 0.246 𝑔𝑝𝑚/𝐸𝑅𝑈
The time patterns described in Section 4.3 were then applied to each of the external inflows. Intuitively,
the residential time pattern was applied to inflows that contained homes, and the commercial time
pattern was applied to inflows containing businesses and industries.
The model was then run for a simulation time of four (4) days to determine where hydraulic problems
occur. The model identifies where flows exceed the pipes’ capacities and where flows backup in
manholes.
5.2 Existing System Deficiencies and Recommendations Based on the model, the majority of the surcharging occurs in the main trunk line serving the eastern
portion of the City. The density of existing development compounded with the majority of the users
producing peak flows at the same time results in the trunk line receiving peak flows without much
dissipation. As a result, the peak factor in this trunk line is closer to 4.0 rather than the state-mandated
design peak factor of 2.5. In contrast, larger systems have peak flows that are mitigated by longer travel
times and typically experience a lesser peak (e.g. 2.5 vs. 4.0).
Pipe segments where the depth-to-diameter ratio (“d/D”) exceeded 0.7 were also identified. These
pipes were deemed deficient in order to retain reserve capacity and keep with the standard of practice
to maintain this factor of safety.
The analysis performed resulted in several areas identified as having possible hydraulic deficiencies.
Initially, pipes around 1900 East and eastward were shown to be deficient; however, as these pipes
were “fixed” and made to carry the flows, problems downstream presented themselves. The pipes were
“fixed” until no deficiencies were shown. (See Watchlist project for exception.)

Sanitary Sewer Capital Facilities Plan SOUTH WEBER CITY and Impact Fee Facilities Plan
Page 13 JONES & ASSOCIATES CONSULTING ENGINEERS
Projects #1 and #2
Based on the model, the existing sewer system’s main trunk line contains many segments that are
unable to carry the theoretical flows or have a d/D greater than 0.7. These segments are located on Old
Fort Road, Canyon Drive, 1700 East, and South Weber Drive up to 2100 East. In order to convey existing
flows, the most downstream 430 lf of sewer line should to be upsized to an 18-inch sewer line, but the
remainder of the deficiencies can be corrected by replacing sections of the 15-inch sewer line at more
favorable slopes.
To make the project more manageable in size, this section of the trunk line has been broken into two (2)
projects. If needed, it can be broken into even smaller sections.
Project # 3
The model also shows surcharging occurring in the 12-inch trunk line along 1900 East between South
Weber Drive and 7550 South. This line collects the majority of the system east of 1700 East, about 475
acres. This area of the City is largely built-out with moderate density, and the resulting peak flows reach
the trunk line quickly. It is recommended that the 12-inch trunk line be replaced with a 15-inch sewer
line for the 1,100 feet. (See Exhibit 4.)
Project # 4
Project #4 is the continuation of replacement/upsizing of the trunk line past 1900 East towards 2100
East. Four (4) out of eight (8) segments of this line need to be corrected in order to carry the existing
flows. The remaining segments of 10-inch line contain great-enough slopes to accommodate the
existing flows.
Watchlist
The last section of collection system showing to be potentially problematic is along 2100 East, between
7875 East and the Cherry Farms Park. While the model shows this section to be problematic, with the
potentially overestimated flows (as described in the previous section); there is no additional
development projected upstream of this line. Therefore, no project is recommended at this time. It is
recommended, however, that the City monitor the flows in this sewer line. If flows become a problem,
a replacement project should be considered. (See Exhibit 4.)

Sanitary Sewer Capital Facilities Plan SOUTH WEBER CITY and Impact Fee Facilities Plan
Page 14 JONES & ASSOCIATES CONSULTING ENGINEERS
6.0 FUTURE COLLECTION SYSTEM
6.1 Future System Model and Analysis The future system model started with the existing system model corrected as though Projects #1 and #4
have been completed in order to remedy those existing deficiencies. Pipes were upsized and slopes
corrected in order to convey the existing flows.
Then, using the Developable Ground and ERUs map prepared from the Future Land Use Map (see
Exhibits 2 and 3), flows and time patterns associated with the proposed land use were assigned to
nodes. We assumed that development west of the Posse Grounds would tie directly into the CWSID
trunk line. The model was then run in order to identify where the future development would cause the
capacity of the pipes to be exceeded.
6.2 Future System Capacity Needs and Recommendations
Exhibit 4 contains an illustration that shows where the model has identified potential problems. It is
evident that the City’s main trunk line experiences the majority of the deficiencies. As stated previously,
the peak flows reach the trunk line without much dissipation. This causes the trunk line to become
overloaded.
Projects #1 and #2
Previously mentioned Projects #1 and #2 contain improvements to fix the existing deficiencies; however,
these lines should be replaced in whole and upsized to accommodate future flows. For the segments of
the sewer line not required to be replaced for the existing population, the full cost of the new
installation should be shouldered by the future residents via impact fees. For the segments of the sewer
line slated for correction for the existing residents, the cost to upsize the line is listed as impact fee
eligible.
Project #4
Approximately half of the sewer line along South Weber Drive from 1900 East to 2100 East is in need of
correction to meet current conditions. The entirety of this section will need to be upsized to a 12-inch
line for future flows. As with Projects #1 and #2, the correction of the existing deficiencies is listed as a
system improvement, while the costs for upsizing and replacing the remaining sewer line segments are
accounted for in the impact fee eligible costs.
Project #5
When the south bench area (above the Davis and Weber Canal at approximately 1375 East) develops,
the receiving sewer line will likely need to be rerouted in order to move the interception point on the
trunk line further downstream. As it currently exists, flow from that area would follow 1375 East to
Lester Drive, then to 1250 East and make its way to 1200 East at Old Fort Road. In this scenario, the
lines in 1250 East and Old Fort Road would become overwhelmed. Therefore, it is recommended to
divert flows from 1250 East westwards along Lester Drive, to 925 East, and eventually to 7240 South or

Sanitary Sewer Capital Facilities Plan SOUTH WEBER CITY and Impact Fee Facilities Plan
Page 15 JONES & ASSOCIATES CONSULTING ENGINEERS
700 East. This project will help take the pressure off of the upstream section of the Old Fort Road trunk
line. (See Exhibit 4.) Alternatively, the sewer line could be installed in the proposed road that would tie
into 1160 East. While this is a longer route, access, installation, and maintenance of the sewer line
would be easier and likely less costly long-term.

Sanitary Sewer Capital Facilities Plan SOUTH WEBER CITY and Impact Fee Facilities Plan
Page 16 JONES & ASSOCIATES CONSULTING ENGINEERS
7.0 CAPITAL FACILITIES PLAN
7.1 Summary and Recommendations This report contains an evaluation of South Weber City’s sanitary sewer system. The Capital Facilities
Plan outlines the planned improvement projects needed for the City’s immediate replacement needs
and for future growth through build-out. It does not attempt to identify the sewer lines that will be in
need of replacement in the future due to the life expectancy of the pipe. It is expected that
depreciation costs, which should be budgeted and set aside, will be sufficient for these problems. It also
does not show any of the infill sewer lines. The model of future flows anticipates connections to the
nearest collector lines.
It is recommended that the City continue to clean and maintain the sewer system on a frequent basis
and pay special attention to areas where deficiencies have been noted in this study.
The recommended capital facilities projects are schematic in nature. The recommended projects should
be constructed as needed or as development dictates. The exact location and perhaps the scope of the
projects, especially those that are shown on undeveloped ground, may change according to
development layouts. Consequently, this Capital Facilities Plan should be updated regularly in response
to growth changes. Our recommendation is that this should be done every five years.
This Capital Facilities Plan is a valuable planning tool and contains information needed for the
development of an Impact Fee Facilities Plan (IFFP) and Impact Fee Analysis (IFA). The Impact Fee
Facilities Plan, contained in Section 8 of this report, creates a short-term list of projects from the Capital
Facilities Plan based on priority to be used in the calculation of the impact fee. That information is then
relayed to a financial analyst for use in the creation of the IFA.
7.2 Projects
Exhibit 4 (Projects Map) identifies the projects associated with the overall Capital Facilities Plan. Brief
descriptions explaining the needs of these projects are found in Sections 5.2 and 6.2. Any of the
projects can be broken into small phases, with proper planning. Design of the entire sewer line may be
required to assure that the segment being installed is done so at the correct elevations needed for the
long-term working of the sewer line. It should be noted, however, that due to sanitary sewer being
gravity flow, all improvements should be constructed from downstream to upstream in order to avoid
any elevation conflicts.
Estimated construction dates for each of the projects are shown in the following Table 7.1. Elements of
Projects 1 through 4 are existing deficiencies and need to be prioritized. Estimated construction years
have been assigned to the projects. Should favorable economic conditions spark interest in the south
bench, Project #5 may need to be expedited.

Sanitary Sewer Capital Facilities Plan SOUTH WEBER CITY and Impact Fee Facilities Plan
Page 17 JONES & ASSOCIATES CONSULTING ENGINEERS
Table 7.1 – Estimated Capital Improvement Projects Construction Dates
Project No.
Project Description Estimated
Construction Year
1 Replace trunk line along Old Fort Road and Canyon Dr, to 1475 E
2018-2020
2 Replace trunk line along Canyon Dr, 1700 E, and South Weber Dr, from 1475 E to 1900 E
2020-2021
3 Replace trunk line along 1900 E from South Weber Dr to 7550 S
2021-2023
4 Replace trunk line along South Weber Dr from 1900 E to 2100 E
2023-2026
5 Sewer line from South Bench, re-route Lester Drive to CWSID trunk line via 7240 S
2023-2026
A summarized list of the projects with their estimated costs is shown in Table 7.2. Itemized cost
estimates and descriptions for each of the projects are included in Appendix A. Project costs are shown
as being attributed to an existing deficiency and/or needed for future development.
Table 7.2 – Summary of Capital Improvement Projects
Project No.
Project Description Existing
Deficiency Future
Development Developer
Participation
1 Replace trunk line along Old Fort Road and Canyon Dr, to 1475 E
$ 695,650 $ 239,230 $ 69,250
2 Replace trunk line along Canyon Dr, 1700 E, and South Weber Dr, from 1475 E to 1900 E
1,065,075 258,300 -
3 Replace trunk line along 1900 E from South Weber Dr to 7550 S
242,000 - -
4 Replace trunk line along South Weber Dr from 1900 E to 2100 E
298,240 258,810 -
5 Sewer line from South Bench, re-route Lester Drive to CWSID trunk line via 7240 S
- 1,247,750 -
Totals $ 2,300,965 $ 2,004,090 $ 69,250
GRAND TOTAL $4,374,305
Sanitary Sewer Capital Facilities Plan SOUTH WEBER CITY and Impact Fee Facilities Plan
Page 18 JONES & ASSOCIATES CONSULTING ENGINEERS
8.0 IMPACT FEE FACILITIES PLAN
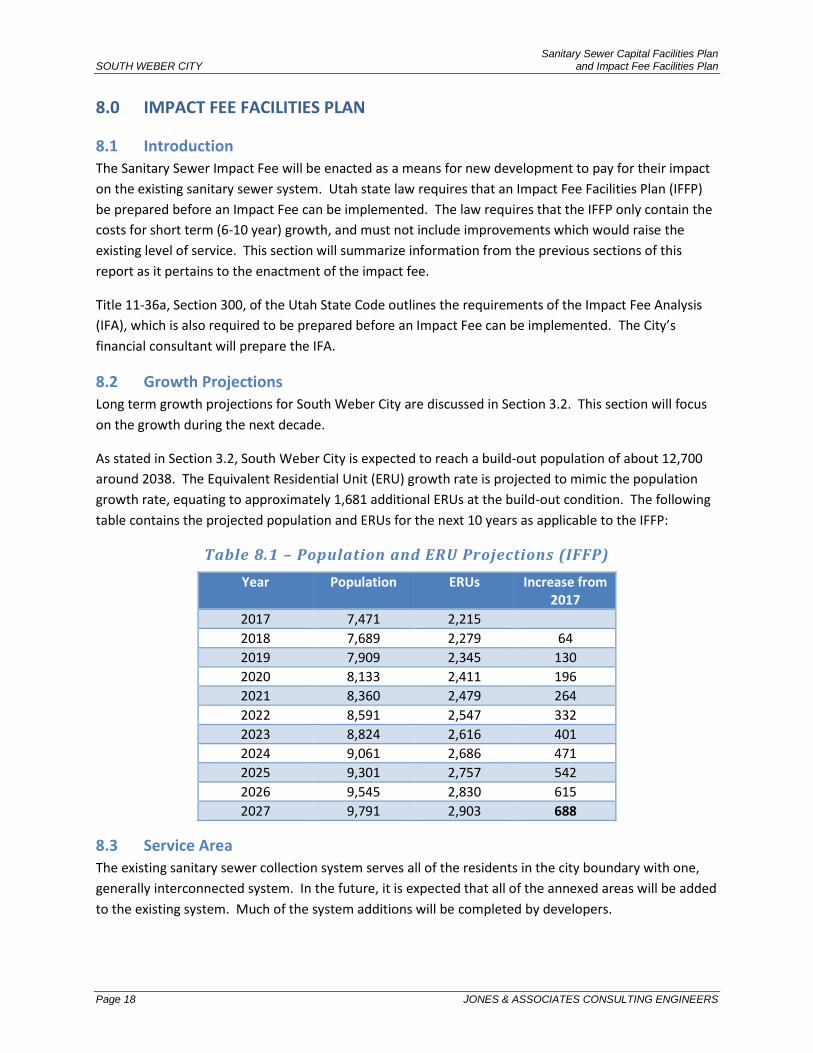
8.1 Introduction The Sanitary Sewer Impact Fee will be enacted as a means for new development to pay for their impact
on the existing sanitary sewer system. Utah state law requires that an Impact Fee Facilities Plan (IFFP)
be prepared before an Impact Fee can be implemented. The law requires that the IFFP only contain the
costs for short term (6-10 year) growth, and must not include improvements which would raise the
existing level of service. This section will summarize information from the previous sections of this
report as it pertains to the enactment of the impact fee.
Title 11-36a, Section 300, of the Utah State Code outlines the requirements of the Impact Fee Analysis
(IFA), which is also required to be prepared before an Impact Fee can be implemented. The City’s
financial consultant will prepare the IFA.
8.2 Growth Projections Long term growth projections for South Weber City are discussed in Section 3.2. This section will focus
on the growth during the next decade.
As stated in Section 3.2, South Weber City is expected to reach a build-out population of about 12,700
around 2038. The Equivalent Residential Unit (ERU) growth rate is projected to mimic the population
growth rate, equating to approximately 1,681 additional ERUs at the build-out condition. The following
table contains the projected population and ERUs for the next 10 years as applicable to the IFFP:
Table 8.1 – Population and ERU Projections (IFFP)
Year Population ERUs Increase from 2017
2017 7,471 2,215
2018 7,689 2,279 64
2019 7,909 2,345 130
2020 8,133 2,411 196
2021 8,360 2,479 264
2022 8,591 2,547 332
2023 8,824 2,616 401
2024 9,061 2,686 471
2025 9,301 2,757 542
2026 9,545 2,830 615
2027 9,791 2,903 688
8.3 Service Area
The existing sanitary sewer collection system serves all of the residents in the city boundary with one,
generally interconnected system. In the future, it is expected that all of the annexed areas will be added
to the existing system. Much of the system additions will be completed by developers.
Sanitary Sewer Capital Facilities Plan SOUTH WEBER CITY and Impact Fee Facilities Plan
Page 19 JONES & ASSOCIATES CONSULTING ENGINEERS
8.4 Level of Service
For a sanitary sewer collection system, the reasonable expectation of the residents is that they can use
the sewer system under normal operating conditions, including peak use times, without the connection
backing up. Unique situations such as blockages, unforeseen extreme infiltration from surface flooding,
line breaks, and other unexpected problems are not considered in this analysis.
The existing collection system was analyzed using the parameters outlined in Sections 4.2 and 4.3. The
expectation is that all pipes will serve the City during peak hours. Any trunk line flowing over 70% full
(by depth) during those times was considered to be deficient. The same parameters were applied to the
future system model.
8.5 Excess Capacity
Future growth will utilize the excess capacity in existing facilities as well as the capacity in new projects
contained in the Capital Facilities Plan. Sewer projects constructed using City funds were examined to
determine the excess capacity. In this section, excess capacity, if any, will be determined and evaluated.
Utah Code 11-36a-202 Prohibitions on impact fees states:
(1) A local political subdivision or private entity may not:
(a) impose an impact fee to:
(i) cure deficiencies in a public facility serving existing development;
(ii) raise the established level of service of a public facility serving existing development;
(iii) recoup more than the local political subdivision's or private entity's costs actually
incurred for excess capacity in an existing system improvement; or
(iv) include an expense for overhead, unless the expense is calculated pursuant to a
methodology that is consistent with:
(A) generally accepted cost accounting practices; and
(B) the methodological standards set forth by the federal Office of Management
and Budget for federal grant reimbursement.
The only project found to be eligible under the above rule is the 2016 Sewer Outfall Replacement
Project. In order to accommodate future growth, South Weber City chose to replace and upsize part of
the existing sewer trunk line along Old Fort Road. This project will serve a large majority of future
development. Since this project was completed solely to accommodate future growth, 100% may be
reimbursed by impact fees.
1. Future ERUs served – 1,385 (weighted average)
a. 32.5% of project (18-inch sewer line) will serve 770 additional ERUs more than previous
15-inch sewer line
b. 67.5% of project (21-inch sewer line) can serve 1,870 additional ERUs more than
previous 15-inch sewer line, therefore, it will serve all 1,681 additional ERUs expected at
build-out

Sanitary Sewer Capital Facilities Plan SOUTH WEBER CITY and Impact Fee Facilities Plan
Page 20 JONES & ASSOCIATES CONSULTING ENGINEERS
2. Cost of project - $626,450
a. Engineering - $39,544
b. Construction - $586,906
No other sanitary sewer projects were found to be eligible under the excess capacity provision.
8.6 Future Development Needs
The bulk of development is expected to occur on the western end of the City. The east side will see fill-
in development, especially along the main corridors of South Weber Drive and US 89.
Table 8.2 below shows the projects most likely to be constructed in the next 10 years. Should
considerable development occur on the east side of South Weber City in the next several years, this list
of projects should be re-evaluated and re-prioritized. Refer to Section 7.2 for additional explanation.
Table 8.2 – IFFP Projects
Project No.
Project Description Future
Development
Additional ERUs
Served
Estimated Construction
Year
1 Replace trunk line along Old Fort Road and Canyon Dr, to 1475 E
$ 239,230 854 2018-2020
2 Replace trunk line along Canyon Dr, 1700 E, and South Weber Dr, from 1475 E to 1900 E
258,300 854 2020-2021
4 Replace trunk line along South Weber Dr from 1900 E to 2100 E
258,810 266 2023-2026
5 Sewer line from South Bench, re-route Lester Drive to CWSID trunk line via 7240 S
1,247,750 869 2023-2026
Total $ 2,004,090

Sanitary Sewer Capital Facilities Plan SOUTH WEBER CITY and Impact Fee Facilities Plan
Page 21 JONES & ASSOCIATES CONSULTING ENGINEERS
8.6 Certification
"I certify that the attached impact fee facilities plan:
1. includes only the costs of public facilities that are:
a. allowed under the Impact Fees Act; and
b. actually incurred; or
c. projected to be incurred or encumbered within six years after the day on which each
impact fee is paid;
2. does not include:
a. costs of operation and maintenance of public facilities;
b. costs for qualifying public facilities that will raise the level of service for the facilities,
through impact fees, above the level of service that is supported by existing residents;
or
c. an expense for overhead, unless the expense is calculated pursuant to a methodology
that is consistent with generally accepted cost accounting practices and the
methodological standards set forth by the federal Office of Management and Budget for
federal grant reimbursement; and
3. complies in each and every relevant respect with the Impact Fees Act."
_____________________________________
Brandon Jones, P.E. – City Engineer
Sanitary Sewer Capital Facilities Plan SOUTH WEBER CITY and Impact Fee Facilities Plan
Page 22 JONES & ASSOCIATES CONSULTING ENGINEERS
Works Cited ASCE/WEF. (2007). Gravity Sanitary Sewer, Design and Construction. (P. Bizier, Ed.) Reston, VA: ASCE.
Jones & Associates. (2017). Culinary Water Capital Facilities Plan.

Sanitary Sewer Capital Facilities Plan SOUTH WEBER CITY and Impact Fee Facilities Plan
JONES & ASSOCIATES CONSULTING ENGINEERS
EXHIBITS

!(
!(
!(
!(
!(
!(
!(
!(
!(
!(
!(!(
!(
!(!(
!(
!(
!( !(
!(
!(
!(!(!(
!(!(!( !(
!(!(!(
!(
!(!(
!(
!(
!(!(!(!(!(
!(!(!(!(
!(!(
!(
!(
!(
!(!(
!(
!(
!(
!(
!(
!(
!(
!(
!( !(!(
!(
!( !(
!(
!(
!(
!(!(!(
!(!(!( !(
!(
!(
!(!(
!(
!(
!(
!(
!(!(
!(
!(
!(!(
!(!(
!(
!(
!(!(
!(
!(!(!(!(
!(
!(
!(
!(!(!(!(!(
!(!(!(!(
!(
!(
!(
!( !(
!(!(!(
!(!(!(
!(
!(!(
!(
!(
!( !(!(
!( !( !(
!(
!(!(
!(
!(!(
!(!(
!(
!(
!(
!(!(
!( !(
!(
!(
!(
!(
!(
!(
!(!(
!(!(
!(
!(
!(!(
!(
!(
!(
!(
!(
!(
!(
!(
!(
!(
!( !(
!(
!(
!( !( !( !(
!(
!(
!(!(
!(!( !( !( !(
!(
!(
!(
!(
!(!(
!(
!(
!( !( !( !(!(
!(
!(!(
!(!(
!(
!(
!(!(
!(!(!(!(!(
!(
!(
!(
!(
!(
!(
!(
!(
!(
!(
!(
!(!(
!(!( !( !(
!(!(
!(
!(
!(!(
!(
!(
!(
!(
!(
!(
!(
!(!(!(
!(
!(
!(
!(
!(!(
!(
!(!(!(
!(
!(
!(
!(
!(
!(
!( !(
!(
!(
!(
!(
!(!(
!(
!(
!(!( !( !(
!(
!(
!(
!(!(
!(
!(!(!(
!(
!(
!(!(
!(
!(
!(
!(
!(
!(!(
!(
!(!(
!(
!(
!(
!(
!(
!(
!(!(!( !( !(
!( !( !( !( !(
!(
!(
!(
!(
!(!( !( !(
!(
!(
!(
!(
!(
!(
!(
!(!(
!(
!(!(
!(
!(
!(
!( !(
!( !(!(
!(
!(
!(
!(
!(
!(
!(
!(!(!(
!(
!(
!(
!(
!(
!(!(
!(
!(
!(
!(!( !(!(
!(
!(
!(
!(
!(
!(
!(
!(
!( !(
!(
!(
!(
!(
!(
!( !(
!(
!( !(
!(
!(
!(
!( !(
!(
!(!(!(
!(!(
!( !(!(
!(
!(
!(!(
!(
!(
!(
!(
!(!(
!(
!(!(!(
!(
!(!(
!(
!(!( !(
!(!(!(
!(
!(!( !(!(
!(!(
!(!(!(
!(
!(!(!(
!(!(!(!(
!(
!( !( !(
!( !( !( !(!(!(
!(
!(!(!(
!(
!(
!(
!(!(
!(!(
!(
!(
!(!(!(
!(!(
!(
!(!(
!(
!(
!( !( !(
!(
!(!(
!(!(
!(
!(
!( !( !(
!(!(
!(
!(
!(!(
!(
!(
!(
!(
!(
!(
!(
!(
!(
!(
!(
!(
!(
!(
!(
!(
!(
!(
!(
!(
!(
!(!( !( !(
!(
!(
!(!(!(!(!(!(!(!(!(!(
!(
!(
!(!(
!(!(!(!(!(!(!(!(
!(!(!(
!(
!(
!(
!(
!(
!(
!(
!(
!(!(!(
!(!(!(!(!(
!(
!(
!(
!(
!(
!(!(
!(
!(
!(
!(
!(!(
!(
!(
!(
!(
!( !(
!(
!(!(!(
!(
!(
!(
!( !(!(
!(
!(
!(
!(
!(
!(
!(
!(
!(
!(
!(
!(
!(
!(
!(
!(
!(
!(
!(
!(
!(
!(
!(!(
!( !(
!(
!(
!( !(
!(!(
!(
!(
!(
!(
!(
!(
!( !(
!(
!(
!(
!(
!(
!(
!(
!(
!(
!(!(
!(!(
!(
!(!(!(!(
!( !(
!(
!(
!(
!(!(!(
!(!(
!(
!(
!(
!(
!(
!(!(
!(
!(
!(
!(
!(
!(
!(
!(
!(
!(
!(
!(
!(
!(!(!(!(
!(
!(
!(!(
!( !( !(
!(
!(
!(
!(
!(
!(!(
!(
!(!(
!(
!(
!(
!(!(!(!( !(
!(
!(!(
!(
!(!(
!(
!(
!(
!(
!(
!(
!(
!(
!(
!(
!(
!(
!(!(
!(
!(
!(
!(
!(
!(
!(!(
!(
!(!(!(
!(
!(
!(
!(
!(
!(!(
!(
!(
!(
!(
!(
!(
!(
!(
!(
!(
!(
!(
!(
!(
!(
!(
!(!(
!(
!(
!(!(
!(
!(
!(
!(
!(
!(
!(
!(
!(
!(
!(
!(
!(!(!(
!(!(
!(
!(
!(
!(!(!(
!(
!(
!(
!( !( !(
!(
!(!(!(
!(!(
!(
!(!(!(
!(
!(
!(
!(
!(
!( !(!(!(!( !(!(!(
!(
!( !(
!(
!(
!(
!(
!(
!(
!(
!(
!(
!(
!(
!(
!(
!(
!(
!(
!(
!(
!(
!#U
RD
RUN
DR.
I-84
FARM
I-84
FIRTH
CEDAR
BUEN
AVIST
A
600 E
.
850 E
.
2600
E
2560
E
900 E
.
1550
E
6850 S
1650
E
1650
E
1725
E
6750 S
1775
E
1800
E
6760 S
6650 S
2275
E
6600 S
725 E
.
1075
E.
1750
E.
7325 S.
1200
E.
7600 S.
1300
E.
1250
E.
1375
E.
1700
E.
2125
E.
2275
E.
7700 S.
7875 S.
2050
E.
2300
E.
7825 S.
8075 S.
1850
E.
7880 S.
2000 E.
1390
E.
1650
E.
1400
E.
6650 S.
8150 S.
8240 S.
7680 S.
7460 S.
7510 S.
(2725
E)
CEDAR CT.
ERICA WAY
(7250 S.)
CITYPARK
CITYPARK
CITYPARK
JOBCORPS
HIGHWAY 89
HIGH
WAY 8
9
LDSCHURCH
WEBER RIVER
WEBER RIVER
LDSCHURCH
LDSCHURCH
WEBER RIVER
WEBER RIVER
RAYM
OND
DRIV
E
PEACHWOOD WAY
COTTONWOOD DRIVE
DAVIS WEBER CANAL
DAVIS WEBER CANAL
DAVIS WEBER CANAL
DAVIS WEBER CANAL
7150 S. (PRIVATE)
CITY PARK/ BASIN
(MOU
NTAI
N VA
LLEY
DR.
)
WAY
DEER
STORE
CEDAR
475 E
.
925 E
.
2700
E
2600
E
7550 S
2325
E
7975 S
2310
E
675 E
.
2425
E
2300 E
1750
E
2125
E
KAY L
N1160
E.
8225 S.
2650
E.
6650 S.
7375 S.
1025
E.
1375
E. 15
50 E
.15
50 E
.
1600
E.
7325 S.
7925 S.
7875 S.
2175
E.
2100
E.
2225
E.
7400 S
1900
E.
1925
E.
1900
E.
7800 S.
7775 S.
8100 S.
7800 S.
2175
E.
2100
E.
2575
E.
2475 E.2500 E.
2350 E.
2525 E.2550 E.
2750
E.
7840 S.
7870 S.
2050 E.
2020 E.
2050
E.
1950
E.
7240 S.
1200
E.
1800
E.1750
E. 2175
E.
2225
E.
2100
E.
8150 S.
8200 S.
1960 E.
1950
E.
2000
E.
2050
E.
2020
E.
2050
E.
1980
E.
8125 S.
2625 E.
2300
E.
7800 S.
2450 E.
7600 S.
VIEW DR
8240 S.
7425 S.
7500 S.
1400 E
.
1475
E.
2350 E.
7600 S.
7640 S.
2250
E.
2260
E. 8240 S.
2570 E.
SHAY LN
8200 S.
2530
E.
1750
E.
7470 S.
1740
E.
1900
E.
1500
E.
JACE LN1450 E.
8300 S.
1300
E.
1250
E.
1100
E.
7450 S.
VIEW DR.
LOOP DR.
CEDAR CIR
(PRI
VATE
)
BOMAN WAY
GLEN CIR.
CITY PARK
SWCSHOPS
HARPER WAY
CANYON DR.
LESTER DR.
CORN
IA DR
.
VIEW DRIVE
CITYHALL
CANYON DR.
ERIKA LN.
CANYON DR.
LESTER DR.
JENSEN CIR.
JUNIPER CT.
DEER RUN DR
BATEMAN WAY
LDSCHURCH
DEER RUN DR
KINGSTON DR.
DEER RUN DR.
PEACHWOOD DR
CANYON DRIVE
REC.CENTER
OLD FORT RD.
SKYHAVEN COVE
PETERSON PKWY
FIRESTATION
POSSEGROUNDS
SOUTH BENCH DR.
SUNSHINECOURT
SOUTH WEBER DR.
CEDAR BENCH DR.
SOUTH WEBER DR.
EAST
FRON
TAGE
RD
SANDALWOOD DRIVE
SOUTH WEBER DRIVE
SOUTH WEBER DRIVE
SOUTH WEBER DRIVE
OLD POST OFFICE RD.
SOUTHWEBERELEM.
LINCO
LN LN
.(28
00 E
.)
0
EXHIBIT1
SOUTH WEBER CITY CORPORATIONSEWER CAPITAL FACILITIES PLAN
EXISTING SEWER SYSTEM MAPCONSULTING ENGINEERS
1716 East 5600 SouthSouth Ogden, Utah 84403 (801) 476-9767
SCALE:DESIGNEDDRAWNCHECKED
BEBBKJ
BEB1 in = 1,800 ftMM/DD/YYYY
03/30/2017
NOTES:
LEGENDSOUTH WEBER CITY BOUNDARYLAYTON CITY BOUNDARYCANAL / RIVER
!( SEWER MANHOLE!#U SEWER LIFT STATION
EXISTING 8" PIPEEXISTING 10" PIPEEXISTING 12" PIPEEXISTING 15" PIPEEXISTING 18" PIPEEXISTING 21" PIPEEXISTING 30" PIPE

E E E E E E E E E E E E E E E E E E E E E E E E E E E E E E E E E E E
E E E E E E E E E E E E E E E E E E E E E E E E E E E E E E E E E E E
E E E E E E E E E E E E E E E E E E E E E E E E E E E E E E E E E E E
E E E E E E E E E E E E E E E E E E E E E E E E E E E E E E E E E E E
E E E E E E E E E E E E E E E E E E E E E E E E E E E E E E E E E E E
E E E E E E E E E E E E E E E E E E E E E E E E E E E E E E E E E E E
E E E E E E E E E E E E E E E E E E E E E E E E E E E E E E E E E E E
E E E E E E E E E E E E E E E E E E E E E E E E E E E E E E E E E E E
E E E E E E E E E E E E E E E E E E E E E E E E E E E E E E E E E E E
E E E E E E E E E E E E E E E E E E E E E E E E E E E E E E E E E E E
E E E E E E E E E E E E E E E E E E E E E E E E E E E E E E E E E E E
E E E E E E E E E E E E E E E E E E E E E E E E E E E E E E E E E E E
E E E E E E E E E E E E E E E E E E E E E E E E E E E E E E E E E E E
E E E E E E E E E E E E E E E E E E E E E E E E E E E E E E E E E E E
E E E E E E E E E E E E E E E E E E E E E E E E E E E E E E E E E E E
E E E E E E E E E E E E E E E E E E E E E E E E E E E E E E E E E E E
E E E E E E E E E E E E E E E E E E E E E E E E E E E E E E E E E E E
E E E E E E E E E E E E E E E E E E E E E E E E E E E E E E E E E E E
E E E E E E E E E E E E E E E E E E E E E E E E E E E E E E E E E E E
E E E E E E E E E E E E E E E E E E E E E E E E E E E E E E E E E E E
E E E E E E E E E E E E E E E E E E E E E E E E E E E E E E E E E E E
E E E E E E E E E E E E E E E E E E E E E E E E E E E E E E E E E E E
E E E E E E E E E E E E E E E E E E E E E E E E E E E E E E E E E E E
E E E E E E E E E E E E E E E E E E E E E E E E E E E E E E E E E E E
E E E E E E E E E E E E E E E E E E E E E E E E E E E E E E E E E E E
E E E E E E E E E E E E E E E E E E E E E E E E E E E E E E E E E E E E E E E E
E E E E E E E E E E E E E E E E E E E E E E E E E E E E E E E E E E E E E E E E
E E E E E E E E E E E E E E E E E E E E E E E E E E E E E E E E E E E E E E E E
E E E E E E E E E E E E E E E E E E E E E E E E E E E E E E E E E E E E E E E E
E E E E E E E E E E E E E E E E E E E E E E E E E E E E E E E E E E E E E E E E
E E E E E E E E E E E E E E E E E E E E E E E E E E E E E E E E E E E E E E E E
E E E E E E E E E E E E E E E E E E E E E E E E E E E E E E E E E E E E E E E E
E E E E E E E E E E E E E E E E E E E E E E E E E E E E E E E E E E E E E E E E
E E E E E E E E E E E E E E E E E E E E E E E E E E E E E E E E E E E E E E E E
E E E E E E E E E E E E E E E E E E E E E E E E E E E E E E E E E E E E E E E E
E E E E E E E E E E E E E E E E E E E E E E E E E E E E E E E E E E E E E E E E
E E E E E E E E E E E E E E E E E E E E E E E E E E E E E E E E E E E E E E E E
E E E E E E E E E E E E E E E E E E E E E E E E E E E E E E E E E E E E E E E E
E E E E E E E E E E E E E E E E E E E E E E E E E E E E E E E E E E E E E E E E
E E E E E E E E E E E E E E E E E E E E E E E E E E E E E E E E E E E E E E E E
E E E E E E E E E E E E E E E E E E E E E E E E E E E E E E E E E E E E E E E E
E E E E E E E E E E E E E E E E E E E E E E E E E E E E E E E E E E E E E E E E
E E E E E E E E E E E E E E E E E E E E E E E E E E E E E E E E E E E E E E E E
E E E E E E E E E E E E E E E E E E E E E E E E E E E E E E E E E E E E E E E E
E E E E E E E E E E E E E E E E E E E E E E E E E E E E E E E E E E E E E E E E
E E E E E E E E E E E E E E E E E E E E E E E E E E E E E E E E E E E E E E E E
E E E E E E E E E E E E E E E E E E E E E E E E E E E E E E E E E E E E E E E E
E E E E E E E E E E E E E E E E E E E E E E E E E E E E E E E E E E E E E E E E
E E E E E E E E E E E E E E E E E E E E E E E E E E E E E E E E E E E E E E E E
E E E E E E E E E E E E E E E E E E E E E E E E E E E E E E E E E E E E E E E E
E E E E E E E E E E E E E E E E E E E E E E E E E E E E E E E E E E E E E E E E
E E E E E E E E E E E E E E E E E E E E E E E E E E E E E E E E E E E E E E E E
E E E E E E E E E E E E E E E E E E E E E E E E E E E E E E E E E E E E E E E E
E E E E E E E E E E E E E E E E E E E E E E E E E E E E E E E E E E E E E E E E
E E E E E E E E E E E E E E E E E E E E E E E E E E E E E E E E E E E E E E E E
E E E E E E E E E E
E E E E E E E E E E
E E E E E E E E E E
E E E E E E E E E E
E E E E E E E E E E
E E E E E E E E E E
E E E E E E E E E E
E E E E E E E E E E
E E E E E E E E E E
E E E E E E E E E E
E E E E E E E E E E
E E E E E E E E E E
E E E E E E E
E E E E E E E
E E E E E E E
E E E E E E E
E E E E E E E
E E E E E E EE E E E
E E E E
E E E E
E E E E
E E E E
E E E E
E E E E
E E E E
E E E E
E E E E
E E E E
E E E E
E E
E E
E E E E E E
E E E E E E
E E E E E E
E E E E E E
E E E
E E E
E E E
E E E
E E E
E E
E E
E E
E E
E E
E E
E E
E E E E E E E
E E E E E E E
E E E E E E E
E E E E E E E
E E E E E E E
E E E E E E E
E E E E E E E
E E E E E E E
E E E E E E E
E E E E E E E
E E E E
E E E E
E E E E
E E E E
E E E E
E E E E
E E E
E E E
E E E
E E
E E
E E
E E E
E E E
E E E E E
E E E E E
E E E E E E
E E E E E E
E E E E E E
E E E E E E
E E E E E
E E E E E
E E E E E
E E E E E
E E E E E
E E E E E
E E E E E
E E E E E
E E E E E
E E E E E
!(SOUTH WEBER
CULINARY WATERRESERVOIR
MAINTAIN PUBLIC ACCESS TO RIVERWHEN THIS AREA IS DEVELOPED
WEBER RIVER
WEBER RIVER
WEBER RIVER
DAVIS W
EBER CANAL
DAVIS WEBER CANAL
I-84
I-84
I-84
I-84I-84
FIRTH
600 E
.
475 E
.
850 E
.
925 E
.
2600
E
2700
E
KAY
LN
7550 S
2325
E
7975 S
2310
E
2425
E
2560
E
2600
E
2300 E
2530
E
725 E
.
900 E
.
7925 S
2420
E
2650
E
7325 S.1750
E.
7450 S.
1075
E.
1300
E.
1250
E.
1100
E.
7600 S.
1450 E.
1390
E.
6650 S.6650 S.
7375 S.
1025
E.
1250
E.
1200
E.
1300
E.
1475
E.
1500
E.
1550
E.
JACE LN
7600 S.
8075 S.
7825 S.
7800 S.
2625 E.
2575
E.
2100
E.
2125
E.
2175
E.
2225
E.
2275
E.
7240 S.
1375
E.
1550
E.
1600
E.
7325 S.
1700
E.
SHAY LN
1900
E.
7600 S.
7700 S.
7775 S.
1750
E.
1800
E.
7840 S.
7880 S. 1900
E.
1960 E.
2000 E.
7800 S.
7775 S.
7700 S.
1950
E.
2000
E.
2050
E.
7400 S.
2050
E.
1950
E.
2100
E.
2050
E.
2175
E.
2225
E.
7800 S.
2300
E.
7875 S.
7925 S.
2450 E.2500 E.
2550 E.
2475 E.
2525 E.
8150 S.8200 S.
8240 S.
8300 S.
2350 E.
2350 E.
2300
E.
7875 S.
2175
E.
2100
E.
2050 E.
2020 E.
1925
E.
8100 S.
7500 S.
7640 S.
8240 S.8240 S.
2260
E.
1740
E.
7510 S.
1375
E.
1750
E.
7680 S.
1400 E
. 7470 S.
2570 E.
7775 S.
1160
E.
ERIKA LN
VIEW DR.
BOMAN WAY
CEDAR CT.
LESTER DR.
CANYON DR.
HIGH
WAY 8
9
HIGHWAY 89
HARPER WAY
LESTER DR.
CORN
IA DR
.
CANYON DR.
CANYON DR.
CEDAR CIR.
SANDALWOOD
RAYM
OND
DR.
JENSEN CIR.
JUNIPER CT.
KINGSTON DR.
DEER RUN DR.
OLD FORT ROAD
PETERSEN PKWY
SKYHAVEN COVE
PEACHWOOD WAY
COTTONWOOD DR.
SOUTH BENCH DR.
SOUTH WEBER DR.
SOUTH WEBER DR.
SOUTH WEBER DR.
SOUTH WEBER DR.
SOUTH WEBER DR.
1980
E (P
RIVA
TE)
2020
E (P
RIVA
TE)
2050
E (P
RIVA
TE)
7150 S. (PRIVATE)
LINCO
LN LN
. (280
0 E.)
EAST
FRON
TAGE
RD
(2725
E)
OLD POST OFFICE RD. (6980 S.)
STORE
SWCSHOPS
CITYPARK
CITYPARK
JOBCORPS
CITYPARK
LDSCHURCH
LDSCHURCH
LDSCHURCH
REC.CENTER
PARK & RIDE
FIRESTATION
STORAGEUNITS
POSSEGROUNDS
SOUTHWEBERELEM,
CITYHALL
LDSCHURCH
CITY PARK CITY PARK
/ BASIN
0
SHEET:
OF SHEETS
EXHIBIT2
SOUTH WEBER CITY CORPORATIONSEWER CAPITAL FACILITIES PLAN
GENERAL PLAN LAND USE & BOUNDARIESCONSULTING ENGINEERS
1716 East 5600 SouthSouth Ogden, Utah 84403 (801) 476-9767
SCALE:DESIGNEDDRAWNCHECKED
BEBBKJ
BEB1 in = 1,800 ftMM/DD/YYYY
03/30/2017
REFERENCE:
LAND USE LEGENDVISUAL BUFFER BETWEEN HOUSING AND I-84
E E E
E E E MIXED USE OVERLAY
E E E
E E E HAFB RESTRICTED DEVELOPMENTRESIDENTIAL PATIO - GENERAL LOCATIONS(6.00 UNITS/ACRE = APPROX. 1/5 ACRE LOTS)*10 ACRES MAX. IN EACH LOCATIONVERY LOW DENSITY RESIDENTIAL(0.10-0.90 UNITS/ACRE = APPROX. 1 ACRE LOTS)LOW DENSITY RESIDENTIAL(1.45 UNITS/ACRE = APPROX. 1/2 ACRE LOTS)LOW MODERATE DENSITY RESIDENTIAL(1.85 UNITS/ACRE = APPROX. 1/3 ACRE LOTS)MODERATE DENSITY RESIDENTIAL(2.80 UNITS/ACRE = APPROX. 1/4 ACRE LOTS)RESIDENTIAL PATIO - SPECIFIC LOCATIONS(6.00 UNITS/ACRE = APPROX. 1/5 ACRE LOTS)HIGH DENSITY RESIDENTIAL - SPECIFIC LOCATIONS(13.0 UNITS/ACRE)COMMERCIALCOMMERCIAL - HIGHWAYBUSINESS COMMERCELIGHT INDUSTRIALINSTITUTIONALRECREATION - SPECIFIC LOCATIONSCOMMERCIAL RECREATIONOPEN LANDS
GENERAL LEGENDSOUTH WEBER CITY BOUNDARYLAYTON CITY, UINTAH CITY, ANDWEBER COUNTY BOUNDARIESSOUTH WEBER CITY ANNEXATION BOUNDARYCANAL / RIVER
South Weber CityGeneral Plan
Project Land Use MapCreated: 09/23/2014
53.85a44u
22.5a18u
5.7a5u
5.55a4u
3.85a3u
2.18a2u
1.78a1u
1.34a1u
0.42a1u
16.04a21u
15.36a20u
9.9a13u
6.01a8u
1.66a2u
49.84a83u
31.98a53u
27.73a46u
3a5u
0.59a1u
126.28a318u
32.69a82u
28.83a73u
28.51a72u
15.04a38u
14.85a37u
14.06a35u
6.48a16u
4.35a11u
8.49a21u
4.92a12u
4.61a12u
4.25a11u
4.22a11u 4.19a
11u
3.14a8u
2.59a7u
2.27a6u
2.15a5u
1.89a5u
1.47a4u
1.42a4u
1.1a3u
1.08a3u
1.01a3u
0.88a2u
0.6a2u
0.41a1u
10.07a54u
10.04a54u
4.42a24u
9.75a127u
1.22a1u
19.77a20u
19.06a20u
8.65a9u
9.16a6u
7.79a1u
5.45a5u
3.7a4u
4.23a5u
4.09a4u
3.83a4u
3.01a3u
2.82a3u
2.78a3u
1.18a1u
1.13a1u
0.68a1u
0.31a1u
97.65a150u
3.89a4u
2.49a3u
9.04a1u
5.93a6u
0.66a1u
WEBER RIVER
WEBER RIVER
WEBER RIVER
DAVIS W
EBER CANAL
DAVIS WEBER CANAL
I-84
I-84
I-84
I-84I-84
FIRTH
600 E
.
475 E
.
850 E
.
925 E
.
2600
E
KAY
LN
7550 S
2325
E
7975 S
2310
E
2425
E
2560
E
2600
E
2300 E
2530
E
900 E
.7925 S
2420
E
2650
E
7325 S.1750
E.
7450 S.
1075
E.
1300
E.
1250
E.
1100
E.
1390
E.
6650 S.
7375 S.
1025
E.
1250
E.
1200
E.
1300
E.
1475
E.
1500
E.
1550
E.
JACE LN
7600 S.
8075 S.
7825 S.
2625 E.
2575
E.
2100
E.
2125
E.
2175
E.
2225
E.
2275
E.
7240 S.
1375
E.
1600
E.
7325 S.
1700
E.
SHAY LN
1900
E.
7600 S.
7700 S.
7775 S.
1750
E.
1800
E.
7840 S.
7880 S. 1900
E.
1960 E.
2000 E.
7800 S.
7775 S.
7700 S.
1950
E.
2000
E.
2050
E.
7400 S.
2050
E.
1950
E.
2100
E.
2050
E.
2175
E.
2225
E.
7800 S.
2300
E.
7875 S.
7925 S.
2450 E.2500 E.
2550 E.
2475 E.2525 E.
8150 S.8200 S.
8240 S.
8300 S.
2350 E.
2350 E.
2300
E.
7875 S.
2175
E.
2100
E.
2050 E.
2020 E.
1925
E.
8100 S.
7500 S.
7640 S.
8240 S.8240 S.
2260
E.
1740
E.
7510 S.
1375
E.
1750
E.
1400 E
. 7470 S.
2570 E.
7775 S.
1160
E.
ERIKA LN
VIEW DR.
BOMAN WAY
CEDAR CT.
CANYON DR.
HIGH
WAY 8
9
HIGHWAY 89
HARPER WAY
LESTER DR.
CANYON DR.
CANYON DR.
CEDAR CIR.
RAYM
OND
DR.
JENSEN CIR.
JUNIPER CT.
DEER RUN DR.
OLD FORT ROAD
PETERSEN PKWY
SKYHAVEN COVE
PEACHWOOD WAY
SOUTH WEBER DR.
SOUTH WEBER DR.
SOUTH WEBER DR.
OLD POST OFFICE RD. (6980 S.)
SWCSHOPS
CITYPARK
CITYHALL
CITYPARK
JOBCORPS
CITYPARK
LDSCHURCH
LDSCHURCH
LDSCHURCH
REC.CENTER
PARK & RIDE
STORAGEUNITS
SOUTHWEBERELEM,
STORE
LDSCHURCH
CITY PARK
FIRESTATION
POSSEGROUNDS
CITY PARK/ BASIN
0
SHEET:
OF SHEETS
EXHIBIT3
SOUTH WEBER CITY CORPORATIONSEWER CAPITAL FACILITIES PLAN
DEVELOPABLE GROUND & ERUsCONSULTING ENGINEERS
1716 East 5600 SouthSouth Ogden, Utah 84403 (801) 476-9767
SCALE:DESIGNEDDRAWNCHECKED
BEBBKJ
BEB1 in = 1,800 ftMM/DD/YYYY
03/30/2017
NOTES:
LEGENDVERY LOW DENSITY RESIDENTIAL(97.17 Acres - 10%) 0.10-0.90 UNITS/ACRE = 79 ERULOW DENSITY RESIDENTIAL (48.97 Acres - 10%) 1.45 UNITS/ACRE = 64 ERULOW MODERATE DENSITY RESIDENTIAL (113.12 Acres - 10%) 1.85 UNITS/ACRE = 188 ERUMODERATE DENSITY RESIDENTIAL (321.79 Acres - 10%) 2.80 UNITS/ACRE = 813 ERURESIDENTIAL PATIO - SPECIFIC LOCATIONS (24.53 Acres - 10%) 6.00 UNITS/ACRE = 132 ERUHIGH DENSITY RESIDENTIAL (9.75 Acres) 13.0 UNITS/ACRE = 127 ERUCOMMERCIAL = 1 ERUCOMMERCIAL - HIGHWAY = 91 ERUBUSINESS COMMERCE = 150 ERULIGHT INDUSTRIAL = 7 ERUINSTITUTIONALRECREATION - SPECIFIC LOCATIONS = 1 ERUCOMMERCIAL RECREATION = 7 ERUOPEN LANDS
#a #c
# Acres # ERU=
TOTAL FUTURE RESIDENTIAL UNITS = 1403TOTAL FUTURE NON-RESIDENTIAL UNITS = 257
GENERAL LEGENDSOUTH WEBER CITY BOUNDARYLAYTON CITY BOUNDARYSOUTH WEBER CITY ANNEXATION BOUNDARYCANAL / RIVER
(Equivalent ResidentialUnits)

!(
!(
!(
!(
!(
!(!(!(
!(
!(
!(
!(
!(
!(
!(
!(!(!(
!(
!(!( !(
!(
!(
!(!(
!(
!(
!(
!(
!(
!(
!(
!(
!(
!(
!(
!(
!(
!(
!( !(
!(
!(!(!(!(
!(
!(
!(
!(!(!(!(
!(
!(
!(
!(!(
!(
!(
!(
!( !(
!(!(
!(!(
!(!(
!(
!(
!(
!(
!(
!( !(
!(
!( !(!(
!(
!(!(
!(
!(!(
!(!(
!(
!(
!(
!(!(
!( !(
!(
!(
!(
!(
!(
!(
!(!(
!(!(
!(
!(
!(!(
!(
!(
!(
!(
!(
!(
!(
!(
!(
!(
!( !(
!(
!(
!( !( !( !(
!(
!(
!(
!(
!(
!(
!(
!(
!(
!( !( !( !(
!(
!(
!(!(
!(
!(
!(
!(
!(
!(!(!(!(!(
!(
!(
!(
!(
!(
!(
!(
!(
!(
!(
!(
!(
!(!(
!(!(!( !(
!(!(
!(
!(
!(
!(
!(
!(
!(
!(
!(
!(
!(
!(
!(!(
!(
!(
!(
!(
!(
!(
!(
!(!(!(
!(
!(
!(
!(
!(
!(
!( !(
!(
!(
!(
!(
!(
!(
!(
!(
!(
!( !( !(
!(
!(
!(
!(!(
!(
!(!(!(
!(
!(
!(!(
!(
!(
!(
!(
!(
!(
!(
!(
!(
!(
!(
!(
!(
!(
!(
!(
!(!(!( !( !(
!( !( !( !( !(
!(
!(
!(
!(
!(!(!( !(
!(
!(
!(
!(
!(
!(
!(
!(
!(
!(
!(
!(!(
!(
!(
!(!(
!( !(!(
!(
!(
!(
!(
!(
!(
!(
!(!(!(
!(
!(
!(
!(
!(
!(!(
!(
!(
!(
!( !( !(!(
!(
!(
!(
!(
!(
!(
!(
!(
!(!(
!(
!(
!(
!(
!(
!( !(
!(
!( !(
!(
!(
!(
!(!(
!(
!(!(!(
!(!(
!(
!(!(
!(
!(!(
!(!(
!(!(
!(
!(
!(!(
!(!(!(
!(
!(!( !(
!(
!(!(!(!(
!(
!( !(
!( !( !( !(
!(
!(
!(!(!(!(!(!(!(!(!(!(
!(
!(
!(
!(!(!(
!(!(!(!(!(
!(
!(!(
!(
!(
!(
!(
!(
!(
!(
!(
!(
!(!(
!(!(!(
!(!(!(
!(
!(
!(
!(
!(
!( !(
!(
!(!(!(
!(
!(
!(
!(
!(
!(
!(
!(
!(
!(
!(
!(
!(
!(
!(
!(
!(
!(
!(!(!(
!(!(
!(
!(!(!(!(
!( !(
!(
!(
!(
!(!(
!(
!(
!(
!(!(
!(
!(
!(
!(
!(
!(
!(
!(
!(
!(
!(!(!(!(
!(
!(
!(!(
!( !(!(
!(
!(
!(
!(
!(
!(!(
!(
!(
!(
!(
!(
!(
!(!(
!(!( !(
!(
!(
!(
!(
!(
!(
!(
!(
!(
!(
!(
!(
!(
!(
!(
!(
!(
!(
!(
!(
!(
!(
!(
!(
!(
!(
!(
!(
!(
!(
!(
!(
!(
!(
!(
!(
!(
!(
!(
!(!(
!(
!(
!(!(
!(
!(
!(
!(
!(
!(
!(
!(!(!(
!(
!( !( !(
!(
!(
!(
!(
!(
!(
DR.
I-84
BUEN
AVIS
TA
850 E
.
925 E
.
7550 S
2325
E
7975 S
2310
E
900 E
.
1550
E
6850 S
1650
E
6750 S
1750
E 1800
E
6760 S
6650 S
2275
E
6600 S
KAY L
N
725 E
.
1160
E.10
75 E
.
1750
E.
7325 S.
7375 S. 1200
E.
1025
E.
7600 S.
1300
E.
1250
E.
1375
E.
1375
E.
1550
E.
7325 S.
1700
E.
7925 S.
7875 S.
2175
E.
2125
E.
2100
E.
2275
E.
2225
E.
7400 S
1900
E.
1900
E.
7800 S.
7700 S.
8100 S.
7875 S.
7800 S.
2175
E.
2100
E.
2050
E.
2300
E.
7840 S.
1850
E.
7880 S.
2020 E.
2050
E.
7240 S.
1200
E.
1800
E.
2175
E.
2225
E.
2100
E.
1960 E.
1950
E.
2000
E.
2050
E.
2300
E.
2000 E.
7500 S.
1390
E.
1400 E
.
2350 E.
7600 S.
7640 S.
1650
E.
2250
E.
7680 S.
1750
E.
7470 S.
1740
E.15
00 E
.
1250
E.
CEDAR CT.
BOMAN WAY
CITY PARK
(7250 S.)
SWCSHOPS
CITYPARK
CANYON DR.
LESTER DR.
CEDARCIR
CITYHALL
CITYPARK
CITYPARK
CANYON DR.
LESTER DR.
WEBER RIVER
LDSCHURCH
LDSCHURCH
LDSCHURCH
WEBER RIVER
DEER RUN DR
CANYON DRIVE
REC.CENTER
FIRESTATION
SOUTH WEBER DR.
SANDALWOOD DRIVE
SOUTH WEBER DRIVE
DAVIS WEBER CANAL
DAVIS WEBER CANAL
7150 S. (PRIVATE)
CITY PARK/ BASIN
SOUTHWEBERELEM.
STORECEDAR
675 E
. 1650
E
1725
E
1775
E
2125
E
1550
E.
1600
E.
1925
E.
7775 S.
2350 E.
1950
E.
2020
E.
2050
E.
1980
E.
7600 S.
VIEW DR
7425 S.
2260
E.
8240 S.8200 S.
1900
E.
1450 E.
1300
E.
1100
E.
7450 S.
VIEW DR.
LOOP DR.(P
RIVA
TE)
VIEW DRIVE
CANYON DR. JENSEN CIR.
DEER RUN DR
BATEMAN WAY
PEACHWOOD DR
OLD FORT RD.
SKYHAVENCOVE
SOUTH BENCH DR.
SOUTH WEBER DR.
CEDAR BENCH DR.
SOUTH WEBER DRIVE
OLD POST OFFICE RD.
0
EXHIBIT4
SOUTH WEBER CITY CORPORATIONSEWER CAPITAL FACILITIES PLAN
EXISTING DEFICIENCIES MAPCONSULTING ENGINEERS
1716 East 5600 SouthSouth Ogden, Utah 84403 (801) 476-9767
SCALE:DESIGNEDDRAWNCHECKED
BEBBKJ
BEB1 in = 1,000 ftMM/DD/YYYY
03/30/2017
NOTES:
SANITARY SEWER LEGEND!( SEWER MANHOLE!#U SEWER LIFT STATION
EXISTING 8" PIPEEXISTING 10" PIPEEXISTING 12" PIPEEXISTING 15" PIPEEXISTING 18" PIPEEXISTING 21" PIPEEXISTING 30" PIPEEXISTING SEWER SYSTEMDEFICIENCIES
GENERAL LEGENDSOUTH WEBER CITY BOUNDARYLAYTON CITY BOUNDARY
CANAL / RIVERRAILROAD
SOUTH WEBER CITYUS-89
I-84
AREASHOWN

!(
!(
!(
!(
!(
!(!(!(
!(
!(
!(
!(
!(
!(
!(
!(!(!(
!(
!(!( !(
!(
!(
!(!(
!(
!(
!(
!(
!(
!(
!(
!(
!(
!(
!(
!(
!(
!(
!( !(
!(
!(!(!(!(
!(
!(
!(
!(!(!(!(
!(
!(
!(
!(!(
!(
!(
!(
!( !(
!(!(
!(!(
!(!(
!(
!(
!(
!(
!(
!( !(
!(
!( !(!(
!(
!(!(
!(
!(!(
!(!(
!(
!(
!(
!(!(
!( !(
!(
!(
!(
!(
!(
!(
!(!(
!(!(
!(
!(
!(!(
!(
!(
!(
!(
!(
!(
!(
!(
!(
!(
!( !(
!(
!(
!( !( !( !(
!(
!(
!(
!(
!(
!(
!(
!(
!(
!( !( !( !(
!(
!(
!(!(
!(
!(
!(
!(
!(
!(!(!(!(!(
!(
!(
!(
!(
!(
!(
!(
!(
!(
!(
!(
!(
!(!(
!(!(!( !(
!(!(
!(
!(
!(
!(
!(
!(
!(
!(
!(
!(
!(
!(
!(!(
!(
!(
!(
!(
!(
!(
!(
!(!(!(
!(
!(
!(
!(
!(
!(
!( !(
!(
!(
!(
!(
!(
!(
!(
!(
!(
!( !( !(
!(
!(
!(
!(!(
!(
!(!(!(
!(
!(
!(!(
!(
!(
!(
!(
!(
!(
!(
!(
!(
!(
!(
!(
!(
!(
!(
!(
!(!(!( !( !(
!( !( !( !( !(
!(
!(
!(
!(
!(!(!( !(
!(
!(
!(
!(
!(
!(
!(
!(
!(
!(
!(
!(!(
!(
!(
!(!(
!( !(!(
!(
!(
!(
!(
!(
!(
!(
!(!(!(
!(
!(
!(
!(
!(
!(!(
!(
!(
!(
!( !( !(!(
!(
!(
!(
!(
!(
!(
!(
!(
!(!(
!(
!(
!(
!(
!(
!( !(
!(
!( !(
!(
!(
!(
!(!(
!(
!(!(!(
!(!(
!(
!(!(
!(
!(!(
!(!(
!(!(
!(
!(
!(!(
!(!(!(
!(
!(!( !(
!(
!(!(!(!(
!(
!( !(
!( !( !( !(
!(
!(
!(!(!(!(!(!(!(!(!(!(
!(
!(
!(
!(!(!(
!(!(!(!(!(
!(
!(!(
!(
!(
!(
!(
!(
!(
!(
!(
!(
!(!(
!(!(!(
!(!(!(
!(
!(
!(
!(
!(
!( !(
!(
!(!(!(
!(
!(
!(
!(
!(
!(
!(
!(
!(
!(
!(
!(
!(
!(
!(
!(
!(
!(
!(!(!(
!(!(
!(
!(!(!(!(
!( !(
!(
!(
!(
!(!(
!(
!(
!(
!(!(
!(
!(
!(
!(
!(
!(
!(
!(
!(
!(
!(!(!(!(
!(
!(
!(!(
!( !(!(
!(
!(
!(
!(
!(
!(!(
!(
!(
!(
!(
!(
!(
!(!(
!(!( !(
!(
!(
!(
!(
!(
!(
!(
!(
!(
!(
!(
!(
!(
!(
!(
!(
!(
!(
!(
!(
!(
!(
!(
!(
!(
!(
!(
!(
!(
!(
!(
!(
!(
!(
!(
!(
!(
!(
!(
!(!(
!(
!(
!(!(
!(
!(
!(
!(
!(
!(
!(
!(!(!(
!(
!( !( !(
!(
!(
!(
!(
!(
!(
DR.
I-84
BUEN
AVIS
TA
850 E
.
925 E
.
7550 S
2325
E
7975 S
2310
E
900 E
.
1550
E
6850 S
1650
E
6750 S
1750
E 1800
E
6760 S
6650 S
2275
E
6600 S
KAY L
N
725 E
.
1160
E.10
75 E
.
1750
E.
7325 S.
7375 S. 1200
E.
1025
E.
7600 S.
1300
E.
1250
E.
1375
E.
1375
E.
1550
E.
7325 S.
1700
E.
7925 S.
7875 S.
2175
E.
2125
E.
2100
E.
2275
E.
2225
E.
7400 S
1900
E.
1900
E.
7800 S.
7700 S.
8100 S.
7875 S.
7800 S.
2175
E.
2100
E.
2050
E.
2300
E.
7840 S.
1850
E.
7880 S.
2020 E.
2050
E.
7240 S.
1200
E.
1800
E.
2175
E.
2225
E.
2100
E.
1960 E.
1950
E.
2000
E.
2050
E.
2300
E.
2000 E.
7500 S.
1390
E.
1400 E
.
2350 E.
7600 S.
7640 S.
1650
E.
2250
E.
7680 S.
1750
E.
7470 S.
1740
E.15
00 E
.
1250
E.
CEDAR CT.
BOMAN WAY
CITY PARK
(7250 S.)
SWCSHOPS
CITYPARK
CANYON DR.
LESTER DR.
CEDARCIR
CITYHALL
CITYPARK
CITYPARK
CANYON DR.
LESTER DR.
WEBER RIVER
LDSCHURCH
LDSCHURCH
LDSCHURCH
WEBER RIVER
DEER RUN DR
CANYON DRIVE
REC.CENTER
FIRESTATION
SOUTH WEBER DR.
SANDALWOOD DRIVE
SOUTH WEBER DRIVE
DAVIS WEBER CANAL
DAVIS WEBER CANAL
7150 S. (PRIVATE)
CITY PARK/ BASIN
SOUTHWEBERELEM.
STORECEDAR
675 E
. 1650
E
1725
E
1775
E
2125
E
1550
E.
1600
E.
1925
E.
7775 S.
2350 E.
1950
E.
2020
E.
2050
E.
1980
E.
7600 S.
VIEW DR
7425 S.
2260
E.
8240 S.8200 S.
1900
E.
1450 E.
1300
E.
1100
E.
7450 S.
VIEW DR.
LOOP DR.(P
RIVA
TE)
VIEW DRIVE
CANYON DR. JENSEN CIR.
DEER RUN DR
BATEMAN WAY
PEACHWOOD DR
OLD FORT RD.
SKYHAVENCOVE
SOUTH BENCH DR.
SOUTH WEBER DR.
CEDAR BENCH DR.
SOUTH WEBER DRIVE
OLD POST OFFICE RD.
0
EXHIBIT5
SOUTH WEBER CITY CORPORATIONSEWER CAPITAL FACILITIES PLAN
FUTURE DEFICIENCIES MAPCONSULTING ENGINEERS
1716 East 5600 SouthSouth Ogden, Utah 84403 (801) 476-9767
SCALE:DESIGNEDDRAWNCHECKED
BEBBKJ
BEB1 in = 1,000 ftMM/DD/YYYY
03/30/2017
NOTES:
SANITARY SEWER LEGEND!( SEWER MANHOLE!#U SEWER LIFT STATION
EXISTING 8" PIPEEXISTING 10" PIPEEXISTING 12" PIPEEXISTING 15" PIPEEXISTING 18" PIPEEXISTING 21" PIPEEXISTING 30" PIPEEXISTING SEWER SYSTEM DEFICIENCIESFUTURE SEWER SYSTEM DEFICIENCIES
GENERAL LEGENDSOUTH WEBER CITY BOUNDARYLAYTON CITY BOUNDARY
CANAL / RIVERRAILROAD
SOUTH WEBER CITYUS-89
I-84
AREASHOWN
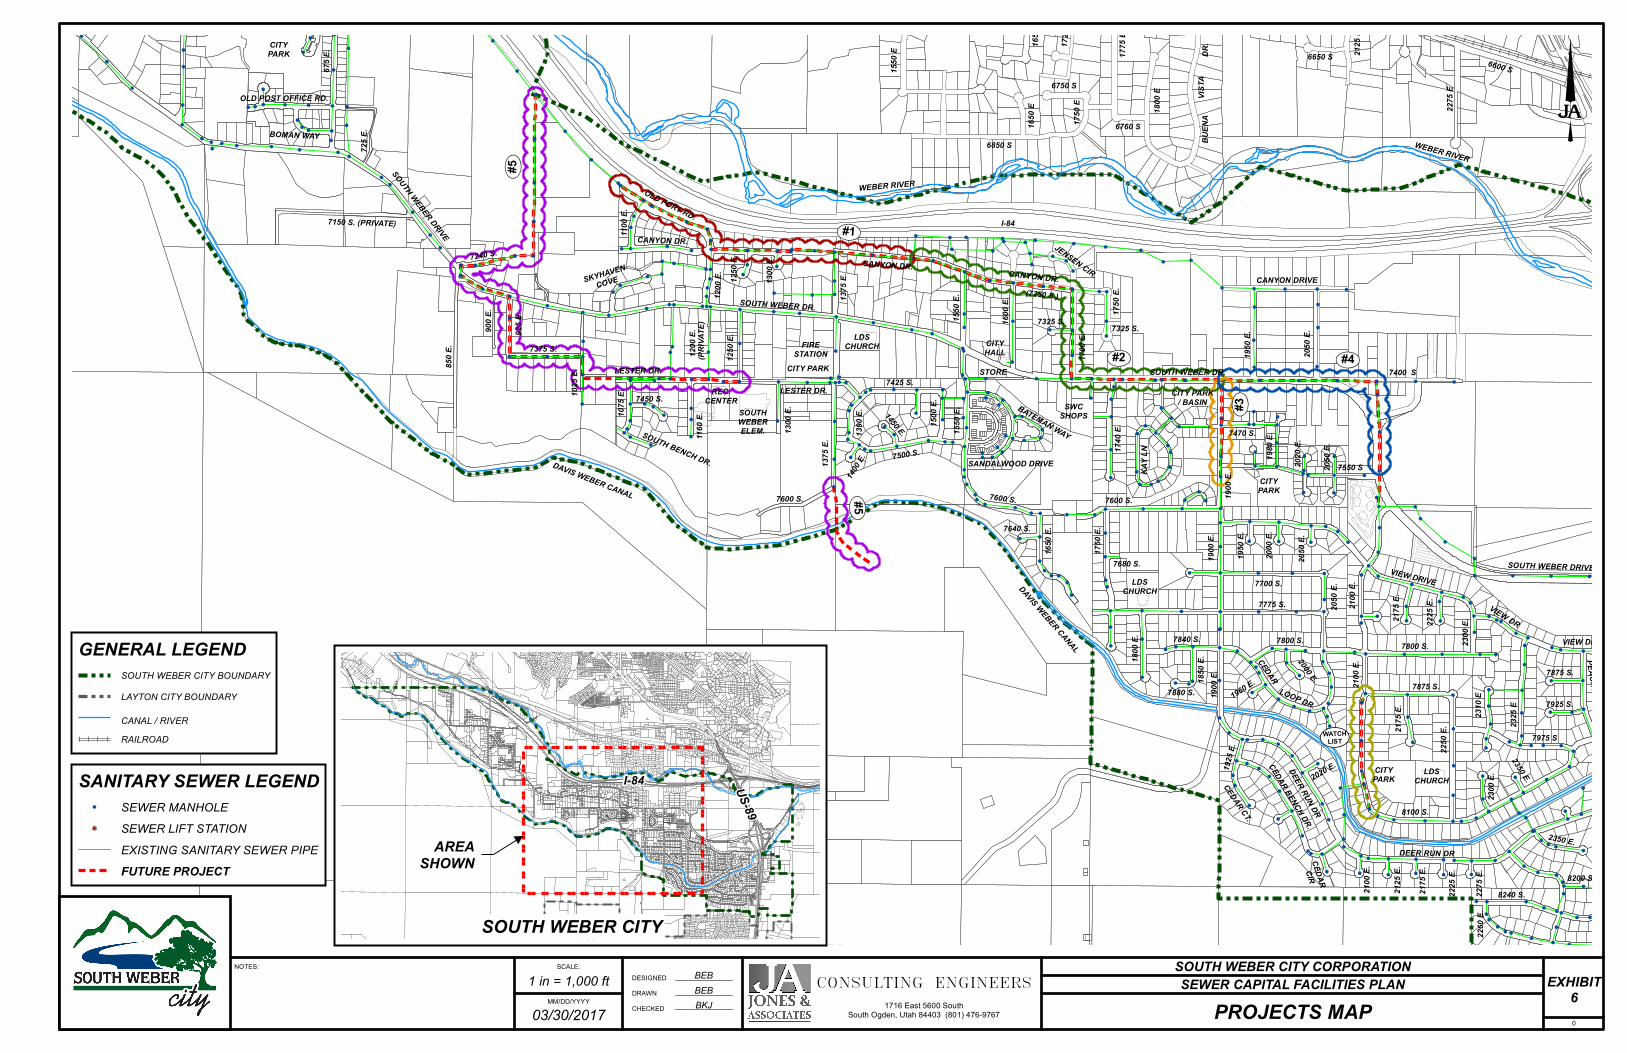
!(
!(
!(
!(
!(
!(!(!(
!(
!(
!(
!(
!(
!(
!(
!(
!(!(!(
!(
!(!( !(
!(
!(
!(!(
!(
!(
!(
!(
!(
!(
!(
!(
!(
!(
!(
!(
!(
!(
!( !(
!(
!(!(!(!(
!(
!(
!(
!(!(!(!(
!(
!(
!(
!(!(
!(
!(
!(
!( !(
!(!(
!(!(
!(!(
!(
!(
!(
!(
!(
!( !(
!(
!( !(!(
!(
!(!(
!(
!(!(
!(!(
!(
!(
!(
!(!(
!( !(
!(
!(
!(
!(
!(
!(
!(!(
!(!(
!(
!(
!(!(
!(
!(
!(
!(
!(
!(
!(
!(
!(
!(
!( !(
!(
!(
!( !( !( !(
!(
!(
!(
!(
!(
!(
!(
!(
!(
!( !( !( !(
!(
!(
!(!(
!(
!(
!(
!(
!(
!(!(!(!(!(
!(
!(
!(
!(
!(
!(
!(
!(
!(
!(
!(
!(
!(!(
!(!(!( !(
!(!(
!(
!(
!(
!(
!(
!(
!(
!(
!(
!(
!(
!(
!(!(
!(
!(
!(
!(
!(
!(
!(
!(!(!(
!(
!(
!(
!(
!(
!(
!( !(
!(
!(
!(
!(
!(
!(
!(
!(
!(
!( !( !(
!(
!(
!(
!(!(
!(
!(!(!(
!(
!(
!(!(
!(
!(
!(
!(
!(
!(
!(
!(
!(
!(
!(
!(
!(
!(
!(
!(
!(!(!( !( !(
!( !( !( !( !(
!(
!(
!(
!(
!(!(!( !(
!(
!(
!(
!(
!(
!(
!(
!(
!(
!(
!(
!(!(
!(
!(
!(!(
!( !(!(
!(
!(
!(
!(
!(
!(
!(
!(!(!(
!(
!(
!(
!(
!(
!(!(
!(
!(
!(
!( !( !(!(
!(
!(
!(
!(
!(
!(
!(
!(
!(!(
!(
!(
!(
!(
!(
!( !(
!(
!( !(
!(
!(
!(
!(!(
!(
!(!(!(
!(!(
!(
!(!(
!(
!(!(
!(!(
!(!(
!(
!(
!(!(
!(!(!(
!(
!(!( !(
!(
!(!(!(!(
!(
!( !(
!( !( !( !(
!(
!(
!(!(!(!(!(!(!(!(!(!(
!(
!(
!(
!(!(!(
!(!(!(!(!(
!(
!(!(
!(
!(
!(
!(
!(
!(
!(
!(
!(
!(!(
!(!(!(
!(!(!(
!(
!(
!(
!(
!(
!( !(
!(
!(!(!(
!(
!(
!(
!(
!(
!(
!(
!(
!(
!(
!(
!(
!(
!(
!(
!(
!(
!(
!(!(!(
!(!(
!(
!(!(!(!(
!( !(
!(
!(
!(
!(!(
!(
!(
!(
!(!(
!(
!(
!(
!(
!(
!(
!(
!(
!(
!(
!(!(!(!(
!(
!(
!(!(
!( !(!(
!(
!(
!(
!(
!(
!(!(
!(
!(
!(
!(
!(
!(
!(!(
!(!( !(
!(
!(
!(
!(
!(
!(
!(
!(
!(
!(
!(
!(
!(
!(
!(
!(
!(
!(
!(
!(
!(
!(
!(
!(
!(
!(
!(
!(
!(
!(
!(
!(
!(
!(
!(
!(
!(
!(
!(
!(!(
!(
!(
!(!(
!(
!(
!(
!(
!(
!(
!(
!(!(!(
!(
!( !( !(
!(
!(
!(
!(
!(
!(
DR.
I-84
BUEN
AVIS
TA
850 E
.
925 E
.
7550 S
2325
E
7975 S
2310
E
900 E
.
1550
E
6850 S
1650
E
6750 S
1750
E 1800
E
6760 S
6650 S
2275
E
6600 S
KAY L
N
725 E
.
1160
E.10
75 E
.
1750
E.
7325 S.
7375 S. 1200
E.
1025
E.
7600 S.
1300
E.
1250
E.
1375
E.
1375
E.
1550
E.
7325 S.
1700
E.
7925 S.
7875 S.
2175
E.
2125
E.
2100
E.
2275
E.
2225
E.
7400 S
1900
E.
1900
E.
7800 S.
7700 S.
8100 S.
7875 S.
7800 S.
2175
E.
2100
E.
2050
E.
2300
E.
7840 S.
1850
E.
7880 S.
2020 E.
2050
E.
7240 S.
1200
E.
1800
E.
2175
E.
2225
E.
2100
E.
1960 E.
1950
E.
2000
E.
2050
E.
2300
E.
2000 E.
7500 S.
1390
E.
1400 E
.
2350 E.
7600 S.
7640 S.
1650
E.
2250
E.
7680 S.
1750
E.
7470 S.
1740
E.15
00 E
.
1250
E.
CEDAR CT.
BOMAN WAY
CITY PARK
(7250 S.)
SWCSHOPS
CITYPARK
CANYON DR.
LESTER DR.
CEDARCIR
CITYHALL
CITYPARK
CITYPARK
CANYON DR.
LESTER DR.
WEBER RIVER
LDSCHURCH
LDSCHURCH
LDSCHURCH
WEBER RIVER
DEER RUN DR
CANYON DRIVE
REC.CENTER
FIRESTATION
SOUTH WEBER DR.
SANDALWOOD DRIVE
SOUTH WEBER DRIVE
DAVIS WEBER CANAL
DAVIS WEBER CANAL
7150 S. (PRIVATE)
CITY PARK/ BASIN
SOUTHWEBERELEM.
UV#5
UV#2
UV#1
UV#4
UV#3
UV #5UVWATCH
LIST
STORECEDAR
675 E
. 1650
E
1725
E
1775
E
2125
E
1550
E.
1600
E.
1925
E.
7775 S.
2350 E.
1950
E.
2020
E.
2050
E.
1980
E.
7600 S.
VIEW DR
7425 S.
2260
E.
8240 S.8200 S.
1900
E.
1450 E.
1300
E.
1100
E.
7450 S.
VIEW DR.
LOOP DR.(P
RIVA
TE)
VIEW DRIVE
CANYON DR. JENSEN CIR.
DEER RUN DR
BATEMAN WAY
PEACHWOOD DR
OLD FORT RD.
SKYHAVENCOVE
SOUTH BENCH DR.
SOUTH WEBER DR.
CEDAR BENCH DR.
SOUTH WEBER DRIVE
OLD POST OFFICE RD.
0
EXHIBIT6
SOUTH WEBER CITY CORPORATIONSEWER CAPITAL FACILITIES PLAN
PROJECTS MAPCONSULTING ENGINEERS
1716 East 5600 SouthSouth Ogden, Utah 84403 (801) 476-9767
SCALE:DESIGNEDDRAWNCHECKED
BEBBKJ
BEB1 in = 1,000 ftMM/DD/YYYY
03/30/2017
NOTES:
SANITARY SEWER LEGEND!( SEWER MANHOLE!#U SEWER LIFT STATION
EXISTING SANITARY SEWER PIPEFUTURE PROJECT
GENERAL LEGENDSOUTH WEBER CITY BOUNDARYLAYTON CITY BOUNDARY
CANAL / RIVERRAILROAD
SOUTH WEBER CITYUS-89
I-84
AREASHOWN
Sanitary Sewer Capital Facilities Plan SOUTH WEBER CITY and Impact Fee Facilities Plan
JONES & ASSOCIATES CONSULTING ENGINEERS
APPENDIX A
PROJECTS COST ESTIMATES

SOUTH WEBER CITY EXISTING CONDITIONS - SELECT DATA Sanitary Sewer Capital Facilities Plan
and Impact Fee Facilities Plan
Element ID From
(Inlet)
Node
To (Outlet)
Node
Length (ft) Average
Slope (%)
Pipe
Diameter
or Height
(inches)
Peak Flow
(gpm)
Max Flow
Velocity
(ft/sec)
Design
Flow
Capactiy
(gpm)
Max Flow
/ Design
Flow Ratio
Max Flow
Depth/
Total
Depth
Ratio
Reported
Condition
40 700 753 139.98 0.1300 15.000 974.99 1.92 901.07 1.08 1.00 SURCHARGED
44 754 766 383.90 0.0200 15.000 366.96 0.74 339.31 1.08 1.00 SURCHARGED
453 327 326 211.95 0.2500 12.000 756.90 2.33 699.53 1.08 1.00 SURCHARGED
711 699 751 235.69 0.2900 15.000 1443.44 2.88 1359.59 1.06 0.91 > CAPACITY
451 325 324 66.86 0.3600 12.000 854.76 2.76 830.33 1.03 0.89 > CAPACITY
581 242 243 399.59 0.3500 9.960 469.10 2.33 502.66 0.93 0.77 Calculated
582 241 242 313.17 0.3500 9.960 469.12 2.33 502.81 0.93 0.77 Calculated
583 240 241 137.31 0.3500 9.960 469.00 2.34 503.90 0.93 0.76 Calculated
713 168 167 398.15 0.3500 15.000 1344.77 3.05 1484.70 0.91 0.75 Calculated
584 239 240 268.36 0.3500 9.960 412.66 2.29 501.72 0.82 0.69 Calculated
585 238 239 107.84 0.3500 9.960 412.61 2.30 505.92 0.82 0.69 Calculated
586 237 238 177.57 0.3500 9.960 412.66 2.30 503.60 0.82 0.69 Calculated
450 324 554 405.38 0.5500 12.000 829.16 3.31 1030.20 0.80 0.68 Calculated
719 178 177 314.75 0.3800 15.000 1247.54 3.12 1545.06 0.81 0.68 Calculated
587 236 237 325.70 0.3500 9.960 400.16 2.28 502.00 0.80 0.67 Calculated
588 235 236 291.03 0.3500 9.960 400.22 2.28 502.08 0.80 0.67 Calculated
720 182 178 303.47 0.3900 15.000 1247.61 3.17 1573.51 0.79 0.67 Calculated
Page 1 of 1

SOUTH WEBER CITY FUTURE CONDITIONS - SELECT DATA Sanitary Sewer Capital Facilities Plan
and Impact Fee Facilities Plan
Element ID From
(Inlet)
Node
To (Outlet)
Node
Length (ft) Average
Slope (%)
Pipe
Diameter
or Height
(inches)
Peak Flow
(gpm)
Max
Flow
Velocity
(ft/sec)
Design
Flow
Capactiy
(gpm)
Max Flow
/ Design
Flow Ratio
Max Flow
Depth/
Total
Depth
Ratio
Reported
Condition
721 553 554 400.10 0.2900 9.960 497.63 2.22 462.84 1.08 0.95 > CAPACITY
707 771 772 102.37 0.2600 18.000 2222.16 3.08 2098.45 1.06 0.94 > CAPACITY
295 561 185 245.60 0.3900 15.000 1691.27 3.40 1579.16 1.07 0.93 > CAPACITY
704 772 773 292.02 0.2600 18.000 2240.68 3.14 2098.18 1.07 0.93 > CAPACITY
719 178 177 314.75 0.3800 15.000 1666.78 3.37 1545.06 1.08 0.93 > CAPACITY
720 182 178 303.47 0.3900 15.000 1702.26 3.43 1573.51 1.08 0.93 > CAPACITY
293 183 182 430.03 0.3900 15.000 1699.70 3.45 1575.24 1.08 0.92 > CAPACITY
294 185 183 262.85 0.4000 15.000 1710.22 3.43 1580.58 1.08 0.92 > CAPACITY
296 560 561 211.55 0.3900 15.000 1666.56 3.37 1573.93 1.06 0.92 > CAPACITY
703 773 839 35.98 0.2800 18.000 2209.18 3.19 2154.14 1.03 0.92 > CAPACITY
297 559 560 231.55 0.3900 15.000 1669.02 3.33 1575.26 1.06 0.91 > CAPACITY
722 552 553 404.15 0.2900 9.960 497.77 2.22 462.47 1.08 0.91 > CAPACITY
717 174 173 280.14 0.4300 15.000 1718.44 3.59 1651.42 1.04 0.88 > CAPACITY
718 177 174 248.41 0.4300 15.000 1701.08 3.63 1656.84 1.03 0.87 > CAPACITY
148 568 569 311.57 1.0000 8.040 469.49 3.47 470.38 1.00 0.82 Calculated
299 556 557 64.32 0.3900 15.000 1564.64 3.24 1566.57 1.00 0.82 Calculated
7 558 559 86.60 0.3900 15.000 1564.08 3.26 1574.47 0.99 0.81 Calculated
147 609 568 355.74 0.3500 8.040 274.29 2.06 277.52 0.99 0.81 Calculated
298 557 558 346.40 0.4000 15.000 1564.27 3.28 1580.25 0.99 0.81 Calculated
723 199 552 407.54 0.2900 9.960 454.54 2.16 462.47 0.98 0.80 Calculated
714 169 168 428.08 0.5300 15.000 1763.77 3.95 1829.80 0.96 0.79 Calculated
724 200 199 408.30 0.3000 9.960 450.20 2.18 465.87 0.97 0.79 Calculated
300 555 556 241.49 0.3900 15.000 1504.94 3.26 1576.04 0.95 0.78 Calculated
301 554 555 383.48 0.3900 15.000 1505.12 3.29 1576.78 0.95 0.78 Calculated
581 242 243 399.59 0.3500 9.960 475.36 2.34 502.66 0.95 0.78 Calculated
44 754 766 383.90 0.2200 18.000 1796.90 2.74 1899.91 0.95 0.77 Calculated
582 241 242 313.17 0.3500 9.960 475.39 2.34 502.81 0.95 0.77 Calculated
Page 1 of 2

SOUTH WEBER CITY FUTURE CONDITIONS - SELECT DATA Sanitary Sewer Capital Facilities Plan
and Impact Fee Facilities Plan
Element ID From
(Inlet)
Node
To (Outlet)
Node
Length (ft) Average
Slope (%)
Pipe
Diameter
or Height
(inches)
Peak Flow
(gpm)
Max
Flow
Velocity
(ft/sec)
Design
Flow
Capactiy
(gpm)
Max Flow
/ Design
Flow Ratio
Max Flow
Depth/
Total
Depth
Ratio
Reported
Condition
583 240 241 137.31 0.3500 9.960 475.28 2.34 503.90 0.94 0.77 Calculated
146 610 609 397.61 0.3500 8.040 252.65 2.06 277.93 0.91 0.75 Calculated
40 700 753 139.98 0.2400 18.000 1782.24 2.84 1983.94 0.90 0.74 Calculated
702 677 826 440.86 0.3700 18.000 2178.62 3.58 2476.91 0.88 0.73 Calculated
727 550 551 410.75 0.3400 9.960 432.49 2.29 494.00 0.88 0.73 Calculated
716 173 170 347.83 0.6100 15.000 1692.92 4.28 1961.72 0.86 0.71 Calculated
584 239 240 268.36 0.3500 9.960 418.92 2.29 501.72 0.83 0.70 Calculated
586 237 238 177.57 0.3500 9.960 418.93 2.30 503.60 0.83 0.70 Calculated
842 839 677 372.51 0.4000 18.000 2187.28 3.73 2584.21 0.85 0.70 Calculated
Page 2 of 2

SOUTH WEBER CITY PROJECT COST ESTIMATES Sanitary Sewer Capital Facilities Plan
and Impact Fee Facilities Plan
Capital Improvement Projects
Project #1
Trunk Line along Old Fort Road and Canyon Dr, to 1475 E
Description Unit Price Total Price
Mobilization/demobilization 1 ls 100,000$ 100,000$ 0.75 75,000$ 0.25 25,000$ - -$
Install 18" sewer line 1,255 lf 95 119,225 430 40,850 825 78,375 - -
Install 15" sewer line 2,160 lf 85 183,600 1,710 145,350 - - 450 38,250
Upgrade to 18" sewer line 2,160 lf 10 21,600 - - 2,160 21,600 - -
Install 5' manhole 13 ea 7,500 97,500 9 67,500 2 15,000 2 15,000
Reconnect 4" service lateral 38 ea 800 30,400 22 17,600 16 12,800 - -
Perform City asphalt repair 4,750 lf 20 95,005 4,750 95,000 0.25 5 - -
Perform by-pass pumping 1 ls 25,000 25,000 0.75 18,750 0.25 6,250 - -
Perform dewatering 1 ls 75,000 75,000 0.75 56,250 0.25 18,750 - -
Coordination with Questar HPG 1 ls 25,000 25,000 0.75 18,750 0.25 6,250 - -
Subtotal 772,330$ 535,050$ 184,030$ 53,250$
Engineering and Construction Management (15%) 115,800 80,300 27,600 8,000
Contingency (15%) 115,800 80,300 27,600 8,000
TOTAL 1,003,930$ 695,650$ 239,230$ 69,250$
Existing Deficiency
(System Improvement)
Future Development
(Impact Fee Eligible) Developer ParticipationQuantity
Page 1 of 5

SOUTH WEBER CITY PROJECT COST ESTIMATES Sanitary Sewer Capital Facilities Plan
and Impact Fee Facilities Plan
Capital Improvement Projects
Project #2
Trunk Line along Canyon Dr, 1700 E, and South Weber Dr, from 1475 E to 1900 E
Description Unit Price Total Price
Mobilization/demobilization 1 ls 125,000$ 125,000$ 0.80 100,000$ 0.20 25,000$ - -$
Install 18" sewer line 590 lf 95 56,050 - - 590 56,050 - -
Install 15" sewer line 3,615 lf 85 307,275 3,615 307,275 - - - -
Upgrade to 18" sewer line 3,615 lf 10 36,150 - - 3,615 36,150 - -
Install 5' manhole 16 ea 7,500 120,000 13 97,500 3 22,500 - -
Reconnect 4" service lateral 45 ea 800 36,000 40 32,000 5 4,000 - -
Perform City asphalt repair 5,600 lf 20 112,000 5,350 107,000 250 5,000 - -
Perform UDOT asphalt repair 2,010 lf 50 100,500 1,510 75,500 500 25,000 - -
Perform by-pass pumping 1 ls 25,000 25,000 0.80 20,000 0.20 5,000 - -
Perform dewatering 1 ls 75,000 75,000 0.80 60,000 0.20 15,000 - -
Coordination with Questar HPG 1 ls 25,000 25,000 0.80 20,000 0.20 5,000 - -
Subtotal 1,017,975$ 819,275$ 198,700$ -$
Engineering and Construction Management (15%) 152,700 122,900 29,800 -
Contingency (15%) 152,700 122,900 29,800 -
TOTAL 1,323,375$ 1,065,075$ 258,300$ -$
Existing Deficiency
(System Improvement)
Future Development
(Impact Fee Eligible) Developer ParticipationQuantity
Page 2 of 5
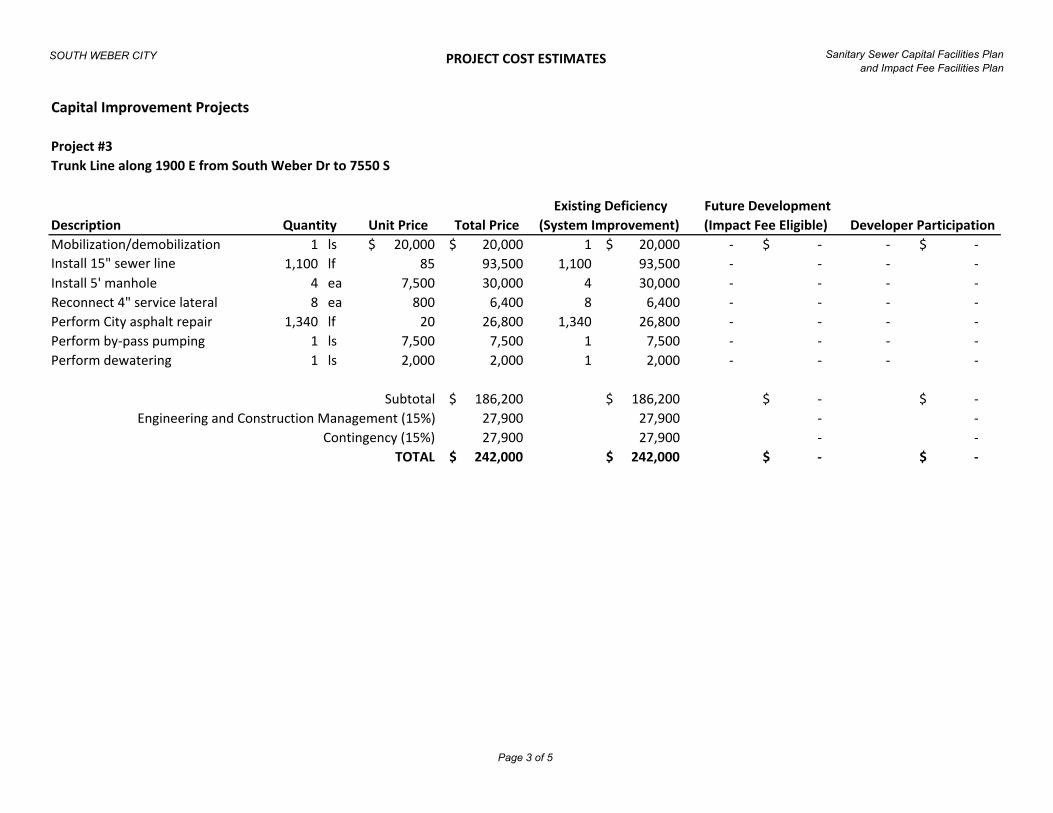
SOUTH WEBER CITY PROJECT COST ESTIMATES Sanitary Sewer Capital Facilities Plan
and Impact Fee Facilities Plan
Capital Improvement Projects
Project #3
Trunk Line along 1900 E from South Weber Dr to 7550 S
Description Unit Price Total Price
Mobilization/demobilization 1 ls 20,000$ 20,000$ 1 20,000$ - -$ - -$
Install 15" sewer line 1,100 lf 85 93,500 1,100 93,500 - - - -
Install 5' manhole 4 ea 7,500 30,000 4 30,000 - - - -
Reconnect 4" service lateral 8 ea 800 6,400 8 6,400 - - - -
Perform City asphalt repair 1,340 lf 20 26,800 1,340 26,800 - - - -
Perform by-pass pumping 1 ls 7,500 7,500 1 7,500 - - - -
Perform dewatering 1 ls 2,000 2,000 1 2,000 - - - -
Subtotal 186,200$ 186,200$ -$ -$
Engineering and Construction Management (15%) 27,900 27,900 - -
Contingency (15%) 27,900 27,900 - -
TOTAL 242,000$ 242,000$ -$ -$
Existing Deficiency
(System Improvement)
Future Development
(Impact Fee Eligible) Developer ParticipationQuantity
Page 3 of 5

SOUTH WEBER CITY PROJECT COST ESTIMATES Sanitary Sewer Capital Facilities Plan
and Impact Fee Facilities Plan
Capital Improvement Projects
Project #4
Trunk Line along South Weber Dr from 1900 E to 2100 E
Description Unit Price Total Price
Mobilization/demobilization 1 ls 40,000$ 40,000$ 0.66 26,400$ 0.34 13,600$ - -$
Install 12" sewer line 1,238 75 92,850 - - 1,238 92,850
Install 10" sewer line 1,612 lf 70 112,840 1,612 112,840 - - - -
Upsize to 12" sewer line 1,612 5 8,060 - - 1,612 8,060
Install 5' manhole 10 ea 7,500 75,000 2 15,000 8 60,000 - -
Reconnect 4" service lateral 26 ea 800 20,800 10 8,000 16 12,800 - -
Perform UDOT asphalt repair 1,600 lf 45 72,000 1,200 54,000 400 18,000 - -
Perform trench repair,
unimproved 850 lf 10 8,500 - - 850 8,500 - -
Perform by-pass pumping 1 ls 15,000 15,000 0.66 9,900 0.34 5,100 - -
Perform dewatering 1 ls 5,000 5,000 0.66 3,300 0.34 1,700 - -
Subtotal 450,050$ 229,440$ 220,610$ -$
Engineering and Construction Management (15%) 67,500 34,400 33,100 -
Contingency (15%) 67,500 34,400 33,100 -
TOTAL 585,050$ 298,240$ 286,810$ -$
Existing Deficiency
(System Improvement)
Future Development
(Impact Fee Eligible) Developer ParticipationQuantity
Page 4 of 5

SOUTH WEBER CITY PROJECT COST ESTIMATES Sanitary Sewer Capital Facilities Plan
and Impact Fee Facilities Plan
Capital Improvement Projects
Project #5
Sewer Line from South Bench, Lester Drive Re-Route to CWSID Trunk Line via 7240 S
Description Unit Price Total Price
Mobilization/demobilization 1 ls 50,000$ 50,000$ - -$ 1 50,000$ - -$
Install 12" sewer line (direct
replacement) 4,510 lf 65 293,150 - - 4,510 293,150 - -
Install 12" sewer line 420 lf 75 31,500 - - 420 31,500 - -
Install 10" sewer line 1,300 lf 70 91,000 - - 1,300 91,000 - -
Install 8" sewer line (down from
bench) 1,200 lf 100 120,000 - - 1,200 120,000 - -
Instal 8" sewer line by bore under
canal 100 lf 200 20,000 - - 100 20,000 - -
Install 5' manhole 17 ea 7,500 127,500 - - 17 127,500 - -
Install 4' manhole 10 ea 6,000 60,000 - - 10 60,000 - -
Reconnect 4" service lateral 25 ea 800 20,000 - - 25 20,000 - -
Perform City asphalt repair 3,330 lf 20 66,600 - - 3,330 66,600 - -
Perform UDOT asphalt repair 600 lf 45 27,000 - - 600 27,000 - -
Perform trench repair,
unimproved 2,300 lf 10 23,000 - - 2,300 23,000 - -
Perform by-pass pumping 1 ls 15,000 15,000 - - 1 15,000 - -
Perform dewatering 1 ls 15,000 15,000 - - 1 15,000 - -
Subtotal 959,750$ -$ 959,750$ -$
Engineering and Construction Management (15%) 144,000 - 144,000 -
Contingency (15%) 144,000 - 144,000 -
TOTAL 1,247,750$ -$ 1,247,750$ -$
Existing Deficiency
(System Improvement)
Future Development
(Impact Fee Eligible) Developer ParticipationQuantity
Page 5 of 5


3

1 Replace trunk line along Old Fort Road and Canyon Dr., to 1475 E
$239,230 2018-2020
2 Replace trunk line along Canyon Dr., 1700 E, & S. Weber Dr., from 1475 E to 1900 E
$258,300 2020-2021
4 Replace trunk line along South Weber Drive from 1900 E to 2100 E
$258,810 2023-2026
5 Sewer line from South Bench, re-route Lester Dr. to CWSID trunk line via 7240 S
$1,247,750 2023-2026
TOTAL $2,004,090
4

$490.54
$2,394.61
$39.64
$2,924.78


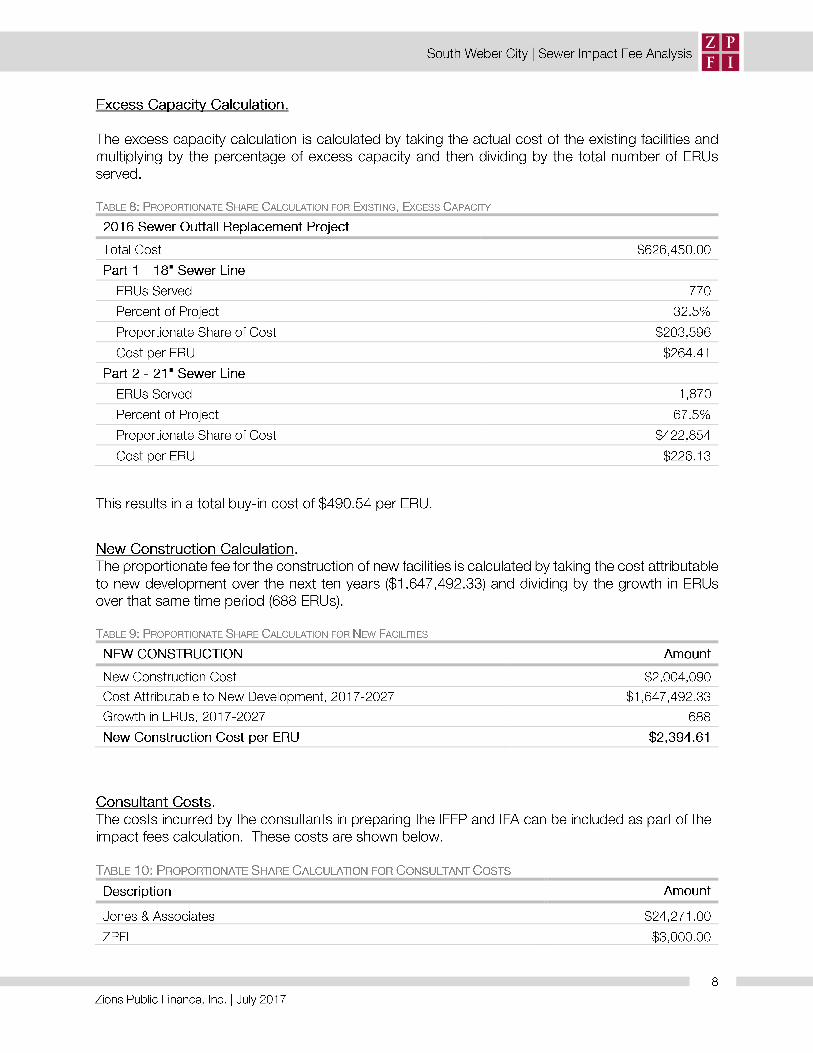


IFFP Intent.pdf - 1/30/17 2:21 PM
Notice Date & Time: 2/7/17 5:00 PM
Description/Agenda:
Pursuant to the requirements of Utah Code Ann. 11-36a-501 and 11-36a-503, notice is hereby given of South Weber City's to contract to prepare or amend Impact Fee Facilities Plans and Impact Fee Written Analysis for culinary water, sewer, storm water, streets, parks and trails, fire, and public safety. The geographical area where the proposed impact fee facilities will be located is the entire City limits.
Notice of Special Accommodations:
N/A
Notice of Electronic or telephone participation:
N/A
Other information:
Location:
1600 E. South Weber Dr., South Weber, 84405
Contact information:
Tom Smith, [email protected], 8014793177