sanger - larry cuban on school reform and classroom practice
TRANSCRIPT

Turning Around a High-Poverty School District: Learning from Sanger Unified’s Success
An external evaluation commissioned by S. H. Cowell Foundation
Jane L. David Bay Area Research Group
Joan E. Talbert
Stanford University
November 2010
Acknowledgments
Our three-year evaluation of Sanger Unified School District’s reforms is supported by S. H. Cowell Foundation and carried out with the full cooperation of Sanger Unified. We thank Marc Johnson, Rich Smith, and Steve Carlson for supporting our research in the district and for generously sharing their time and their reflections on the history of reform. We are indebted to the many district administrators as well as principals, staff and teachers of all Sanger schools for the time and thought they devote to our interviews and surveys. We are also grateful to Kenji Hakuta and Karen Thompson for preparing, analyzing, and graphing the student outcome data reported here and to Ken Doane for his thoughtful guidance and feedback.
About the Authors
Jane David and Joan Talbert have been studying school and district reform
initiatives over the past three decades with a particular focus on uses of evidence, learning communities, capacity building, and organizational change. Separately and together they have studied reform in dozens of school districts across the country, large and small, urban and rural. David’s recent book (with Larry Cuban) is Cutting Through the Hype: The Essential Guide to School Reform (Harvard Education Press, 2010). Talbert’s latest book (with Milbrey McLaughlin) is Building School-Based Teacher Learning Communities: Professional Strategies to Improve Student Achievement (Teachers College Press, 2006).

ii
Table of Contents
Introduction 1
Evidence of Sanger’s Success 3
Sanger’s Approach to Reform 7
Creating a Collaborative Culture 15
Building a Framework for Instruction 27
Using Accountability Constructively 37
Learning from Sanger 44
Appendix
Sanger School Demographics 2009
Student Achievement Data Graphs
Technical Notes on Data Analysis
Sanger Summit Instructions 2009-10
Figures
Figure 1. Percent of Sanger Students Proficient or Above on California Standards Test Compared to State 2004-2009 4
Figure 2. Percent of Sanger English Learners (ELs) Proficient or Above on California Standards Test Compared to State 2004-2009 5
Figure 3. Sanger Growth on Academic Performance Index (API) Compared to State 2005-2010 6
Figure 4. Sanger District Reform Model: Guiding Principles and Core Strategies 11
Figure 5. “Below the Green Line” in the Context of PLCs 16
Figure 6. Response to Intervention 30

iii
1
Turning Around a High-Poverty School District:
Learning from Sanger Unified’s Success
Introduction It is unusual to walk through classrooms in a high-poverty school and find all
students engaged in lessons and teachers unruffled by unexpected visitors. In Sanger, California, a district serving overwhelmingly poor and minority students, this experience is the rule, not the exception. Sanger’s test score gains, which have surpassed average state gains each year over the past six years, reflect this districtwide focus on learning.
The Sanger Unified School District lies in the middle of California’s Central
Valley where the child poverty rate is two to three times the national average. Here families have been locked in a cycle of poor educational outcomes and poverty for decades. Sanger Unified has 19 schools serving 10,500 students including three district-sponsored charter schools, a community day school, and an adult school. Like other Central Valley school districts, Sanger Unified is challenged to educate students from families with limited educational backgrounds, many of whom do not speak English. Eighty percent of district students are poor, 80 percent are minority, and over one fourth are English learners.
In 2004, Sanger Unified was named one of the 98 lowest performing districts in the state with seven schools, and the district, declared in need of improvement (Program Improvement or PI) under federal law. Program Improvement can be a life sentence for districts like Sanger, especially with increasingly higher thresholds for moving out of PI and ever shrinking resources. In Sanger, however, all seven schools moved out of Program Improvement within five years. Moreover, four of these went on to achieve State Distinguished Schools status. By the end of the 2008-09 school year, all but one of Sanger’s 13 elementary schools reached the state target of 800 on the Academic Performance Index,1
with the middle and high schools close behind.
With funding from S. H. Cowell Foundation in San Francisco, we were invited to investigate Sanger’s successes and document the path that led them from dire straits to one of the most talked about districts in the state. Well over a hundred districts have visited Sanger seeking their secret to success. Although we are only two years into a three-year evaluation, the great interest from others to learn from Sanger led us to prepare a report that aims to tell the story of what Sanger has accomplished, what they did, and how they went about doing it. We will update this report with additional data and interpretations in fall 2011.
1 The Academic Performance Index (API) is California’s annual measure of performance of schools and districts on state tests.

2
Sanger’s story is far from typical in the world of education reform. Observers will not find a magic bullet or even a recipe. In striking contrast to typical district improvement efforts that combine an array of ‘evidence-based’ programs and initiatives, Sanger demonstrates the payoff that comes from sustaining a singular focus on student learning and nurturing the implementation of a small number of keystone practices over many years. The district’s approach embodies respect for teachers and school leaders and a commitment to investments in their continual learning. Sanger’s story also exemplifies the use of evidence, from data and from experience, to ground decisions inside classrooms and beyond. Because Sanger’s leaders believe in the power of evidence to guide new directions, the evolution of their reforms do not follow a linear path. Instead it is a story of many moving parts and interconnections. As we write, adjustments are being made as new evidence suggests what is and is not working well. We try to give a sense of the main elements and how they came to be, from intended shifts in district culture—in the central office and schools—to a sustained focus on a coherent agenda. Data sources
Our report is based on data collected from fall 2008 through summer 2010. These
data include one or more interviews with school-level staff including: 8 principals, 45 elementary, middle, and high school teachers, and 6 Curriculum Service Providers. We also interviewed 8 district administrators, several multiple times, as well as the School Board president and teacher union president. We administered an online survey to all teachers in spring 2009. We conducted brief observations of classrooms in eight schools and observed a range of key events including: Principal Summits, professional development sessions, district site visits to schools, AGB (alternative governance board) meetings, and ALT (academic leadership team) meetings. We also reviewed a broad range of documents from the district office and individual schools, including the Principal Summit presentations from all Sanger schools. These strands of data collection will continue through the 2010-2011 school year and expand to include the role of parents and the broader community. The achievement data we report is based on our independent analysis of a Sanger’s individual student scores combined with additional district and state sources. For the third year report, we will continue interviews with school and district staff and expand to include parents and the broader community. In addition, we will repeat our teacher survey in spring 2011 and add a survey of all principals. We will also update achievement data with 2010 test scores for the final report. Organization of the report The next section presents highlights of Sanger’s state achievement data documenting their rapid turnaround and continuous improvement. The third section

3
provides an overview of Sanger’s approach to reform including underlying beliefs and principles, core reforms, and strategies for system change. The next three sections describe and analyze the three major reform pillars in Sanger’s work: Creating a Collaborative Culture, Building a Framework for Instruction, and Using Accountability Constructively. In each of these sections, we describe what Sanger leaders chose to do and why, how they led the process of districtwide change, how teachers and principals responded, and what it might take to sustain the work. The final section pulls together the key themes of Sanger’s approach to reform and its implications for other districts.
Evidence of Sanger’s Success
Sanger Unified has attracted attention across the state for its unusually strong track record in continually increasing achievement levels of all its students. It has demonstrated its ability to increase achievement overall year after year, at rates exceeding average state gains. It has also ‘graduated’ all of schools labeled as failing (Program Improvement) by the state over a short period of time. Moreover, the district, also designated as a failing district, has now exceeded the state target for its API index as have almost all of its schools.
State test score data demonstrate gains across the board, for all students and for all
subgroups. In each case, whether the evidence is gains in state API scores, increased proportions of students scoring Proficient or Advanced on the California State Test, or accelerated performance of English learners, Sanger’s progress is impressive.
The evidence presented below documents Sanger’s progress since spring 2004 just as the district embarked on a series of reforms intended to accelerate learning for all its students. These data speak for themselves and offer a compelling rationale for studying how Sanger achieved these unusual results. We highlight notable trends here. The graphs referred as well as additional analyses, data sources, and school demographics are presented in the Appendix.
Sanger achieved a rapid turnaround in moving schools out of Program Improvement. All seven Sanger schools that were labeled Program Improvement (PI) by the state in 2004 had exited PI by the end of 2008-09. Four went on to achieve State Distinguished School status. Moreover, students in the PI schools achieved at much greater rates than the state from 2004 to 2009 in ELA (English Language Arts) and Math. (Graphs 1 and 2)
Sanger outperforms the state on gains in percent Proficient or Advanced on the California State Test (CST) for all students from 2004 to 2009. In fact, Sanger’s gains were more than double those of the state. (See Figure 1 next page)
• In ELA, Sanger student scores increased 32 percentage points (from 25% to 57%)
versus 11 points for the state (37% to 48%). (Graph 3)

4
• In Math, Sanger student scores increased 35 percentage points (from 31% to 66%)
versus 14 points for the state (40% to 54%). (Graph 4)
Figure 1
Percent of Sanger Students Proficient or Above on California Standards Test
Compared to State 2004-2009
English Language Arts Mathematics
Sanger outperforms the state on gains in percent Proficient or Advanced on the California State Test (CST) for all student subgroups. Sanger’s gains for each subgroup are roughly double the state’s gains. For each subgroup, Sanger students were below the state average in 2006 and well above in 2009.
English Learners (EL) (See Figure 2): • In ELA, Sanger EL student scores increased 29 percentage points (from 12% to
41%) versus 15 points for the state (18% to 33%) from 2004 to 2009. (Graph 5)

5
• In Math, Sanger EL student scores increased 39 percentage points (from 20% to
59%) versus 16 points for the state (27% to 43%) from 2004 to 2009. (Graph 5)
Figure 2
Percent of Sanger English Learners (ELs) Proficient or Above on California Standards Test Compared to State 2004-2009
Socio-economically Disadvantaged (SED): • In ELA, Sanger SED student scores increased 32 percentage points (from 18% to
50%) versus 16 points for the state (22% to 38%) from 2004 to 2009. (Graph 6)
• In Math, Sanger SED student scores increased 38 percentage points (from 24% to 62%) versus 16 points for the state (28% to 44%) from 2004 to 2009. (Graph 6)

6
Students with Disabilities (SWD): • In ELA, Sanger SWD student scores increased 28 percentage points (from 7% to
35%) versus 15 points for the state (15% to 30%) from 2004 to 2009. (Graph 7)
• In Math, Sanger SWD student scores increased 36 percentage points (from 12% to 48%) versus 15 points for the state (17% to 32%) from 2004 to 2009. (Graph 7)
Hispanic Students • In ELA, Sanger Hispanic student scores increased 31 percentage points (from
20% to 51%) versus 17 points for the state (22% to 39%) from 2004 to 2009. • In Math, Sanger Hispanic student scores increased 36 percentage points (from
25% to 61%) versus 17 points for the state (27% to 44%) from 2004 to 2009.
At each grade level, trends on Sanger students’ CST scale scores show steady gains for all students and for English learners in both ELA and Math. Sanger CST scale scores began below the state average in 2004 and exceeded the state in 2009 in each grade 2-9 for ELA and Math. (Graphs 8 and 9). English learners began below the state average in 2004 and exceeded the state in 2009 in each grade 2-9. (Graphs 10 and 11)
At each grade level the gap is closing between Sanger English Learners (EL) and English Only (EO) students. The difference in scores between ELs and EOs in Sanger is smaller in 2009 than in 2004. Sanger ELs are gaining more than ELs statewide and, in some grades, especially in math, Sanger ELs have passed the statewide average for EOs. (Graph 12)
Sanger high school students are passing the state graduation exam (CAHSEE) at
increasing rates. Sanger High School’s 10th grade passing rate in ELA increased from 72 percent in 2004 to 84 in 2010 (compared to 81 percent in 2010 statewide). In math, the passing rate at Sanger High increased from 74 percent in 2004 to 84 percent in 2010 (compared to 81 percent statewide).
Sanger’s performance on the state’s Academic Performance Index (API) has soared. Sanger’s API grew from 657 in 2004 to 805 in 2010, compared to the statewide API which grew from 709 in 2005 (no statewide score for 2004) to 767 in 2010. (See Figure 3.) By 2009 all but one of Sanger’s elementary schools had already reached the state target and the three schools that had not met the target (one elementary, middle, and high school) were closing in on 800 (the lowest 746).
A majority of Sanger’s schools achieved the highest possible ranking in
comparison to 100 similar schools. Nine of 15 schools received a score of 10 in the state’s similar schools ranking; the lowest score was 7 obtained by the high school.

7
Figure 3
Sanger Growth on Academic Performance Index (API) Compared to State 2005-2010*
* State API scores are not currently reported prior to 2005.
Sanger’s Approach to Reform
Superintendent Marc Johnson describes his job as “leading the learning, not managing the program.” This seemingly simple phrase captures how Sanger Unified has approached the challenge of improving the performance of all schools and students and stands in sharp contrast to more typical reforms centered on adopting new programs and “best practices.”
Superintendent Johnson clearly states the district’s mission: “To have every child reach their potential.” Sanger’s overarching approach to system reform has been to create a districtwide culture and common language that focuses attention and resources on student learning and on adult learning in support of that goal.
Johnson points to three “guiding principles”: “Hope is not a strategy,” “Don’t
blame the kids,” and “It’s about student learning.” Such slogans might be found in other
500
550
600
650
700
750
800
850
2004 2005 2006 2007 2008 2009 2010
SangerState

8
districts but few back them up with action. Sanger has translated these guiding principles into action by selecting and sustaining a small number of carefully chosen strategies that consistently focus adults on improving student learning and that reinforce each other: collaboration on data use, direct instruction, and interventions.
The impetus for reform began with the district’s dismal student performance
prior to 2002 when Marc Johnson became superintendent and peaked in 2004 when Sanger Unified and seven of its schools were designated as Program Improvement (PI) by the state. Superintendent Johnson and Deputy Superintendent Rich Smith, recruited in 2004, used the state accountability pressure and threat to leverage support and build momentum for district reform.
Sanger’s approach to reform tackled both cultural change and instructional change
from the beginning. Superintendent Johnson saw his role as shifting the attention of all educators in the district away from adult needs to student needs. He became the district’s inspirational leader who tells stories and uses slogans that capture and reinforce the mission of having every child reach their potential. He uses the power of conversation to communicate a constant focus on students, respect for teachers, and trust in all Sanger employees. For example, he starts every year with a keynote (in contrast to many districts that bring in guest speakers) to “set the tone and remind ourselves of our mission.”
Superintendent Johnson visits every teacher’s classroom twice a year and, in the
process, has shifted expectations from fear and anxiety to welcoming. “Regular classroom visits became one way I can reassure them [teachers] that ‘I am here to support you.’ They also became a way to reinforce the theme for the year. So, on the first visit I hand out a pin with a card and thank them for the difference they have made.” For example, one year the theme was: “Together we can.” Each teacher received a pin picturing giant sequoias with a note that explains how the trees can reach such heights in spite of their very shallow roots: each tree’s roots are interwoven with those of others so in groups they are strong while one standing alone is at risk of toppling.
Similarly, Superintendent Johnson has used the power of conversation to gain
union support for the district reform efforts. He describes getting the union on board early in his tenure through ongoing conversation with the bargaining unit. He believes most problems can be solved by advance communication and now has the full support of union leadership as well as rank and file.
Inspirational rhetoric and ongoing conversations are only a starting place in
Sanger. District leaders take seriously that “hope is not a strategy” and have invested in explicit strategies to continuously improve achievement of all students. The strategies are carefully chosen to complement each other and are anchored in a set of guiding principles that have emerged from district leaders study of reforms and system change and their own experiences.

9
Guiding beliefs and principles for strategic choices
“It’s about student learning” is far more than a phrase tossed around in Sanger. It
represents a conscious shift in district culture from one that focuses on adult needs – and notions of “teacher quality”— to one that focuses on student needs and performance. Sanger’s reform is driven by the goal of dramatically increasing student learning and closing achievement gaps, especially between English learners and their English speaking peers. All actions are expected to lead to improvements in student achievement.
Similarly, the mantras “Together we can” and “I can… we will!” translate into
specific actions that motivate camaraderie and teamwork among district leaders, teachers, and staff. From teacher professional learning communities in schools to district leadership teams, collaboration and transparency are expectations for all and create a climate of collective responsibility for student learning. The principle of collaboration shifts emphasis from individual adult skills to pooling expertise and resources to create capacity bigger than the sum of isolated individuals.
Sanger leaders strongly believe that school administrators and staff must be
“learning” leaders for their teachers and students—“leading the learning, not managing the program.” They see investments in strengthening site-based leadership as the key to moving and sustaining their reform agenda. District leaders encourage leadership that reveals and tackles problems instead of hiding them. School leadership teams carry and support district reforms, lead site adaptations, and develop a district pipeline of prospective administrators. As Superintendent Johnson explained: “We were hiring leadership from outside the district but realized that all the systems and practices we were putting in place would very quickly make it hard for someone to come in from outside.” To lead the learning of teachers or principals in Sanger requires leaders who understand their culture, beliefs, and the way they work.
“Hope is not a strategy” captures Sanger leaders’ emphasis on the importance of making decisions based on evidence. At all levels of the system, administrators and teachers are expected to based decisions on data and be able to demonstrate this. From teachers’ ongoing reviews of student progress to principals’ annual presentations of student performance data to district leaders, grounding decisions in evidence of student learning is paramount. This expectation challenges “hit or miss” approaches to decision-making at all levels of the system and supports collaboration on using data to define and address challenges for improvement. Reliance on evidence also led to instituting quarterly district assessments to enable tracking progress more closely.
Sanger district leaders promote reciprocal accountability in their communications and actions with schools. All adults in Sanger expect to be held accountable for student achievement results and, at the same time, hold their superiors accountable for providing the support they need. Across the country, Sanger is a rarity in putting the idea of mutual accountability into practice. District administrators have chosen a small set of core reform strategies that they believe will ensure the success of teacher teams and schools

10
and that they expect to see in all schools. At the same time, they provide training repeatedly not only for teachers but also for all school leaders including principals, assistant principals, and curriculum support providers at every school. They also customize support to each school site according to ongoing evidence of the challenges they face in improving student achievement.
None of these elements --from collaboration to basing decisions on data-- is
unique, but rarely are they found working synergistically in one district over many years.
Specific choices for reform initiatives Sanger leaders’ choices about particular reform strategies were grounded in the
beliefs captured in their principles. They focused on a few specific reform strategies that together pursue these principles for system improvement and that work synergistically to continuously improve student learning and they chose providers of training who had strong reputations. They adopted the DuFour’s model of teacher professional learning communities (PLCs) as the vehicle for teachers to work collaboratively to improve student achievement and develop a sense of collective responsibility. They chose a model of direct instruction, Explicit Direct Instruction (EDI), with structures designed to help low-performing and language minority students work on grade-level standards with frequent checking for understanding. To support students struggling at grade level, district leaders designed their own version of Response to Intervention (RTI), creating both in-class intervention and a range of intervention classes to meet the specific needs of students at risk of falling behind. To provide added help to English learners, the district expanded its emphasis on English language development (ELD).
The multiple ways in which these initiatives fit together is critical and not by
accident. Each was chosen at a different time but foremost in the minds of district leaders were the ways they fit together. For example, in their PLCs teachers work on principles embodied in EDI, and EDI’s emphasis on explicit learning objectives and checks for understanding provide grist for PLC meetings. Similarly, RTI provides a way of thinking about and structuring interventions for struggling students.
Anticipating how a new initiative will fit with existing practices is another Sanger
approach that runs counter to most district or school reform efforts. It is not only a matter of worrying about the time and energy of staff to take on something new but the coherence of the entire enterprise. If a new initiative does not mesh with existing practices, Sanger leaders see that both the new and the old will suffer.
Figure 4 portrays Sanger’s vision for shifts in district culture that ground reform choices.

11
Figure 4
Sanger District Reform Model: Guiding Principles and Core Strategies
Shift from focus on adults to focus on students - Common Language - Common expectations - Systemwide focus on student data
Shift from individual to collective responsibility - Professional learning communities -School leadership teams - Attention to relationships
Shift from mandated programs and textbooks to student-focused instruction - Direct instruction at grade level - Ongoing checking for understanding - Interventions by need
Shift from hit or miss to data-based decision making - Accountability for evidence use by principals and teachers
Training, tools, and support for principals and teachers on all reform strategies
Continuous improvement of student achievement and
gap closing
Cycles of inquiry and continuous adaptation at all levels
Weaning from external providers
Shift from principals as managers to leaders of learning - Leaders of teacher learning - Developers of school leaders

12
Leading change in district culture How Sanger administrators and staff brought about system culture change is as important as the vision for reform and designs for practice they embraced. Several big ideas have guided district leaders’ decisions over the course of their reform journey. These include emphasizing clear and frequent communication, deciding what is “tight” and “loose” in district policy, creating demand for new initiatives, and finding balance between pressure and support over time and across schools. As described above, Superintendent Johnson has communicated the district reform mission and principles frequently and consistently over the years. His role is key to inspiring a vision and making meaning of reform that takes “Every child, every day, whatever it takes” as its bottom line. It also sets a tone that encourages clear communication from the district office reinforcing the value they place on transparency. Developing a tight-loose strategy for district policy has been critical to managing change from the top. From early on in their reform journey, Sanger administrators communicated to schools what was non-negotiable in the district reform agenda and what was open to school autonomy. Superintendent Johnson defined “tight-loose” succinctly along with its rationale:
There are certain things that are non-negotiables. We say what we expect but we most generally will not say how. For example, establishing robust systems of interventions. If we handed intervention systems to schools and some were not successful, they would say ‘we could have told you it wouldn’t work here.’ So we give them the task of building the support for students and they own it. It is important to know when to relinquish the control and we do.
Deputy Superintendent Smith elaborated the tight-loose formula in these terms:
Six years ago, when we first became a PI district, we were shocked. Everyone was working hard. There were improvement initiatives happening at all of our schools. But as we became more honest with ourselves we realized that everyone was working in different directions. Our initiatives were without a focus. So one of the first steps we took was to clearly define and simplify our district and school goals. We formalized these goals into published administrative expectations. This provided a target, a direction, for their efforts to improve their schools. We then built a “fence” around each schools’ current starting point and the goals we had defined. This “fence” or parameters defined the foundational district initiatives: EDI, PLCs, ELD, RTI. We told our principals: ‘These are the things we expect you to do at your schools. These are the parameters you will work in to meet the expectations. How you get from here to there is your business. That’s the autonomy you have to guide your school’
13
Smith went on to describe how this “tight-loose” approach has paid off. “[It] led to ownership, innovation, and significant improvements. The deployment models, the tiered interventions, the formative assessments, the fresh approaches to ELD all have come from the schools’ efforts as they strive to reach the expectations and goals while staying within the ’fence’ that we set.”
When we asked how district leaders respond to push back from teachers about district accountability pressures on their performance, the deputy superintendent pointed to the importance of communicating their expectations clearly and their strongly held view that the district office and the schools “are in this together.”
We matched our high expectations with support, coaching, and resources. We did not play “gotcha” with teachers or principals when results were less what we wanted. We always came back to them and asked how can we help without compromising our beliefs or goals. That does not mean that I did not ask hard questions about what was occurring when things did not go well. But, those hard questions have always been targeted at finding solutions and not assessing blame. I look at the hard questioning as that grain of sand in that clam that creates the pearl. You need a systemic grain of sand that asks how can we get better.
At the same time, district leaders realize that implementing any given reform
strategy is a problem of individual and organizational learning and gear district supports to school readiness. They have regarded school culture change as a gradual, developmental process.
Key is developing an appetite for change among teachers and principals – framing a particular strategy as desirable, rather than a directive from the top. Sanger administrators understand the problem of change as one of developing a demand for knowledge to move the agenda. They make sure that principals and teachers have opportunity to learn about and understand principles underlying core district strategies, and they build policy and practice around school site initiatives that are successful and that provide exemplars. District leaders are clear also about the need to continuously invest in developing professionals’ capacity to meet system improvement standards. They talk about the “Golden Gate model” of professional development where, as the superintendent explains, “You go from one end to the other and then pick up the painting bucket and start at that end and paint again.” His deputy elaborates:
You paint it and repaint it again. And keep painting it. Because each constant layer of painting it, each time you do a staff development, there’s deeper knowledge. So as you finish everybody, you turn around and do everybody again. And you keep going back and forth. And as we did that, as we brought more new people in, we continued to work with the people
14
that had been through before. So now the depth of knowledge began to grow very quickly.
Finally, they continually try to balance district level pressure and support in leading change in schools at different stages of their development of reform capacity. As Deputy Superintendent Smith explained:
I understand level of concern. As expectations and goals rise, the level of concern climbs higher and higher. You want to acknowledge and hold that level of concern high through the use of data and information to the schools. But you must monitor the level. I fully understand that if the level of concern rises too high, a system begins to explode and implode. If the level is not high enough, the system begins to fall off and become complacent. We work to keep the level of concern high without breaking the system.
Sanger’s reform progress is the outcome of district leaders’ strategic choices of initiatives that advance their mission and embody their reform principles. Equally important have been district leaders’ strategic thinking about how to lead system change that respects professionals and builds their capacity while pressing for the best possible outcomes for students, every day. Sanger’s reform designs and practices evolve as new challenges emerge and through learning at all system levels. For example, even with increasing proportions of students reaching grade-level Proficiency, the district recognized the need to up the ante, pressing for higher proportions of students to reach Advanced. Similarly, they continue to seek more effective ways of bolstering the skills of their English learners. These challenges have led to initiating professional development in higher-order literacy skills and building the academic language of English learners.
District administrators and staff continue to learn from schools’ reform practice and from research, and they model this kind of continuous learning for the system. They sustain reform momentum, continuity, and coherence by anchoring their decisions in the core reform values. The processes through which Sanger developed its collaborative culture, implemented its framework for instruction, and engendered mutual accountability illustrate district leaders’ principles for leading system change. We elaborate these processes in the next three sections, aiming to capture the unusual coherence of focus and sustained commitment to the course that has produced Sanger’s strong record of continuous progress.

15
Creating a Collaborative Culture
Working together to continuously improve student achievement – at all levels of the system – is the linchpin to Sanger’s reform strategy. The district’s investment in professional learning communities at all levels of the system integrates several of the districts key reform principles: collaboration, data-driven decision making, and working through relationships to develop commitment and capacity for change. These ideas also ground collaboration within the central office, between district and school staff, and within school leadership teams. “Together we can!” is taken seriously in Sanger. How collaboration became a reform focus District administrators point to their participation in a Spring 2005 conference on PLCs run by Rick and Becky DuFour in Riverside County as the launch of the district’s PLC initiative. On their long drive back to Sanger, Superintendent Johnson and Deputy Superintendent Smith decided to adopt DuFour’s model for teacher collaboration in grade-level and content PLCs. Ultimately they would find that the four questions that guide teacher collaboration in PLCs apply to all their reform work. Evidence and argument presented in the conference had not only convinced them that teacher collaboration in grade level teams could bring about real and continuous improvement in student performance but also that the underlying principles applied throughout the district.
In the Superintendent’s eyes, the four questions designed to ensure student learning and success are key to improvement at all levels of the system:
• What do we want students/teachers/principals/district administrators to learn? • How we will know when they have learned it? • How will we respond if they have not learned it? • How will we respond when learning has already occurred?
Superintendent Johnson saw adult learning communities as the unifying concept for their work: “This is the framework of our work. The pieces that we are trying to do all flow into that.” Teacher professional learning communities improve student achievement by sharing standards and goals for student learning, assessing and examining data on learning outcomes of instruction, and pooling resources to address needs of students who have not met learning standards. The DuFour model offers a set of explicit practices to scaffold the development of collaboration, data-driven decision-making, and mutual accountability for all students’ success. In addition to attending the DuFour conference, Sanger leaders also encountered Steve Zuieback as part of their grant through the Riverside County Achievement Team [RCAT]. Zuieback introduced the Sanger team to systems analysis to support organization culture change. Sanger leaders heard a new perspective on problems and approaches to leading change. In particular, district leaders embraced the Six Circle Lens

16
model Zuieback presented, which emphasizes the critical importance of social trust and relationships in developing motivation and capacity for organizational change. Sanger leaders use the concept “below the green line” to refer to the model’s distinction between these dynamics of change – relationships, communication, identity – as distinct from the strategies, structures, and operations (above the green line of the model) that are the more typical focus of reforms. Figure 5 shows how Sanger translated the model to frame its focus on collaboration and PLCs to create sustainability. In this framework, culture change comes about through action “below the green line,” through professions working together to improve student success. (In the diagram the dotted line is the green line.) These big ideas form Sanger’s implicit theory of change for developing collaboration across the district and teacher PLCs across district schools, while partnerships with outside consultants were pivotal in developing system capacity to enact the theory. A complementary instructional framework emerged around the same time, and was implemented with additional strategies and partnerships, as described in the next section, “Building a Framework for Instruction.”
Figure 5
“Below the Green Line” in the Context of PLCs

17
Developing PLCs at all system levels: Leading and sustaining change Sanger Unified has developed a collaborative system culture over the past five years. It began with typical district conditions of central office department silos, isolated principals and autonomous schools, and teachers on their own behind classroom doors. District leaders worked to develop professional learning communities at each level of the system. They created structures and leadership for new dialogue, data use, mutual accountability, and collaboration to improve student achievement. Central office. When the current district administration began in 2003-04 there were nine central office departments, each run autonomously by a department head under the Superintendent’s supervision. As is often the case in central offices, directors avoided interaction and complained about one another to their superior. With the goal of breaking down the silos and developing cooperative relationships across the departments, the current Deputy Superintendent, hired in June 2004, created a new forum for communication. He described daunting challenges for change:
So we began to hold Ed Services meetings Friday morning with everybody sitting around a table. I’d write the agenda… they wouldn’t have it in advance. And I’d expect them to know everything and be ready to answer any questions I had. We would close each time with each person saying a little bit about what they were doing and working on. Pretty soon there was communication [although] it was horrendous [at first].
As is often the case, SUSD’s district silos contained different educational philosophies and protected themselves from painful confrontations with colleagues. As communication opened up, ideological conflicts surfaced: There was a huge debate over LitCon and DIBELS [assessments]. Special Ed wanted DIBELS. Categorical and Multilinqual/Multicultural wanted LitCon. They had a huge blowout. But we’d stay there an hour or two hours until we hashed everything out. Pretty soon what happened was they began to work together and share resources—or at least discuss. And they actually began to learn where everybody else was and what their projects were, and they began to work together. We had to break down the silos. Middle system. Sanger established several forums for cross-school communication and dialogue between schools and the central office. These include bi-monthly Administrator Leadership Team (ALT) meetings of principals with Superintendent Johnson and/or Deputy Superintendent Smith, annual Principal Summits and Alternative Governance Board (AGB) reviews, monthly Curriculum Support Provider (CSP) meetings, and monthly meetings of Sanger Academic Achievement Leadership Teams (SAALT). In the Fall of 2005, after receiving dismal results from CST Spring assessments, the district launched Principal Summits – a forum for reviewing student outcomes for

18
each school – and monthly AGB reviews in PI schools. Although primarily district accountability mechanisms, these forums also are vehicles for vertical communication and collaboration on school improvement efforts. Initially, the “shared ordeal” of having to present student outcome data to central office administrators brought principals together around the challenge of learning to do the analyses and presentations. Over time district administrators developed a norm of transparency that grounds strategic collaboration between central office staff and schools to improve student achievement. ALT meetings convened bimonthly by Sanger district administrators afford opportunity for dialogue among principals. Although designed mainly for communicating information from district administrators to principals, they also have created a bond among principals. However, according to principal reports, learning communities have evolved informally between principals in similar schools. For example, some principals have developed practices of doing Walkthroughs in each others’ classrooms and sharing observations and thoughts on leading improvement. CSPs, whose role is to provide strategic support to teachers and teacher teams on instructional improvement, constitute a critical “middle system” in Sanger’s reform initiative. The CSPs help support PLCs and instructional improvement in their content area, meeting with and guiding the practice of multiple PLCs. A cross-school PLC of instructional leaders began to emerge through monthly meetings of CSPs with district curriculum staff. When a new approach, the EDI model of direct instruction, was adopted districtwide in 2006, the CSP sessions focused on EDI and Focused Walks designed to identify where teachers needed support. This in turn provided a forum for these teacher leaders to share ideas and learn about ways of giving feedback to their school colleagues. During 2009-10 when the district focused on training teachers in a new writing program, the CSPs shared strategies that had worked in their school. A CSP gave this example of learning from one another: “One meeting we did Walkthroughs, and a CSP talked about how she did a ‘mock’ visit [to teachers’ classrooms] prior to the formal observation from the principal or VP… so that she could give feedback to the teacher ahead of time. Now I do this too.” This CSP also commented that they are learning from one another how to customize their feedback to teachers; some benefit from direct suggestions, others do not. School leadership team. Sanger’s reform strategy included developing school-based leadership teams that span grade levels and content areas. This design for developing teacher leadership was rolled out gradually across district schools as part of an S. H. Cowell Foundation grant that created Sanger Academic Achievement Leadership Teams (SAALT), beginning in four schools in 2007-08, another six schools in 2008-09, and remaining schools in 2009-10. Later renamed leadership teams (LTs), the strategy was initiated as a vehicle for spreading effective practices identified in one school to all schools, from innovative structures for interventions to specific instructional practices.
The elementary and middle school LTs include teacher leaders of each of the grade level PLCs, the CSPs, and school administrators; the high school LT includes the

19
four APs and CSPs. With monthly meetings that include training and exchange of ideas, this structure enabled the development of a professional community across schools with both administrators and teachers. The school leadership team teachers were expected to lead their PLC’s training in the core district reform initiatives – namely PLCs, EDI, and RTI. These teacher leaders would be the carriers of the reforms and trainers of teachers, in collaboration with the content CSPs and administrators. As such, Sanger schools’ LTs have become vehicles for developing PLC leaders’ leadership skills, building a broad cadre of school reform leaders, and growing a pipeline of system leaders who can move into administrator positions. Developing teacher PLCs across the district Sanger teachers came to understand the PLC vision and to develop collaborative practices with their colleagues over a period of several years. Between Spring 2005 and Fall 2010, the district sent all principals, APs, and CSPs to Riverside County for two-day DuFour conferences along with several hundred teachers—400 people in all. The big push for PLCs came in 2006-07 after principals and teacher leaders had been to the DuFour training and the district required that all schools create teacher teams that use the model to continuously improve student achievement. Developing a vision and ownership. Over time a critical mass of teachers came to share a vision and appetite for PLCs. Although teacher PLCs vary in the strength and effectiveness of their collaborative practice – across grade-levels in each elementary school and across grade-level subject or course groups in the middle school and high school – most teachers can articulate the purpose and benefits of PLCs. As examples:
It’s how we get ourselves better, how we get the kids better. If our teachers can get together and make it better and feed off each other it only will help the kids. It is not about who is a better teacher or who has better scores. It’s about the kids. Learning from people who are math majors or bring different experiences in life, it has made me a better teacher. Everyone is willing to show and absorb. (High school teacher)
Teaching has long been known to be isolated profession. [It] used to be just my kids. Now I am responsible for all the second grade kids. All 80 are mine. They move into intervention. And when we work in our PLCs, it is nothing about complaining, it is about this is my RSP student but look how he outperformed my EO students. We talk about what we are seeing. We share info. So that has been eye opening to have three other sets of eyes telling me what they see. ‘Oh I see your EI student is doing better than mine.’ PLCs have just changed the way that we do things. (Elementary teacher).

20
Teacher leaders point to the DuFours’ training as grounding their vision for PLC practice. In our survey, the DuFour Conference is rated highest among twelve different kinds of district professional development included in the survey; of the 28 percent of teachers who had participated, 95 percent rate it as valuable, with the vast majority rating it as extremely valuable. These data suggest that, by 2008-09, a critical mass of district teachers had become strong proponents of the PLC model and potential leaders of grade-level teams. In describing their PLCs, teacher leaders emphasize key pillars of a) common assessments and data, b) essential standards and lesson plans, and c) teaching or instructional strategies and interventions. Important framing questions are: What do we want students to learn? How will we know when they have learned it?; How will we respond if they have not learned it?; and How will we respond when learning has already occurred? Guidelines for practice feature: a) frequent common assessments of student learning with respect to specific standards being taught, b) review of data by class and individual student to identify patterns and design responses, and c) use data to identify and share effective instructional strategies and interventions. Principals also are well-versed in the DuFour model and strong promoters of the PLC initiative within their schools. In our 2009 survey teachers overwhelmingly reported that their site administration supports the development of PLCs (over 90 percent). Within a few years, the district had developed principals’ and teachers’ demand for PLCs as a vehicle for improving student success. District leaders had developed resources and strategies to address the considerable technical, organizational, and cultural challenges entailed in implementing the vision and design for teacher PLCs across district schools. They moved steadily and strategically in establishing system and teachers’ capacity for change. Developing technical capacity. Research on PLC initiatives highlights the importance of teachers’ timely access to formative assessment data and initial support in developing skills in using the data. Sanger’s early adoption of Edusoft and related professional development in its use established capacity for teachers to develop and score common assessments quickly. As a high school teacher described the district rollout of its PLC initiative: “It’s a process. They’ve been building it. PLC started as a buzz word – a glorified department meeting. This changed once they introduced Edusoft. Within the last two years we’ve figured out how to make it work. We’re analyzing tests to determine effective tasks to engage student learning.” Edusoft is a core technology for Sanger’s PLC initiative. Principals, APs and CSPs were provided Edusoft training and, as with all facets of the reform, were expected and supported to train their staff and PLCs in using it. Schools differ in their design for who is responsible for summarizing the data. For example, CSPs in the high school typically do data preparation for their PLCs, while PLC lead teachers are responsible for brining their data to team meetings.

21
Sanger’s First Class system for web-based communication is another technical resource for PLC development and practice. It serves PLCs in at least two ways. It provides a medium through which to communicate administrative matters, thus freeing up teacher meeting time to focus on teaching and learning. Further, it provides a link for each PLC to post instructional resources. For example, some high school PLCs use their portal to post and revise Power Point presentations for their classes and to share other sorts of instructional materials. This resource is especially valuable for high school teachers who are assigned to multiple courses and whose collaboration with colleagues depends upon some level of virtual communication with colleagues. Protocols from DuFours – for example, templates for setting up and analyzing common assessment data for students across classes and worksheet for team self assessments of their PLC practices – help to establish standards and routines for teacher collaboration in teams. A growing body of research points to the importance role that such tools play in developing new professional communities of practice. They focus and establish routines for “joint work” that grounds teacher collaboration and learning. Developing organizational capacity. A common barrier to PLC development is the lack of time for teachers to collaborate within the typical school day and professional contract. In rolling out the reforms, Sanger established a schedule for PLC meetings. At the secondary level, late start days on Wednesday establish a 45 minute period for teacher collaboration that is “sacred.” And many PLCs have created additional formal and informal time for PLC collaboration. At the elementary level, PLCs meet on average 90 minutes per week, including 2 hours on minimum days (Wednesdays). Skilled PLC facilitators also are critical system capacity for PLC development – for creating agenda, keeping meetings focused, and supporting teacher culture shifts toward collaboration and data-based decision making. Over recent years, Sanger has systematically developed teacher leadership for collaborative practice. Beyond their participation in DuFour sessions, the CSPs and PLC lead teachers have been involved in Edusoft and EDI training. Perhaps most important in terms of leading system change, some teacher leaders have developed networks and learning communities and have taken on some of the identity of district leaders. One CSP explained to us: “The district is committed to grow its own administrators and build teachers’ leadership capacity.” Another CSP, however, rued that using the CSP position as a stepping stone to administrative positions increases turnover and therefore loses training and experience in coaching teachers effectively. Sanger has invested heavily and strategically in developing professional and social-network capacities for change. Developing capacity for cultural change. PLCs challenge privacy norms in teaching, and the DuFour model specifically calls on teachers to use common assessments and share data on their students’ mastery of instructional content. Teachers are expected to open their practice and results to colleagues. Strong leadership at all levels of the system is critical to making it safe and productive for teachers to so intimately share their practice. District PLC initiatives generally fall short of achieving

22
broad change toward a collaborative teaching culture because they do not address traditional values and norms of autonomy and privacy. Sanger Unified has embraced challenges for culture change from the start. Key was developing a critical mass of teacher leaders steeped in the DuFour model and involving principals in learning all facets of the reform. District leaders also recruited new teachers who were committed to working collaboratively. In fact, principals now consult PLCs when filling teacher positions. Central too has been the district administrators’ continual communication of core principles for system improvement and relentlessly shifting teachers’ focus toward student learning and collective accountability for their success. This entailed shifting administrator evaluations away from generic or content-specific notions of teacher “quality” toward a) criteria of teacher PLC quality, b) classroom practices focused on checking for student understanding, and c) student learning outcomes at grade level in specific content areas. Although consistent with current national press toward outcome-based teacher evaluations, Sanger’s approach has been to build teacher teams’ capacity and accountability for improving student achievement. This shift in evaluation criteria toward teachers’ mutual accountability for student success makes it safe for teachers to open up their practice to colleagues, since all will be judged by their collective success with their students. Many teachers we interviewed told us about the shift in culture they experienced over recent years. As two middle schools teachers put it: “During the first year, there was not necessarily resistance, but people were unsure. Now we really want PLC time. “PLC… shifted the focus away from me closing the door on my classroom to looking at the kids. We’re not being ‘thrown under the bus.’ We have lots on new teachers and they don’t want to be thrown under the bus.” District and school leaders have framed the shift toward PLCs in terms of “empowering teachers to look at data to make decisions.” This is a compelling message for bringing about a new conception of professionalism as data-based decision making with colleagues teaching the same content to students in a school. How teacher PLCs work to improve student learning Sanger teachers are enthusiastic about their professional learning communities. In fact, almost all have come to believe their PLCs are critical to their school’s success. Still, PLCs take time to evolve and some are farther along than others on team functioning, routines for data use, and creating instructional responses to student learning needs. Our Spring 2009 teacher survey and interviews with teacher leaders across district schools shed light on overall trends and on the nature of PLC practice.

23
PLC functioning. Overall, teachers report that their PLCs are doing quite well on indicators of commitment to collaboration. After about three years into the initiative, over 80 percent rated their PLC as “advanced” in terms of interacting with mutual respect, understanding and agreeing on PLC goals, and sharing ownership of their students’ learning.
Any attendance issues have been resolved, for the most part: over 90 percent of district teachers rated their PLC as somewhat advanced or advanced on full attendance at meetings. Frequency and duration of meetings vary both across and within schools. For example, the average amount of PLC meeting time per week in elementary schools is 85 minutes and ranges from below 30 to over 165 minutes. Most are in the 1-2 hour range per week. In interviews we learned that these responses likely underestimate the time some PLCs spend working together. For example, a majority of teachers interviewed noted that their PLC officially meets every two weeks on minimum days but the same teachers regularly meet once or twice a week for an hour or more. Some PLCs meet daily during their lunch periods.
As is typically the case, PLCs at the secondary level tend to be larger than those
in elementary schools, with 7-8 teachers in grade-level teams of core subjects. In grades K-5, nearly all PLCs have 2-4 teachers. In interviews some teachers noted that the small size can be limiting. One pointed to the need for more sources of knowledge: “I’m the leader and I don’t know everything.” In other cases, teachers pointed to the difficulty of formal facilitation with two people.
Developmental trajectories of PLCs differ within schools. One CSP described her
efforts to bring along the struggling grade-level teams: Certain grade levels are talking about student learning and teaching strategies. Some are scratching the surface. I’m coaching one grade level and trying to help them with conversations. One PLC is organized and one isn’t. We gave them time to plan—one whole release day. Now they are functioning.
Over time, with CSP support and ongoing professional development and networking among PLC lead teachers – in school-based LTs and cross-school forums – growing proportions of PLCs have become high-functioning, collaborative teams. Using assessment data to focus improvement efforts. Teachers’ reports of their knowledge and practices provide evidence that PLCs are being implemented across district schools and teacher teams within them. In Spring 2009, over 90 percent of district teachers indicated that they understand Essential Standards for their grade level and closely monitor student understanding. This knowledge is critical grounding for PLC practices of developing common assessments and using data to ensure all students’ success. Notably, over 90 percent report also that students know what they are expected to learn, suggesting that teachers translate standards into classroom instructional objectives on a daily basis.

24
In responding to questions about their PLC practices, teachers gave high ratings to
items measuring data-based decision making. Over 80 percent judged their PLCs to be somewhat advanced or advanced on: developing shared understandings of the Essential Standards, creating common assessments, and using student assessment data to identify areas for improvement.
In interviews teachers described how they collaborate to assess student learning to
ensure that no students fail to meet standards. An elementary school teacher told us: Now we have SMART goals.2
My partner and I have weekly standards to go through. We have an assessment…we have to hit 75% proficient or advanced. Those students who didn’t hit it are on a list. When we get together on Wednesday we figure out what to do for those kids.
A high school teacher described the development of her PLC’s data use practices:
Last year we used all common assessments, scanned into Edusoft and looked at written problems. We found that kids didn’t know some of what they should. Quadrilateral is algebraically demanding and that’s where we struggled. Now we compare data and ask ‘how is your class doing better?’ We talk about how I/someone taught this method that worked best. [Explains that his kids did better on quadrilateral and he used a method other than the book.] When we discussed the data, they asked me to explain my method and why it’s better than the book’s and now they all use it and call it “[teacher’s name] way.”
Creating instructional responses to student learning needs. As illustrated, teachers use evidence from their comparative class analysis of student performance on unit assessments to identify effective teaching practices. This is the DuFour model of instructional improvement – evidence of effective practice drives change. Sanger teachers report that their teams are quite accomplished in developing shared instructional strategies and designing interventions for students not meeting standards. Over 80 percent of district teachers rated their PLC as somewhat advanced or advanced on identifying ways to improve instruction and learning effective teaching strategies from one another. One teacher described changes in her team’s dialogue toward examining one another’s strategies and developing common teacher practice around a standard.
There were some PLCs when I started here but more on superficial things like fundraisers. Now they are very standards and assessment driven. Before it was ‘here’s how I teach graphing’ and now a discussion about how everyone does it and explain why you do things and what makes sense. It forces you to reflect and
2 SMART goals stand for: Specific, Measurable, Achievable, Relevant, Time-bound goals for student learning that teachers focus teachers’ instruction and common assessments.
25
that is most important whether or not you agree on the same teaching practice at the end. PLC lead teachers facilitate this shift in collegial interaction, and often a CSP coaches and supports more advanced instructional sharing and collaboration. For example, one CSP described how she organized PLC teachers to observe each others’ classrooms, focusing on a particular element such as checking for understanding which she said “has opened a lot of doors to discussion and professional learning.”
However, the overall trends in developing shared instructional practices mask a consistent difference between elementary and secondary teachers in the extent to which their PLCs implement specific district guidelines for practice. These differences are particularly striking for the practices of creating SMART goals (82 percent for elementary and 64 percent of secondary teachers) and developing EDI lessons together (56 percent for elementary and 29 percent for secondary teachers). Interviews also revealed variation in elementary school teachers’ comfort with developing EDI lessons with colleagues, some considering it too time-consuming for PLC meetings. In response, district leaders are considering the option of employing teachers in the summer to develop lessons and free-up PLC time for assessing student learning and designing instructional responses.
Nonetheless, some high school PLCs have developed a practice that follows core
principles for EDI of stating learning objectives for each lesson and checking for understanding during the lesson. A high school PLC lead teacher described how they share practice grounded in EDI principles:
We have a conference on First Class for [course], so I make a PowerPoint and upload it. Someone else might upload a work sheet. Not just someone saying ‘what I did was’… So a lot of us are using the same PowerPoints. We communicate about every part of our curriculum and instruction. [On incorporating EDI]…the way we have implemented is through our PowerPoints, our lectures. We have modified to include EDI. So will have learning objective first, have prior knowledge questions, and then get into content. And the bottom of each slide will have a checking for understanding – and that can be [implemented as] random calling on or pair share… If the creators looked in our class they might see areas we need to improve on… We find that they make our teaching better. Not a lot of resistance in our PLC.
Positive responses from teachers and students suggests that this approach to collaborative instruction may spread across high school PLCs.
Beyond sharing information on instruction and developing a shared repertoire of effective practices, PLCs collaboratively develop interventions for students – and teachers – who fall short of meeting standards in a unit). More than 75 percent of district teachers reported in 2009 that their PLCs are advanced or somewhat advanced on

26
planning interventions together, discussing how to differentiate instruction, and analyzing what happens when new ideas are tried out.
Shared accountability and efficacy. Teachers describe major shifts in their teaching culture through PLC work. Teachers’ comments capture moves toward shared responsibility for all the students in the grade level and collective efficacy through success. For example,
It used to be just my kids, now I am responsible for all the second grade kids. All 80 are mine. They move into interventions . . . and when we work in our PLCs, it is nothing about complaining; it is about ‘this is my RSP student but look how she outperformed my EO students.’ We talk about what we are seeing. We share info. So that has been eye opening to have three other sets of eyes telling me what they see. ‘Oh I see your EI student is doing better than mine.’ PLCs have just changed the way that we do things. Fundamental to continuous improvement of student achievement across Sanger elementary and secondary schools is teachers’ commitment to collaborating with colleagues and belief that together they can make sure that all their students succeed.
* * * * *
Sanger teachers portray their schools as having strong collaborative cultures in which teachers trust one another, provide mutual support, and seek advice from colleagues. Between 78 and 87 percent of district teachers report these conditions – rates considerably higher than those we have found in other district surveys using the same generic measures of teacher collaboration. In part, this reflects the development of teacher PLCs – and the district’s strategic investments in professional development to support implementation. Teachers’ ratings of their PLC practices, coupled with strong consensus that PLCs are critical to their schools success (85 percent agree with this statement), suggest that this approach to creating school cultures that continuously improve student achievement has taken a strong and sustainable hold in Sanger.
Sustaining and Deepening PLCs PLCs became rooted in Sanger’s professional culture because principals and teachers came to understand and believe in the deep principles underlying collaborative work to improve student achievement, as well as the routines for practice. As teachers developed collaborative practices described by the DuFour model and supported by their principal and teacher leaders, they saw the power of PLCs to significantly improve student achievement. They could see that developing specific student learning goals and common assessments and then sharing their expertise in addressing learning gaps was more effective than the sum of isolated individual efforts. Key to developing new collaborative practices in teacher learning teams across all Sanger schools were the investments district leaders made in creating a district PLC

27
culture. Beyond creating a vision and appetite among principals and teachers through annual pilgrimages to DuFour trainings, the district created essential data and communication systems to support the work. It created schedules to ensure dedicated PLC time and provided professional development to teacher leaders charged with facilitating the work of grade-level and content/course teams. And understanding the cultural challenges of developing PLCs, district and school leaders continually communicated the priorities of collaboration and shared accountability and created conditions for trust and risk-taking essential to change and opening practice to colleagues. Deepening and sustaining PLC work at all levels of the system entails continuous building of administrator and teacher leadership committed to the reform strategy and skilled in facilitating PLC practice. Sanger administrators understand that data-based collaboration to continuously improve student achievement is steady work for system leaders at all levels.
Building a Framework for Instruction
Sanger’s quest to increase student achievement and close achievement gaps requires changes in what teachers do in their classrooms. Sanger’s approach to instruction is to hold teachers and principals accountable for student progress and, at the same time, provide teachers with the training, tools, and support they need to accomplish this goal. In contrast to mandating a specific curriculum, Sanger adopted a set of principles that characterize effective instruction for their population of students, most from low-income Spanish-speaking families, and added a sequence of interventions for struggling students.
Sanger’s principles for instruction, adapted from DataWorks Explicit Direct
Instruction (EDI), are consistent with the same four questions that structure PLC work: What do we want students to learn? How we will know when they have learned it? How will we respond if they have not learned it? How will we respond when learning has already occurred? Teachers are expected to implement specific instructional strategies which emphasize clear objectives and frequent checking for understanding with the help of their PLCs, principals, and Curriculum Service Providers (CSPs). The interventions speak directly to the last two questions: how to respond when students have or have not met learning objectives, bringing to life their mantra: “Every child, every day, whatever it takes!” Defining and Implementing Effective Instructional Practices
In parallel with Sanger’s move to focus on professional collaboration grounded in data, the new administration sought an approach to curriculum and instruction consistent with their goal to ensure students are taught grade-level standards. With no uniformity across teachers in choices of textbooks and associated curriculum or expectations for students in 2004, and with seven schools in Program Improvement, district leaders

28
needed a strategy that would unify the district and help teachers bring all students to grade level proficiency and beyond.
District leaders chose an instructional strategy modeled on direct instruction with components well-suited to English learners. Shortly thereafter they learned about Response to Intervention from the Riverside County Office of Education and saw that it could mesh perfectly with the press for teaching at grade level without penalizing students already far behind.3
Implementing principles of direct instruction. Typically, district leaders threatened with state takeover adopt a curriculum districtwide and press for its faithful implementation. Sanger leaders chose a different path. Their first step was to insist that elementary teachers agree on one language arts textbook, even though it was not an official state adoption year. But the next step was not to pressure teachers to implement the new text. Instead, the strategy that evolved began with district insistence that teachers understand and teach to grade-level standards and work from a shared conception of effective teaching. The textbook became one of many resources to draw on.
As with each strand of Sanger’s reform, the choice of a specific approach to instruction grew out of the experiences of those in the district. In this case, one elementary school—the first in Sanger to be labeled Program Improvement by the state—had already experimented with an approach to direct instruction identified by the principal and, subsequently, demonstrated substantial increases in achievement. With training and support in Explicit Direct Instruction (EDI) from DataWorks, the principal and teacher coach at this school taught their staff a specific set of strategies for developing and teaching lessons explicitly designed to help struggling students. One of the poorest schools with half their students classified as English learners, their success helped spur interest in implementing EDI in other schools—another instance of “creating demand.”
Grounded in Madeleine Hunter’s elements of effective lessons,4 the principles embodied in Explicit Direct Instruction (EDI) over time became the district’s de facto definition of effective lessons.5
3 Response to Intervention was included in the 2004 reauthorization of the federal special education law, the Individuals with Disabilities Education Improvement Act.
The approach incorporates clear teaching objectives, teacher-centered instruction, along with guided and independent practice. But what struck the strongest chord with Sanger leaders and teachers was the absolute insistence on teaching grade-level standards and frequent checking for understanding. The argument that Sanger students would never reach or exceed grade-level proficiency if teachers targeted instruction to their existing level of understanding made sense to Sanger educators. Similarly, calling on students randomly rather than the usual suspects (e.g., by
4 Madeleine Hunter’s method, popular in the 1970’s and 80’s, had seven elements: learning objective, standards for performance, anticipatory set, teaching (presenting information, modeling, checking for understanding), guided practice, closure, and independent practice. 5 Sanger’s adaptation of EDI is now referred to as Sanger Unified Direct Instruction (SUDI).

29
drawing students’ names from a cup) and holding up small white boards provided quick and easy ways to gauge understanding across the whole class.
Although Sanger leaders expect all teachers to implement the components of
direct instruction introduced in EDI training, they leave considerable discretion to principals and teachers on how this is carried out. At the same time, the district expects principals to lead and support these changes in instruction and holds them accountable for their school’s progress. As one elementary teacher described her school: “They [school administrators] gave us a year to chew on the whole philosophy. Then they got into details.” In another school, the principal had conversations about EDI with all the grade-level PLCs each of which could then choose which elements they wanted to try out first. Each school’s budget allocation also covers the costs of several support positions, including one or more Curriculum Support Providers and Intervention Teachers at most schools.6
Along with targeting classroom instruction to grade-level standards, however, was the recognition that many if not most students would struggle mightily with grade-level work. This led in turn to districtwide adoption of an intervention strategy based on Response to Intervention (RTI). With origins in special education, RTI defines a Pyramid of Interventions which begins with the classroom teacher and moves to successively more intensive interventions as students’ needs require.
Implementing Response to Interventions. On the heels of adopting EDI, district
leaders faced the need to provide scaffolding and re-teaching for students not able to fully grasp grade-level classroom instruction. For English learners, the need doubles: targeted help both in English language development, including the acquisition of academic language, and specific interventions to meet their English and math learning needs.
When district leaders first learned of Response to Intervention (RTI) and its
Pyramid of Interventions, they immediately saw a good fit with their needs. The philosophy underlying RTI—that the classroom is the first level of intervention—fit well with EDI, with PLCs focus on data that identifies skill weaknesses, and with their fundamental belief that all children should be helped to reach their potential. This stance is in stark contrast to many districts around the country which interpret RTI as a federal mandate and approach it with a compliance mentality. The Pyramid represents three levels or tiers of instructional intervention with the expectations that at least 80 percent of students’ needs will be met in the bottom tier. The broadest tier at the base represents instruction for all students, including classroom instruction and interventions to which students are deployed during the school day. The interventions are targeted to students’ particular level of need ranging from work on particular skills to enrichment activities. The second tier represents instruction targeted to small groups of students during classroom time to provide just-in-time instruction to those needing additional help. The third tier at the top represents more intense individual interventions for those whose needs are not met by Tier 1 or Tier 2 interventions. Figure 6 illustrates the Pyramid and its application both to academics and behavior. 6 Curriculum Support Providers are funded through Title I.

30
Figure 6
Response to Intervention
Academic Systems Behavioral Systems
1-5% 1-5%
5-10% 5-10%
Intensive, Individual InterventionsIndividual StudentsAssessment-basedHigh IntensityOf longer duration
Intensive, Individual InterventionsIndividual StudentsAssessment-basedIntense, durable procedures
Strategic Group InterventionsSome students (at-risk)High efficiencyRapid response
Strategic Group InterventionsSome students (at-risk)High efficiencyRapid response
80-90% 80-90%Universal InterventionsAll studentsPreventive, proactive
Universal InterventionsAll settings, all studentsPreventive, proactive
School-Wide Systems for Student Success
Implementing interventions in the classroom is consistent with EDI’s emphasis on
diagnosing weaknesses through checking for understanding and working with small groups or individual students who have not mastered particular skills or lesson objectives. As one middle school teacher said: “When they go to their independent work, I know exactly which kids to pull. That’s the most powerful part, the checking for understanding.”
Deployment to intervention classes is the second piece and is, by all accounts,
logistically demanding. Yet all schools have some form of intervention for students at risk of failure. These range from classes in middle and high school that allow credit recovery for students who would otherwise not graduate and after-school programs to far more complex arrangements that involve re-sorting all students in a school for part of each day. These schools exemplify the district’s “all hands on deck” philosophy. Like EDI, one school took the lead on implementing interventions and became the beacon for other schools—another example of creating demand.
In elementary schools with schoolwide deployment, every adult in the school is
with a small groups of students for the intervention period. Students are redistributed

31
from their regular classroom based on data from a variety of assessments to groups that use programs designed to bolster specific skills. Students who have mastered the skills received some type of enrichment or reading opportunity such as Accelerated Reader. For example, in one school, students at a grade level are distributed across six teachers instead of the usual two for half an hour every morning in language arts and again in the afternoon for English language development. In another school, students are deployed to interventions in the morning based on their EL level and again in the afternoon to interventions focused on specific concepts as well as more challenging work for top students.
This type of deployment is further complicated by the need for English learners to
have extra support for language development. In most elementary schools, therefore, time is set aside during the day for English language development for these students in addition to their deployment to intervention classes. Sanger leaders are insistent that help with language learning cannot replace help with learning lesson objectives. Those struggling with English need both.
At the middle school level, time is set aside after lunch for all students to go a class called ‘academic seminar’ which ranges from help for students struggling in 7th grade math to an honors debate class. In addition is a separate class for students who are beginner ELs and RSP students called core replacement where the goal is to catch up with regular classroom. Exemplifying the district focus on data, leaders are revisiting this strategy having observed the need for these students to be around those who are performing at higher levels. In addition, both the math and English departments deploy students to interventions during the last period of the day.
The strategy of deploying students during a specified time each day embodies two
fundamental district values. One is that individual teachers are no longer solely responsible for only the students in their classroom. Together with PLCs, the district has witnessed a major culture shift in teachers’ taking collective responsibility for students. It is no longer “my” students and “your” students. An elementary teacher told us: “Schoolwide [there is] a lot of change—seeing the children as our kids instead of my kids. The district has pushed us to see that all the kids belong to us.” Similarly, decisions about which students need which type of intervention are based on evidence. In their PLCs, teachers hone in on assessment data, often combining district assessments and their own common assessments developed in their PLCs (see previous section “Creating a Collaborative Culture”).
In addition to the logistical challenge of reorganizing students several times a
day—more unusual for elementary than secondary schools--is the challenge of managing all the data on students to match them to interventions with flexibility to shift every few weeks. Where this works well, there is usually someone in the school who has a master list of all students and keeps track of their progress on a range of skills in language arts and math. This tracking is possible because teachers enter test results on their computers into progress monitoring sheets. As one CSP described:

32
I help teachers see what to do by helping them analyze data and set up small groups [of students] to meet specific needs or guided reading. . . At the beginning of school I look at a list of classes and see what kid needs. . . I looked for holes for each kid and then looked at programs that could match.
In one school the CSP explained that teachers bought into the idea of doing interventions schoolwide because she assured them that each would need to learn only one program. The students change from one program to another based on their progress but teachers remain with the specific programs they have come to know well. Defining and Implementing Effective Instructional Practices
The roll-out of EDI and RTI exemplify the two-pronged district strategy of increasing accountability and making major investments in training and support.
Supporting teachers to adopt new practices. Teachers are pressed by district and school leaders to implement EDI and are surrounded by opportunities to learn more and get help in the classroom, including repeated districtwide training sessions in direct instruction. Within three years of the district adoption of this approach to teacher-directed instruction, 90 percent of all teachers had participated in some formal training. In addition, all principals attended training consistent with district leadership’s philosophy that principals are key to teachers’ learning about and embracing instructional change. District leaders expected teachers to put their new-found skills into practice but not all at once, given their understanding of the developmental nature of implementing new practices.
The provision of training also followed a developmental path. Initially, principals and teachers attended training sessions off-site led by DataWorks. The next phase involved training by DataWorks at Sanger which made it much easier for larger numbers of teachers to attend. With the need for ongoing training for teachers new to the district and those wanting additional training, the third phase shifted to training provided by Sanger staff with extensive knowledge of and experience in direct instruction.
Key to teachers’ learning more about direct instruction are the PLCs which each
have one person on the School Leadership Team. These leaders attend additional training and share what they have learned with their PLC. In the words of a secondary level teacher:
It’s not like ‘You will do EDI.’ We are shown the importance and reason behind things we are asked to do and they give us training. And then my job is to share with my PLC.” Teachers also learn through working in their PLCs on instruction and creating
lessons based on direct instruction principles. Discussions about why a lesson was or was not successful require closer looks at how EDI is being implemented by different
33
teachers. Well-functioning PLCs become a powerful mechanism for sharing experiences and helping teachers make sense of and adapt new practices. As an elementary teacher said:
At the beginning, [EDI] was very difficult. A whole change in our thinking. But once we got used to it—they didn’t throw us into it—they gave us the training, have had several follow-ups, they come into our classrooms and give us feedback. . . It was hard . . . But with the PLCs, we help each other develop our EDI lessons. Principals play a major role in leading and supporting teachers to implement the
components of EDI. Since its adoption, district leaders have become more directive about ways that principals can do this. For example, the district asked all principals to teach EDI lessons in their schools, building on the success of one principal who took this approach . From the district office perspective, this is intended to promote deeper understanding of EDI and demonstrate commitment to and credibility with teachers. Principals are also asked to do structured walkthroughs in classrooms using one of several forms—or one of their own making—designed to capture implementation of EDI and, importantly, as a basis for providing feedback to teachers. The context is not intended to be “gotcha” but rather a vehicle for helping teachers get better at EDI. A district leadership team also makes periodic visits to every school, focusing on a particular aspect of classroom instruction; their feedback is typically a letter to the principal shared with teachers.
At the school level, principals, and in secondary schools assistant principals as
well, vary in how often they do walkthroughs and in the kinds of feedback they provide to teachers. Not surprisingly, how teachers perceive the walkthroughs also varies across schools. Survey results suggest that, by and large, teachers find their principal’s visits to their rooms and feedback to be helpful and not threatening. However, in several cases, especially when multiple people are doing walkthroughs, teachers expressed concerns about the timing of visits since they are not doing EDI every minute. They also said that they struggle with conflicting feedback from different observers.
Principals, and their assistant principals, carry much of the accountability
responsibility for EDI implementation. The role of the CSP, however, is not to judge progress but rather to identify where help is needed or requested and to provide it. CSPs visit classrooms, sometimes with principals on their walkthroughs, and sometimes on their own. Principals benefit from what they call “partner walks” when they observe with the CSP as a way to improve their own capacity to look at EDI.
Teachers trust and value their CSPs, although their instructional knowledge and
coaching skills vary from one to the next. The strongest CSPs worry about, for example, whether teachers are checking for deep understanding and whether they are moving from guided practice to independent practice. Others might focus on the absence or presence of more superficial activities. Also, CSPs who have training and experience in coaching are better able to communicate suggestions to teachers. On our survey, half the teachers

34
agreed or strongly agreed that their CSP is a key resource for their teaching. Another quarter fell in the middle, neither agreeing nor disagreeing. CSP leadership capacity is an area that Sanger continues to develop, viewing CSPs as potential candidates for administrative leadership positions.
Teachers’ adoption of new practices. To teach standards at grade level, teachers need to know what that means. Sanger’s investment in EDI training helped many teachers, especially elementary teachers, understand the state standards and how to translate them into multiple lesson objectives. “We knew what the standards were but we didn’t really pinpoint and deconstruct the standards. . . how to define it for 7 year olds,” said one elementary teacher.
Studies of instructional reforms typically find that elementary teachers are more likely to embrace new practices than secondary teachers, particularly high school teachers. Sanger is no exception, particularly with an intervention designed initially for elementary teachers. Yet, across all levels of the system teachers value the focus on students and the common vocabulary that permeate the district. Moreover, differences of opinion notwithstanding, almost three-quarters of all teachers surveyed agreed they were committed to EDI. At the same time, 73 percent of elementary teachers agreed that EDI provides an effective structure for all lessons while only 42 percent of secondary teachers agreed.
In our interviews a majority of teachers and principals had positive comments
about EDI. An elementary principal said: We are getting better at EDI. It has been a process. Have a long way to go but I feel it has made an impact. Teachers will tell you that the common assessments and lesson planning is what made the difference. The rigor of the assessments has increased.
Teachers commented in these ways:
[With EDI] I was so focused. I knew exactly what I was going to do. Before I would just go off on tangents. I knew I had to get to the kids who didn’t get it. So I had to be focused. [elementary teacher] The amount of work I put in ahead of time is huge. But the payoff is huge. The kids are engaged. They are constantly doing something on the white board or pair share. [secondary teacher] [EDI] has improved instruction immensely. . . because it is targeted, specific, and checks for understanding . . . each step of the way so you don’t get to the end of the lesson and then see who didn’t get it. [elementary teacher]

35
[EDI] has given us more focus and as a result the kids have more focus. The students know exactly what to expect. They need the consistency. [secondary teacher]
Even teachers with positive reactions expressed some concerns they had with EDI. One elementary teacher noted: “I am so concerned about not birdwalking—EDI says never do this—that I think I miss some teachable moments. And I don’t think everything can be EDI.” At the higher grades especially, teachers were stymied on how to integrate EDI into lessons focused on inquiry such as experiments in science. On our survey, 42 percent of secondary teachers and 24 percent of elementary teachers agreed that higher order thinking and conceptual understanding do not fit well into the EDI lesson structure. Much of the variation we encountered across teachers appeared related to their perceptions of pressure to adhere to a regimented approach and their understanding of the underlying principles versus those who interpreted more flexibility. Teachers who viewed EDI as adaptable, with essential elements that all need to be included in some ways, communicated less resistance. For example, one elementary teacher said:
For me personally being a veteran teacher, it helped me focus on my instruction. Common sense teaching. It’s the way we have always taught but given a structure. . . [It’s] made a tremendous difference.
Depth of understanding by principals, assistant principals, CSPs, or colleagues in PLCs can have a strong influence on how teachers incorporate EDI practices. Pressing for rigor initially without deep understanding can undermine the goal of creating ownership. Unlike EDI, Response to Intervention is not a well-specified set of principles. In fact, it is an abstract idea that is defined by those who put it into practice. Nevertheless, teachers embrace the idea of matching students to interventions and take their role in determining student needs seriously. On our teacher survey, 93 percent report that teachers monitor student progress closely, and 80 percent agree that teachers ensure that students receive appropriate interventions. Clearly PLCs and focus on data are fundamental to teachers’ support for interventions. Here teachers have a structure for identifying student needs and discussing strategies for intervening. As one elementary teacher described:
We learn from our data. I had never had that experience 30 years ago. We looked at the CELDT scores of our kindergarten children in first grade and saw that every single one has grown at least one level. It has to do with the deployment part. We never did that 10 years ago. We test their level on the CELDT and we divide up our 60 kinders. I take 20 beginners, another has ELs, and the third works with advanced. We use Avenues. We work on building sentences and vocabulary. The results have been so exciting and increasing their vocabulary reflects back in their writing and reading. And

36
their self esteem is really increased by this. We have a really “yes you can” attitude. Over time, teachers are becoming more adept at diagnosing where students are
struggling. With support from the Central Valley Foundation, the district recently began pilot testing a new diagnostic assessment derived from CELDT and given more frequently. With multiple sources of data that target both academic and language deficiencies, teachers are even better positioned to make sound judgments about the types of interventions best suited to each student.
The practice of identifying student needs and defining interventions reinforces teachers’ growing sense of collective responsibility for students and trust in each other. As one teacher told us:
I try to keep up with what the other intervention teachers are doing. [My students] have to do cold reads and hot reads. And they will tell me everything they learn. I don’t really get to see what they do besides trust my partners that they know what they are doing. One who was doing fluency said some of the kids were ready to move out. So we met and saw that some were. And some who get more intense intervention are my IEPs [special education students].
Deepening and Sustaining Effective Instruction
The implementation of EDI and RTI is inextricably linked to the PLC initiative. Teachers work collaboratively to define instructional objectives, identify students’ strengths and weaknesses through common assessments, and determine appropriate interventions, both in their classrooms and during deployment. These activities map directly onto the four questions that structure PLC meetings and the features that characterize EDI lessons -- from clearly stated lesson objective to checking for understanding and small group or individual assistance. RTI is the essence of the PLC questions that ask what you do when students do not or do learn the intended objectives.
Similarly, the instructional agenda is tightly linked to district accountability
structures (see next section). Principals are the linchpin for accountability: they are required to report progress on PLCs, EDI, and RTI in their annual presentations to district leaders in the Principal Summits so have a stake in leading and supporting teachers’ work in these areas.
It is these interconnections, with strategies reinforcing one another, which hold promise for sustaining and deepening effective instruction. As more and more students reach proficiency, more attention to higher order thinking and problem solving will be on the agenda.

37
Using Accountability Constructively Fundamental to Sanger’s approach to reform is the idea that hoping for improvement must be replaced by choosing and carrying out strategies likely to lead to improvement. Good intentions matter but not without collective effort to take specific steps to increase student achievement. But how can a district motivate adults to take up this challenge: to think differently about their work, act collectively, and change what they do?
Sanger leaders have built mechanisms throughout the school system to hold educators accountable for improving student achievement. What is unusual about their approach is (1) holding teachers and administrators accountable for collecting data on student learning and using evidence in the decisions they make in their quest to improve student achievement, and (2) creating a culture in which doing so is viewed as a professional responsibility. This conception of accountability is consonant with district priorities for collaboration and evidence-based decision making and is undergirded by technical and moral support from district leaders. It is what the superintendent calls “reciprocal accountability.” He explained: “If I have an expectation for or from you, then I have an obligation to provide you with whatever it will take for you to succeed. You must hold me accountable as well because if not, you didn’t fail, I did.”
Once again the simplicity of the phrase “reciprocal accountability” belies the
complexity of putting it into action. Few district leaders—nor those at the state or federal level—have been able to translate reciprocal or mutual accountability into practice. Far more emphasis is placed on the punitive role of sanctions than on the support side of the equation. Not only do Sanger leaders see mutual accountability as a moral imperative but they have created a system which balances demands on educators with the supports needed to succeed.
It also goes hand in hand with the district’s “tight-loose” philosophy whereby
district mandates are tempered by flexibility in how they are adapted and carried out by individual teachers and principals. Sanger’s approach to accountability empowers professionals to come up with solutions to the challenges they face. How accountability became a constructive driving force From the federal and state, and often district, vantage points, external accountability is the favored method to motivate change. This approach is embodied in NCLB with its requirements for schools to continually increase scores on state tests with sanctions for failure to do so. When Sanger was named one of the lowest performing districts in the state, Sanger leaders appealed to this external pressure to mobilize support for the changes they were asking of administrators and teachers. A year earlier leaders had seen the writing on the wall, but in pressing for a districtwide focus on essential standards and quarterly district assessment they encountered complaints and resistance from principals and teachers. In Deputy Superintendent Smith’s words:

38
When I arrived in Sanger I began pushing to create a system that would provide student achievement data throughout the school year. When we implemented the DPA [District Performance Assessment], there was a great deal of push back. The phone calls, emails, and meetings with staff were not pleasant. The belief was that there had to be an alternative motive–a “gotcha” reason for wanting to know if students were learning. My response was, ‘Guys, we’re on fire! The ship’s burning. And by the way, we’re going to be taken over by the state if we don’t do something.’ In October of that year we were named as one of the first 98 Program Improvement school districts in the state—we were a member of the lowest performing districts in California. It created that cathartic moment where I was able to say, ‘Look, This is for real.’ This moment created a tremendous amount of credibility and a realization that we were in this together; the district office and the schools.
But inside the district, Sanger’s leaders took a different approach to
accountability. Rather than relying on negative labels and sanctions, they focused on building the leadership capacity of principals as well as central office staff and the instructional capacity of teachers. They used external accountability to create a sense of urgency for reform but, internally, they developed a model of mutual or reciprocal accountability.
Over time, Sanger leaders created a balance between pressure to adopt new ways
of working and support for implementing the new ways. The accountability mechanisms Sanger leaders designed embody this combination of pressure and support. For example, Principal Summits, described below, serve as both a means of holding principals accountable—they literally must render an accounting publicly each year—and arming them with skills and practice in asking questions (inquiry), instructional strategies, data analysis, and public presentations.
Several structures at different levels of the system illustrate this approach. In addition to the Principal Summits, Alternative Governance Boards for schools that reached PI4 hold principals and teachers accountable for identifying strong and weak aspects of instruction and adapting instruction as needed. PLC agendas and minutes keep principals informed of how each PLC is functioning. Classroom walkthroughs by the principal and by the district leadership team provide feedback to teachers on uses of EDI.
Principal Summits. When the state named Sanger as a PI district, leaders realized
that few school or district administrators knew what the label was based on or what it meant. As Deputy Superintendent Smith put it:
There were no administrative expectations for anybody. Administrators didn’t know what was expected of them. They really had no reason to study the data, to know State requirements, or to understand the sanctions for low performance. Our principals couldn’t even tell me the difference between API and AYP. They had no idea!

39
Not only did principals not fully grasp federal and state requirements for
continuous improvement in achievement across subgroups and the consequences for failure to do so, they had no way to measure progress. As Smith put it: “We had no dipstick. We couldn’t tell how we were doing.” This concern led to the development of the quarterly district performance assessment (DPA) described earlier and, in turn, the establishment of annual Principal Summits in which every principal presents data about their school to district leaders. District documents describe the Summits this way:
Sanger Summits are an opportunity for principals to present their school’s past and current level of student achievement, their plans for improving achievement, and to receive feedback/suggestions from their peers. The Summits also allow the District Office and district support providers to better understand the needs, goals, programs, and direction of all schools. Summits are a dialogue from which all participants grow and improve for the benefit of the children of Sanger Unified. The path from the first summits to the current ones was not a smooth one.
Borrowing the general idea from a neighboring district, the summits were a way for principals to report to the district on what they were doing. Principals are to report on the data requested by the district and answer questions posed by district administrators, observed by the superintendent, and open to the public. Each principal is allocated one hour, usually scheduled in groups of three during Monday and Wednesday mornings in October.
In the first year, principals were asked to present the prior three years of API data.
According to Smith, they didn’t know where to find it, and, in response to the pressure, principals began walking by his office going to see the superintendent. Smith also heard from a district colleague who said “Everybody’s very upset about this. This is wrong. You’re stressing these guys! They’re really stressed!”
When the rules tightened in the second year, the response was even more
dramatic. As one principal described: “[District leaders] went easy on us the first year. The second year they went at the [school] administrators . . .[We were] swearing back and forth.”
Principals had no formal training in locating and analyzing their school’s test score data. Yet, over time, they became quite skilled at analyzing and presenting their data. They learned by doing and through asking questions of each other and observing each other’s presentations. Smith described his philosophy of professional development in this context: “People learn best when there is a need to learn. The more you need the knowledge and information, the more you seek to learn it. And as we continued to require more in our Summits, our principals became a professional development system within their own ranks. We had created a demand for critical knowledge.”

40
As principals’ skills in data-based accountability improved and as they developed trust in district administrators’ commitment to support their school’s success, their views of the summits became much more positive. One said “At the core the important questions were being asked: show us what you know, how you know it is working, and how you will help your site get better.” Another said: “The whole purpose of the summit is to get us to reflect so we will do it on our own.” And, one described getting calls afterwards from two district administrators: “They have gotten better at patting us on the back. . . They realize now how much it matters to us.” Requirements for principals’ presentations increase each year. As one principal described: “At the beginning it was just getting started and knowing how to present the materials and understand the data. That was the focus. Now it is more the instructional pieces. More refined each time.”
For example, in fall 2010, principals were asked to present state test scores across 5-6 years by subgroup and proficiency level, movement of EL students across state-defined levels of proficiency, and implementation stages of the key reform components by grade level or department. They were also asked to describe steps they are taking to ensure continued growth for each grade level and department, reasons for improvements or lack thereof, and their top three areas of focus for the year. [See “Sanger Summits 2009-10” in Appendix]. Principals are expected to cover a lot of ground within strict constraints. Their Power Point presentations must not exceed 45 minutes including questions from district administrators (usually two or three seated at the “head table). This is followed by 15 minutes of audience participation—an innovation over the last two years as the summits have become standing-room only events, attracting visitors from dozens of districts across the state. We observed Principal Summits in their fourth and fifth years. Both the presentations and exchanges between the principals and “head table” were professional and focused on instructional challenges and strategies, reflecting a substantial evolution from descriptions of early summits. Before Sanger’s reputation for success spread across the Valley and the state, Summits were public but rarely attended by outsiders. In the last two years, the Board Room where they are held has been packed. This appeared to influence the Summits to a small extent. More time was devoted to explaining Sanger-specific reforms and acronyms and to responding to questions from the audience.
Principals interviewed subsequent to their presentations were proud of their work and offered no complaints about the time spent preparing or the event itself. They reported learning from the experience and learning from each other. Principals who are not in the first group to present often attend to get a sense of the kinds of questions the “head table” is asking. Some attend to hear particular colleagues. All hear the presentations from peers scheduled on the same day.

41
Principals described “learning from putting it all together” and “looking at all the data.” One principal said:
When we first did it I said here’s another exercise. But when it is all said and done. I get to know my school much better. I look at the numbers much more closely. How all the subgroups are doing. Gets me to start asking questions of the teachers. In addition to benefits to each principal including enhanced public speaking skills,
the shared experience of the Summits has served to forge ties across school leaders and create an informal professional learning community among them.
Alternative Governance Boards. In 2004-5 when the first Sanger school reached its fourth year of Program Improvement, Sanger leaders took advantage of the situation to test a school-based accountability mechanism. When the state identifies a school as PI5 (fifth year in Program Improvement), one option the school and district have for major restructuring is to select an Alternative Governance Board (AGB). Sanger leaders decided not to wait a year and put an AGB place in year 4 to act in advisory capacity. The state’s idea was to take governance out of the hands of the school. Sanger’s idea was to create a board that could help the school improve through monthly meetings structured to look at data and help identify solutions together with school leaders and staff.
The first school to reach PI4 was the testing ground for Sanger’s AGB plan.
Smith said: So as we started the AGB, we came to learn that there was not a model to follow. It became a “learn as we go” situation. We quickly realized that the AGB didn’t have to be directive; it could be used as a “mirror” that you hold up to the school as you ask critical questions about instruction, data, and student learning. Reflecting the same philosophy underlying PLCs and the Principals’ Summits, the
district’s vision for the AGB was to create a board that could actually provide help to each school. All the AGBs have been chaired by the Deputy Superintendent which, according to one district administrator, “was a huge statement to sites that this was important and was not going to go away.” AGB members bring expertise in leadership, management, curriculum, instruction, and data use to help guide school leaders diagnose issues and develop solutions. For example, one school’s AGB included the Associate Superintendent, the Director of Student Services, a California State University professor, Director of Special Projects, two curriculum coordinators, and an expert in Edusoft data system. As Superintendent Johnson noted: “We made a deliberate decision not to put school board members on it because then it is not alternative.”
Each monthly meeting focuses on a particular issue identified by the principal, for
example, 6th and 7th grade mathematics PLCs. Meetings begin with a report from the principal followed by classroom visits by teams composed of PLC members and AGB

42
members. Teams are asked to observe particular elements of the classes they visit [for example. . .] After visiting 5 or 6 classrooms within a 45-minute window, teams report back to the group on the trends they observed. The meeting is then turned over to teams of teachers representing, in this case, 6th ad 7th grade PLCs, who present and interpret data. For example, one team presented data on how students scored on the most recent district periodic assessment, broken out by teachers and compared to scores on the prior assessment. The teachers offer their inferences about strengths and weaknesses and next steps. AGB members then ask questions which have been provided in advance to the teachers.
Everything that happens in the AGB meetings goes into the minutes which are distributed to the entire staff of the school. And, as Smith put it, “When you publish the minutes of the AGB, the whole staff begins to talk . . . and we learned that the staff reads those the minutes cover to cover.”
The AGBs provide principals with additional authority in asking their teachers to make changes. As one said: “We [principals] were able to say ‘This is what the AGB wants and expects. . .’ Teachers went from hating it (the monthly visits) to wanting to do well by the AGB Board.” Several factors likely contribute to this shift in attitude. The fact that AGB members visit classrooms every time they meet and invite teachers to present data at each meeting raises trust and confidence. Similarly, the fact that the AGB pursues questions raised by the principals increases their relevance to the staff. Moreover, the fact that the minutes are made public—documents which include summaries of feedback from observations and PLC presentations—heightens interest in the AGB’s activities.
Teacher Accountability Through PLCs and Observations Professional learning communities have accountability built in: teachers are accountable to each other to show up and participate. In well-functioning PLCs, teachers feel a sense of professional responsibility to prepare and contribute during and after the formal meetings. Sanger leaders have asked principals to monitor PLC behavior through requesting minutes of PLC meetings on a regular basis. How principals do this varies. Some look at and comment on minutes weekly. Others simply collect them. One principal described seeing the progress of PLCs through reading the minutes every week:
I read the minutes every week and I respond. The agendas and minutes have evolved too—from candy sale and restrooms to looking at assessments, who made it and who did not . . . Phenomenal growth. Middle school teachers described Focused Walks in which the Curriculum
Support Provider, assistant principal, and principal briefly observe classrooms to assess and give feedback on how well teachers are moving through all the steps of the lesson. Their goal is to help teachers insure that they get to independent practice by the end of

43
the lesson. Teachers describe this strategy as a coaching tool—another example of an accountability strategy paired with strong support. Along with PLCs, Focused Walks as well as other forms of administrator observations are creating a new culture in which teaching is far more transparent. Fifty-eight percent of teachers say they are comfortable opening their classrooms to observers. Teacher survey responses also confirm that site administrators spend time observing classrooms and, more unusual, teachers find their feedback helpful. Seventy-eight percent of teachers report that the site administrators regularly observe their classrooms and 72 report that these administrators provide useful feedback. In a similar vein, teachers also credit the district; 74 percent of teachers agree that the district provides leadership and support to help teachers improve.
The districtwide SAALT team comprising district and school staff also visit schools regularly. Their goals are both to provide feedback to the school based on walkthroughs of every classroom and to glean from the visits in which areas the district needs to offer additional training. As with Focused Walks in the schools, the observations are not intended as “gotchas” but rather to identify strengths and weaknesses and where additional training or coaching might be needed. Sustaining and Deepening Professional Accountability Sanger administrators and teachers take accountability seriously. In a different context, the multiple structures in place for tracking progress and reporting findings publicly might be perceived as heavy-handed by teachers and principals. But in Sanger, these mechanisms are part of a culture of transparency and shared commitment to increase student achievement. They also reflect a culture of personal and professional trust that has been built over time through conversations and demonstrations that the goal of accountability is to help students achieve. From teachers in professional learning communities who have learned to make their practice public, to principals who present their school’s data to district leaders in a public forum, accountability is understood to be a way to get additional guidance and assistance. It is not without pressure—educators in Sanger feel pressed to succeed in helping their students reach their potential—but they know that they are not likely to fail because of the multiple sources of assistance from both peers and superiors. The widespread acceptance of classroom observations will last as long as they continue to be perceived as grounds for guidance and help and not for punitive purposes. To the extent that Sanger leaders continue to balance the pressure side of the equation with the support side, accountability as a positive force is likely to persist.

44
Learning from Sanger Extracting lessons from successful ventures is always a risky proposition. In education, such lessons tend to be quite general and sound very familiar, such as the need for strong leadership and a climate that promotes learning. We could generate a similar list from studying the Sanger Unified School District, from grade-level standards to professional learning communities. But such a list would miss the essence of Sanger’s reform, In Sanger, as in other cases of successful reform, the real story lies in how the reform unfolded—the process of changing a system. A list of the particular initiatives Sanger leaders embraced barely scratches the surface of this story. Sanger’s reform experience illustrates the complex, evolutionary nature of major system change. Sanger’s leaders did not march in with a plan nor did they expect a dramatic and rapid overhaul. Dire as their problems were, the leadership did not imagine dismantling the system. Their approach was to size up the strengths and weaknesses of their schools and central office and focus on a small number of strategies that were appropriate to their students and compatible with each other. Choosing to invest in building professional learning communities and in direct instruction and interventions for students met these criteria. Moreover, these choices were consistent with a set of beliefs and principles about how to change the culture of the system and improve student achievement. Guiding principles
Reforms often are defined by particular programs or structures. In Sanger, choices of strategies are based on principles about students and conditions of student learning, and, more broadly, about the important job of public education.
• Focus on student learning (not on adult needs). The superintendent established
early on that the mission of the district is to ensure that all children reach their potential and that their job is to ensure that the learning needs of every child are met. Students are taught at grade level and get extra help as needed with English and academic content.
• Collaborate to improve student achievement. “Together we can” and “I can… we
will!” are core to Sanger’s reform strategy. From teacher professional learning communities in schools to district leadership teams, collaboration and transparency are fundamental to the way Sanger does all its work.
• Develop school leadership for continuous improvement. Sanger district
administrators believe that investing in site-based leadership is key to moving and sustaining their school reform agenda. Administrators participate in the same training as teachers for all major instructional initiatives including professional learning communities and direct instruction. Teacher leaders form a pipeline of future administrators steeped in the district’s reform culture.

45
• Ground decisions in data. Educators at all levels of the system are expected to make decisions based on data, and are held publicly accountable for doing so. From teachers’ ongoing reviews of student progress to principals’ annual presentations of school trends in student performance to district leaders, grounding decisions in evidence of student learning is paramount and accompanied by systems that facilitate access to data.
• Hold adults accountable and provide sufficient support. Adults at all levels of the
system are held accountable for continuously improving student achievement but in a system of reciprocal accountability. Administrators pressing for accountability from schools and PLCs, from principals and teachers, are themselves accountable for providing skills and resources needed to carry out the work.
Together, these principles are more than a guide to reform strategies. They
underlie district and school choices about how they allocate resources, who they hire, and how they do their work. They add up to an organizational disposition towards inquiry: asking questions, seeking data, and making adjustments. Explicit strategies for system change Sanger’s leaders created their own particular philosophical framework that has guided their strategic choices about how to bring about major changes in the culture, beliefs, and practices of those working for Sanger Unified. Key strategies for changing the system include:
• Sustained focus on a few initiatives. In contrast to the all-too-common “mile wide and inch deep” approach to reform, Sanger leaders picked three key complementary initiatives as the backbone of their reforms and stuck with them, with continuing training and support to both spread and deepen understanding of each initiative.
• Clear and constant communication. Continuing conversations between district
leaders and school staff are integral to Sanger’s views of how a system changes and how changes are sustained. From the superintendent’s annual themes and storytelling to learning communities up and down the system, conversations reinforce the district’s core commitment to student learning and expectations for adults.
• Balance between tight and loose control. Sanger leaders define clear parameters
within which schools have discretion, seeking to balance what is decided at the district and school levels. Referred to as “tight-loose,” leaders are clear about their “non-negotiables” which translate into requirements for schools (the what), and schools are clear about the flexibility each has to do it “their way” (the how).

46
• Creating Demand. Sanger leaders encourage adoption of new practices by introducing them to principals and teachers through carefully selected training opportunities and through exemplars within district schools. Principal and teacher networks spread the word about effective practices, creating appetite and informal opportunities to learn them.
• High pressure coupled with high support. Sanger leaders ask a lot of their
principals and teachers and a lot of themselves. District leaders have high expectations for principals and push them to become strong school leaders of teacher PLCs and effective teaching and learning. At the same time, they have organized the central office to ensure that principals are relieved of responsibilities and requests that are not central to their role as instructional leaders. Similarly, teachers are pressed to embrace learning communities, direct instruction, English language development, and interventions but with supports ranging from time allocations for meeting to training opportunities and coaching.
These principles for district reform and for changing system culture and practice
undergird Sanger’s transformation over recent years. They are all of a cloth—compatible and intertwined. Together they guide leadership practice and consistently communicate and reinforce a set of beliefs that put Sanger students at the center of the district’s work. Future challenges for Sanger Although Sanger Unified has achieved considerable success, it still faces challenges and is not resting on its laurels. Not all grade levels or courses or subgroups of students in Sanger schools reflect increases in student achievement every year. Not all teachers are active collaborators with their peers. Continuous improvement by definition means a work in progress. With changes in the state economy, possibly in state standards and tests, and in federal law, Sanger faces both external and internal challenges to stay on its course of continuous improvement.
Funding. Sufficient funding is key but often discounted because money is no guarantee of success. In Sanger’s case, resources are invested well and in fact are essential to providing the learning opportunities, time, and support that are hallmarks of the district’s approach to continuous improvement. Moreover, Sanger’s budget is among the lowest in the state compared to similar districts. Sanger has made massive investments in training for principals and teachers, and, as its leaders explain, needs for training and mentoring and coaching never end. Superintendent Johnson says: “We need to hire the best candidates and give them the best support. Good is not good enough for our kids, we need great. So we press hard to develop their capacity to be successful as quickly as we can.” Instruction for English learners. Sanger’s reforms have targeted English learners in multiple ways, and their strategies have demonstrated success in redesignating students as English proficient. Nevertheless, students who do not become fluent in English and even those who are technically fluent may be missing the background literacy and

47
academic language skills needed to succeed, especially in the higher grades. Adopting more sensitive and frequent assessments will help to pinpoint when students are falling behind and help define appropriate language intervention.
State standards and tests. Sanger has created an effective system for moving students to proficiency on the California state tests and steadily increasing those reaching the advanced level. Still, instructional reforms are inherently limited when they must be geared to such tests. Sanger has recognized the need to move students beyond the content on the state test and has efforts underway to deepen thinking skills and integrate subjects not tested by the state. This will remain a challenge until better assessments are created that tap into a broader set of knowledge and subject areas. California’s adoption of national Common Core Standards could result in press for higher-order student outcomes and better assessments, creating new opportunities for Sanger to enhance its students’ learning outcomes.
Leadership succession. Sanger has created an internal system that allows the district to fill school leadership positions from within, moving assistant principals and coaches into vacancies at higher levels. Their positions are filled in turn by teacher leaders. However, sustaining leadership at the top is a bigger challenge. Because the new culture has permeated the system, the district has momentum to move forward. But, at some point, in order to sustain the momentum, Sanger will need to replicate the kind of inspired and thoughtful leadership that has brought them this far. The dynamic dual leadership of a superintendent and deputy superintendent with compatible beliefs and complementary styles and skills is unusual and powerful. It is an open question whether or not this formula for top leadership is needed to sustain the district’s continuous improvement.
Responding to requests for help. Success brings attention and with that come requests for visits and for advice. Sanger leaders and staff are eager to share what they have learned and willing to help other districts. But doing so puts an added strain on already tight and shrinking resources. Therefore, attention to helping others must be done strategically and with external support, or else such efforts risk detracting from the continuing hard work on the home front.
One area which is no longer a challenge for Sanger is recruiting teachers with
strong potential. Sanger now has a strong and wide reputation as a district that supports its teachers and, as a result, attracts a large number of high caliber recruits. Lessons for districts and policymakers
There is nothing esoteric about Sanger’s focus on professional learning communities or direct instruction or English language development. What is unusual is the professional commitment with which they have taken on the challenge to teach all students to their potential and a corresponding set of strategic actions that both push and prepare educators to continually improve so that their students can do the same. This intensity, focus, and coherence is where the lessons for others lie.

48
How Sanger changed the culture of the district and how they have balanced
pressure to change with the needed help and resources to do so is the crux of Sanger’s reforms. Through their shared expectations, constant conversation, and collaboration, Sanger leaders provide a model for transforming a failing district into an exemplar for others.
The risk is that others will look to take particular pieces away: direct instruction
or professional learning communities or principal summits. But the whole is much larger than its parts, and the lessons lie in how Sanger’s leaders have inspired, educated, and trusted principals, teachers, and students.
Our findings in Sanger lend strong support to the viewpoint that ‘going to scale’ is
not about attempting to replicate successful practices but rather about building the capacity of individuals and the system they work in to function more productively towards the same goal. Sanger’s own strategies to move successes in one school across the district through creating demand and providing training and support illustrate this model internally.
Just as lifting one or two elements from Sanger will not lead to results, neither can
others adopt Sanger’s approach whole hog. Sanger offers a set of principles and strategies for transforming their system culture in a particular context. Their success lies in finding leverage for changing the district culture in evidence of whether Sanger students are achieving and exceeding grade-level standards. Collaboration at all levels of the system to use evidence to continuously focus improvement efforts is key to adult learning and student learning in Sanger.
Through system leadership that clearly and constantly communicates its beliefs in
the importance of tracking student progress and invests in building the capacity of principals and teachers to meet student learning needs, Sanger has achieved success. Perhaps its experiences are not directly relevant to districts considerably larger, which face daunting challenges in communicating a coherent reform vision and navigating politics of competing interests. Still, hundreds of districts are close to Sanger in size and student composition. Regardless of size, district leaders and those interested in reforming districts that serve poor and minority students have much to learn from Sanger about building a coherent reform agenda and leading system change.

49
APPENDIX
Sanger School Demographics 2009
Student Achievement Data Graphs
Graph 1. Percent of Students Proficient or Above on English Language Arts California Standards Test, Comparing Schools in Program Improvement to the State
Graph 2. Percent of Students Proficient or Above on Mathematics California Standards Test, Comparing Schools in Program Improvement to the State
Graph 3. Percent of Students Proficient or Above on English Language Arts California Standards Test, 2004-2009
Graph 4. Percent of Students Proficient or Above on Mathematics California Standards Test, 2004-2009
Graph 5. Percent of English Learners Proficient or Above on California Standards Tests, 2004-2009
Graph 6. Percent of Economically Disadvantaged Students Proficient or Above on California Standards Tests, 2004-2009
Graph 7. Percent of Students with Disabilities Proficient or Above on California Standards Tests, 2004-2009
Graph 8. Mean Scale Scores on English Language Arts California Standards Test by Grade Level for Sanger and California, 2004-2009
Graph 9. Mean Scale Scores on Mathematics California Standards Test by Grade Level for Sanger and California, 2004-2009
Graph 10. Mean Scale Scores on English Language Arts California Standards Test by Grade Level for English Learners in Sanger and California, 2004-2009
Graph 11. Mean Scale Scores on Mathematics California Standards Test by Grade Level for English Learners in Sanger and California, 2004-2009
Graph 12. Mean Scale Scores on English Language Arts California Standards Test by Grade Level for English Learners and English-Only Students in Sanger and California, 2004-2009
Graph 13. Mean Scale Scores on Mathematics California Standards Test by Grade Level for English Learners and English-Only Students in Sanger and California, 2004-2009
Technical Notes on Data Analysis
Sanger Summit Instructions 2009-10

50
Sanger School Demographics 2009* Grade
span School
size Percent Hispanic
Percent White
Percent Asian (Hmong)
Percent FRL
Percent English learners
Centerville K-6 238 66 29 79 19 Del Rey K-6 302 92 6 95 47 Fairmont K-8 483 40 45 13 58 20 Jackson K-5 390 83 15 2 79 21 Jefferson K-5 368 98 1 94 59 John Wash K-6 378 41 18 37 59 26 Lincoln K-5 391 95 4 90 49 Lone Star K-6 579 39 10 42 75 44 Madison K-5 472 77 9 10 83 32 Quail Lake+ K-8 516 30 55 11 27 6 Reagan K-5 269 69 19 10 70 15 Sanger Academy+ K-8 530 79 15 3 63 16 Sanger High 9-12 2676 69 18 12 82 18 WAMS 6-8 1653 79 10 8 82 18 Wilson K-5 523 95 91 53 * Does not include Hallmark Charter (home schooling), alternative schools or adult school.
+ Charter school.

51
Graph 1 Percent of Students Proficient or Above on English Language Arts California Standards Test, Comparing Schools in Program Improvement to the State

52
Graph 2 Percent of Students Proficient or Above on Mathematics California Standards Test, Comparing Schools in Program Improvement to the State

53
Graph 3 Percent of Students Proficient or Above on English Language Arts California Standards Test, 2004-2009

54
Graph 4 Percent of Students Proficient or Above on Mathematics California Standards Test, 2004-2009

55
Graph 5 Percent of English Learners Proficient or Above on California Standards Tests, 2004-2009
Note: For this graph, the English Learner category consists of all students classified as English Learners, plus students who have been reclassified as fluent in English but who have not yet scored Proficient on the English Language Arts portion of the California Standards Test for three years. This is how the state defines the English Learner category for AYP purposes.
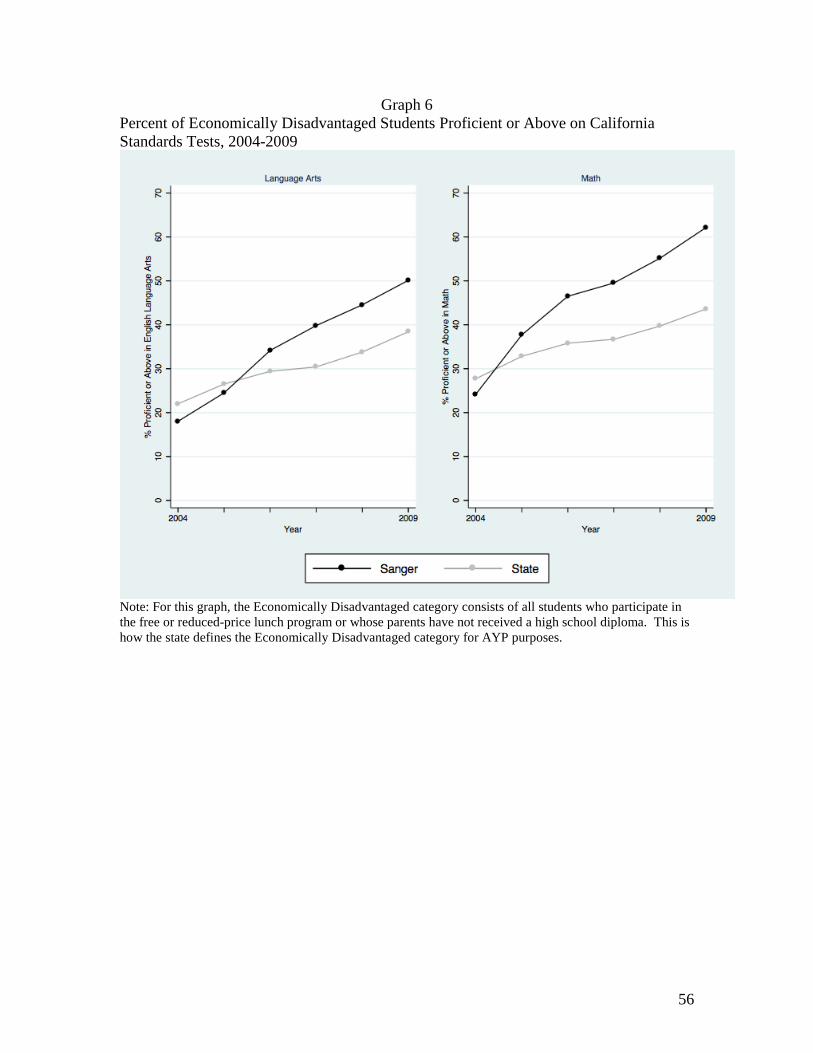
56
Graph 6 Percent of Economically Disadvantaged Students Proficient or Above on California Standards Tests, 2004-2009
Note: For this graph, the Economically Disadvantaged category consists of all students who participate in the free or reduced-price lunch program or whose parents have not received a high school diploma. This is how the state defines the Economically Disadvantaged category for AYP purposes.

57
Graph 7 Percent of Students with Disabilities Proficient or Above on California Standards Tests, 2004-2009
Note: For years 2004-2007, the Students with Disabilities category consists of all students who qualify for special education services. For 2008 and 2009, students who previously qualified for special education but who are no longer receiving special education services are also included in the Students with Disabilities category for two years after exiting special education. This is how the state defines the Students with Disabilities category for AYP purposes.

58
Graph 8 Mean Scale Scores on English Language Arts California Standards Test by Grade Level for Sanger and California, 2004-2009

59
Graph 9 Mean Scale Scores on Mathematics California Standards Test by Grade Level for Sanger and California, 2004-2009

60
Graph 10 Mean Scale Scores on English Language Arts California Standards Test by Grade Level for English Learners in Sanger and California, 2004-2009
Note: For these graphs, the English Learner category consists of all students who were ever classified as English Learners, including students who have been reclassified because they became proficient in English.

61
Graph 11 Mean Scale Scores on Mathematics California Standards Test by Grade Level for English Learners in Sanger and California, 2004-2009
Note: For these graphs, the English Learner category consists of all students who were ever classified as English Learners, including students who have been reclassified because they became proficient in English.

62
Graph 12 Mean Scale Scores on English Language Arts California Standards Test by Grade Level for English Learners and English-Only Students in Sanger and California, 2004-2009
Note: For these graphs, the English Learner category consists of all students who were ever classified as English Learners, including students who have been reclassified because they became proficient in English.
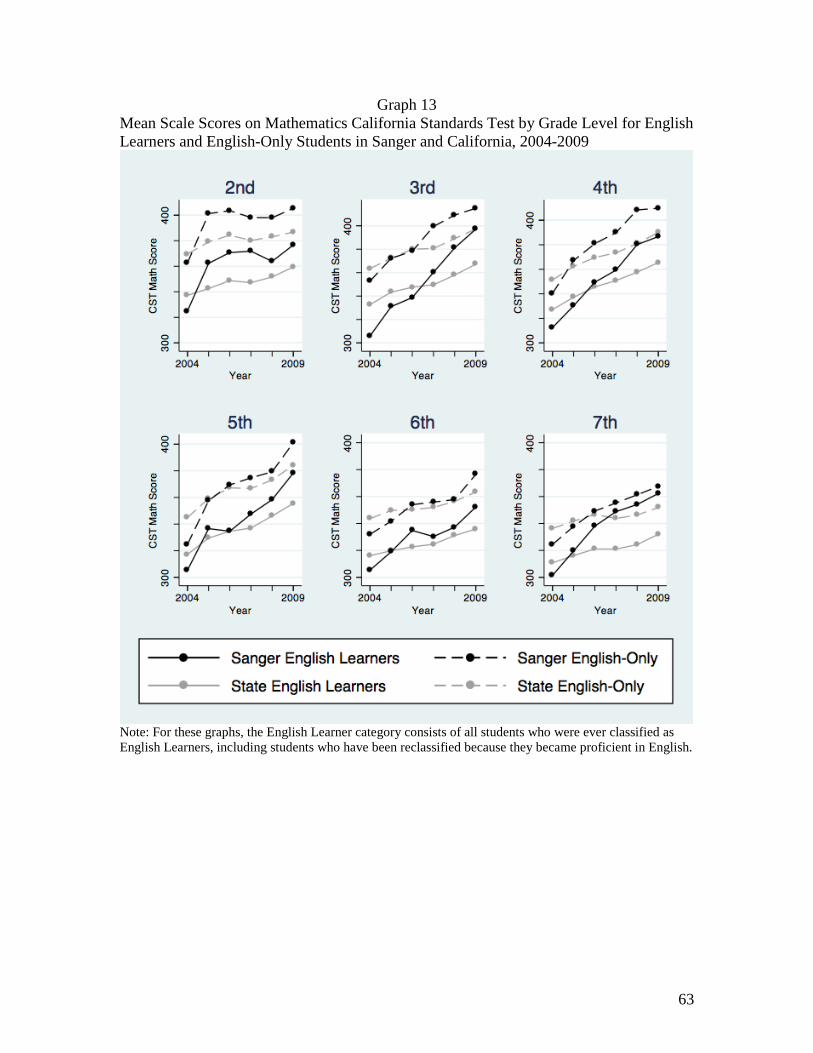
63
Graph 13 Mean Scale Scores on Mathematics California Standards Test by Grade Level for English Learners and English-Only Students in Sanger and California, 2004-2009
Note: For these graphs, the English Learner category consists of all students who were ever classified as English Learners, including students who have been reclassified because they became proficient in English.

64

65
Technical Notes on Data Analyses Data Sources Multiple sources of data were used to prepare graphs of student performance. Student-level achievement data for Sanger (including CST, CAHSEE, CAPA, and CELDT scores) comes from the Edusoft website. Student-level demographic data for Sanger, which is used to determine student membership in various subgroups (i.e. economically disadvantaged students, students with disabilities, and English learners), comes from district rosters provided by Sanger Unified. Achievement data for Sanger was downloaded from Edusoft separately for each school year from 2004 through 2009 and merged with demographic information provided by the district, matching students’ test scores to demographic information using the district’s unique student identifiers. Approximately 1% of the student records (704/75668 records) had to be discarded entirely because they were missing the unique student identifiers in Edusoft that were necessary for matching. State data comes from the California Department of Education (CDE) website. Percent Proficient Analysis Types of Assessments and Valid Scores For the comparisons of the percent of students scoring proficient or above in Sanger and the State, an attempt was made to follow the same rules that the state uses when reporting the percent of students scoring proficient or above for federal Adequate Yearly Progress (AYP) accountability purposes. At the state level, the percent of students scoring proficient or above, overall and for each subgroup, was simply downloaded from the CDE website separately for each year. To generate comparable information for Sanger, several steps were required. First, only results from tests and grade levels used for AYP purposes were considered. These results consist of:
• scores on the English Language Arts and Mathematics California Standards tests for 2nd-8th graders;
• scores on the English Language Arts and Mathematics portions of the California High School Exit Exam for 10th graders; and
• scores on the California Alternative Performance Assessment for 2nd-8th graders and 10th graders who qualify to take this assessment because of serious cognitive disabilities.
Then the number of students with valid test scores for each year was tallied using the state’s definition of what constitutes a valid test score. To have a valid score, a student had to have been enrolled in the district, school, or subgroup since October of that school year.7
Next, the number of students scoring proficient or above was determined, using the appropriate cut score for each assessment. Proficiency is defined as:
Furthermore, if a student is classified as an English learner, her score is only considered valid if she has been enrolled in the district since March 15 of the previous school year.
• a score of 350 or above on the ELA and Mathematics CSTs;
7 The cutoff date used is October 1 of that school year.

66
• a score of 380 or above on the ELA and Mathematics portions of the CAHSEE; and
• a score of 35 or above on the ELA and Mathematics portions of the CAPA.
Finally, the number of students with valid scores who scored proficient or above was divided by the total number of students with valid scores. Subgroup Definitions For graphs showing the percent of students scoring proficient or above for various subgroups, the following subgroup definitions were used, in keeping with the subgroup definitions used by the state:
• English Learners: All students classified as English Learners, excluding those enrolled in the district for less than one year,8
• Economically Disadvantaged Students: All students who participate in the free or reduced-price lunch program or whose parents have not received a high school diploma.
plus students who have been reclassified as fluent in English but who have not yet scored Proficient on the English Language Arts portion of the California Standards Test for three years.
• Students with Disabilities: For years 2004-2007, the Students with Disabilities category consists of all students who qualify for special education services. For 2008 and 2009, students who previously qualified for special education but who are no longer receiving special education services are also included in the Students with Disabilities category for two years after exiting special education.
Difficulties in Conducting This Portion of the Analysis Several difficulties were encountered when carrying out this procedure. First, CAHSEE scores for 2004 and 2005 were unavailable from the Edusoft website. Therefore, the calculations for the percent of students scoring proficient or above in ELA and Math in Sanger shown only considers results from the CST and CAPA. The second difficulty relates to the determination of which test scores are valid. The demographic data available from Sanger listed students’ date of entry to the district, but it did not list their date of entry into a particular school or subgroup. If a student entered a particular school or subgroup after October, their score should not have been considered valid when determining the percent of students scoring proficient or above for that school or subgroup. However, since information about the date of students’ entry into specific schools or subgroups was not available, students’ scores may have erroneously been considered valid. For example, in the graph showing the percent of students’ with disabilities scoring proficient or above, if a student qualified for special education services in January, his score should not have been considered as part of the students with disabilities subgroup for that year. The demographic information available to us only listed whether students qualified for special education in a particular year, not the date when they qualified, preventing us from accurately determining valid scores for this subgroup. Despite these difficulties, when the results from computing the percent of students scoring proficient or above using the procedure described above are compared with the results posted on the CDE website, the discrepancies are quite minor. Our calculations 8 The cutoff date used is March 15 of the previous school year.

67
generally fall within one percentage point of the calculations made by the state, suggesting that these difficulties do not meaningfully alter the results. Scale Score Analysis Types of Assessments and Valid Scores The analyses of mean scale scores on the California Standards Tests for various grade levels and subgroups has important differences from the Percent Proficient Analysis described above. Rather than trying to match the state’s reporting practices for federal accountability purposes, in the scale score analysis we are generally using as many test scores as possible, as the state does for its Standardized Testing and Accountability Reporting system (STAR). While the Percent Proficient Analysis is analogous to the state’s federal AYP reporting practices, the Scale Score Analysis is analogous to the state’s internal STAR reporting practices. For this second type of analysis, only CST scores were considered. We report ELA CST scores for grades 2-10 and Math CST scores for grades 2-7. Only grades 2-7 are reported for math because those are the only grade levels in which all students take a common math test that has a comparable scale. In addition, with the exception of English learners who had been enrolled in the district less than one year, all students’ scores were considered valid, regardless of when they enrolled in the district. The exception for English learners is made because standardized tests in English are not typically considered valid or reliable for newly arrived ELs and inclusion of their scores would likely introduce noise into calculations. Subgroup Definitions For a variety of reasons, the subgroup definitions we use for the mean scale score analysis differ somewhat from the definitions used for the percent proficient analysis. Subgroup definitions for the mean scale score analysis are as follows:
• English Learners: All students classified as English Learners, excluding those enrolled for less than one year, plus all students formerly classified as English Learners who have been reclassified as fluent in English.
• Economically Disadvantaged Students: All students who participate in the free or reduced-price lunch program or whose parents have not received a high school diploma.
• Students with Disabilities: All students who qualify for special education services.
The Economically Disadvantaged subgroup definition remains the same as that used for the percent proficient analysis. The students with disabilities subgroup definition now only includes students who qualify for special education in a particular test year, not students who previously qualified. This is because the state only reports mean scale scores at the state level for these two groups, students who qualify for special education and those who do not. It would be impossible for us to determine the mean scale score at the state level for students who used to qualify for special education services but no longer do, as the earlier subgroup definition for the percent proficient analysis would require. Similarly, the English Learner subgroup now includes all English Learners who have been enrolled for more than a year and all students who have been reclassified, not just students who have been reclassified but who have yet to score proficient on the ELA CST for three years. Again, the state only reports mean scale scores at the state level for

68
selected language proficiency groups. We can determine the mean scale score for ELs enrolled in the state more than one year and the mean scale score for all reclassified students in the state because the state reports these numbers. We can then combine these two numbers to create a weighted average. Given the state’s reporting system, there is no way to compute the mean scale score only for reclassified students who have not yet scored proficient on the ELA CST for three years.

69
Sanger Summits 2009-10
What is a Sanger Summit? Sanger Summits are an opportunity for principals to present their school’s past and current level of student achievement, their plans for improving achievement, and to receive feedback/suggestions from their peers. The Summits also allow the District Office and district support providers to better understand the distinct needs, goals, programs, and direction of all schools. Summits are a dialogue from which all participants grow and improve for the benefit of the children of Sanger Unified. Items to Bring to the Summit for Discussion Participants are to create their presentation in PowerPoint. Please make graphs clear and concise. Each graph should be on a single page/frame. The total presentation is to be enclosed in a 15+ page handout. Participants are to bring no less than 15 photocopied sets of their presentation. Items to be included in your presentation: A graph or diagram showing:
1. Your school’s overall API for the past 6 years.
2. AYP levels for all significant sub-groups over the past 6 years using percentage and number of students who are proficient/advanced in Language Arts. (In your presentation point out any achievement gaps and discuss your plans to address these achievement gaps.) Secondary schools should use their 2007-08 sophomores’ CAHSEE data.
3. AYP levels for all significant sub-groups over the past 6 years using percentage and number of students who are proficient/advanced in Mathematics. (In your presentation point out any achievement gaps and discuss your plans to address these achievement gaps.) Secondary schools should use their 2007-08 sophomores’ CAHSEE data.
4. Show the percentage of EL students who are proficient/advanced in the areas of Language Arts and Mathematics for the past 4 years. Secondary schools should use their 2007-08 sophomores’ CAHSEE data.
5. The number of students in each EL classification as compared to prior year. (A, B, EO, etc.) Clearly show the number of students who advanced levels, stayed the same, or regressed from each classification using your 2006-07, 2007-08, and 2008-09 CELDT data.
6. The % and number of students moved from performance band to performance band for Language Arts (plus or minus) from 2004-05, 2005-06, 2006-07, 2007-08, and 2008-09.
7. The % and number of students moved from performance band to performance band (plus or minus) for Mathematics from 2004-05, 2005-06, 2006-07, 2007-08, and 2008-09.

70
Synopsis – No more than one page per item. Please make your synopsis “reader
friendly” using diagrams, tables, bullets with clear thoughtful statements. 1. List the top three steps you are taking to ensure that the elements of EDI are
used in the instruction of your students. List the elements that you explicitly monitoring during walk-throughs. Tell how you provide feedback to specific teachers, grade levels, and teaching staff after/during your walk-throughs.
2. Enumerate your efforts to embed PLCs into the culture of your school. Explain your system to monitor PLC implementation. Explain what quantifiable evidence you have that proves your PLCs are functioning.
3. Present clearly defined steps that you are taking to ensure effective ELD instruction is taking place in all classrooms. Explain your system to monitor EL student achievement throughout the year.
4. Present your “pyramid(s)” of interventions as it pertains to access skills, standards, and behavior. Do not present a list of items…..explain how your school’s intervention program operates.
5. A synopsis of the top three reasons your school-made improvements in academic achievement last year. Include on this same sheet your top three key areas of focus so as to continue to improve student achievement this year.
Participants will be given 45 minutes to present their graphs and talk about their plans. A discussion period will take place immediately following each presentation.
All Summits 8:30-12:00 Participants
Wednesday, Sept. 30 John Wash, Del Rey, Lone Star
Monday, Oct. 5 Lincoln, Wilson, Jefferson
Wednesday, Oct. 7 Centerville, Madison, Quail Lake
Monday, Oct. 12 Jackson, SAC, Reagan, Fairmont
Monday, Oct. 19 WAMS, Sanger High School
Wednesday, Oct. 21 Community Day School, Taft/Kings River, Hallmark, Sanger Adult School

71
Summit Rules Rule 1: No principal or presenter shall bring less than the 12 required
graphs/diagrams/sheets and no more than 16 slides without express written permission from the Deputy Superintendent for Educational Services.
Rule 2: You must understand your slides/graphs/sheets and be able to explain any
and all graphs/diagrams/sheets in a coherent and understandable manner.
Rule 3: Some part of your presentation should actually be created by you and not a
friend, RCAT, subordinate, wife, and/or girlfriend.
Rule 4: You only have 45 minutes, not 4 hours.
Rule 5: No overheads…..presentations must be done using a computer, projector, and presentation software.
Rule 6: Under no circumstances blame the kids.