sandy point sewage treatment plant upgrade: …
TRANSCRIPT

SANDY POINT SEWAGE TREATMENT PLANT UPGRADE:PIEVC CLIMATE CHANGE VULNERABILITY ASSESSMENT
Municipality of the District of Shelburne, Nova Scotia
Environment

PIEVC Process at Pre-Design
Presentation Outline:
Existing System Description New Plant Design Criteria Technology and Site Selection PIEVC Process Results
Project Definition Data Gathering & Sufficiency Risk Assessment Engineering Analysis Conclusions & Recommendations

•30,000 USgpd capacity constructed in 1969
•Overloaded and out of compliance with NSE discharge limits
•Wet weather flows affecting plant performance
Existing Extended Aeration STP
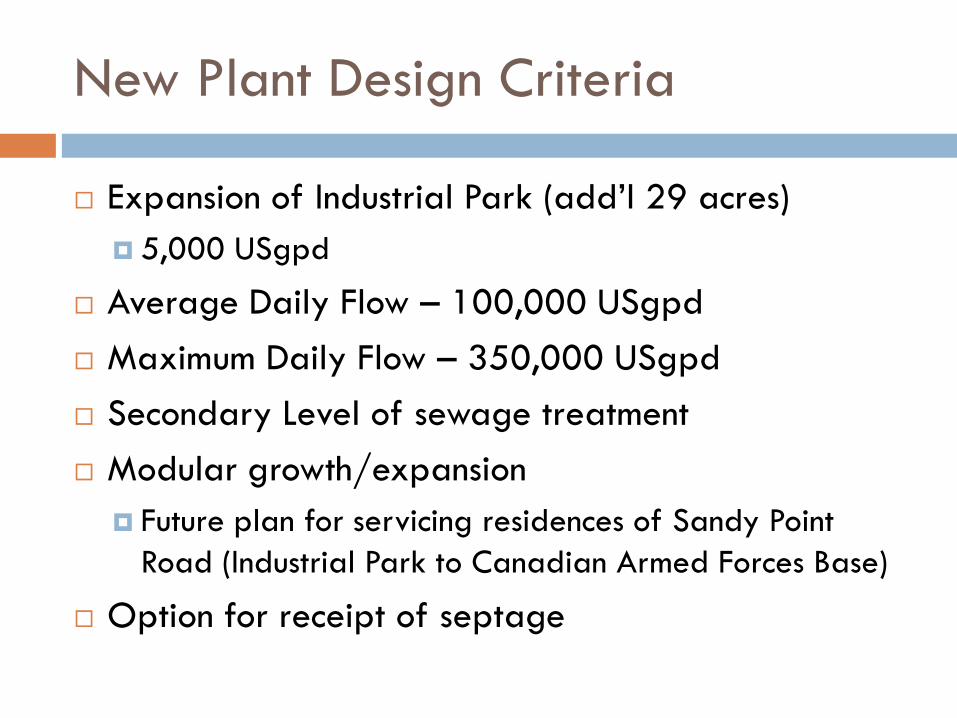
New Plant Design Criteria
Expansion of Industrial Park (add’l 29 acres) 5,000 USgpd
Average Daily Flow – 100,000 USgpd Maximum Daily Flow – 350,000 USgpd Secondary Level of sewage treatment Modular growth/expansion
Future plan for servicing residences of Sandy Point Road (Industrial Park to Canadian Armed Forces Base)
Option for receipt of septage
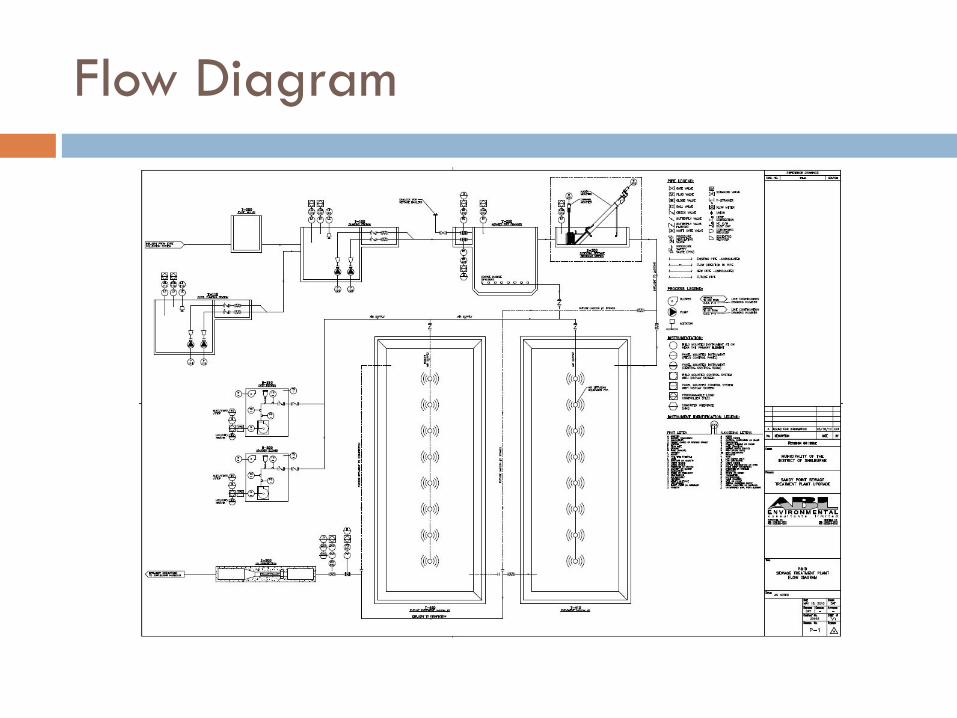
Flow Diagram

PIEVC Process Integrated with Design
Pre-Design Specification Site Selection Technology Selection PIEVC
Detailed Design Tendering Construction Operation
PIEVC Process Project Definition Data Gathering &
Sufficiency Risk Assessment Engineering Analysis Conclusions &
Recommendations
Proj
ect L
ifecy
cle

Climate Data
Temperature and Precipitation
For current climate (1961 to 1990) the greatest three (3) day total rainfall is 87mm
For projected climate (2071 to 2100) the greatest three (3) day total rainfall is projected to increase to 116mm
Minimum Temperature Maximum Temperature Precipitation AmountTri-decade 2020s 2050s 2080s 2020s 2050s 2080s 2020s 2050s 2080sUnits ƼC ƼC ƼC ƼC ƼC ƼC % % %Greenwood 1.8 2.7 4.1 1.5 2.6 4.1 7.5 7.0 4.5Kentville 2.2 3.1 4.6 1.6 2.7 4.3 8.0 7.0 4.0Shearwater 1.9 2.7 4.0 1.2 2.1 3.5 17.0 14.0 11.0Yarmouth 0.8 1.3 2.0 1.0 1.6 2.3 7.0 6.0 3.0

Climate Data
Storms, Storm Surges and Sea level Rise Ultimately, high water levels result from a combination of the
specific meteorological event, geographic location of event, sea level rise, storm surge, sinking land, and wave run-up
Sea Level Elevation 40 – 132 average sea level rise globally Crustal subsidence (sinking land)
Frost and Freeze/Thaw cycling predicted to decrease

Storm Surge (40 year return) in Atlantic Canada
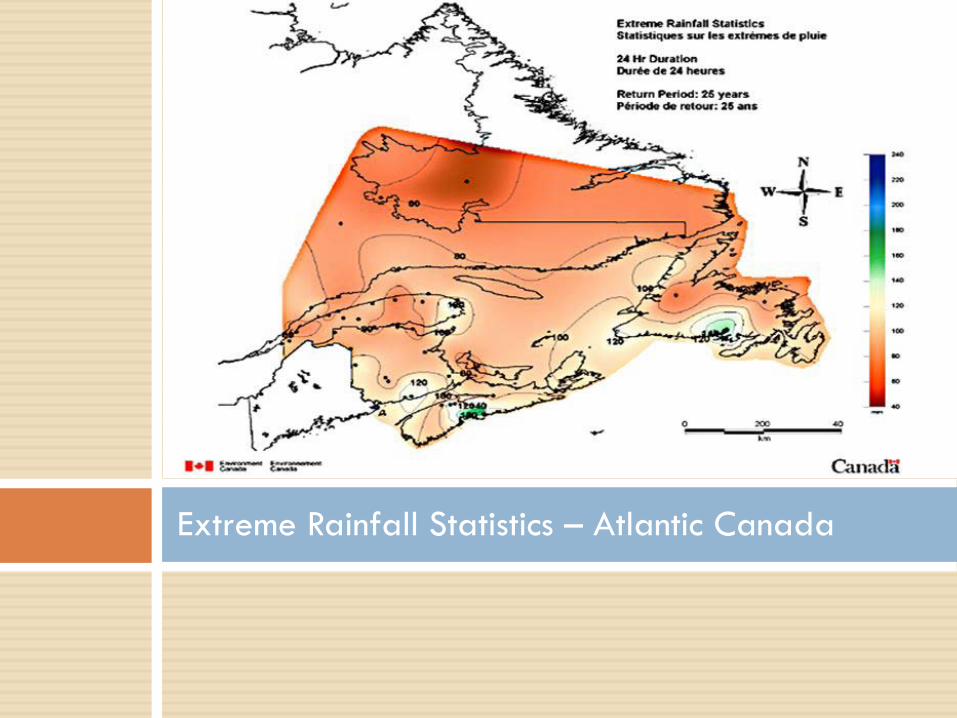
Extreme Rainfall Statistics – Atlantic Canada
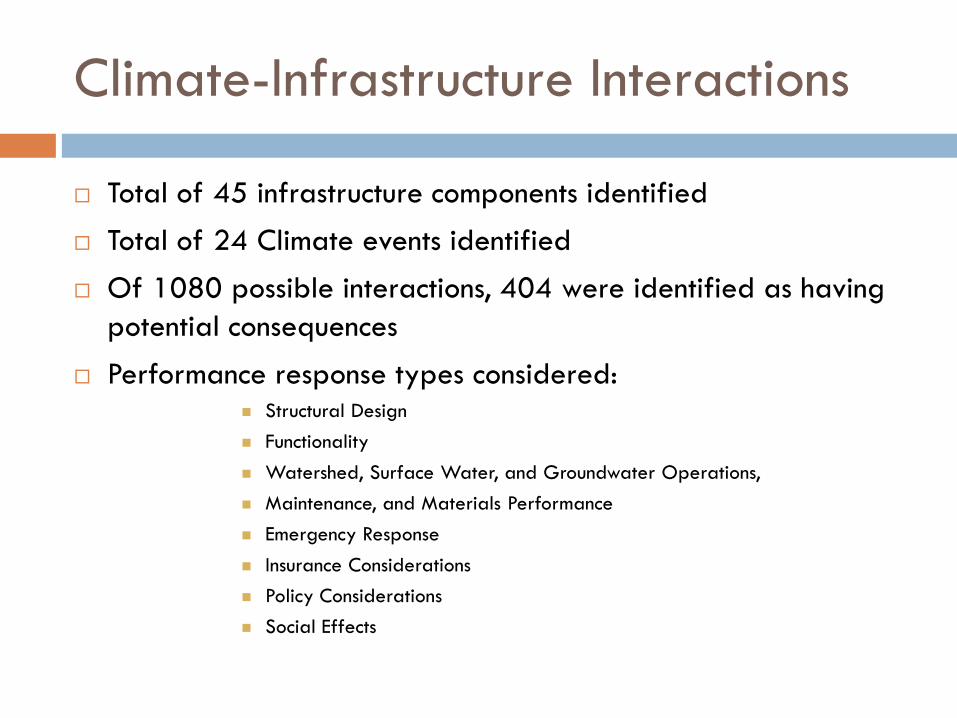
Climate-Infrastructure Interactions
Total of 45 infrastructure components identified Total of 24 Climate events identified Of 1080 possible interactions, 404 were identified as having
potential consequences
Performance response types considered: Structural Design Functionality Watershed, Surface Water, and Groundwater Operations, Maintenance, and Materials Performance Emergency Response Insurance Considerations Policy Considerations Social Effects

Risk Assessment
R = P x S
R: Risk
P: Probability
S: Severity
Engineering team conducted pre-assessment of risk using matrix
Modified workshop process to prioritize interactions discussed and to rank interactions as High/Medium/Low risk 14/404 interactions were High Risk 111/404 interactions were Medium Risk

Risk Assessment
Participants identified opportunities for mitigation and adaptive capacity: The majority of interactions related to power supply,
communications and access to infrastructure components during extreme climate events
SCADA complete with UPS and backup power system requirements identified
Shut-off for existing pumping station when seawater ingress experienced
Planned increases in maintenance due to climate events Installation of weather station at the plant site
Engineering Analysis
Much of the data required for the Engineering Analysis did not exist or was difficult to obtain
Professional judgment and experience was employed where data was not available
For the thirty-five (35) components for which potential vulnerabilities were identified 21 remedial engineering actions recommended 4 management actions being recommended

Summary of Recommendations
Reduce inflow and infiltration (I&I) into the collection system Install backup power supplies at the pumping stations Ensure the process building meets code for hurricane resistance
Install a radio communications system at the pumping stations and process building
Install high level pump shutoffs at the existing pumping station Install a bypass on the grit removal system
Implement a policy to protect staff from hurricanes, storm surges and ice storms
Discuss safe conditions for deliveries from septage hauling companies Adjust scheduling to accommodate required maintenance

Recommendations
Existing / New Pumping Stations Remedial engineering or operation actions required: Provide permanent back-up power at the new pumping
station Provide temporary back-up (portable genset
receptacle) power at the existing pumping station Provide salinity sensor and/or high-high level float to
disable pump stations in the event of saltwater intrusion or storm surge
Provide radio based SCADA / telemetry system to communication disruptions during extreme events (locate mast to avoid tree fall damage)

PIEVC at the Design Stage
This project is small, and PIEVC was implemented at the pre-design stage: The Protocol as presented was a useful complement to
the pre-design process and assisted in site selection, technology selection and design of components.
It was difficult to assess the detailed system components at such an early stage in the design process.
The Protocol is currently ‘one-size-fits-all’ but if was flexible enough to adapt it to fit our purpose

Questions?