sandvik q3 2013 presentation interim report on third quarter 2013 4 invoicing growth vs. q3 2012 pie...
TRANSCRIPT
Sandvik third quarter 20131
SandvikInterim report on third quarter 2013
Stabilized demand
SandvikInterim report on third quarter 2013
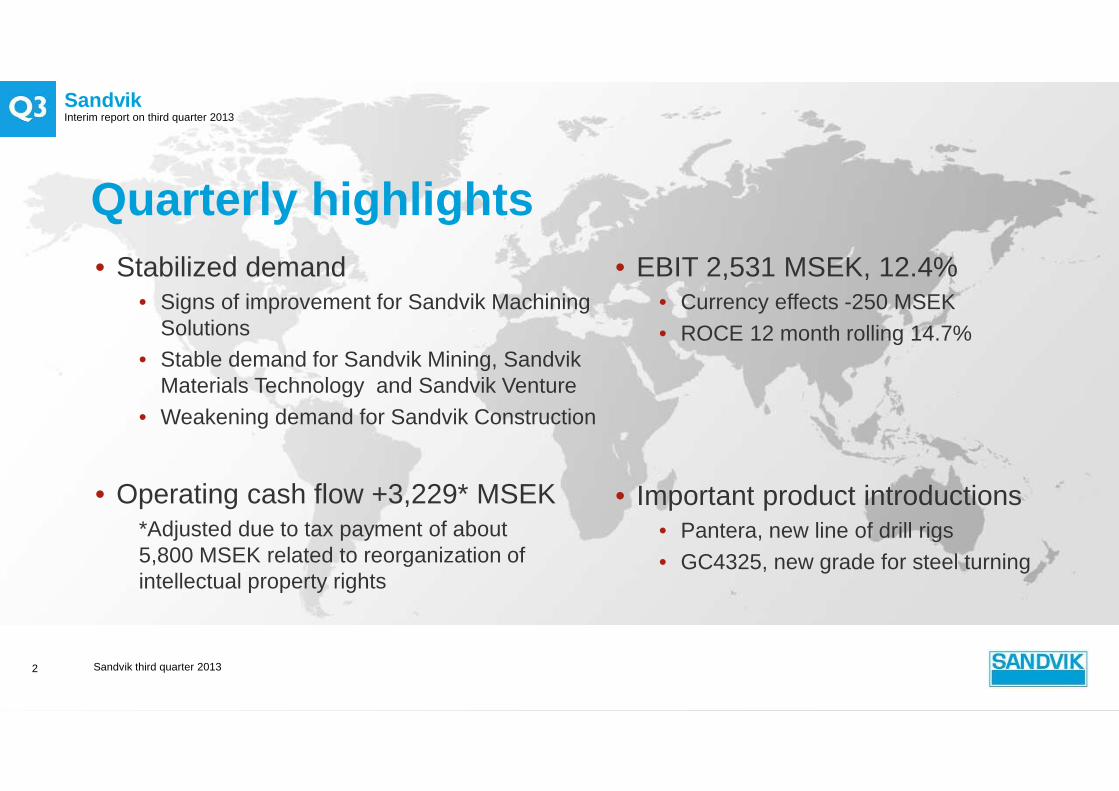
Quarterly highlights• EBIT 2,531 MSEK, 12.4%
• Currency effects -250 MSEK
• ROCE 12 month rolling 14.7%
• Important product introductions• Pantera, new line of drill rigs
• GC4325, new grade for steel turning
Sandvik third quarter 20132
• Stabilized demand• Signs of improvement for Sandvik Machining
Solutions • Stable demand for Sandvik Mining, Sandvik
Materials Technology and Sandvik Venture
• Weakening demand for Sandvik Construction
• Operating cash flow +3,229* MSEK*Adjusted due to tax payment of about 5,800 MSEK related to reorganization of intellectual property rights
SandvikInterim report on third quarter 2013
Sandvik third quarter 20133
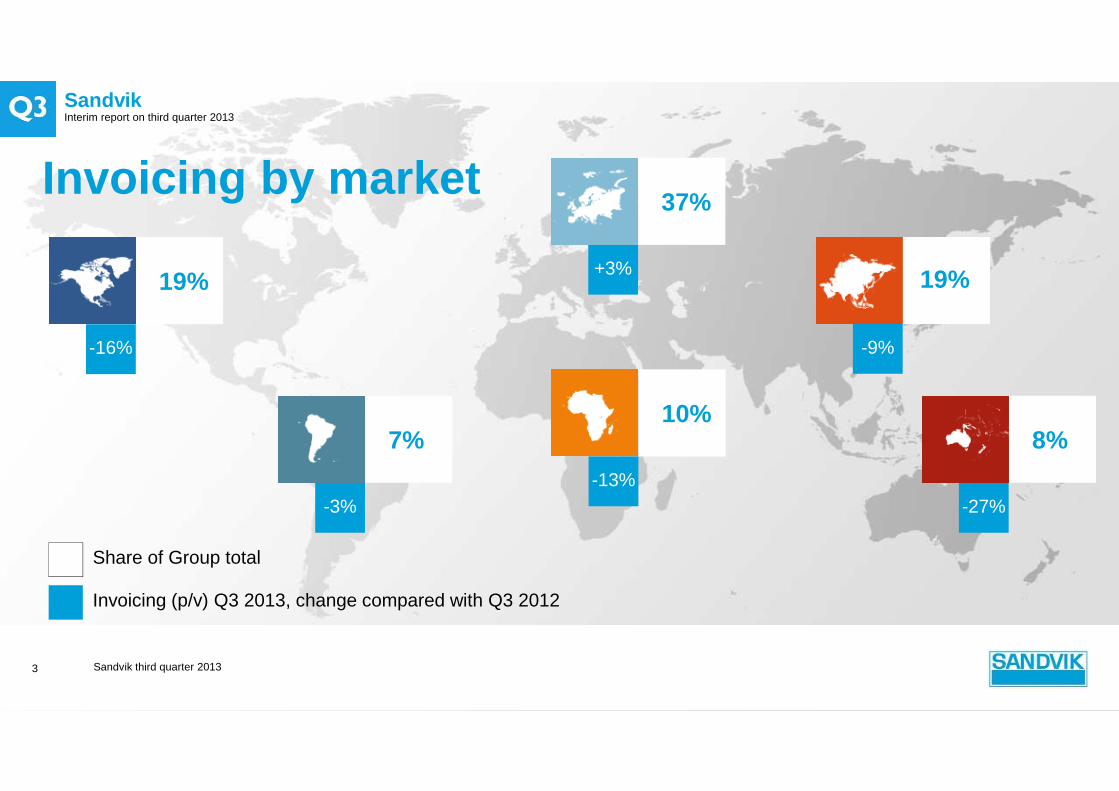
Share of Group total
Invoicing (p/v) Q3 2013, change compared with Q3 2012
19%
-16%
19%
-9%
37%
+3%
8%
-27%
10%
-13%
7%
-3%
Invoicing by market

SandvikInterim report on third quarter 2013
4
Invoicing growth vs. Q3 2012
Pie chart representing share of invoicing 2012
-10 to 0%
0 to 10%
> 10%
< -10%
Demand trend compared to preceding quarter
Energy
Automotive
Other
Engineering
Construction
Aerospace
Consumer related
MiningCustomer segments
Sandvik third quarter 2013
SandvikInterim report on third quarter 2013
-50%
-25%
0%
25%
50%
75%
100%
125%
150%
-10 000
-5 000
0
5 000
10 000
15 000
20 000
25 000
30 000
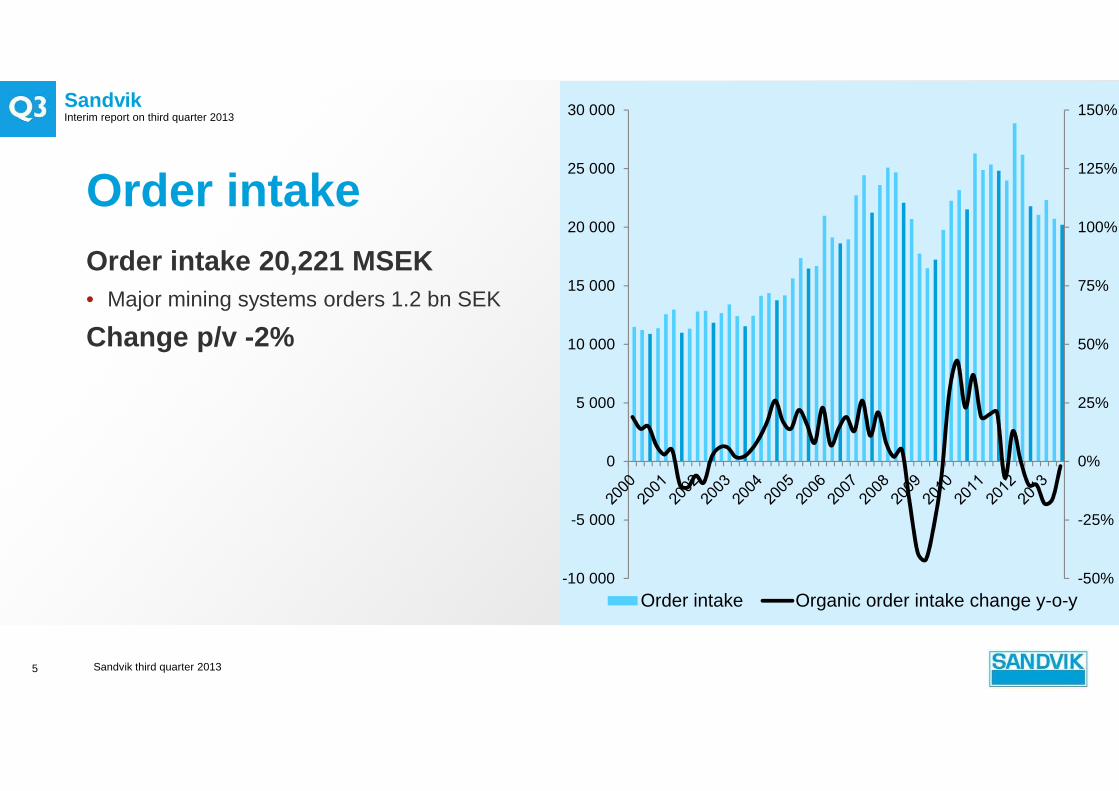
Order intake Organic order intake change y-o-y
Order intakeOrder intake 20,221 MSEK• Major mining systems orders 1.2 bn SEK
Change p/v -2%
Sandvik third quarter 20135
SandvikInterim report on third quarter 2013
-40%
-20%
0%
20%
40%
60%
80%
100%
120%
-10 000
-5 000
0
5 000
10 000
15 000
20 000
25 000
30 000
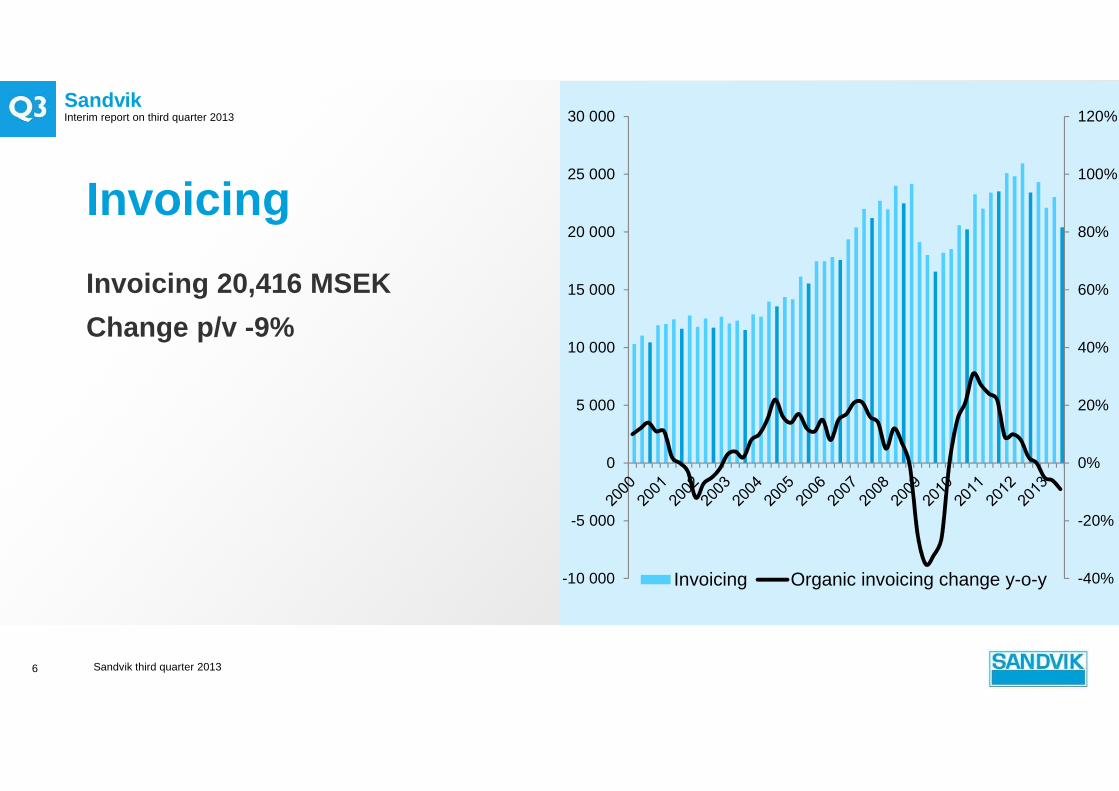
Invoicing Organic invoicing change y-o-y
Invoicing
Invoicing 20,416 MSEK
Change p/v -9%
Sandvik third quarter 20136
SandvikInterim report on third quarter 2013
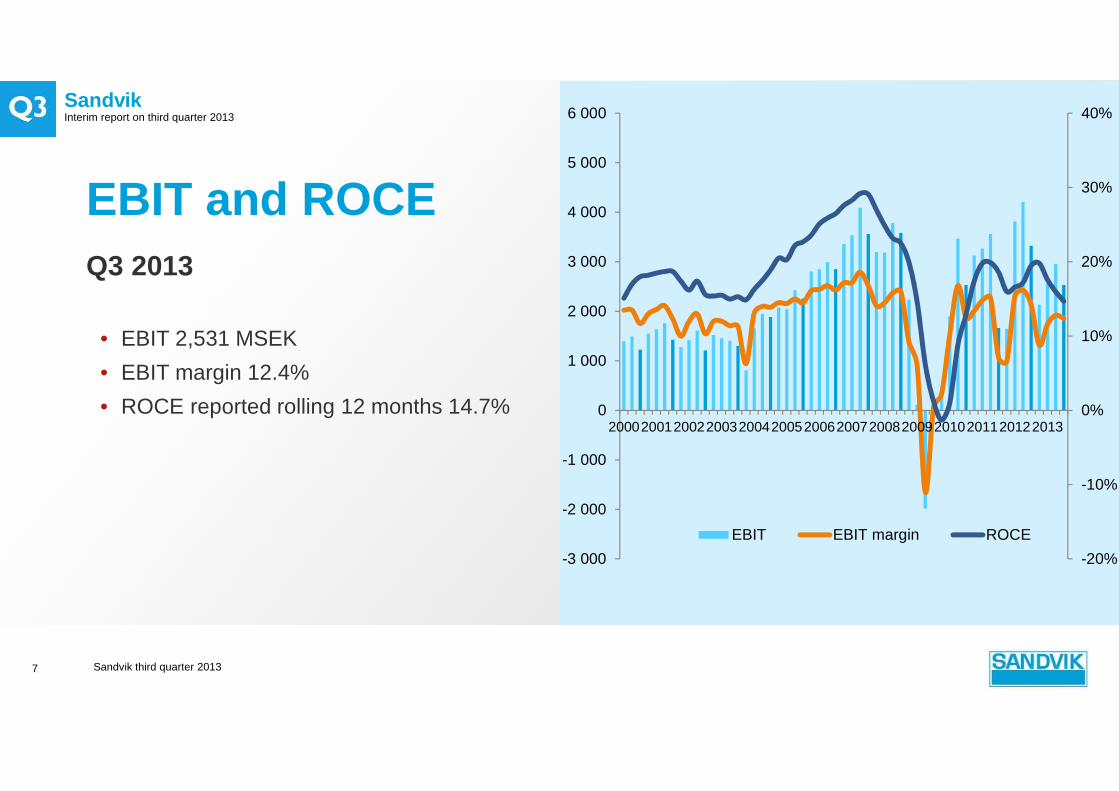
EBIT and ROCEQ3 2013
• EBIT 2,531 MSEK
• EBIT margin 12.4%
• ROCE reported rolling 12 months 14.7%
Sandvik third quarter 20137
-20%
-10%
0%
10%
20%
30%
40%
-3 000
-2 000
-1 000
0
1 000
2 000
3 000
4 000
5 000
6 000
20002001200220032004200520062007200820092010201120122013
EBIT EBIT margin ROCE
SandvikInterim report on third quarter 2013
0%
50%
100%
150%
200%
250%
300%
350%
0
500
1 000
1 500
2 000
2 500
3 000
3 500
4 000
4 500
5 000
2007 2008 2009 2010 2011 2012 2013
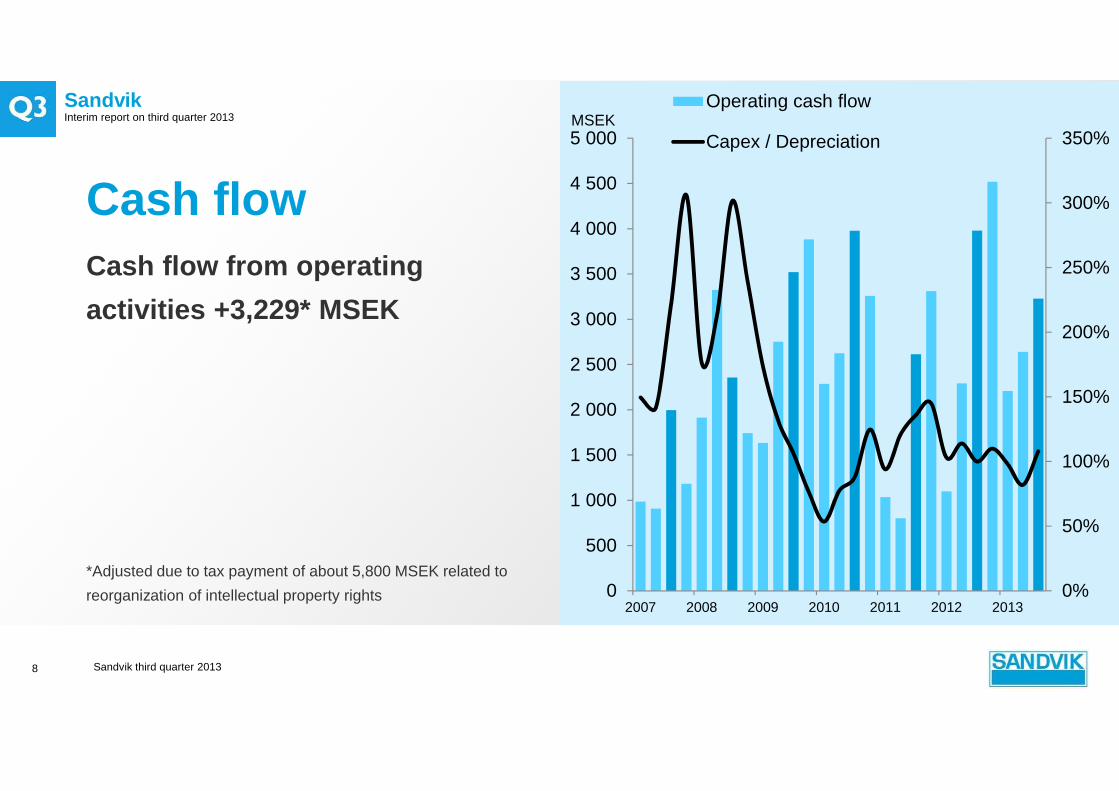
Operating cash flow
Capex / Depreciation
Cash flowCash flow from operating
activities +3,229* MSEK
*Adjusted due to tax payment of about 5,800 MSEK related to
reorganization of intellectual property rights
Sandvik third quarter 20138
MSEK
SandvikInterim report on third quarter 2013
Sandvik third quarter 20139
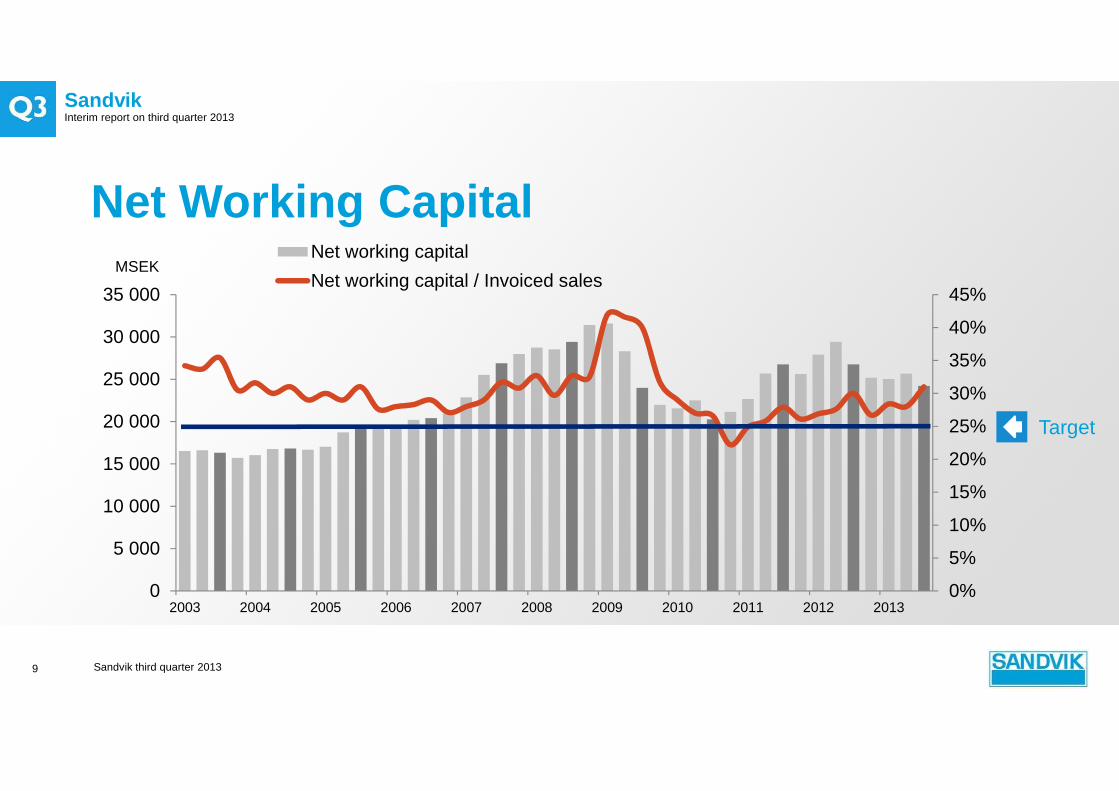
Net Working Capital
Target
0%
5%
10%
15%
20%
25%
30%
35%
40%
45%
0
5 000
10 000
15 000
20 000
25 000
30 000
35 000
2003 2004 2005 2006 2007 2008 2009 2010 2011 2012 2013
Net working capital
Net working capital / Invoiced salesMSEK

SandvikInterim report on third quarter 2013
Bridge analysis
Sandvik third quarter 201310
MSEK Q3 2012Price/
volume/Productivity
CurrencyStructure, one-offs*
Q3 2013
Sandvik Group
Invoiced sales 23,424 -2,020 -990 - 20,416
EBIT 3,325 -550 -250 +10 2,531
EBIT margin 14.2% -27% 12.4%
* Includes metal price effects
SandvikInterim report on third quarter 2013
11
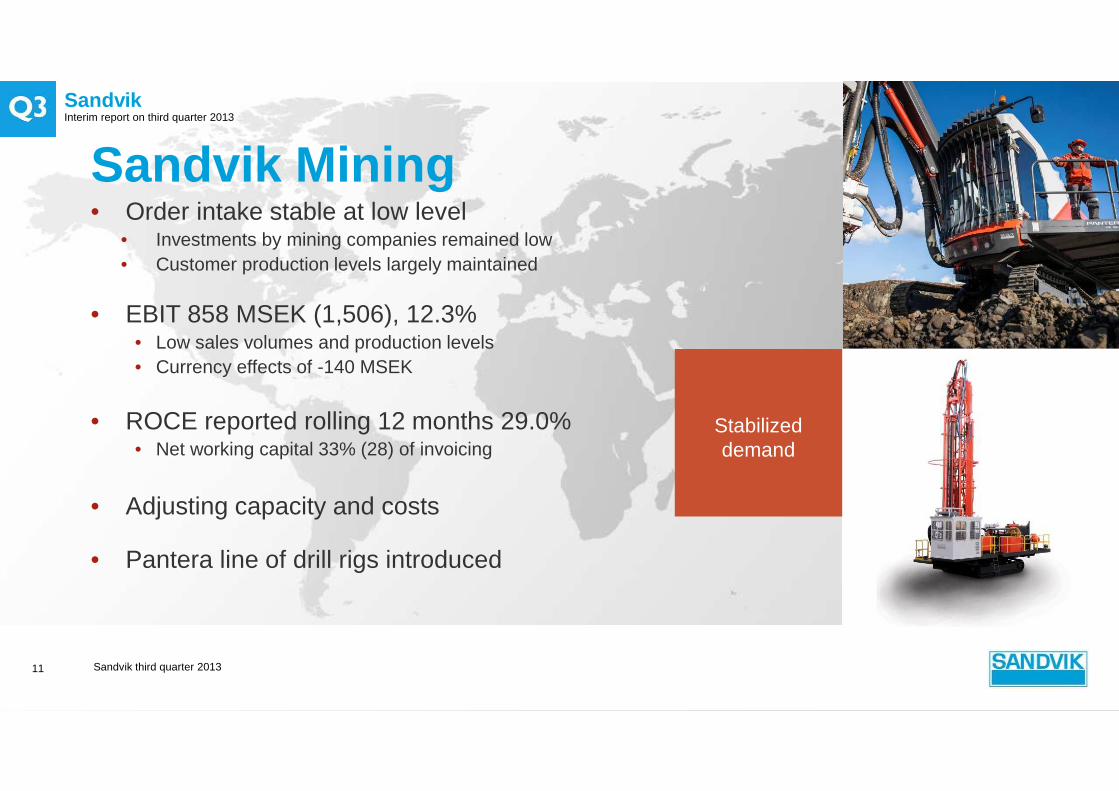
Sandvik Mining
Stabilized demand
• Order intake stable at low level• Investments by mining companies remained low• Customer production levels largely maintained
• EBIT 858 MSEK (1,506), 12.3%• Low sales volumes and production levels• Currency effects of -140 MSEK
• ROCE reported rolling 12 months 29.0%• Net working capital 33% (28) of invoicing
• Adjusting capacity and costs
• Pantera line of drill rigs introduced
Sandvik third quarter 2013
SandvikInterim report on third quarter 2013
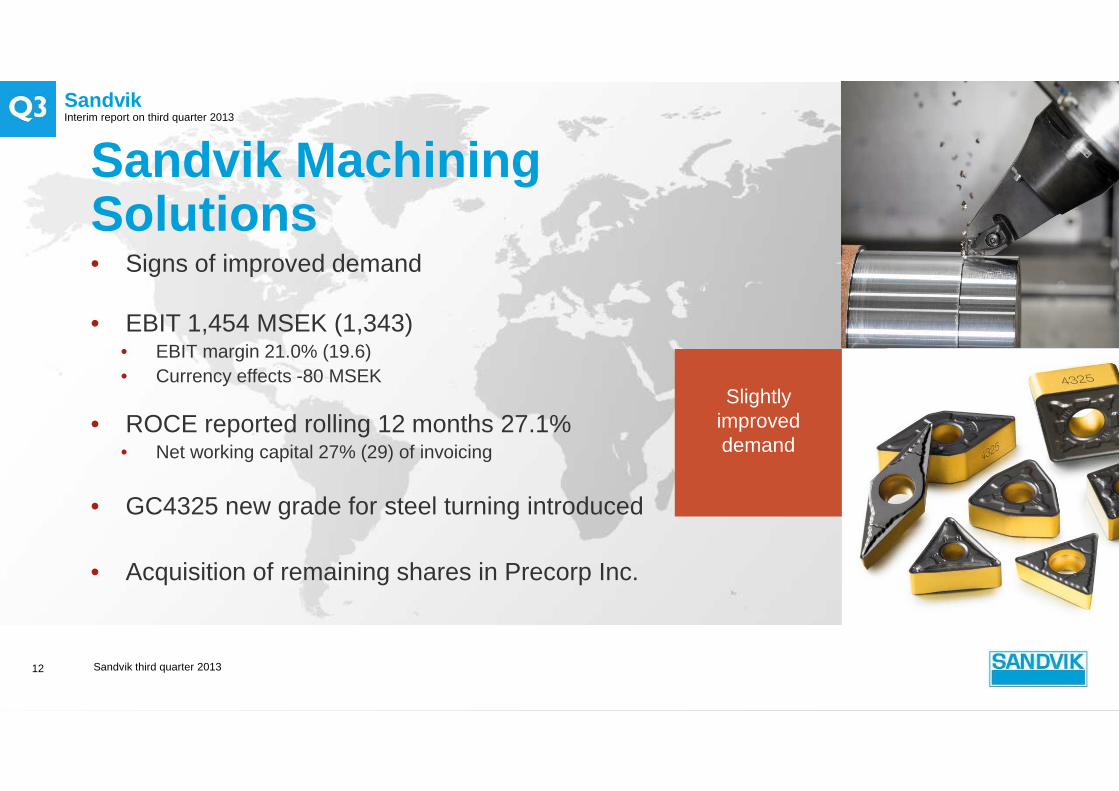
• Signs of improved demand
• EBIT 1,454 MSEK (1,343)• EBIT margin 21.0% (19.6)• Currency effects -80 MSEK
• ROCE reported rolling 12 months 27.1%• Net working capital 27% (29) of invoicing
• GC4325 new grade for steel turning introduced
• Acquisition of remaining shares in Precorp Inc.
Sandvik third quarter 201312
Sandvik MachiningSolutions
Slightly improved demand

SandvikInterim report on third quarter 2013
• Sandvik Materials Technology• Adjusted EBIT excluding metal price effects 265 MSEK, 8.2%• Continued high activity in oil and gas• Inventory reduction
• Sandvik Construction• EBIT 88 MSEK, 4.3%• Weaker demand
• Sandvik Venture• EBIT 199 MSEK, 15.9%• Acquisition of TechnoPartner Samtronic
13
Mixed demand
Sandvik third quarter 2013
SandvikInterim report on third quarter 2013
Summary Q3 2013
14
• Stabilized demand
• Maintained profitability level
• Significant product introductions
Sandvik third quarter 2013
SandvikInterim report on third quarter 2013
15
Prof. Olle WijkHead of Sandvik Group R&D
Sandvik third quarter 2013

SandvikInterim report on third quarter 2013
Sandvik third quarter 201316
Today
Ambition
New Sales Ratio
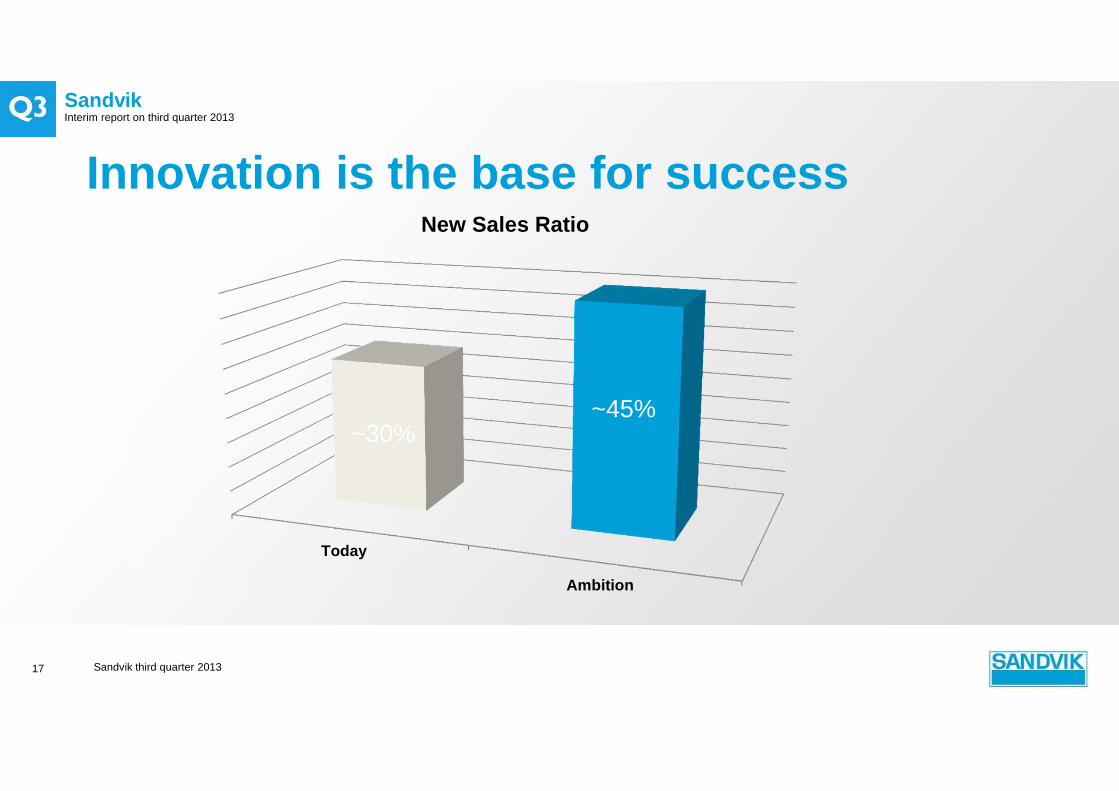
Innovation is the base for success
~30%
SandvikInterim report on third quarter 2013
Sandvik third quarter 201317
Today
Ambition
New Sales Ratio
Innovation is the base for success
~30%~45%
SandvikInterim report on third quarter 2013
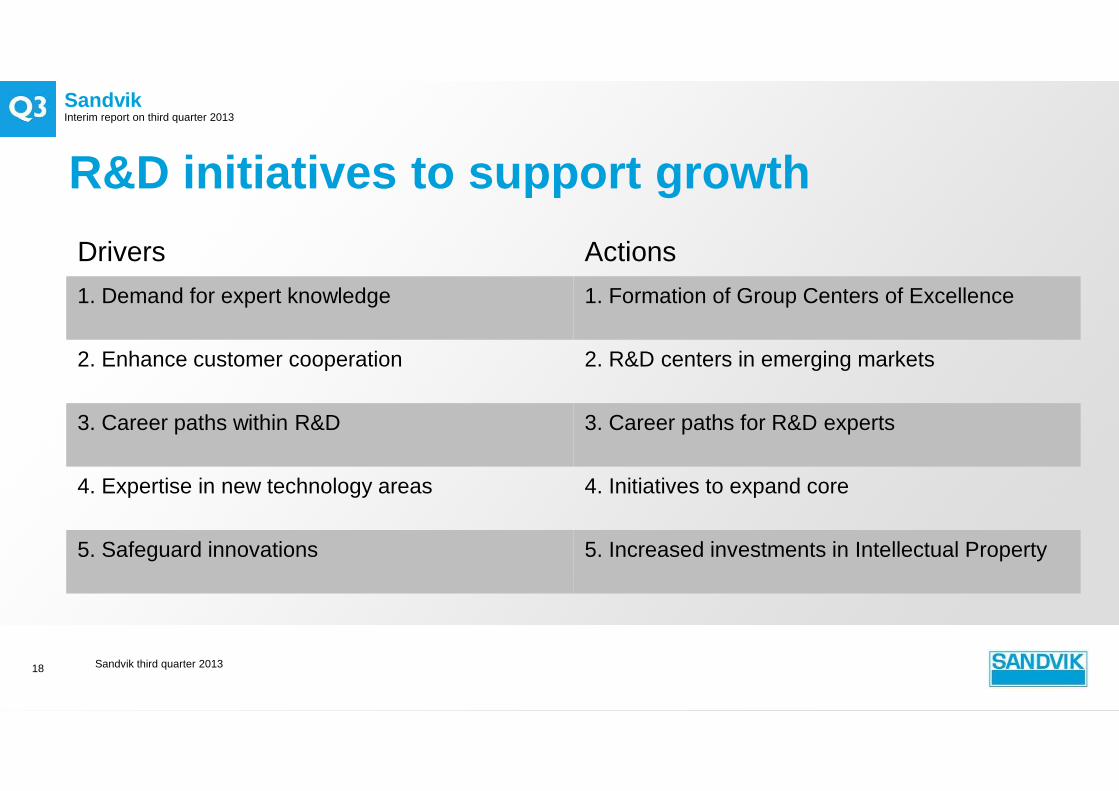
Drivers Actions
1. Demand for expert knowledge 1. Formation of Group Centers of Excellence
2. Enhance customer cooperation 2. R&D centers in emerging markets
3. Career paths within R&D 3. Career paths for R&D experts
4. Expertise in new technology areas 4. Initiatives to expand core
5. Safeguard innovations 5. Increased investments in Intellectual Property
Sandvik third quarter 201318
R&D initiatives to support growth
19
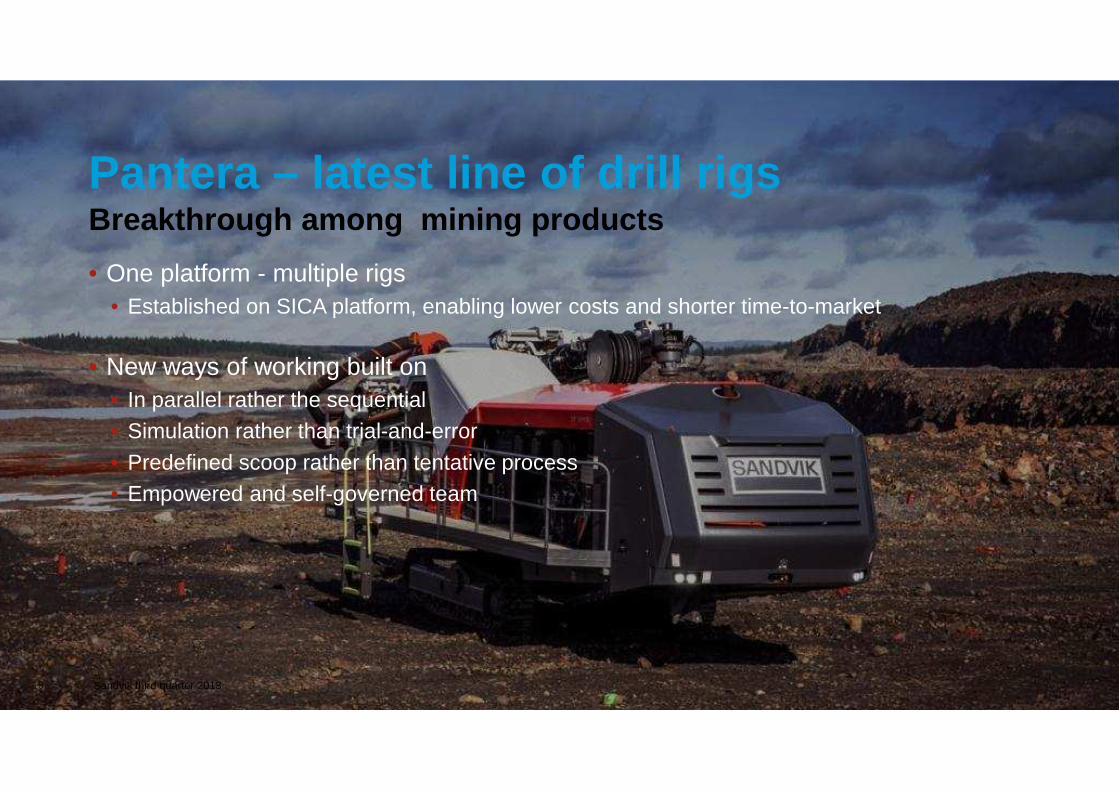
• One platform - multiple rigs• Established on SICA platform, enabling lower costs and shorter time-to-market
• New ways of working built on• In parallel rather the sequential• Simulation rather than trial-and-error
• Predefined scoop rather than tentative process• Empowered and self-governed team
Breakthrough among mining productsPantera – latest line of drill rigs
Sandvik third quarter 2013

SandvikInterim report on third quarter 2013
Sandvik third quarter 201320
High forces and temperatures
SandvikInterim report on third quarter 2013
Sandvik third quarter 201321
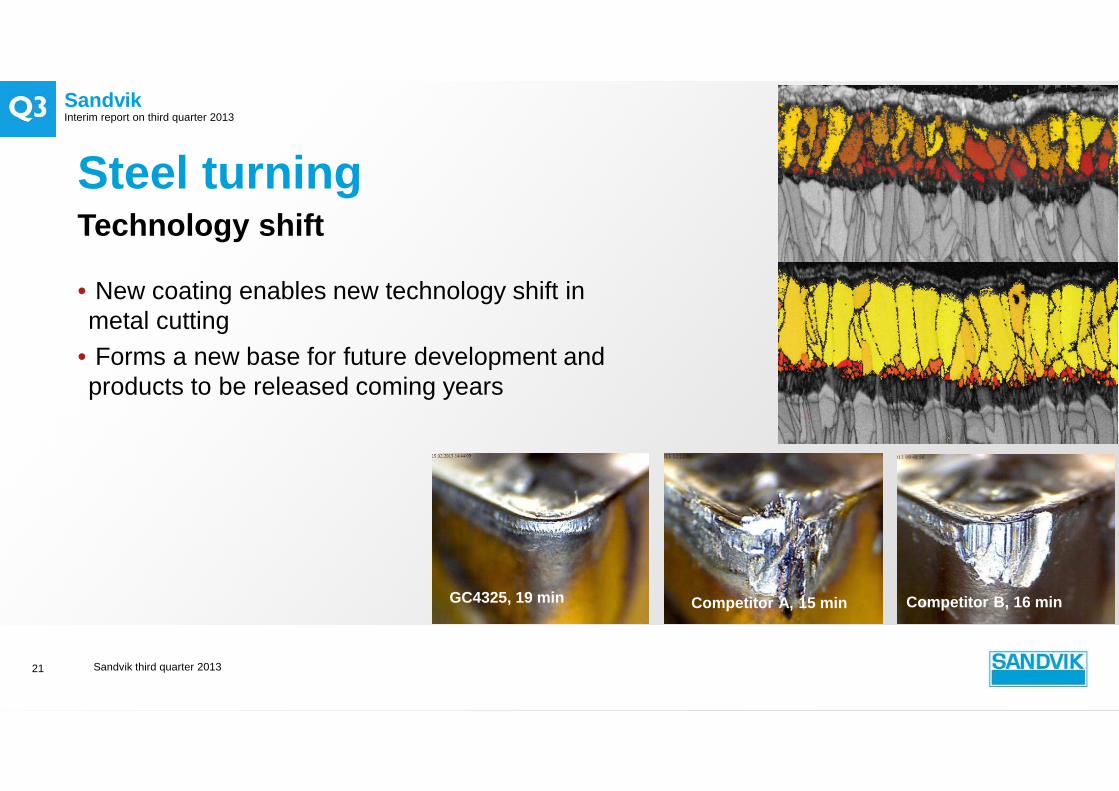
• New coating enables new technology shift in metal cutting
• Forms a new base for future development and products to be released coming years
Technology shift
Steel turning
GC4325, 19 min Competitor A, 15 min Competitor B, 16 min

Additive manufacturing at a glanceManufacturing by design
22 Sandvik third quarter 2013
Sandvik third quarter 201323
“Sandvik has earned the distinct honor of being one of the world's most innovative companies, a Thomson
Reuters 2013 Top 100 Global Innovator”
SandvikInterim report on third quarter 2013
24
Q&A
Sandvik third quarter 2013

SandvikInterim report on third quarter 2013
25
Back -up slides
Sandvik third quarter 2013

SandvikInterim report on third quarter 2013
Quarterly financials
26
MSEK Q3 2012 Q3 2013vs
Q3 2012
Order intake 21,795 20,221 -2%*
Invoicing 23,424 20,416 -9%*
EBIT 3,325 2,531 -24%
EBIT margin 14.2% 12.4% -
Operating cash flow +3,979 -2 571 Neg.
Cash flow after investing activities +3,173 -3 603 100%
* Change in price/volume
Sandvik third quarter 2013

SandvikInterim report on third quarter 2013
Sandvik MiningQ3 2013
• Order intake 7,033 MSEK
• Invoicing 6,961 MSEK
• EBIT 858 MSEK
• ROCE 29.0%
Sandvik third quarter 201327
-10%
0%
10%
20%
30%
40%
50%
-2 000
0
2 000
4 000
6 000
8 000
10 000
2007 2008 2009 2010 2011 2012 2013
Invoicing EBIT margin ROCE 12 months
MSEK
SandvikInterim report on third quarter 2013
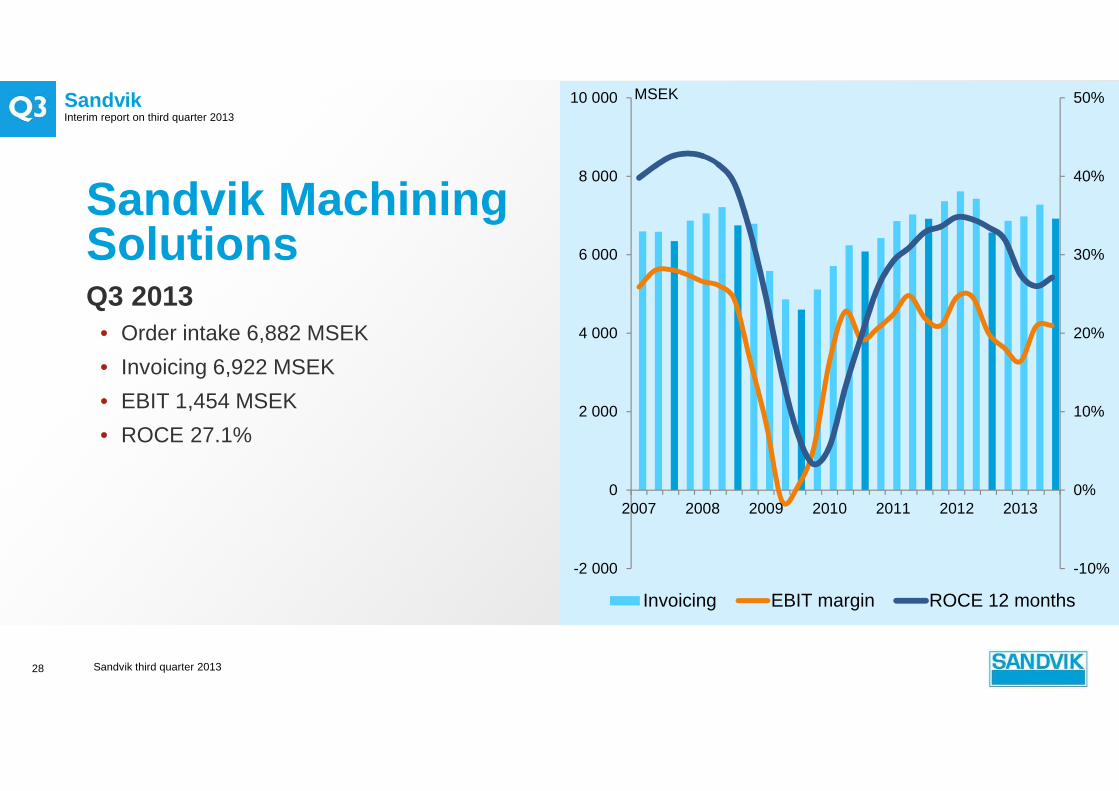
Sandvik MachiningSolutionsQ3 2013
• Order intake 6,882 MSEK
• Invoicing 6,922 MSEK
• EBIT 1,454 MSEK
• ROCE 27.1%
Sandvik third quarter 201328
-10%
0%
10%
20%
30%
40%
50%
-2 000
0
2 000
4 000
6 000
8 000
10 000
2007 2008 2009 2010 2011 2012 2013
Invoicing EBIT margin ROCE 12 months
MSEK
SandvikInterim report on third quarter 2013
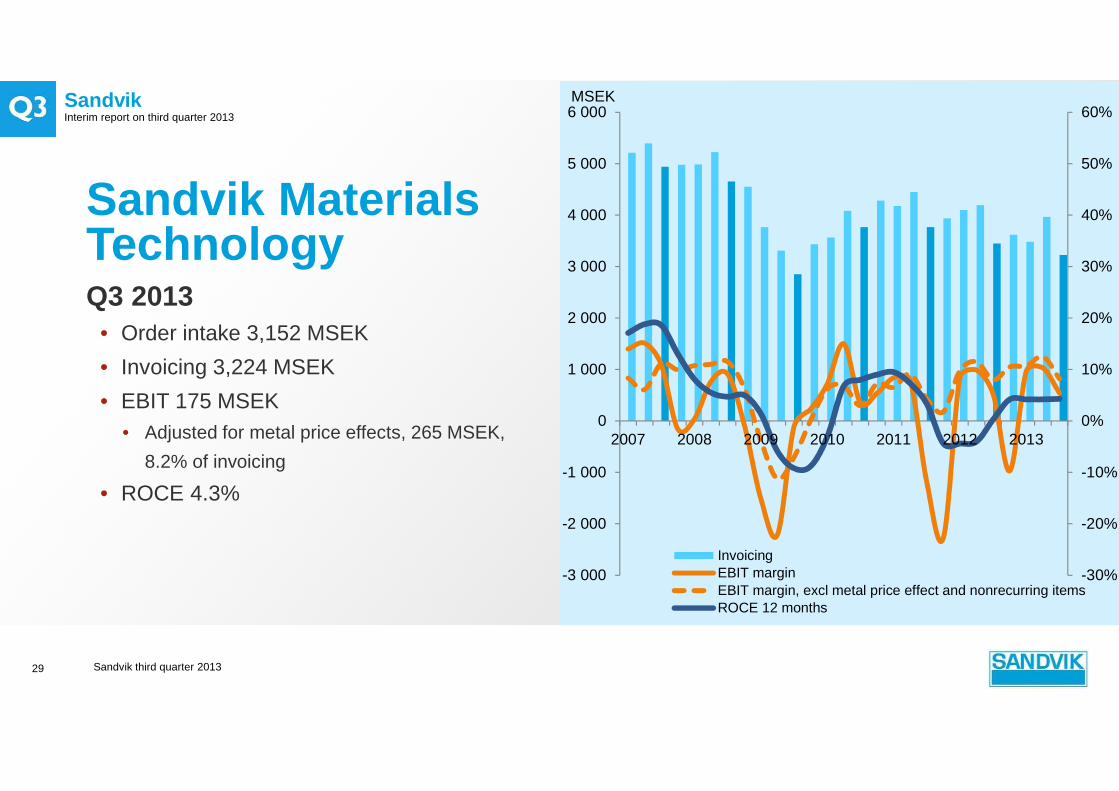
Q3 2013• Order intake 3,152 MSEK
• Invoicing 3,224 MSEK
• EBIT 175 MSEK• Adjusted for metal price effects, 265 MSEK,
8.2% of invoicing
• ROCE 4.3%
Sandvik third quarter 201329
Sandvik Materials Technology
-30%
-20%
-10%
0%
10%
20%
30%
40%
50%
60%
-3 000
-2 000
-1 000
0
1 000
2 000
3 000
4 000
5 000
6 000
2007 2008 2009 2010 2011 2012 2013
InvoicingEBIT marginEBIT margin, excl metal price effect and nonrecurring itemsROCE 12 months
MSEK
SandvikInterim report on third quarter 2013
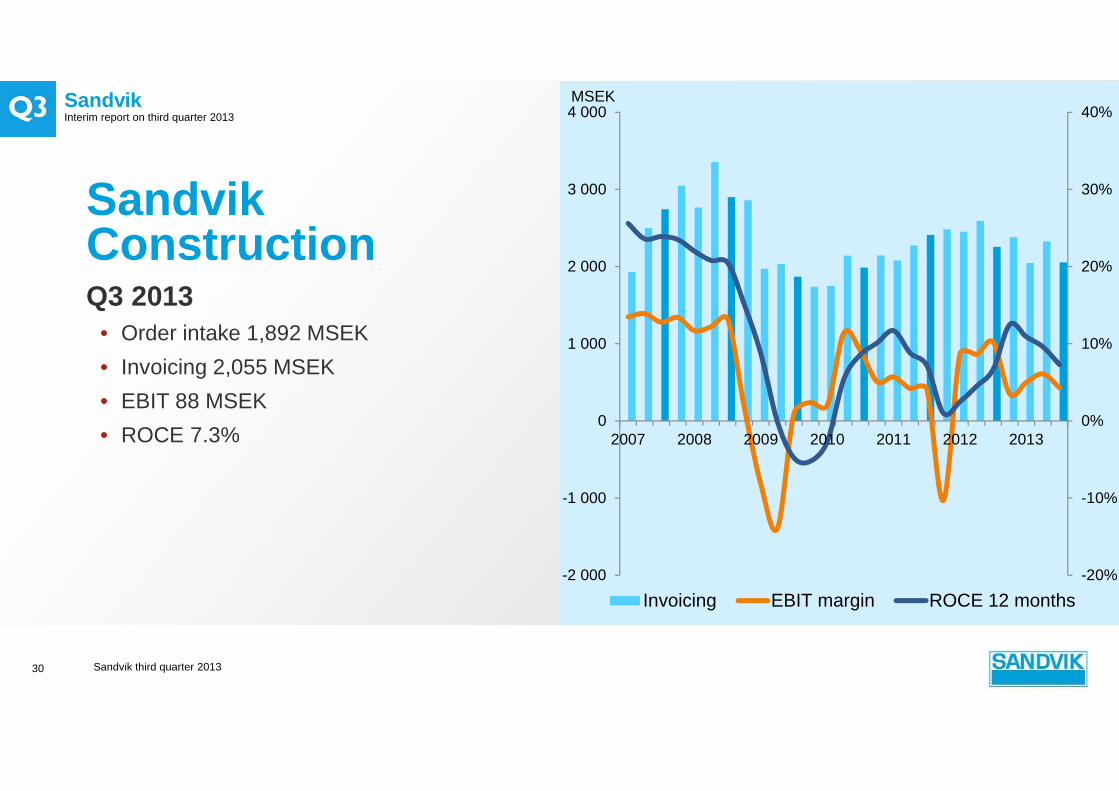
Q3 2013• Order intake 1,892 MSEK
• Invoicing 2,055 MSEK
• EBIT 88 MSEK
• ROCE 7.3%
Sandvik third quarter 201330
Sandvik Construction
-20%
-10%
0%
10%
20%
30%
40%
-2 000
-1 000
0
1 000
2 000
3 000
4 000
2007 2008 2009 2010 2011 2012 2013
Invoicing EBIT margin ROCE 12 months
MSEK
SandvikInterim report on third quarter 2013
Sandvik third quarter 201331
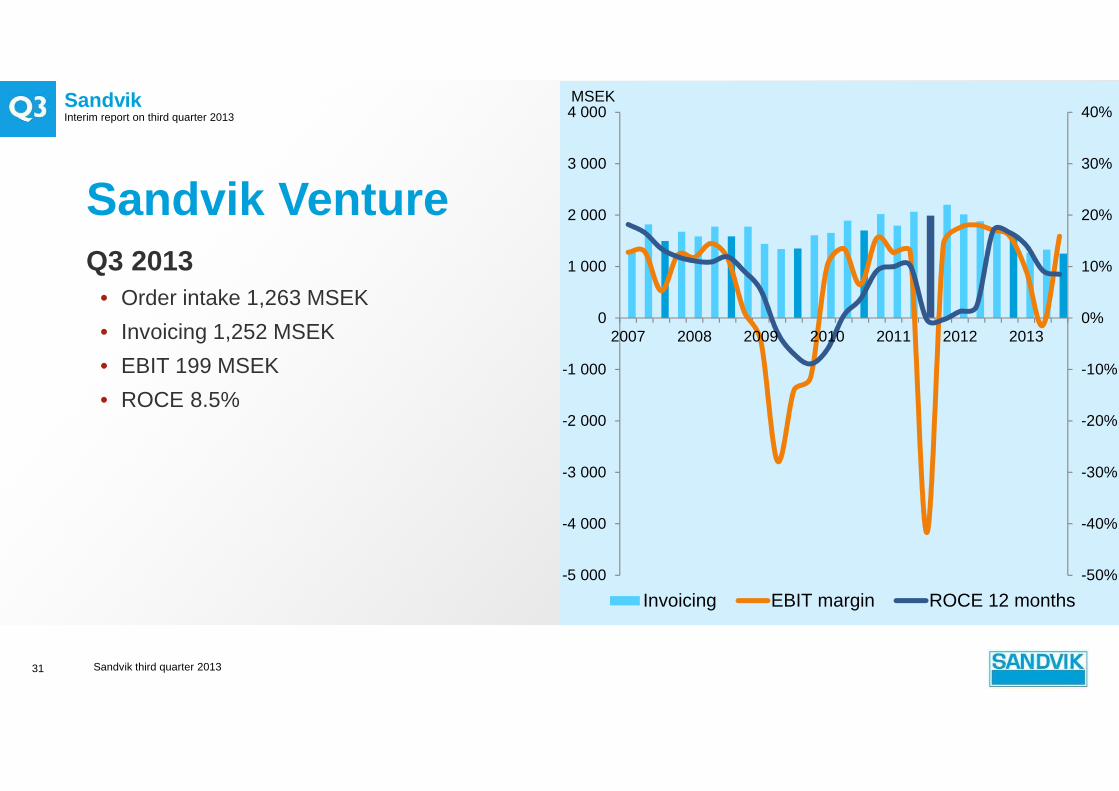
Sandvik VentureQ3 2013
• Order intake 1,263 MSEK
• Invoicing 1,252 MSEK
• EBIT 199 MSEK
• ROCE 8.5%
-50%
-40%
-30%
-20%
-10%
0%
10%
20%
30%
40%
-5 000
-4 000
-3 000
-2 000
-1 000
0
1 000
2 000
3 000
4 000
2007 2008 2009 2010 2011 2012 2013
Invoicing EBIT margin ROCE 12 months
MSEK
SandvikInterim report on third quarter 2013
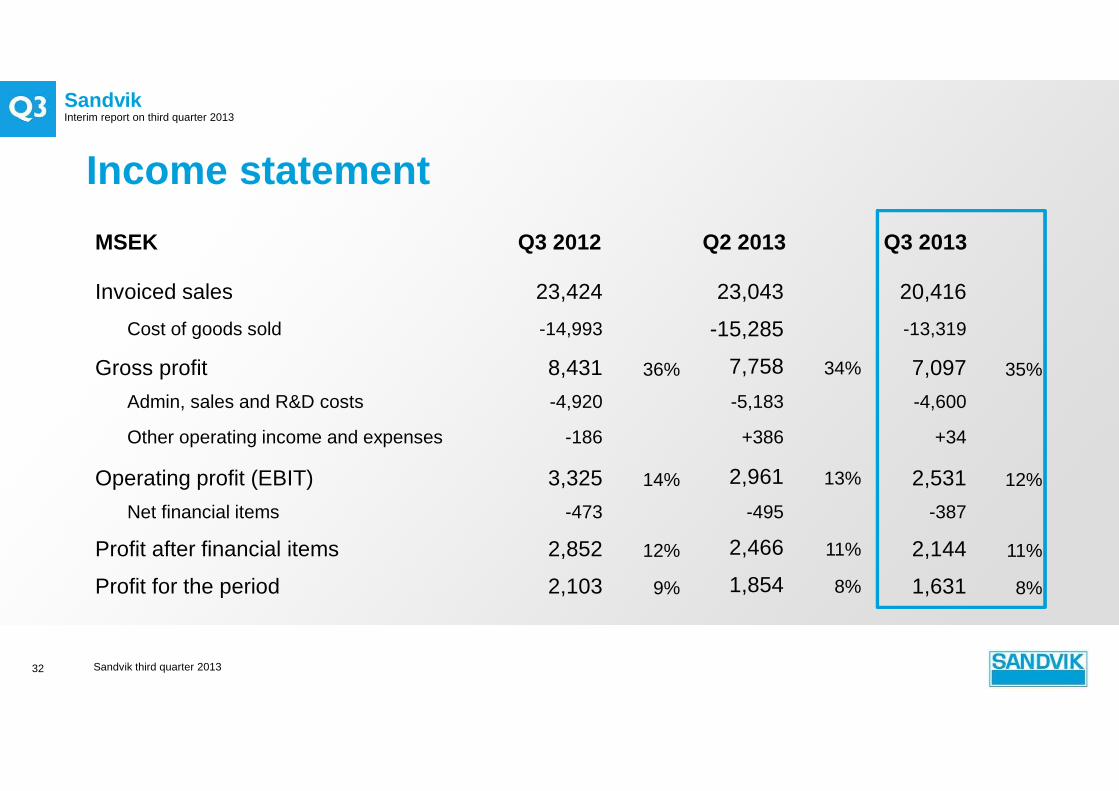
Income statement
Sandvik third quarter 201332
MSEK Q3 2012 Q2 2013 Q3 2013
Invoiced sales 23,424 23,043 20,416
Cost of goods sold -14,993 -15,285 -13,319
Gross profit 8,431 36% 7,758 34% 7,097 35%
Admin, sales and R&D costs -4,920 -5,183 -4,600
Other operating income and expenses -186 +386 +34
Operating profit (EBIT) 3,325 14% 2,961 13% 2,531 12%
Net financial items -473 -495 -387
Profit after financial items 2,852 12% 2,466 11% 2,144 11%
Profit for the period 2,103 9% 1,854 8% 1,631 8%

SandvikInterim report on third quarter 2013
Sandvik third quarter 201333
MSEK Q3 2012Price/volume/
productivityCurrency
Structure, one-offs
Q3 2013
Sandvik Mining
Invoiced sales 9,485 -1,920 -600 - 6,961
EBIT 1,506 -500 -140 - 858
EBIT margin 16% -26% 12%
Sandvik Machining Solutions
Invoiced sales 6,845 +250 -180 - 6,922
EBIT 1,343 +190 -80 - 1,454
EBIT margin 20% 76% 21%
Sandvik Materials Technology
Invoiced sales 3,450 -130 -100 - 3,224
EBIT 180 +25 -40 +10 175
EBIT margin 5% N/A 5%
Bridge analysis
SandvikInterim report on third quarter 2013
Sandvik third quarter 201334
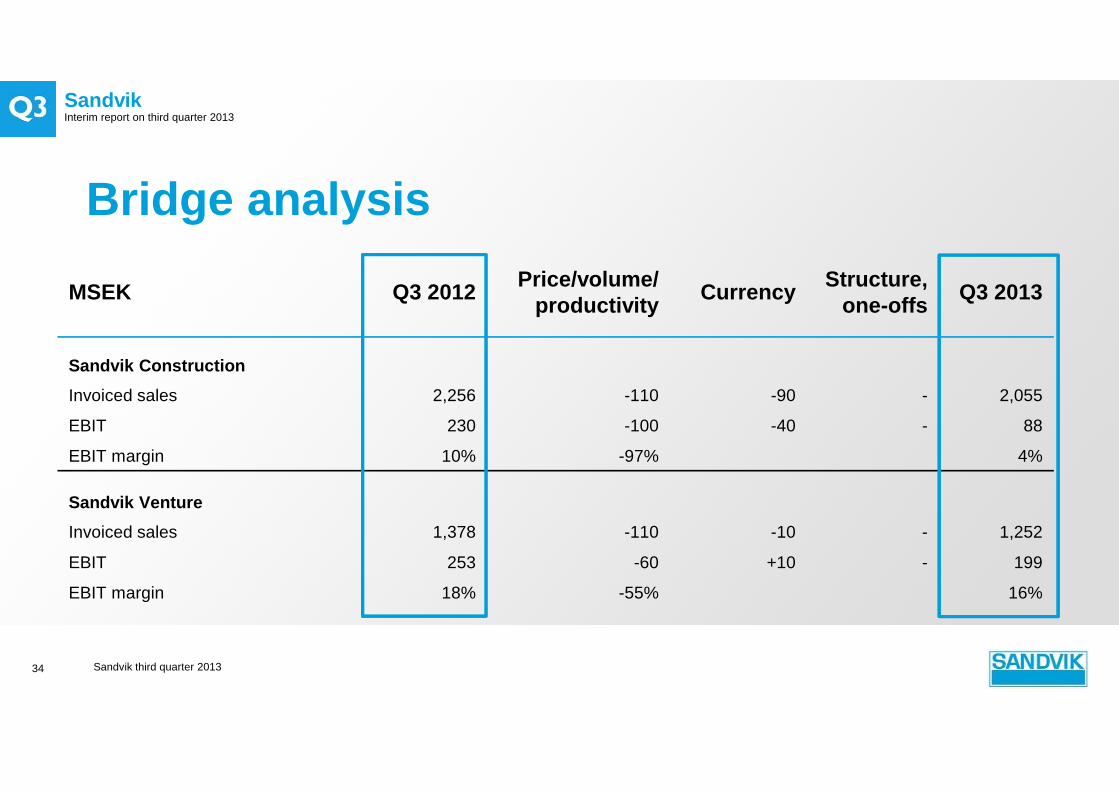
Bridge analysis
MSEK Q3 2012Price/volume/
productivityCurrency
Structure, one-offs
Q3 2013
Sandvik Construction
Invoiced sales 2,256 -110 -90 - 2,055
EBIT 230 -100 -40 - 88
EBIT margin 10% -97% 4%
Sandvik Venture
Invoiced sales 1,378 -110 -10 - 1,252
EBIT 253 -60 +10 - 199
EBIT margin 18% -55% 16%

SandvikInterim report on third quarter 2013
Balance sheet
Sandvik third quarter 201335
MSEK Q3 2012 Q2 2013 Q3 2013 vsQ3 2012
Intangible fixed assets 11 340 11,673 11,484 +1%
Tangible fixed assets 25 398 25,057 24,779 -2%
Financial fixed assets 6 598 7,613 7,866 +19%
Inventories 26 723 25,031 24,036 -10%
Receivables 22 977 22,067 19,925 -13%
Cash and cash equivalents 9 247 6,770 3,023 -67%
Total assets 102,283 98,211 91,113 -11%
Total equity 31,888 31,432 32,617 +2%
Interest-bearing liabilities 39,215 35,965 34,757 -11%
Non-interest-bearing liabilities 31,180 30,814 23,739 -24%
Total equity and liabilities 102,283 98,211 91,113 -11%

SandvikInterim report on third quarter 2013
Sandvik third quarter 201336
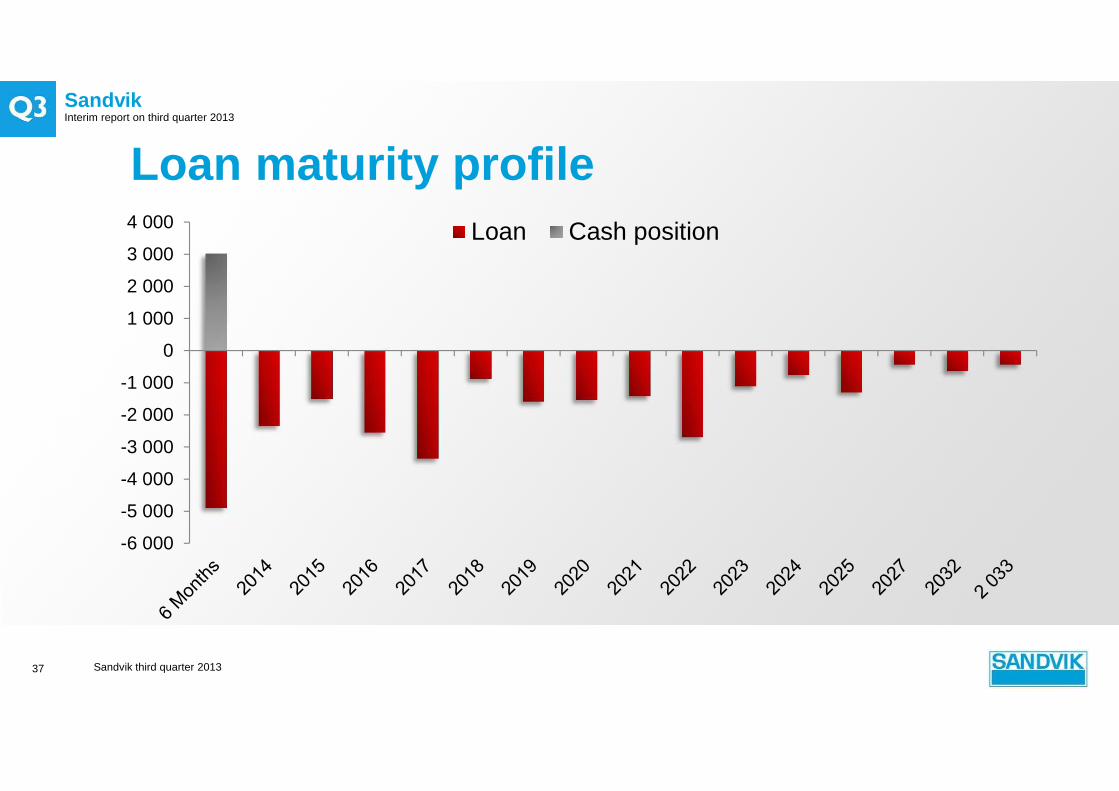
Long term 76% Amount MSEKAverage duration
US Private Placement 5,411 6 years
Fin institutions, EIB, NIB 2,633 8 years
Swedish MTN 6,685 5 years
European MTN 5,537 12 years
Bank loans 282 2 years
Share swap 1,778 2 years
Short term 24%
Commercial paper 0 0 months
Fin institutions, EIB, NIB 500 8 months
Swedish MTN 0 0 months
European MTN 4,266 5 months
Bank loans 2,342 8 months
Total 29,434 5 years
Cash position 3,023
Unutilized revolving credit facilities, 10,643 MSEK
Loan and duration profile
SandvikInterim report on third quarter 2013
Loan maturity profile
Sandvik third quarter 201337
-6 000
-5 000
-4 000
-3 000
-2 000
-1 000
0
1 000
2 000
3 000
4 000 Loan Cash position
SandvikInterim report on third quarter 2013
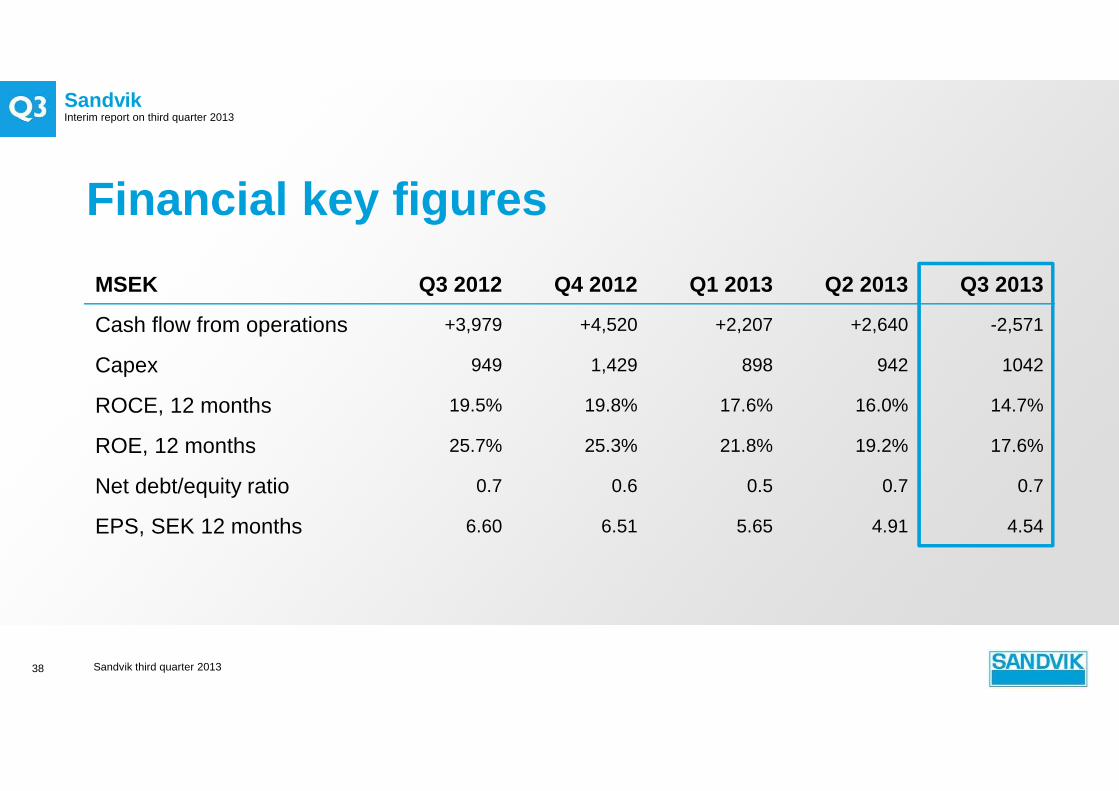
Financial key figures
Sandvik third quarter 201338
MSEK Q3 2012 Q4 2012 Q1 2013 Q2 2013 Q3 2013
Cash flow from operations +3,979 +4,520 +2,207 +2,640 -2,571
Capex 949 1,429 898 942 1042
ROCE, 12 months 19.5% 19.8% 17.6% 16.0% 14.7%
ROE, 12 months 25.7% 25.3% 21.8% 19.2% 17.6%
Net debt/equity ratio 0.7 0.6 0.5 0.7 0.7
EPS, SEK 12 months 6.60 6.51 5.65 4.91 4.54
SandvikInterim report on third quarter 2013
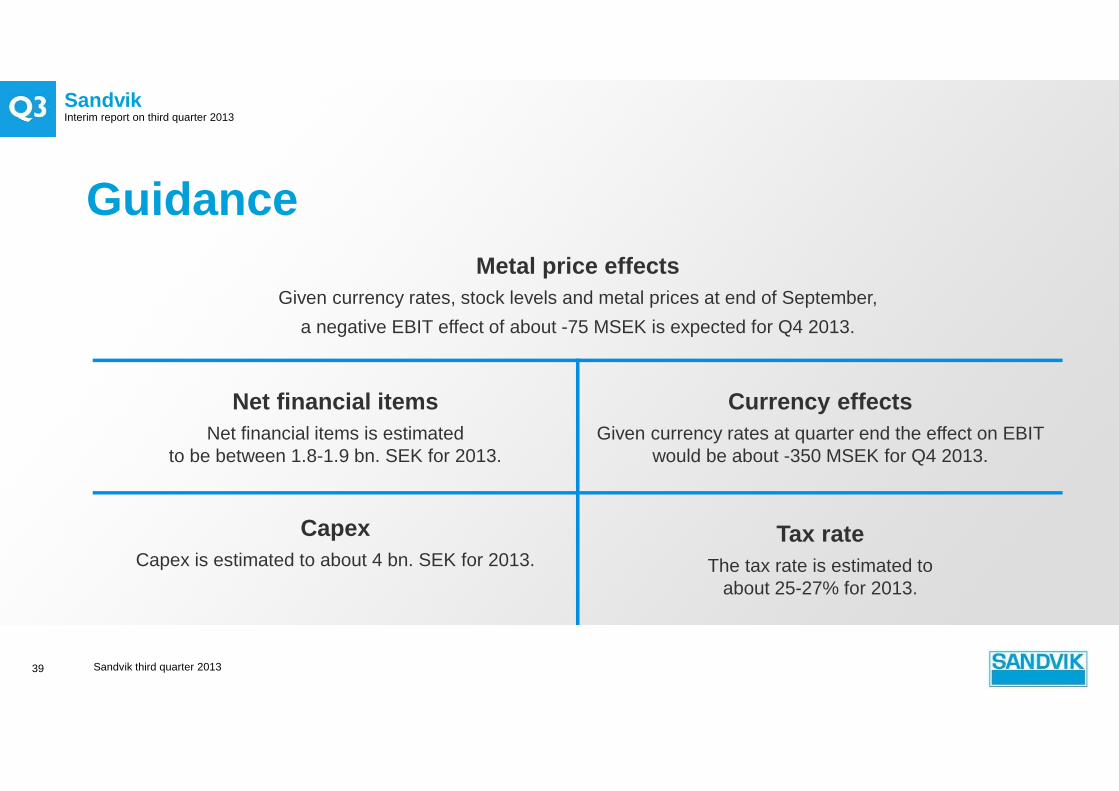
Guidance
39
Metal price effectsGiven currency rates, stock levels and metal prices at end of September,
a negative EBIT effect of about -75 MSEK is expected for Q4 2013.
Net financial itemsNet financial items is estimated
to be between 1.8-1.9 bn. SEK for 2013.
Currency effectsGiven currency rates at quarter end the effect on EBIT
would be about -350 MSEK for Q4 2013.
CapexCapex is estimated to about 4 bn. SEK for 2013.
Tax rateThe tax rate is estimated to
about 25-27% for 2013.
Sandvik third quarter 2013

SandvikInterim report on third quarter 2013
40
Cautionary statement
“Some statements herein are forward-looking and the actual outcome couldbe materially different. In addition to the factors explicitly commented upon,
the actual outcome could be materially affected by other factors for example,
the effect of economic conditions, exchange-rate and interest-ratemovements, political risks, impact of competing products and their pricing,
product development, commercialisation and technological difficulties, supply
disturbances, and the major customer credit losses.”
Sandvik third quarter 2013