sands pond quality assurance project plan sampling procedures and requirements ... b10.0 sample...
TRANSCRIPT
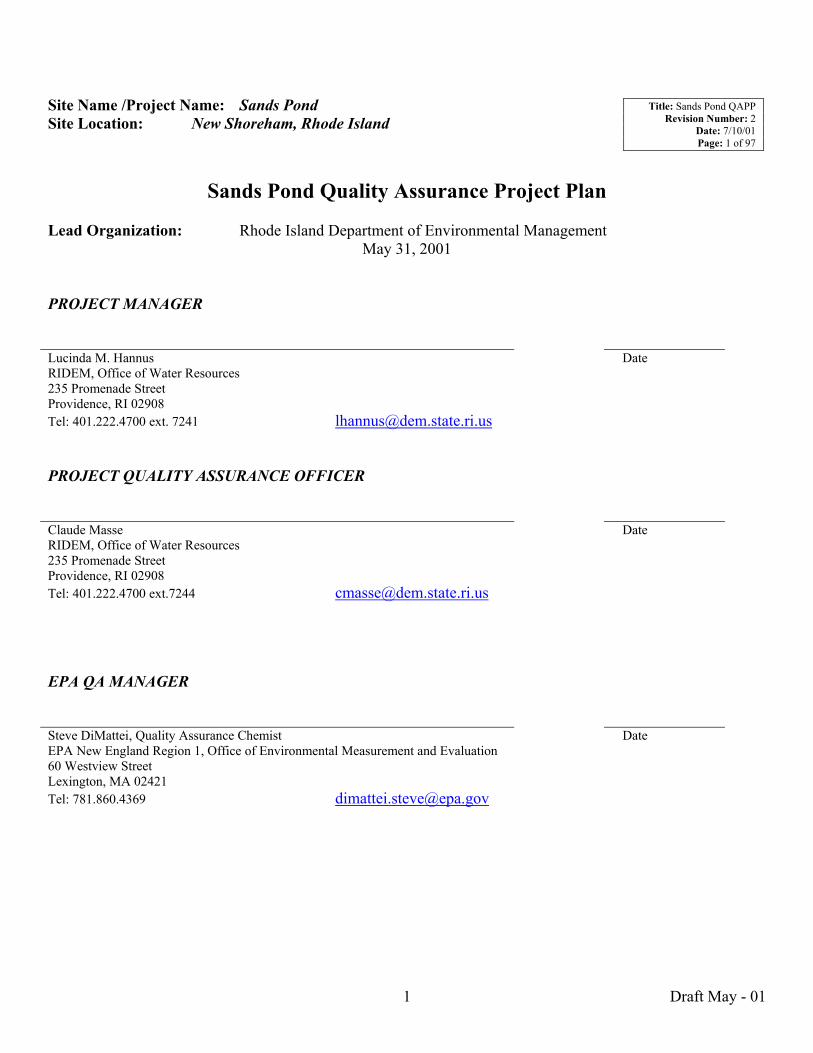
Site Name /Project Name: Sands Pond Title: Sands Pond QAPP Revision Number: 2
Date: 7/10/01 Page: 1 of 97
Site Location: New Shoreham, Rhode Island
Sands Pond Quality Assurance Project Plan Lead Organization: Rhode Island Department of Environmental Management
May 31, 2001 PROJECT MANAGER Lucinda M. Hannus Date RIDEM, Office of Water Resources 235 Promenade Street Providence, RI 02908 Tel: 401.222.4700 ext. 7241 [email protected] PROJECT QUALITY ASSURANCE OFFICER Claude Masse Date RIDEM, Office of Water Resources 235 Promenade Street Providence, RI 02908 Tel: 401.222.4700 ext.7244 [email protected] EPA QA MANAGER Steve DiMattei, Quality Assurance Chemist Date EPA New England Region 1, Office of Environmental Measurement and Evaluation 60 Westview Street Lexington, MA 02421 Tel: 781.860.4369 [email protected]
Draft May - 01 1

Title: Sands Pond QAPP Revision Number: 2
Date: 7/10/01 Page: 2 of 97
A2 Table of Contents A2 Table of Contents............................................................................................................................................ 2
A2.1 List of Tables .......................................................................................................................................... 4 A2.2 List of Figures ......................................................................................................................................... 5 EPA-NE QAPP Worksheet #2............................................................................................................................ 6
A3.0 Distribution List (EPA-NE QAPP Worksheet #3)...................................................................................... 9 A4.0 Project Organization ................................................................................................................................. 10
A4.1 Project Organizational Chart.................................................................................................................... 10 A4.2 Communication Pathways ........................................................................................................................ 10
A4.2.1 Modifications to Approved QAPP........................................................................................................ 11 A4.3 Personnel Responsibilities and Qualifications...................................................................................... 11
A5.0 Project Planning / Problem Definition...................................................................................................... 11 A5.1 Project Planning Meetings .................................................................................................................... 11 A5.2 Sands Pond Watershed.......................................................................................................................... 12
A6.0 Project Description and Schedule ............................................................................................................. 15 A6.1 Project Overview .................................................................................................................................. 15 A6.2 Project Schedule.................................................................................................................................... 18
A7.0 Project Quality Objectives and Measurement Performance Criteria........................................................ 19 A7.1 Measurement Performance Criteria ...................................................................................................... 19
B8.0 Sampling Process Design.......................................................................................................................... 22 B8.1 Sampling Design Rationale................................................................................................................... 23
B9.0 Sampling Procedures and Requirements .................................................................................................. 24 B9.1 Sampling Procedures ............................................................................................................................ 24 B9.2 Equipment Cleaning.............................................................................................................................. 24 B9.3 Field Equipment Calibration and Maintenance .................................................................................... 25 B9.4 Inspection and Acceptance Requirements for Sample Containers ....................................................... 25
B10.0 Sample Handling, Tracking and Custody Requirements.......................................................................... 25 B10.1 Field Notes ............................................................................................................................................ 25 B10.2 Sample Tracking ................................................................................................................................... 26 B10.3 Sample Handling, Tracking , and Custody ........................................................................................... 26
B11.0 Field Analytical Method Requirements ................................................................................................... 26 B11.1 Field Analytical Methods and Standard Operating Procedures................................................................ 27 B12.0 Fixed Laboratory Analytical Method Requirements ................................................................................ 27 B12.1 Fixed Laboratory Analytical Methods and Standard Operating Procedures ............................................ 27 B13.0 Quality Control Requirements .................................................................................................................. 29 B14.0 Data Acquisition Requirements ................................................................................................................ 35 B15.0 Documentation, Records, and Data Management..................................................................................... 35 C16.0 Assessments and Response Actions.......................................................................................................... 36 C17.0 QA Management Reports ......................................................................................................................... 37 C18.0 Verification and Validation Requirements ............................................................................................... 37 C19.0 Verification and Validation Procedures.................................................................................................... 38 C20.0 Data Usability / Reconciliation with Project Quality Objectives ............................................................. 39
Draft May - 01 2

Title: Sands Pond QAPP Revision Number: 2
Date: 7/10/01 Page: 3 of 97
APPENDIX A....................................................................................................................................................... 40
APPENDIX B ....................................................................................................................................................... 47
APPENDIX C ....................................................................................................................................................... 61
APPENDIX D....................................................................................................................................................... 64
APPENDIX E ....................................................................................................................................................... 96
Draft May - 01 3

Title: Sands Pond QAPP Revision Number: 2
Date: 7/10/01 Page: 4 of 97
A2.1 List of Tables
Table A3. 1 Distribution List Worksheet #3........................................................................................................... 9
Table A5. 1 Project Scoping Meeting Attendance Sheet...................................................................................... 12
Table A6. 1 Contaminants of Concern ................................................................................................................. 15
Table A6. 2 Analytical Services Table ................................................................................................................. 16
Table A6. 3 Project Schedule................................................................................................................................ 18
Table A7. 1 Total Phosphorous Measurement Performance Criteria ................................................................... 20
Table A7. 2 Ortho-phosphate Phosphorous Measurement Performance Criteria................................................. 21
Table A7. 3 Chlorophyll a Measurement Performance Criteria ........................................................................... 21
Table A7. 4 Turbidity Measurement Performance Criteria .................................................................................. 22
Table B9. 1 Project Sampling SOP Reference Table ........................................................................................... 24
Table B9. 2 Field Sampling Equipment Calibration Table .................................................................................. 25
Table B10. 1 Sample Handling System ............................................................................................................... 26
Table B11. 1 Field Analytical Method/SOP Reference Table............................................................................. 27
Table B12. 1 Fixed Laboratory Analytical Method/SOP Reference Table ......................................................... 27
Table B13. 1 Field Sampling QC: Total Phosphorous ....................................................................................... 29
Table B13. 2 Field Sampling QC: Ortho-phosphate Phosphorous..................................................................... 29
Table B13. 3 Field Sampling QC: Chlorophyll � a ........................................................................................... 30
Table B13. 4 Field Sampling QC: Turbidity ..................................................................................................... 30
Table B13. 5 Fixed Laboratory Analytical QC: Total Phosphorous ................................................................. 31
Table B13. 6 Fixed Laboratory Analytical QC: Ortho-phosphate phosphorous ................................................ 32
Table B13. 7 Fixed Laboratory Analytical QC: Chlorophyll - a........................................................................ 33
Table B13. 8 Fixed Laboratory Analytical QC: Turbidity ................................................................................ 34
Table B14. 1 Non-Direct Measurements Criteria and Limitations..................................................................... 35
Table B15. 1 Project Documentation and Records............................................................................................. 36
Table C16. 1 Project Assessment Table ............................................................................................................. 36
Table C17. 1 QA Management Reports ............................................................................................................. 37
Table C19. 1 Data Verification Process ............................................................................................................. 38
Draft May - 01 4

Title: Sands Pond QAPP Revision Number: 2
Date: 7/10/01 Page: 5 of 97
A2.2 List of Figures
Figure A4. 1 Project Organizational Chart......................................................................................................... 10
Figure A5. 1 Sands Pond Watershed.................................................................................................................. 14
Draft May - 01 5

Title: Sands Pond QAPP Revision Number: 2
Date: 7/10/01 Page: 6 of 97
EPA-NE QAPP Worksheet #2 EPA QA/R-5
QAPP ELEMENTS
REQUIRED EPA-NE QAPP ELEMENTS and CORRESPONDING EPA-NE QAPP
SECTIONS
EPA-NEW QAPP
WORKSHEET#
REQUIRED INFORMATION NOT
APPLICABLE (N/A)
Project Management and Objectives
A1 1.0 Title and Approval Page 1 - Title and Approval Page
A2
2.0 Table of Contents and Document Format 2.1 Table of Contents 2.2 Document Control Format 2.3 Document Control Numbering
System 2.4 EPA-NE QAPP Worksheet #2
2
- Table of Contents - EPA-NE QAPP Worksheet
N/A Small Project
A3 3.0 Distribution List and Project Personnel Sign-off Sheet
3 4
- Distribution List - Project Personnel Sign-off
Sheet
N/A Small Project
A4,A8
4.0 Project Organization 4.1 Project Organizational Chart 4.2 Communications Pathway
4.2.1 Modifications to Approved QAPP
4.3 Personnel Responsibilities and Qualifications
4.4 Special Training Requirements/ Certification
5a 5b
6
7
- - Organizational Chart - Communications Pathway - Personnel Responsibilities
and Qualifications Table - - - Special Personnel
Training Requirements Table
N/A Narrative N/A None required for sampling
A5
5.0 Project Planning/Project Definition 5.1 Project Planning Meetings 5.2 Problem Definition/Site History and
Background
8a
8b
- Project Scoping Meeting - Problem Definition/Site
History and Background - EPA-NE DQO Summary
Form - Site Maps
A6
6.0 Project Description and Schedule 6.1 Project Overview 6.2 Project Schedule
9a 9b 9c
9d
10
- Project Description - Contaminants of Concern - Field and Quality Control
Sample Summary Table - Analytical Services Table - System Designs - Project Schedule Timeline
Table
Narrative N/A
A7
7.0 Project Qualitiy Objectives and Measurement Performance Criteria 7.1 Project Quality Objectives 7.2 Measurement Performance Criteria
11a
11b
- Project Quality Objectives/Decision Statements
- Measurement Performance Criteria Table
Draft May - 01 6

Title: Sands Pond QAPP Revision Number: 2
Date: 7/10/01 Page: 7 of 97
EPA-NE QAPP Worksheet #2
EPA QA/R-5 QAPP
ELEMENTS
REQUIRED EPA-NE QAPP ELEMENTS and CORRESPONDING EPA-NE QAPP
SECTIONS
EPA-NEW QAPP
WORKSHEET#
REQUIRED INFORMATION NOT
APPLICABLE (N/A)
Project Management and Objectives
B8
8.0 Sampling Process Design 8.1 Sampling Design Rationale
12a 12b
- Sampling Design and Rationale
- Sampling Locations, Sampling analysis and methods Table
- Sample Location Map
Descriptive
B9
9.0 Sampling Procedures and Requirements 9.1 Sampling Procedures 9.2 Sampling SOP Modifications 9.2 Equipment Cleaning 9.3 Field Equipment Calibration and Maintenance 9.4 Inspection and Acceptance Requirements
13
12b 14
15
- Sampling SOPs - Project Sampling SOP
Reference Table - Sample Container, Volumes
and Preservation Table - Field Sampling Equipment
Calibration Table - Cleaning and
Decontamination SOPs - Field Equipment
Maintenance, Testing and Inspection Table
No Modifications N/A Small Project Laboratory SOPs
B10
10.0 Sample Handling, Tracking and Custody Requirements 10.1 Field Notes 10.2 Sample Tracking 10.3 Sample Handling
16
- Sample Handling, Tracking and Custody SOPs
- Sample Handling Flow Diagram
- Sample Container Label - Chain of Custody Form
N/A Small Project Laboratory
B11
11.0 Field Analytical Methods Requirements
17 18 19
- Field Analytical Methods
Descriptive
B12 12.0 Fixed Laboratory Analytical Method Requirements
20 21
- Fixed Laboratory Analytic Methods
B13
13.0 Quality Control Requirements 13.1 Sampling Quality Control 13.2 Analytical Quality Control
22a 22b 23a 23b 24a 24b
- - Sampling - Analytical
B14 14.0 Data Acquisition Requirements
25 - Non-Direct Measurements
Criteria and Limitations Table
Draft May - 01 7

Title: Sands Pond QAPP Revision Number: 2
Date: 7/10/01 Page: 8 of 97
EPA QA/R-5 QAPP
ELEMENTS
REQUIRED EPA-NE QAPP ELEMENTS and CORRESPONDING EPA-NE QAPP
SECTIONS
EPA-NEW QAPP
WORKSHEET#
REQUIRED INFORMATION NOT
APPLICABLE (N/A)
Project Management and Objectives
B15 15.0 Documentation, Records and Data Management
26 - Project Documentation and Records
- Data Management Narrative
C16 16.0 Assessment and Response Actions 27a
27b 27c
- Assessment and Response Actions Narrative
C17 17.0 QA Management Reports 28 - QA Management Reports Table
C18 18.0 Verification and Validation Requirements - Validation Criteria Documents Narrative
C19
19.0 Verification and Validation Procedures 29a 29b 29c
- Data Evaluation Process - Data Validation Summary
Table - Data Validation
Modifications
Narrative
C20 20.0 Data Usability/Reconciliation with Project Quality Objectives
30 - Data Usability Assessment Narrative
Draft May - 01 8

Title: Sands Pond QAPP Revision Number: 2
Date: 7/10/01 Page: 9 of 97
A3.0 Distribution List (EPA-NE QAPP Worksheet #3) Table A3. 1 Distribution List Worksheet #3
QAPP Recipients Title Organization Telephone Number
Wayne Jenkins Supervisor RIDEM (401) 222-4700 ext. 7272
Lucinda Hannus Project Manager RIDEM (401) 222-4700 ext. 7241
Claude Masse QA Officer RIDEM (401) 222-4700 ext. 7244
Steve DiMattei EPA QA Quality Assurance Chemist
Lexington Laboratory New England EPA (781) 860-4369
Al Basile EPA Project Officer USEPA (617) 918-1599
Linda Green Laboratory Manager URI Watershed Watch Laboratory (401) 874-2905
Kelly DeSousa Laboratory QA/QC Manager ESS Laboratory (401) 461-7181
Draft May - 01 9

Title: Sands Pond QAPP Revision Number: 2
Date: 7/10/01 Page: 10 of 97
A4.0 Project Organization
A4.1 Project Organizational Chart
Figure A4. 1 Project Organizational Chart
Approval Authority EPA � Region 1
Lead Organization Rhode Island Department of Environmental Management
Lead Organization Supervisor Wayne Jenkins (404) 222-4700 ext. 7272
Lead Organization Project Manager Lucinda Hannus
(401) 222-4700 ext. 7241
Lead Organization QA Officer Claude Masse
(401) 222 � 4700 ext. 7244
RIDEM Role: Field Sampling Contact: Lucinda Hannus (ext. 7241)
URI Watershed Watch Laboratory Role: Sample Analysis Laboratory Manager: Linda Green
ESS Laboratory Role: Sample Analysis Laboratory Manager: Kevin Braga
A4.2 Communication Pathways This sampling will occur primarily during dry weather, but will include an initial wet weather survey. Storm criteria is discussed in Section B8.0. Rhode Island Department of Environmental Management (RIDEM) personnel will conduct sampling from a boat. University of Rhode Island Watershed Watch (URIWW) and ESS Laboratories will analyses the samples. Two RIDEM staff will perform each sampling event, which includes the Project Manager and an additional RIDEM Total Maximum Daily Load (TMDL) group staff person. This additional staff person may vary from sampling event to sampling event depending upon individual schedules and availability. All staff within the TMDL group are equally qualified to conduct this routine sampling, and are trained in acceptable procedures.
Draft May - 01 10

Title: Sands Pond QAPP Revision Number: 2
Date: 7/10/01 Page: 11 of 97
The Project Manager will monitor the weather and will contact RIDEM staff to schedule surveys. Prior to the beginning of the sampling season, the Project Manager will contact URIWW and ESS Laboratories to obtain sample bottles. These bottles will be kept at RIDEM and used during all sampling events.
A4.2.1 Modifications to Approved QAPP It may be necessary to make changes to the sampling plan due to the results of the dry and wet weather shoreline surveys. The Project Manager shall record all modifications to the sampling plan and the decision to add, drop or relocate stations will be made jointly by the QA Officer and the Project Manager. All changes to the QA Plan will be reported in the sampling Status Report and the Final Report.
A4.3 Personnel Responsibilities and Qualifications Each sampling event shall be performed by the Project Manager and an additional RIDEM, Office of Water Resource (OWR) staff person. This person will have been trained and is qualified to conduct this routine sampling. A copy of the Quality Assurance Project Plan (QAPP) will be provided to the staff person for review, prior to conducting sampling. The Project Manager shall record on the field sheet the name and title of the additional staff person who accompanied the Project Manager on the sampling run. A5.0 Project Planning / Problem Definition Sands Pond is identified on the State of Rhode Island�s 303(d) lists of 1998 and 2000 as being impaired for Excess Algae Growth, Taste and Odor and Turbidity. The goal of this sampling program is to document water quality and to quantify inputs into the pond in both wet and dry conditions. During this sampling program, RIDEM will collect and organize all existing information and obtain additional information as required to develop a TMDL for this watershed. TMDLs are required under Section 303(d) of the Clean Water Act and USEPA's Water Quality Planning and Management Regulations (40 CFR Part 130). The goal of this TMDL study is to quantify the existing loadings from nonpoint and point sources into Sands Pond and to establish the impact that these loadings have on water quality. At the completion of the study, the necessary load reductions needed to achieve water quality standards will be established.
A5.1 Project Planning Meetings The Project Manager and Project Supervisor have had several informal meetings to formulate and define the purpose and expected results of this project. In addition, a site visit was completed on April 6, 2001 to allow the project team to become familiar with the watershed and to make initial contact with Block Island Water Company (BIWC) personnel and town land use officials.
Draft May - 01 11

Title: Sands Pond QAPP Revision Number: 2
Date: 7/10/01 Page: 12 of 97
Table A5. 1 Project Scoping Meeting Attendance Sheet
Program: TMDL Site Name: Sands Pond Project Manager: Lucinda Hannus, RIDEM Site Location: New Shoreham, RI Date of Meeting: April 6, 2001 Meeting Location: Sands Pond, New Shoreham, RI Town Hall, New Shoreham
Name Project Role Affiliation Phone # e-mail address Lucinda Hannus Project Manager RIDEM 401-222-4700
ext. 7241 [email protected]
Wayne Jenkins Project Supervisor
RIDEM 401-222-4700 ext. 7272
Joseph Shea Acting Water Official
Town of New Shoreham
401-466-3232
Marc Tillson Building/Zoning Official
Town of New Shoreham
401-466-3206
Meeting Purpose: Obtain available background information on watershed, water quality data and town zoning and land use information. Obtained copies of misc. data sheets, zoning maps, and plat maps. Toured area to obtain general site conditions. Comments and action items:
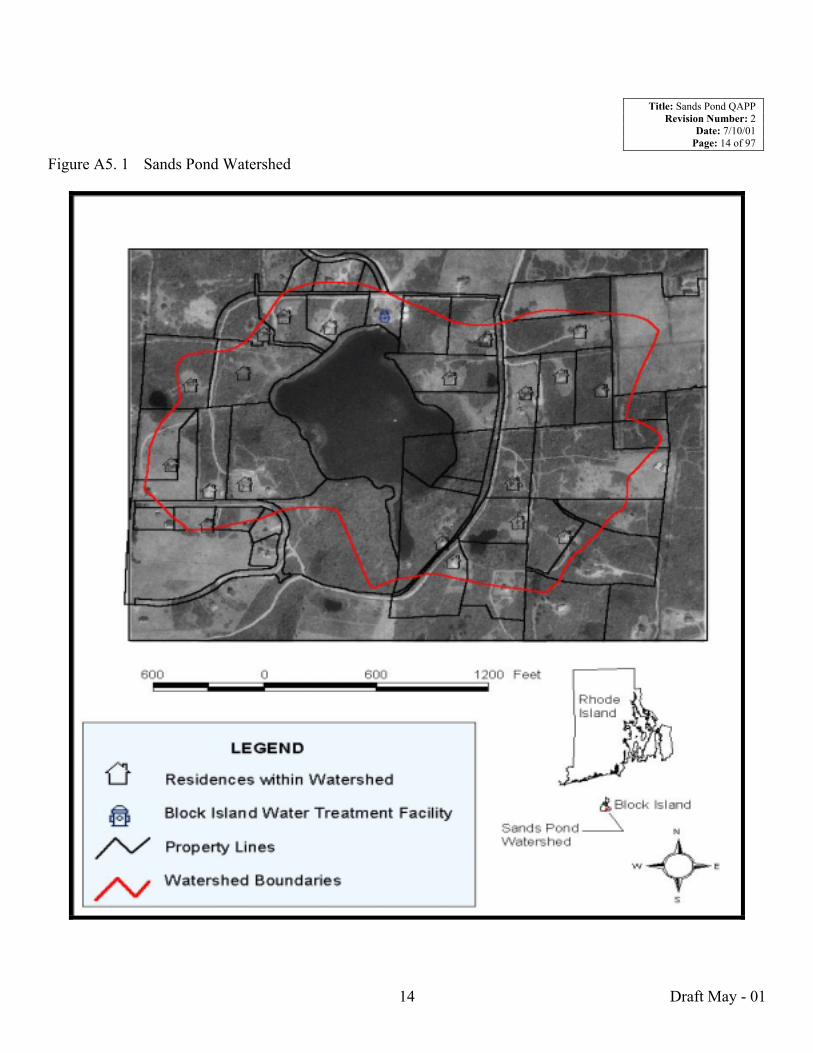
A5.2 Sands Pond Watershed Sands Pond is a Class A waterbody, included in Group 2 on RI�s 303(d) lists (High priority for TMDL development). Sands Pond is a 14-acre, relatively shallow public water supply reservoir located in the town of New Shoreham. New Shoreham is the only town located on the island of Block Island. Block Island is located approximately twelve miles south of the Rhode Island mainland. The Block Island Water Company (BIWC) is currently drawing water from a system of six adjacent wells and not the pond. The BIWC has stated (personal discussion Joseph Shea, BIWC) that the pond would only be used during high demand periods as a backup to the existing system of wells. In addition to being Class A waters, Sands Pond is also identified by the RIDEM as a Special Resource Protection Water (SRPW). RIDEM�s Water Quality Regulations define SRPW as those waters that are high quality surface waters having significant ecological or recreational uses. All public drinking water supplies are designated SRPW Currently, there are twenty (20) residences and the BI Water Treatment facility located within the Sands Pond watershed. All of these homes rely upon on-site septic systems for the treatment of septic waste. The watershed for the pond includes approximately 88 acres of residentially developed, open space, and the BI Water Treatment facility. The zoning for the entire watershed is RA (Town of New Shoreham Zoning Ordinance, Eff. June 17, 1994), which requires a minimum lot size of 120,000 sq. ft. (2.75 acres) of developable land per homesite. The average lot size currently platted within the watershed is approximately three acres. There are no major agricultural sites developed within the watershed. Farming is allowed within an RA zone and the stabling of horses is only allowed by Special Use Permit.
Draft May - 01 12

Title: Sands Pond QAPP Revision Number: 2
Date: 7/10/01 Page: 13 of 97
Rhode Island General Law (R.I.G.L.) 46-14-1 prohibits bathing, swimming, discharge of sewage or drainage or refuse or polluting matter which may corrupt or pollute or impair the purity or quality of a public drinking water supply. State law further prohibits such use or any other activity in, on or in the immediate vicinity in which the director of health deems to render the water supply injurious to public health. Figure A5.1 is an aerial map of the Sands Pond watershed.
Draft May - 01 13
Title: Sands Pond QAPP Revision Number: 2
Date: 7/10/01 Page: 14 of 97
Figure A5. 1 Sands Pond Watershed
Draft May - 01 14

Title: Sands Pond QAPP Revision Number: 2
Date: 7/10/01 Page: 15 of 97
A6.0 Project Description and Schedule A TMDL report is required for all waterbodies that do not meet their designated uses. Sands Pond is impaired by excess algae growth, taste, odor and turbidity. The requirements of the TMDL process have determined the scope of the Sands Pond study. The Sands Pond TMDL will be developed for total phosphorous, as phosphorous has been determined to be the limiting nutrient to algal growth in this system. RIDEM will quantify the phosphorous, chlorophyll a and turbidity loads within the waterbody in order to determine the impacts of these loads to water quality. Table A6. 1 Contaminants of Concern
Contaminant Analytical Method
Achievable Laboratory
Limits Project Limits Laboratory
Total Phosphorous URIWW SOP SP-1 0.01 (mg/l) 25 ppb (ug/l) URIWW Ortho-phosphate Phosphorous URIWW SOP SP-2 0.005 (mg/l) 25 ppb (ug/l) URIWW
Chlorophyll a URIWW SOP SP-3 1.0 ppb (ug/l) <10 ppb (ug/l) URIWW
Turbidity ESS SOP SP-4 0.02 NTU 5 NTU over background ESS
Dissolved Oxygen YSI � Model 85 0.01 (mg/l) 5.0 mg/l YSI Model 85
Temperature YSI � Model 85 +/- 20 C Field Measurement Profile stratification Field Sample
A6.1 Project Overview Historically, Sands Pond has displayed non-attainment of turbidity standards. There has also been a history as reported by the Rhode Island Department of Heath (RIDOH) of taste and odor problems. Turbidity as measured in Nephelometric Turbidity Units (NTU) has exceeded the standard of 5 NTU over background. For this project a background level of 5 NTU will be used, resulting in a project limit of 10 NTU. BIWC sampling results ranged from a low of 2.19 NTU in March, 2000 to a high of 28.20 NTU in September, 2000. Average monthly ranges vary from a low of 2.49 NTU to a high of 16.30 NTU for the same time period. Odors vary with the source and concentration. Most odors reported by public water users, besides chlorine, is a result of decaying organic material, decaying distribution lines or from home water heaters. Odor problems were indicated by the RIDOH in 1988 through 1992. Odors are a judgement call by the laboratory ranging in values of 1 � weak to 5 � strong. Sands Pond samples were rated from a musty 1 to a swampy �3 during this time period. Chlorine was also noted at a level 2 on two occasions. Taste is a subjective parameter and varies widely between people. The sources of most complaints come from high levels of chlorine or high mineral content. Dissolved inorganic salts of potassium, sodium, zinc, copper, manganese and iron can be detected by taste and produce bitter or sour tastes. There is no data available to indicate the specific tastes that are objectionable with this water. As the Preliminary Data Report is developed
Draft May - 01 15

Title: Sands Pond QAPP Revision Number: 2
Date: 7/10/01 Page: 16 of 97
for this TMDL, all available data will be detailed for all impairments. Taste will not be reported as a sampling result but will be implicitly addressed by reducing nuisance algal species. This watershed has no known point sources following the initial site survey. During the initial dry weather sampling, a shoreline survey will be conducted to determine the accuracy of this statement. Non-point sources include groundwater infiltration, surface runoff, and wildlife impacts. Likely sources include groundwater containing high levels of nutrients from improperly or under-treated septic waste, nitrates and phosphates from the use of fertilizers on residential lawns or agricultural uses and waterfowl/ wildlife droppings. Silt and clay sediments, inorganic and organic matter, algae and other microscopic organisms such as bacteria influence turbidity levels. The likely sources of these contaminates are from stormwater and wind erosion, untreated runoff from gravel roads, fluctuating water levels influencing organic growth within the pond and possibly improperly treated septic waste. The monitoring program for this TMDL will be used to establish the existing water quality in Sands Pond. Sampling results for total phosphorous (TP), ortho-phosphate phosphorous (OP), chlorophyll a, dissolved oxygen and temperature will all be used to assess this waterbody�s trophic condition. Turbidity levels will be monitored to determine reduction requirements. Odors will be considered by the sampler and noted during each sampling period. Seasonal fluctuations and critical conditions will be analyzed by monitoring through the spring to fall season, since winter conditions typically do not exceed standards. Wet and dry conditions will also be sampled. A review by New Shoreham wastewater facilities officials of existing septic systems within the watershed will be used to determine loadings associated with their use. Information gathered from this monitoring program will be used to establish reductions in concentrations of contaminants in order to achieve compliance with the state�s water quality standards for this waterbody. Table A6. 2 Analytical Services Table
Medium/ Matrix
Analytical Parameter
Analytical Method /
SOP
No. Of Sampling Locations
No. of Field
Duplicates
Total No. Samples to Laboratory
Data Package
Turnaround Laboratory
Surface Water
Total Phosphorous SOP -1 61 2 8 10 Days URIWW
Surface Water
Ortho-phosphate Phosphorous SOP -2 61 2 8 10 Days URIWW
Surface Water Chlorophyll a SOP -3 61 2 8 10 Days URIWW
Surface Water Turbidity SOP -4 61 2 8 10 Days ESS
Surface Water
Dissolved Oxygen
Field SOP FSOP-7 61 N/A N/A N/A Field
Measurement Surface Water Temperature Field SOP
FSOP-7 61 N/A N/A N/A Field Measurement
Surface Water Odor Field SOP
FSOP-5 31 N/A N/A N/A N/A 1 Samples for TP, OP, Chlorophyll a, T, DO and Temp. will be taken at two water levels, one at the surface and the other at full depth.
Draft May - 01 16

Title: Sands Pond QAPP Revision Number: 2
Date: 7/10/01 Page: 17 of 97
The following tasks outline the steps needed to accomplish the objectives of the sampling program. Task 1 Review Existing Data As part of the development of the Preliminary Data Report, review and analysis of all existing data will be completed. Sources of data include but are not limited to, previous studies of pond water quality, and sampling performed by BIWC, sampling preformed by RIDOH and studies of surrounding land use and septic system status by the town of New Shoreham. Other available data will be used if, during the data collection phase, it is determined to be of suitable quality and relevance. Task 2 Depth Measurement The Project Manager shall conduct a limited bathymetric survey of the pond bottom with the assistance of an additional staff person. A transect grid pattern will be established to locate depth measurements. The transect shall be established on a 200� x 200� grid. Visual observations of transect lines shall be noted in the field notebook and drawn on the aerial map of the pond. Depth measurements shall be take at 200 foot intervals along the transect line. These depth measurements shall be recorded on the field sheet in which a copy is provided in Appendix A. Task 3 Monitoring Program Beginning in the spring of 2001, a sampling program consisting of three in pond sampling stations will initially be commenced. Additional stations may be added if wet weather conditions within the watershed warrant additional sampling locations. The three locations are: 1. Station SP1 Located offshore, adjacent to the BIWC treatment facility intake pipe; 2. Station SP2 Located along the shoreline, in fairly shallow water and; 3. Station SP3 Located centrally in the pond at the point of greatest depth. These locations were chosen to compare historic sampling data at the BIWC intake pipe at site 1, site 2 (which is the most critical zone of the pond) and site 3, which is in the deepest water. A map depicting the locations chosen will be included upon completion of the bathymetric survey. Sampling weather criteria is outlined in section B8.0 of this report. Task 3 Shoreline Surveys
Due to the limited accessibility to the shorelines of Sands Pond, little is currently known about runoff flow paths within the watershed. During the first dry-weather sampling run, a shoreline survey shall be completed by the sampling team. Observations of the shoreline edge and detailed descriptions, which include type and locations of any discharge pipes or areas of concentrated runoff shall be noted in the field notebook. A copy of a map of the pond and surrounding watershed shall also be provided, and any discharge of note shall be located
Draft May - 01 17

Title: Sands Pond QAPP Revision Number: 2
Date: 7/10/01 Page: 18 of 97
on this map. The information from the field notebook and location map will then be incorporated into the GIS database for further analysis. If any �point� discharges are located the sampling locations and number of samples collected may be modified to address these discharges. In addition to the dry weather shoreline survey, during the first wet weather sampling event an additional shoreline survey will also be conducted to locate any additional points of discharge into the pond, or to verify the observations made during the dry weather reconnaissance. Any observations warranting a change in sampling locations shall be indicated in the field notebook by the sampling team. Modifications to the wet weather monitoring program may be made if so warranted. Task 5 Map Production Using Rhode Island GIS data, Block Island GIS data and other available internet mapping resources, maps and diagrams depicting land use, soils, hydrologic conditions, septic system locations, buildings and other essential evaluation parameters, will be produced for this TMDL. Additional data from New Shoreham wastewater officials regarding the status of individual septic systems (ISDS) within the watershed will also be evaluated and incorporated into the TMDL. A margin of safety will be developed to ensure compliance with water quality standards regardless of the imperfections inherent to environmental studies and natural conditions. Seasonal variations will be taken into account and consideration of future changes within the watershed will also be addressed. An implementation plan is an integral part of a TMDL and the implementation plan will be made based on observations, data, analysis and interpretation of all information collected during the monitoring period.
A6.2 Project Schedule Table A6. 3 Project Schedule.
2000 2001 Task Deliverable M J J A S O N D J
Review Existing Data1 Monitoring Plan QAPP Preparation QAPP Document Site Preparation NA Sample Collection NA Laboratory Analysis Laboratory Report Final Data Report Final Data Report
Draft May - 01 18

Title: Sands Pond QAPP Revision Number: 2
Date: 7/10/01 Page: 19 of 97
A7.0 Project Quality Objectives and Measurement Performance Criteria Collecting high quality data is one of the most important goals of this project. Specific data quality objectives include method detection limits, precision, accuracy, representativeness, comparability, and completeness. All the data quality objectives will be met if the data collected is sufficient to complete the TMDL.
A7.1 Measurement Performance Criteria Representativeness
The selected stations and sampling frequency were chosen for their representativeness of conditions in the waterbody. The sampling targets dry weather because this is when Sands Pond would have the greatest exceedance of its water quality standards.
Comparability To maximize the quality of the data collected, and to collect data that is comparable with other studies, accepted sampling procedures will be used during this study. All samples collected will be sent to laboratories that use Standard Methods.
Sensitivity
Analytical methods were selected such that detection limits will not limit the usefulness of the data set.
Completeness If the data collected is sufficient to complete the TMDL report, than the data is considered to be complete. Measurement performance criteria help determine the completeness of a data set. Tables, A7.1 through A7.4 document the measurement performance criteria for this project.
Draft May - 01 19

Title: Sands Pond QAPP Revision Number: 2
Date: 7/10/01 Page: 20 of 97
Table A7. 1 Total Phosphorous Measurement Performance Criteria Sampling SOP SOP-1 Medium/Matrix Surface Water Analytical Parameter Total Phosphorous
Concentration Level 2 ppb (ug/l) Data Quality
Indicator Analytical Method/
SOP Reference/ Laboratory
Measurement Performance
Criteria
QC Sample and/or Activity Used to
Assess Measurement Performance
QC Sample Assesses Error for Sampling (S), Analytical (A),
or both (S/A)
Precision SM 4500-P F/ URIWW- SOP-1
<20%RPD Lab Duplicates A
Accuracy/bias Contamination
SM 4500-P F/ URIWW- SOP-1
< 2 ppb (ug/l) Method Blank A
Accuracy/bias Contamination
SM 4500-P F/ URIWW- SOP-1
Quantitation within limits
Performance Evaluation Standards - PES
A
Data - Completeness SM 4500-P F/ URIWW- SOP-1
Data collected are determined to be useable
Anticipate 100% A
Accuracy SM 4500-P F/ URIWW- SOP-1 < 20 % RPD Field Duplicates S/A
Draft May - 01 20

Title: Sands Pond QAPP Revision Number: 2
Date: 7/10/01 Page: 21 of 97
Table A7. 2 Ortho-phosphate Phosphorous Measurement Performance Criteria Sampling SOP SOP-2 Medium/Matrix Surface Water Analytical Parameter
Ortho-phosphate Phosphorous
Concentration Level 2 ppb (ug/l) Data Quality
Indicator Analytical Method/
SOP Reference/ Laboratory
Measurement Performance
Criteria
QC Sample and/or Activity Used to
Assess Measurement Performance
QC Sample Assesses Error for Sampling (S), Analytical (A),
or both (S/A)
Precision SM 4500-P F/ URIWW- SOP-1
<20%RPD Lab Duplicates A
Accuracy/bias Contamination
SM 4500-P F/ URIWW- SOP-1 < 2 ppb (ug/l) Method Blank A
Accuracy/bias Contamination
SM 4500-P F/ URIWW- SOP-1
Quantitation within limits
Performance Evaluation Standards - PES
A
Data - Completeness SM 4500-P F/ URIWW- SOP-1
Data collected are determined to be useable
Anticipate 100% A
Accuracy SM 4500-P F/ URIWW- SOP-1 < 20 % RPD Field Duplicates S/A
Table A7. 3 Chlorophyll a Measurement Performance Criteria Sampling SOP SOP-3 Medium/Matrix Surface Water Analytical Parameter Chlorophyll a
Concentration Level 0.1 ug/l Data Quality
Indicator Analytical Method/
SOP Reference/ Laboratory
Measurement Performance
Criteria
QC Sample and/or Activity Used to
Assess Measurement Performance
QC Sample Assesses Error for Sampling (S), Analytical (A),
or both (S/A)
Precision SOP -3 20% RPD Replicates S/A
Accuracy/bias Contamination SOP -3 < MDL Method Blank A
Accuracy/bias Contamination SOP -3 <20% RPD Pure Chl-a standards
Turner Design A
Data - Completeness SOP -3 Data collected are determined to be useable
Anticipate 100% A
Accuracy SOP -3 <20% RPD Lab Duplicates A
Draft May - 01 21

Title: Sands Pond QAPP Revision Number: 2
Date: 7/10/01 Page: 22 of 97
Table A7. 4 Turbidity Measurement Performance Criteria Sampling SOP SOP-4 Medium/Matrix Surface Water Analytical Parameter Turbidity
Concentration Level 0.02 NTU Data Quality
Indicator Analytical Method/
SOP Reference/ Laboratory
Measurement Performance
Criteria
QC Sample and/or Activity Used to
Assess Measurement Performance
QC Sample Assesses Error for Sampling (S), Analytical (A),
or both (S/A)
Precision SOP -4 +/- 20% RPD Field Duplicates S/A
Accuracy/bias Contamination SOP -4 < MDL Method Blank A
Data - Completeness SOP -4 Data collected are determined to be useable
Anticipate 100% A
Accuracy SOP -4 +/- 20% RPD Field Duplicates S/A
B8.0 Sampling Process Design Weather Criteria Dry Weather sampling shall be performed every two weeks during the months of June 2001 through September 2001. Sampling shall take place during dry conditions once during the months of May and October 2001. Dry weather is when there has been an antecedent dry period (ADP) of a minimum of three days prior to sampling. Wet weather sampling shall take place during a storm event in June 2001. During this initial sampling run, a shoreline survey will also be conducted to observe runoff conditions during a storm event within the watershed. Particular attention shall be given for any collection and discharge points of overland flow, sedimentation plumes into the pond or any point discharges not observed during the initial dry weather shoreline survey. Additional sampling will be required if such discharges are observed and an adjustment in the sampling monitoring plan will be made. To be considered a storm event, the following characteristics must apply. • Minimum rainfall of 0.5 inches in a 24-hr period; • Minimum duration of 5 hours; and • Minimum of three pre-storm dry days
Draft May - 01 22

Title: Sands Pond QAPP Revision Number: 2
Date: 7/10/01 Page: 23 of 97
B8.1 Sampling Design Rationale Task 1A Source Sampling Task 1 outlined in Section A6.1 describes the process for deciding sampling stations. Stations were chosen based on existing knowledge of the waterbody and watershed. Upon completion of the first shoreline survey and after the depths of the pond have been established, the three stations shall be further defined and located in the field notebook. Bearings for establishing the actual locations of the sampling station shall be thoroughly detailed in the field notebook such that sampling station locations can be duplicated upon subsequent sampling runs. The number, location and frequency of sampling may be modified following the initial dry and wet weather surveys. The Project Manager and QA Officer shall document any amendment to the monitoring plan or any changes to sampling locations that have been made and the rational for these changes will be documented in the Preliminary Data Report.
Draft May - 01 23

Title: Sands Pond QAPP Revision Number: 2
Date: 7/10/01 Page: 24 of 97
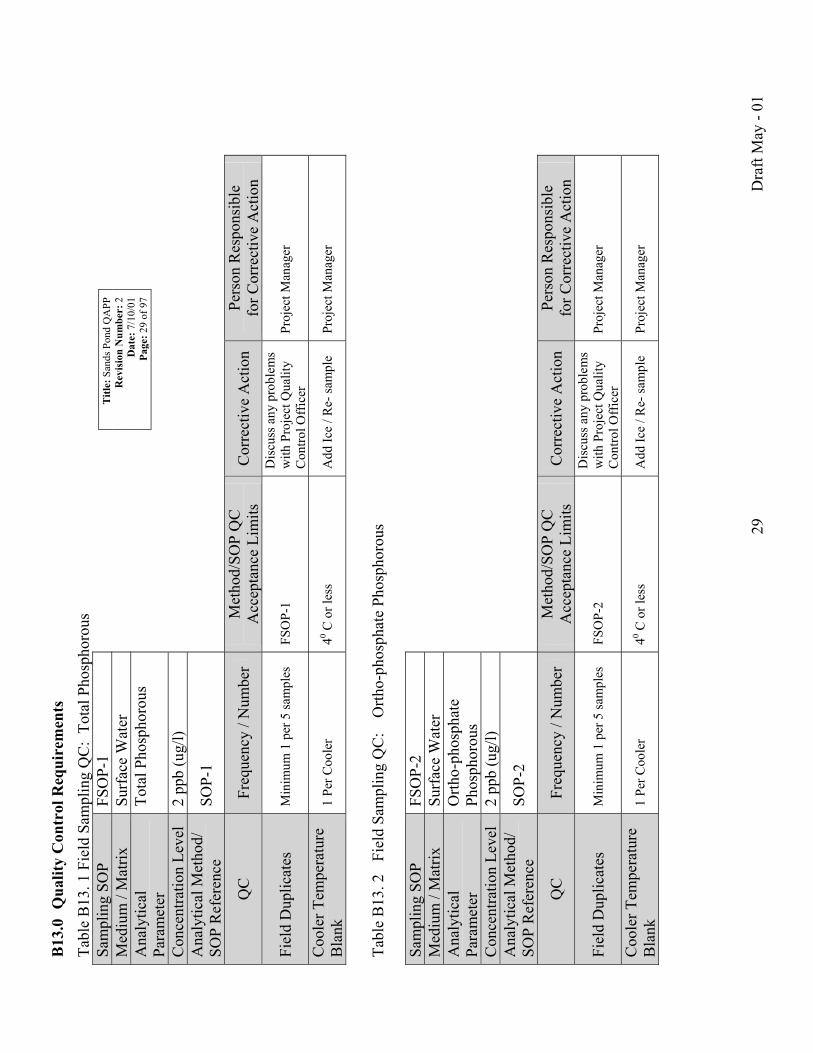
B9.0 Sampling Procedures and Requirements
B9.1 Sampling Procedures Standard Operating Procedures (SOPs) for field sampling are located in Appendix B of this report. Table B9. 1 Project Sampling SOP Reference Table
Reference Number/Title
Originating Organization
Equipment Identification
Modified for Work Project
Field Sampling SOP FSOP-1 Total Phosphorous Sampling
RIDEM Not applicable No
Field Sampling SOP FSOP-2 Ortho-phosphate Phosphorous Sampling
REDEM Not applicable No
Field Sampling SOP FSOP-3 Chlorophyll a Sampling
RIDEM Not applicable No
Field Sampling SOP FSOP-4 Turbidity Sampling
RIDEM Not applicable No
Field Sampling SOP FSOP-5 Odor Sampling
RIDEM Not applicable No
Field Sampling SOP FSOP-6 Depth Measurement
RIDEM Calibrated weighted Line No
Field Sampling SOP FSOP-7 Dissolved Oxygen and Temperature
RIDEM YSI Model 85 No
B9.2 Equipment Cleaning The laboratory that completes the sample analysis will provide the appropriate sterile bottles for sample collection.
Draft May - 01 24
Title: Sands Pond QAPP Revision Number: 2
Date: 7/10/01 Page: 25 of 97
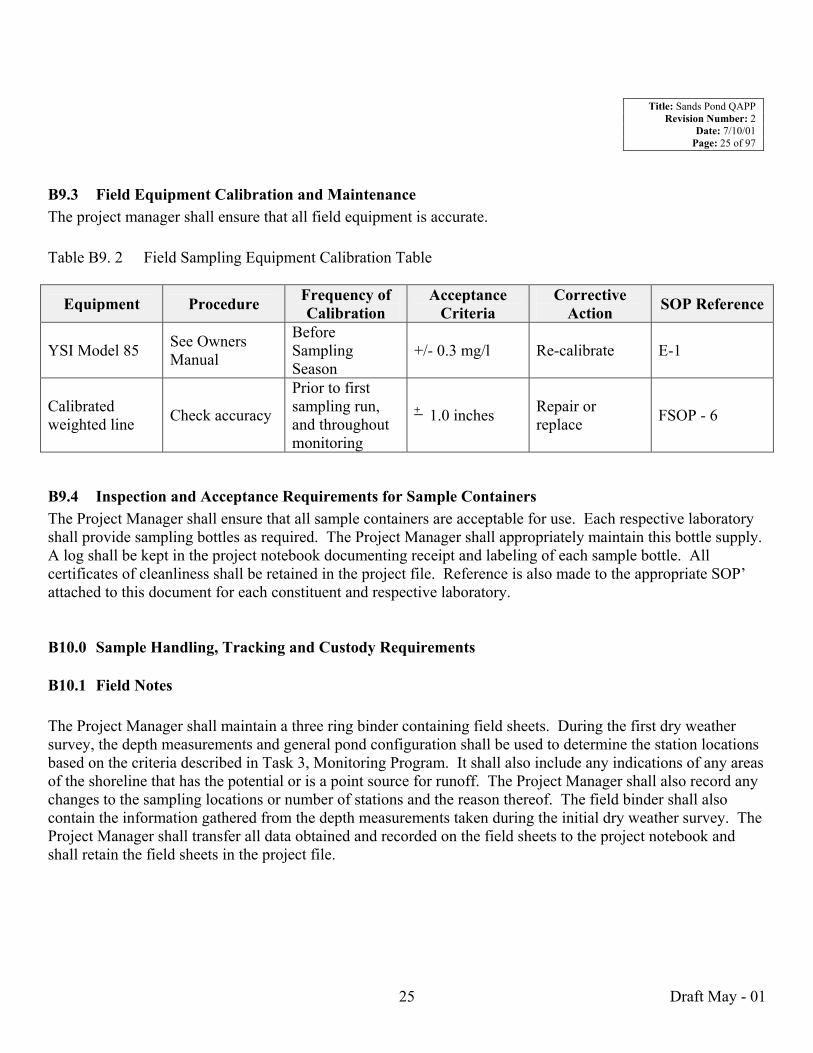
B9.3 Field Equipment Calibration and Maintenance The project manager shall ensure that all field equipment is accurate. Table B9. 2 Field Sampling Equipment Calibration Table
Equipment Procedure Frequency of Calibration
Acceptance Criteria
Corrective Action SOP Reference
YSI Model 85 See Owners Manual
Before Sampling Season
+/- 0.3 mg/l Re-calibrate E-1
Calibrated weighted line Check accuracy
Prior to first sampling run, and throughout monitoring
+ 1.0 inches Repair or replace FSOP - 6
B9.4 Inspection and Acceptance Requirements for Sample Containers The Project Manager shall ensure that all sample containers are acceptable for use. Each respective laboratory shall provide sampling bottles as required. The Project Manager shall appropriately maintain this bottle supply. A log shall be kept in the project notebook documenting receipt and labeling of each sample bottle. All certificates of cleanliness shall be retained in the project file. Reference is also made to the appropriate SOP� attached to this document for each constituent and respective laboratory. B10.0 Sample Handling, Tracking and Custody Requirements
B10.1 Field Notes The Project Manager shall maintain a three ring binder containing field sheets. During the first dry weather survey, the depth measurements and general pond configuration shall be used to determine the station locations based on the criteria described in Task 3, Monitoring Program. It shall also include any indications of any areas of the shoreline that has the potential or is a point source for runoff. The Project Manager shall also record any changes to the sampling locations or number of stations and the reason thereof. The field binder shall also contain the information gathered from the depth measurements taken during the initial dry weather survey. The Project Manager shall transfer all data obtained and recorded on the field sheets to the project notebook and shall retain the field sheets in the project file.
Draft May - 01 25

Title: Sands Pond QAPP Revision Number: 2
Date: 7/10/01 Page: 26 of 97
B10.2 Sample Tracking The Sample ID contains the Station Number followed by a letter noting the contaminant to analyze, followed by the notation indicating surface (S) or deep-water (D) sample. For example, the Station SP-1 sample for total phosphorous at the surface would be labeled SP-1-TP-S. The following is a list of the contaminants and their nomenclature. Total Phosphorous �TP� Ortho-phosphate Phosphorous �OP� Chloropyll a �C� Turbidity �T� Odor �O� All sample bottles shall be labeled prior to the sampling run by the Project Manager. The station number, including sample type and depth, date, time and initials shall be filled in prior to sampling using a permanent marker.
B10.3 Sample Handling, Tracking , and Custody All samples will be taken according to the requirements outlined in the field sampling SOP for each contaminant. The Project Manager or a designee shall deliver the samples to the appropriate laboratory for analysis. Copies of the chain of custody forms for each laboratory are included in APPENDIX C. Table B10. 1 Sample Handling System Responsible Party Samples Sample Collection RIDEM In pond Sample Delivery RIDEM In pond
Sample Analysis URIWW ESS Laboratory In pond
Sample Archival None N/A
Sample Disposal URIWW ESS Laboratory In pond
B11.0 Field Analytical Method Requirements During sampling the dissolved oxygen, temperature and odor will be analyzed in the field. The Project Manager shall record in the field notebook the sample location and all results of field measurements. Any indication of any particular odor such as musty, swampy, none, or a description of any indication of any offensive odor that is believed to be exclusive of natural background or may be due to excess algae influence shall be indicated in the field notebook. Field Sampling SOPs are provided in APPENDIX B.
Draft May - 01 26

Title: Sands Pond QAPP Revision Number: 2
Date: 7/10/01 Page: 27 of 97
B11.1 Field Analytical Methods and Standard Operating Procedures Table B11. 1 Field Analytical Method/SOP Reference Table
Reference Number
Title, Revision
Date and/or
Number
Definitive or
Screening Data
Originating Organization
Analytical
Parameter
Instrument
Organization Performing
Field Analysis
Modified for
Project Work Plan
Y or N
FSOP � 5
RIDEM � Procedure for field sampling Odor
Screening RIDEM Odor N/A RIDEM N
FSOP � 6
RIDEM � Procedure for field sampling Depth
Screening RIDEM Depth
Measurement
Calibrated Line RIDEM N
Dissolved Oxygen YSI Model 85 RIDEM N
FSOP � 7
RIDEM � Procedure for field sampling Dissolved Oxygen and Temperature
Definitive RIDEM Temperature YSI Model 85 RIDEM N
B12.0 Fixed Laboratory Analytical Method Requirements All samples shall be taken to the appropriate laboratory for analysis. These samples will be analyzed according to the attached Standard Operating Procedures (SOP) from each of the laboratories( See Appendix D). B12.1 Fixed Laboratory Analytical Methods and Standard Operating Procedures Table B12. 1 Fixed Laboratory Analytical Method/SOP Reference Table
Reference Number
Fixed Laboratory Performing
Analysis
Title, Revision
Date and/or Number
Definitive or Screening
Analytical Parameter Instrument
Modified for Work
Project Y or N
SOP � 1 URIWW SOP-1 Total Phosphorous & Total Nitrogen
Definitive Total Phosphorous
Alpkem Corp. Model �300 Autoanalyzer
N
SOP � 2 URIWW SOP � 2 Ortho-phosphate phosphorous
Definitive Ortho-phosphate phosphorous
Alpkem Corp. Model �300 Autoanalyzer
N
SOP � 3 URIWW
SOP � 3 URI Watershed Watch Chlorophyll � A Analysis Procedure
Definitive Chlorophyll �a
Turner Designs Digital Flurometer Model TD-700
N
SOP � 4 ESS Laboratory
SOP �4 Method # 180.1 , Turbidity (Nephelometric) Storet No. 00076
Definitive Turbidity
Hatch Turbidimeter, Model 2100 and 2100 A
N
Draft May - 01 27

B13
.0 Q
ualit
y C
ontr
ol R
equi
rem
ents
Ta
ble
B13
. 1 F
ield
Sam
plin
g Q
C:
Tota
l Pho
spho
rous
T
itle:
San
ds P
ond
QA
PP
Rev
isio
n N
umbe
r: 2
D
ate:
7/1
0/01
Pa
ge: 2
9 of
97
Sam
plin
g SO
P FS
OP-
1 M
ediu
m /
Mat
rix
Surf
ace
Wat
er
Ana
lytic
al
Para
met
er
Tota
l Pho
spho
rous
Con
cent
ratio
n Le
vel
2 pp
b (u
g/l)
Ana
lytic
al M
etho
d/
SOP
Ref
eren
ce
SOP-
1
QC
Fr
eque
ncy
/ Num
ber
Met
hod/
SOP
QC
A
ccep
tanc
e Li
mits
C
orre
ctiv
e A
ctio
n Pe
rson
Res
pons
ible
fo
r Cor
rect
ive
Act
ion
Fiel
d D
uplic
ates
M
inim
um 1
per
5 sa
mpl
es
FSO
P-1
Dis
cuss
any
pro
blem
s w
ith P
roje
ct Q
ualit
y C
ontro
l Off
icer
Pr
ojec
t Man
ager
Coo
ler T
empe
ratu
re
Bla
nk
1 Pe
r Coo
ler
40 C o
r les
s A
dd Ic
e / R
e- sa
mpl
e Pr
ojec
t Man
ager
Tabl
e B
13. 2
Fi
eld
Sam
plin
g Q
C:
Orth
o-ph
osph
ate
Phos
phor
ous
Sam
plin
g SO
P FS
OP-
2 M
ediu
m /
Mat
rix
Surf
ace
Wat
er
Ana
lytic
al
Para
met
er
Orth
o-ph
osph
ate
Ph
osph
orou
s C
once
ntra
tion
Leve
l 2
ppb
(ug/
l) A
naly
tical
Met
hod/
SO
P R
efer
ence
SO
P-2
QC
Fr
eque
ncy
/ Num
ber
Met
hod/
SOP
QC
A
ccep
tanc
e Li
mits
C
orre
ctiv
e A
ctio
n Pe
rson
Res
pons
ible
fo
r Cor
rect
ive
Act
ion
Fiel
d D
uplic
ates
M
inim
um 1
per
5 sa
mpl
es
FSO
P-2
Dis
cuss
any
pro
blem
s w
ith P
roje
ct Q
ualit
y C
ontro
l Off
icer
Pr
ojec
t Man
ager
Coo
ler T
empe
ratu
re
Bla
nk
1 Pe
r Coo
ler
40 C o
r les
s A
dd Ic
e / R
e- sa
mpl
e Pr
ojec
t Man
ager
Dra
ft M
ay -
01
29

Tabl
e B
13. 3
Fi
eld
Sam
plin
g Q
C:
Chl
orop
hyll
� a
Titl
e: S
ands
Pon
d Q
APP
R
evis
ion
Num
ber:
2
Dat
e: 7
/10/
01
Page
: 30
of 9
7
Sam
plin
g SO
P FS
OP-
1 M
ediu
m /
Mat
rix
Surf
ace
Wat
er
Ana
lytic
al
Para
met
er
Chl
orop
hyll
�a
Con
cent
ratio
n Le
vel
0.1
ug/l
Ana
lytic
al M
etho
d/
SOP
Ref
eren
ce
SOP-
3
QC
Fr
eque
ncy
/ Num
ber
Met
hod/
SOP
QC
A
ccep
tanc
e Li
mits
C
orre
ctiv
e A
ctio
n Pe
rson
Res
pons
ible
fo
r Cor
rect
ive
Act
ion
Fiel
d D
uplic
ates
M
inim
um 1
per
5 sa
mpl
es
FSO
P-3
Dis
cuss
any
pro
blem
s w
ith P
roje
ct Q
ualit
y C
ontro
l Off
icer
Pr
ojec
t Man
ager
Coo
ler T
empe
ratu
re
Bla
nk
1 Pe
r Coo
ler
40 C o
r les
s A
dd Ic
e / R
e- sa
mpl
e Pr
ojec
t Man
ager
Tabl
e B
13. 4
Fi
eld
Sam
plin
g Q
C:
Turb
idity
Sa
mpl
ing
SOP
FSO
P-4
Med
ium
/ M
atrix
Su
rfac
e W
ater
A
naly
tical
Pa
ram
eter
Tu
rbid
ity
Con
cent
ratio
n Le
vel
0.5
NTU
A
naly
tical
Met
hod/
SO
P R
efer
ence
SO
P-4
QC
Fr
eque
ncy
/ Num
ber
Met
hod/
SOP
QC
A
ccep
tanc
e Li
mits
C
orre
ctiv
e A
ctio
n Pe
rson
Res
pons
ible
fo
r Cor
rect
ive
Act
ion
Fiel
d D
uplic
ates
M
inim
um 1
per
5 sa
mpl
es
FSO
P-4
Dis
cuss
any
pro
blem
s w
ith P
roje
ct Q
ualit
y C
ontro
l Off
icer
Pr
ojec
t Man
ager
Coo
ler T
empe
ratu
re
Bla
nk
1 Pe
r Coo
ler
40 C o
r les
s A
dd Ic
e / R
e- sa
mpl
e Pr
ojec
t Man
ager
Dra
ft M
ay -
01
30

Tabl
e B
13. 5
Fi
xed
Labo
rato
ry A
naly
tical
QC
: To
tal P
hosp
horo
us
Titl
e: S
ands
Pon
d Q
APP
R
evis
ion
Num
ber:
2
Dat
e: 7
/10/
01
Page
: 31
of 9
7
Sam
plin
g SO
P SO
P-1
Med
ium
/ M
atrix
Su
rfac
e W
ater
A
naly
tical
Pa
ram
eter
To
tal P
hosp
horo
us
Con
cent
ratio
n Le
vel
Ug/
l La
bora
tory
U
RI W
ater
shed
Wat
ch
Labo
rato
ry Q
C
Freq
uenc
y / N
umbe
r
Met
hod/
SOP
QC
A
ccep
tanc
e Li
mits
C
orre
ctiv
e A
ctio
n (C
A)
Pers
on (s
) R
espo
nsib
le
for C
orre
ctiv
e A
ctio
n
Dat
a Q
ualit
y In
dica
tor (
DQ
I)
Mea
sure
men
t Pe
rfor
man
ce C
riter
ia
Met
hod
Bla
nk
2 pe
r set
of 9
0 sa
mpl
es
<QL
Re-
run
Lind
aG
reen
A
ccur
acy/
cont
amin
atio
n <Q
l
Rea
gent
Bla
nk
2 pe
r set
of 9
0 sa
mpl
es
<QL
Re-
run
Lind
aG
reen
A
ccur
acy/
cont
amin
atio
n <Q
l
Stor
age
Bla
nk
N/A
Inst
rum
ent B
lank
N
/A
Labo
rato
ry
Dup
licat
e A
ll sa
mpl
es a
re
anal
yzed
in d
uplic
ate
or tr
iplic
ate
<20%
RPD
Re-
run
Lind
aG
reen
Prec
isio
n<2
0%R
PD
Labo
rato
ry M
atrix
Sp
ike
N/A
Mat
rix D
uplic
ate
Spik
es
N/A
LCS
Purc
hase
ext
erna
l st
anda
rd
2 pe
r set
of 9
0 sa
mpl
es
15%
cv
R
e-ru
nLi
nda
Gre
en
Acc
urac
y/pr
ecis
ion
15%
cv
LFB
N
/A
Su
rrog
ates
N
/A
In
tern
al S
tand
ards
(I
Ss)
N/A
Dra
ft M
ay -
01
31
Tabl
e B
13. 6
Fi
xed
Labo
rato
ry A
naly
tical
QC
: Orth
o-ph
osph
ate
phos
phor
ous
Titl
e: S
ands
Pon
d Q
APP
R
evis
ion
Num
ber:
2
Dat
e: 7
/10/
01
Page
: 32
of 9
7
Sam
plin
g SO
P SO
P-2
Med
ium
/ M
atrix
Su
rfac
e W
ater
A
naly
tical
Pa
ram
eter
O
rtho-
phos
phat
e ph
osph
orou
s
Con
cent
ratio
n Le
vel
Ug/
l La
bora
tory
U
RI W
ater
shed
Wat
ch
Labo
rato
ry Q
C
Freq
uenc
y / N
umbe
r
Met
hod/
SOP
QC
A
ccep
tanc
e Li
mits
C
orre
ctiv
e A
ctio
n (C
A)
Pers
on (s
) R
espo
nsib
le
for C
orre
ctiv
e A
ctio
n
Dat
a Q
ualit
y In
dica
tor (
DQ
I)
Mea
sure
men
t Pe
rfor
man
ce C
riter
ia
Met
hod
Bla
nk
2 pe
r set
of 9
0 sa
mpl
es
<QL
Re-
run
Lind
aG
reen
A
ccur
acy/
cont
amin
atio
n <Q
l
Rea
gent
Bla
nk
2 pe
r set
of 9
0 sa
mpl
es
<QL
Re-
run
Lind
aG
reen
A
ccur
acy/
cont
amin
atio
n <Q
l
Stor
age
Bla
nk
N/A
Inst
rum
ent B
lank
N
/A
Labo
rato
ry
Dup
licat
e A
ll sa
mpl
es a
re
anal
yzed
in d
uplic
ate
or tr
iplic
ate
<20%
RPD
Re-
run
Lind
aG
reen
Prec
isio
n<2
0%R
PD
Labo
rato
ry M
atrix
Sp
ike
N/A
Mat
rix D
uplic
ate
Spik
es
N/A
LCS
Purc
hase
ext
erna
l st
anda
rd
2 pe
r set
of 9
0 sa
mpl
es
15%
cv
R
e-ru
nLi
nda
Gre
en
Acc
urac
y/pr
ecis
ion
15%
cv
LFB
N
/A
Su
rrog
ates
N
/A
In
tern
al S
tand
ards
(I
Ss)
N/A
Dra
ft M
ay -
01
32

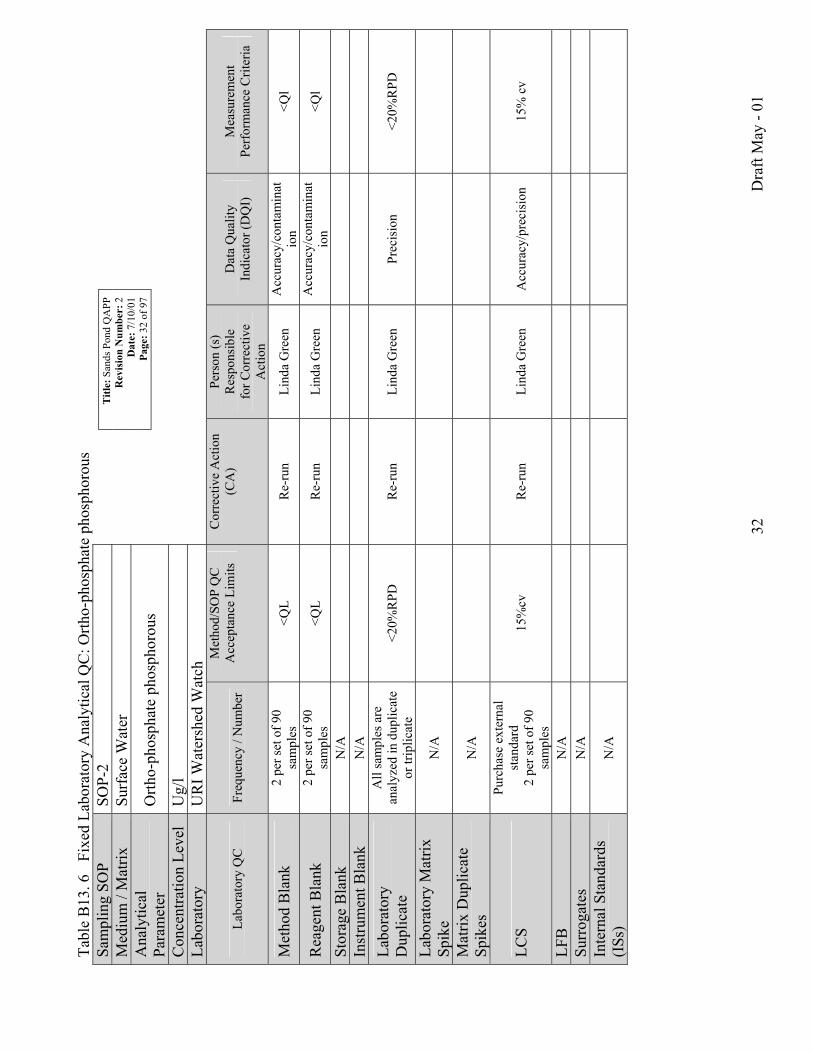
Tabl
e B
13. 7
Fi
xed
Labo
rato
ry A
naly
tical
QC
: Chl
orop
hyll
- a
Titl
e: S
ands
Pon
d Q
APP
R
evis
ion
Num
ber:
2
Dat
e: 7
/10/
01
Page
: 33
of 9
7
Sam
plin
g SO
P SO
P-3
Med
ium
/ M
atrix
Su
rfac
e W
ater
A
naly
tical
Pa
ram
eter
C
hlor
ophy
ll �
a
Con
cent
ratio
n Le
vel
Ug/
l La
bora
tory
U
RI W
ater
shed
Wat
ch
Labo
rato
ry Q
C
Freq
uenc
y / N
umbe
r
Met
hod/
SOP
QC
A
ccep
tanc
e Li
mits
C
orre
ctiv
e A
ctio
n (C
A)
Pers
on (s
) R
espo
nsib
le
for C
orre
ctiv
e A
ctio
n
Dat
a Q
ualit
y In
dica
tor (
DQ
I)
Mea
sure
men
t Pe
rfor
man
ce C
riter
ia
Met
hod
Bla
nk
1 pe
r set
of 4
0 <Q
L R
e-cl
ean,
re-r
un
Lind
a G
reen
C
onta
min
atio
n <Q
l R
eage
nt B
lank
1
per s
et o
f 40
<QL
Re-
clea
m, r
e-ru
n Li
nda
Gre
en
Con
tam
inat
ion
<Ql
Stor
age
Bla
nk
N/A
Inst
rum
ent B
lank
1
per s
et o
f 40
<QL
Re-
clea
n, re
-run
Li
nda
Gre
en
<QC
<Q
L La
bora
tory
D
uplic
ate
All
sam
ples
<2
0%R
PD
Qua
lify
Lind
a G
reen
Pr
ecis
ion-
lab
<20%
RPD
Labo
rato
ry M
atrix
Sp
ike
N/A
Mat
rix D
uplic
ate
Spik
es
N/A
LCS
N/A
15
%cv
Re-
run
Lind
aG
reen
A
ccur
acy/
prec
isio
n15
%cv
LFB
N
/A
Su
rrog
ates
2
per s
et o
f 40
<20%
RPD
Q
ualif
y Li
nda
Gre
en
Prec
isio
n-la
b <2
0%R
PD
Inte
rnal
Sta
ndar
ds
(ISs
) N
/A
Oth
er: e
xter
nal
stan
dard
s 2
per s
et o
f 40
<20%
RPD
Q
ualif
y Li
nda
Gre
en
<20%
RPD
<2
0%R
PD
Dra
ft M
ay -
01
33

Tabl
e B
13. 8
Fi
xed
Labo
rato
ry A
naly
tical
QC
: Tu
rbid
ity
Titl
e: S
ands
Pon
d Q
APP
R
evis
ion
Num
ber:
2
Dat
e: 7
/10/
01
Page
: 34
of 9
7
Sam
plin
g SO
P SO
P-4
Med
ium
/ M
atrix
Su
rfac
e W
ater
A
naly
tical
Pa
ram
eter
Tu
rbid
ity
Con
cent
ratio
n Le
vel
NTU
La
bora
tory
ES
S La
bora
tory
QC
Fr
eque
ncy
/ Num
ber
Met
hod/
SOP
QC
A
ccep
tanc
e Li
mits
C
orre
ctiv
e A
ctio
n Pe
rson
Res
pons
ible
fo
r Cor
rect
ive
Act
ion
Mea
sure
men
t Pe
rfor
man
ce
Crit
eria
M
etho
d B
lank
1
per b
atch
<M
DL
Re-
run
batc
h ES
S La
bora
tory
Man
ager
<M
DL
Con
stan
t B
egin
ning
, eve
ry 1
0 sa
mpl
es, e
nd
+/- 1
0% tr
ue v
alue
C
heck
inst
rum
ent
calib
ratio
n ES
S La
bora
tory
Man
ager
+/
- 10%
true
val
ue
Labo
rato
ry
Cal
ibra
tion
Rep
licat
e 1
ever
y 10
sam
ples
+/
- 20%
R
e-ru
n ba
tch
ESS
Labo
rato
ry M
anag
er
+/- 2
0%
Dra
ft M
ay -
01
34

Title: Sands Pond QAPP Revision Number: 2
Date: 7/10/01 Page: 35 of 97
B14.0 Data Acquisition Requirements Sands Pond is a public drinking water supply, and the Block Island Water Company and the Rhode Island Department of Health have previously monitored water quality. Historic data is limited and is not of sufficient quality or scope to adequately address the impairments to this waterbody. The information on water quality gathered from non-direct measurements will be used only as a reference, and will not impact the decision making process of the current project. Information obtained from secondary sources as tools for analyzing the watershed are listed below. Table B14. 1 Non-Direct Measurements Criteria and Limitations
Non-Direct Measurement
(Secondary Data) Data Source Data Generator How Data Will Be
Used Limitations on
Data Use
Rainfall
http://www.instaweather.com/wjar/blockisland
WJAR Channel 10 Weather Station, BI School
Quantify amount of rainfall received within watershed
Watershed ISDS Status
Block Island Geographic Information System (BIGIS)
New Shoreham Waste Water Officer
Loading allocations for septic systems within watershed
Estimated quantities, seasonal variations
Land Use BIGIS BIGIS Loading allocations for runoff characteristics
Assumed loadings based on reference information
Wildlife Populations
Observations, interviews, personnel discussions
Misc. sources Loading allocations Assumed loadings based on reference information
B15.0 Documentation, Records, and Data Management The Project Manager shall maintain a field notebook, including field log sheets. The monitoring plan as detailed within this report shall be adhered to while sampling. The Project Manager shall review and consult with the Project Quality Control Officer following each sampling event in order to identify any possible errors or omissions. The Project Manager shall collect all samples and complete the chain of custody forms for each sampling event. The samples and chain of custody forms shall also be rechecked upon delivery of the samples to the laboratory. A copy of the chain of custody form will be given to the Project Manager when the samples are dropped off at the laboratory. This copy will be retained in the project file. After analysis is complete, sample results from the laboratory will be mailed to the Project Manager at RIDEM.
Draft May - 01 35
Title: Sands Pond QAPP Revision Number: 2
Date: 7/10/01 Page: 36 of 97
Upon completion of the initial dry weather and wet weather survey, a brief status report will be written in order to document any changes made to the monitoring plan. All information collected throughout the project will be summarized in the Final Data Report. Information included in the Final Data Report is summarized in section B17.0. Table B15.1 summarizes the records that will be generated throughout this project. The Project Manager is responsible for maintaining a project file, and storage of all sampling data. A central file is located in the Providence Office of RIDEM. All original documents, including the field notebook shall be maintained in this central file. Table B15. 1 Project Documentation and Records
Sample Collection Records Field Analysis Records Fixed Laboratory Records Data Assessment Records
Field Notes / Log Sheets Field Notes / Log Sheets Chain of Custody Records Status Reports
Chain of Custody Records Tabulated Data Summary
Forms: Draft and Final Final Data Report
Monitoring Plan
C16.0 Assessments and Response Actions The Project Manager shall be responsible for each of the project tasks and their associated quality assurance and quality control procedures. The Project Manager will provide consistency between sampling events. Continuous reports to the Project Quality Assurance Officer concerning the status of the project, sampling, quality assurance and quality control will highlight any problems that are encountered during sampling. If needed, the QA Officer and the Project Manager will halt sampling until problems are remedied. Table C16. 1 Project Assessment Table
Assessment Type Frequency Internal
or External
Person Responsible for Performing Assessment and
Implementing Corrective Actions
Person Responsible for Monitoring the
Effectiveness of the Corrective Action
Field Sampling Technical System Audit Start of Sampling I Lucinda Hannus
RIDEM Wayne Jenkins RIDEM
URIWW Laboratory Technical System Audit
Prior to Sample Receipt E Linda Green
URI Watershed Watch Lucinda Hannus RIDEM
ESS Laboratory Technical System Audit
Prior to Sample Receipt E Kathy DeSousa
ESS Laboratory Lucinda Hannus RIDEM
Draft May - 01 36

Title: Sands Pond QAPP Revision Number: 2
Date: 7/10/01 Page: 37 of 97
C17.0 QA Management Reports Table C17.1 lists the QA Management Reports that will be generated throughout this study. As needed during the project, the Project Manager and the QA Officer will meet to discuss any issues related to sampling. These meetings will be verbal status reports. Problems encountered in the field will be discussed and any appropriate actions determined and implemented. Any changes and/or problems will be included in the final report. After the shoreline surveys (dry and wet) the Project Manager will generate a Status Report. This Status Report will be the written record of any changes to the QA Plan. If stations are changed it will be documented here. Issues discussed during the Verbal Status Report can also be included. Upon completion of the sampling the Project Manager will write a final report summarizing the sampling events. Information in this final report will include the following information: • Brief description of each sampling event; • Data tables of all data collected during each sampling event; and • Attachments
• Status Reports • Sampling Logs • Chain of Custody Forms • Laboratory data sheets provided by the labs
Table C17. 1 QA Management Reports
Type of Report Frequency Person(s) Responsible for Report Preparation Report Recipient
Verbal Status Report As needed Lucinda Hannus RIDEM
Wayne Jenkins RIDEM
Written Status Report After dry and wet weather shoreline surveys
Lucinda Hannus RIDEM
Wayne Jenkins RIDEM
Final Report Completion of Sampling Lucinda Hannus RIDEM
Wayne Jenkins RIDEM
C18.0 Verification and Validation Requirements Both the Project Manager and the Project QA Officer will review data collected during this study to determine if the data meets QAPP Objectives. Decisions to qualify or reject data will be made by the Project Manager and QA Officer. All data collected will be included in the Final Report. To ensure correct interpretation of the data, all problems encountered in the field will be included in the Appendix to the report and discussed in the general text of the report. Problems will also be documented in each survey�s written Status Report or included in the Field Notebook. To assist in data interpretation, statistical information on sampling events, including sampling
Draft May - 01 37

Title: Sands Pond QAPP Revision Number: 2
Date: 7/10/01 Page: 38 of 97
size, sample mean, and sample variance, will be reported, where applicable. A discussion on duplicate precision and accuracy criteria and results will also be discussed in the Final Report. C19.0 Verification and Validation Procedures All data collected during the sampling events will be included in the appendix of the report. Once the data has been collected, it will be entered into Microsoft Excel or similar spreadsheet reporting software. The Project Manager will proofread the data entry for errors, and will correct any discrepancies. Outliers and inconsistencies will be flagged for further review with the QA Officer. The decision to discard data will be made by the Project Manager and the Project QA Officer. Problems will be discussed in the Final Report. Table C19.1 discusses the data verification process. Table C19. 1 Data Verification Process
Verification Task Description Internal / External Responsible for Verification
Field Notes
Field notes will be collected at the end of each sampling event and the dry and wet weather shore- line surveys. Any required corrective actions will be addressed and implemented prior to the next sampling session. Field notes will be transcribed into the final project report and copies will be maintained with the project file.
I Lucinda Hannus RIDEM
Chain of Custody Forms
Chain of Custody forms will be reviewed when samples are collected for delivery to the laboratory in the field and at the laboratory. The forms will be maintained in the project file.
I/E
Lucinda Hannus RIDEM Linda Green URI Watershed Watch Kelly DeSousa ESS Laboratory
Laboratory Data
All laboratory data packages will be verified internally by the laboratory performing the work for completeness prior to submittal. The data packages will also be reviewed by the Project Manager.
I/E
Lucinda Hannus RIDEM Linda Green URI Watershed Watch Kelly DeSousa ESS Laboratory
Data validation will utilize the measurement performance criteria documented in Tables B13.5 through B13.8 of this report.
Draft May - 01 38
Title: Sands Pond QAPP Revision Number: 2
Date: 7/10/01 Page: 39 of 97
C20.0 Data Usability / Reconciliation with Project Quality Objectives As soon as possible after each sampling event, calculations and determination for precision, completeness, and accuracy will be made and corrective action implemented if needed. If data quality indicators meet those measurement performance criteria documented throughout this QA plan, the project will be considered a success. If there are data that do not meet the measurement performance criteria established in this QA Plan, the data may be discarded and sampled again or the data may be used with stipulations written about its accuracy in the Final Report. The cause of the error will be evaluated. If the cause is sampling error, additional training will be provided. Any limitations with the data will be documented in the Status Reports and the Final Report.
Draft May - 01 39

Title: Sands Pond QAPP Revision Number: 2
Date: 7/10/01 Page: 40 of 97
APPENDIX A DEPTH MEASUREMENT � TASK 3 SAMPLING STATION LOCATION SHEET � TASK 3 FIELD SAMPLING LOG SHEET
Draft May - 01 40

Title: Sands Pond QAPP Revision Number: 2
Date: 7/10/01 Page: 41 of 97
DEPTH MEASUREMENTS FIELD SHEET
TASK 2
Draft May - 01 41

Title: Sands Pond QAPP Revision Number: 2
Date: 7/10/01 Page: 42 of 97
Page left blank intentionally Insert 11 X 17 Depth Measurement Field Sheet
Draft May - 01 42

Title: Sands Pond QAPP Revision Number: 2
Date: 7/10/01 Page: 43 of 97
SAMPLING STATION LOCATION SHEET
TASK 3
Draft May - 01 43

Title: Sands Pond QAPP Revision Number: 2
Date: 7/10/01 Page: 44 of 97
Sands Pond
New Shoreham, Rhode Island Sampling Station Location Sheet
Task 3 Date: ______________
Survey Number: ________________________ Station Number: _________________________
Sampling Team Names: ________________________________Project Manager ________________________________Title: _______________________________ Station Location Description: _______________________________________________________________ First Bearing: ____________________________________________________________________________ _________________________________________________________________________________________ _________________________________________________________________________________________ Second Bearing: __________________________________________________________________________ _________________________________________________________________________________________ _________________________________________________________________________________________ Depth: __________________________________________________________________________________
Draft May - 01 44

Title: Sands Pond QAPP Revision Number: 2
Date: 7/10/01 Page: 45 of 97
FIELD SAMPLING LOG SHEET
Draft May - 01 45

Title: Sands Pond QAPP Revision Number: 2
Date: 7/10/01 Page: 46 of 97
Page left blank intentionally Insert Field Sampling Log sheet
Draft May - 01 46

Title: Sands Pond QAPP Revision Number: 2
Date: 7/10/01 Page: 47 of 97
APPENDIX B GENERAL FIELD PROCEDURES FIELD SAMPLING PROCEDURES � FSOP - 1 THROUGH FSOP � 7
Draft May - 01 47

Title: Sands Pond QAPP Revision Number: 2
Date: 7/10/01 Page: 48 of 97
GENERAL FIELD PROCEDURES
Sampling shall be conducted on a bi-monthly schedule starting in early spring, and continue till fall. For all sampling Confirm sampling date and schedule with RIDEM personnel Check current and forecasted weather Obtain proper safety equipment, and personnel floatation device. Obtain sampling equipment and supply checklist All dry weather sampling should take place during the hours of 10:00 am and 3:00 pm. Equipment checklist: Anchor with calibrated line to check depth Secchi disk with calibrated line and 2 clothespins Horizontal water sampler (Cleaned and prepared for sampling) Ice cooler with ice or freezer packs Clipboard, pencils Field notebook containing map and sampling log sheets Sampling Field Procedures Load and launch boat. Samplers shall locate the station by using the appropriate landmarks visible on the shore that are described in the field notebook, and shown on the map of the pond. Locate the first bearing using the described landmarks, turn 900 , and locate the second bearing to confirm sampling location. Drop the anchor to maintain position. Care should be taken to not reposition the anchor and disturb sediments on the bottom. Measure the depth to further verify the sampling location. Two sampling depths will be used for Total and Ortho-phosphate Phosphorous, Chlorophyll a and Turbidity. The first sample shall be taken at a depth of approximately 1- 1 1/2 feet by carefully reaching from the side of the boat. The second sample shall be taken using the horizontal water sampler at a depth just above the bottom. Complete observation portion of log sheet for each sample location. Measure Secchi depth as per FSOP # 5, record depth on appropriate log sheet. Collect two point samples for each constitute following appropriate FSOPs.
Draft May - 01 48

Title: Sands Pond QAPP Revision Number: 2
Date: 7/10/01 Page: 49 of 97
Using YSI Model *85 Handheld Oxygen, Conductivity, Salinity and Temperature gage, measure the Dissolved Oxygen and Temperature for each sampling site as per FSOP � 7 and record values in the field log book. Complete sampling for all locations indicated in the field notebook. Return to shore and unload boat. Add ice or freezer packs to cooler as necessary to maintain proper temperature. Clean equipment as required. The Secchi disk and water sampler should be rinsed off with fresh tap water. Complete appropriate Chain of Custody form according to constituent and laboratory. Deliver all samples to appropriate laboratory ASAP or within six (6) hours. Reference: Field Standard Operating Procedure Total Phosphorous (TP) FSOP � 1 Ortho-phosphate Phosphorous (OP) FSOP � 2 Chlorophyll a (C) FSOP � 3 Turbidity (T) FSOP � 4 Odor (O) FSOP � 5 Depth Measurement FSOP � 6 Dissolved Oxygen & Temperature FSOP - 7
Draft May - 01 49

Title: Sands Pond QAPP Revision Number: 2
Date: 7/10/01 Page: 50 of 97
FSOP � 1
TOTAL PHOSPHOROUS (TP)
The following field procedures shall be followed. The laboratory shall provide clean sample bottles of the appropriate size and type. Ensure all bottles are labeled properly prior to sampling. Surface (Maximum depth of 1 � 1 ½ ft)
Remove cap from appropriate sample container, taking care not to touch the container mouth.
Rinse the container with pond water by holding it by the bottom and plunging it mouth-first into the pond to about elbow depth. Your hand should always move in a forward motion to avoid water from sliding over your arm and into the container. Fill the container, turn the mouth upwards, bring it above the surface, empty the container. Rinse the cap at the same depth, holding the outside of the cap when plunging. Using the same motion, collect the sample of water in the container. Tip out some of the water to leave an air space and cap the container. Store container in cooler.
Deep Sample Using Horizontal Water Sampler
Using the self-closing horizontal water sampler, prepare the sampler for sampling and lower to the appropriate depth. Record depth on field notesheet.
Move the sampler from side to side through the water to ensure that it is flushed with ambient water, then release the messenger to isolate the sample. Bring the sampler up on deck, then draw off the water into the appropriate container. Fill the appropriate container for Total Phosphate taking care not to contaminate container or cap. Store sample in cooler. During each run a blind duplicate sample will be taken from the surface at one station and at full depth at another station. Duplicates will be collected as separate samples and are not splits of routine samples.
Draft May - 01 50

Title: Sands Pond QAPP Revision Number: 2
Date: 7/10/01 Page: 51 of 97
Upon completion of all sampling, return to shore and unload equipment Add ice or freezer packs to cooler to maintain proper temperature. Transport all samples to the appropriate laboratory as soon as possible or within 6 hours.
Draft May - 01 51

Title: Sands Pond QAPP Revision Number: 2
Date: 7/10/01 Page: 52 of 97
FSOP � 2 Ortho-phosphate Phosphorous (OP)
The following field procedures shall be followed. The laboratory shall provide clean sample bottles of the appropriate size and type. Label all sample bottles prior to sampling Surface (Maximum depth of 1 � 1 ½ ft)
Remove cap from appropriate sample container, taking care not to touch the container mouth.
Rinse the container with pond water by holding it by the bottom and plunging it mouth-first into the pond to about elbow depth. Your hand should always move in a forward motion to avoid water from sliding over your arm and into the container. Fill the container, turn the mouth upwards, bring it above the surface, empty the container. Rinse the cap at the same depth, holding the outside of the cap when plunging. Using the same motion, collect the sample of water in the container. Tip out some of the water to leave an air space and cap the container. Store container in cooler.
Deep Sample Using Horizontal Water Sampler
Using the self-closing horizontal water sampler, prepare the sampler for sampling and lower to the appropriate depth. Record depth in field logbook.
Move the sampler from side to side through the water to ensure that it is flushed with ambient water, then release the messenger to isolate the sample. Bring the sampler up on deck, then draw off the water into the appropriate container. Fill the appropriate container for Ortho-phophate Phosphate taking care not to contaminate container or cap. Store sample in cooler. During each run a blind duplicate sample will be taken from the surface at one station and at full depth at another station. Duplicates will be collected as separate samples and are not splits of routine samples.
Draft May - 01 52

Title: Sands Pond QAPP Revision Number: 2
Date: 7/10/01 Page: 53 of 97
Upon completion of all sampling, return to shore and unload equipment. Add ice or freezer packs to cooler to maintain proper temperature. Transport all samples to the appropriate laboratory as soon as possible or within 6 hours.
Draft May - 01 53

Title: Sands Pond QAPP Revision Number: 2
Date: 7/10/01 Page: 54 of 97
FSOP � 3 Chlorophyll a (C)
The following field procedures shall be followed. The laboratory shall provide clean sample bottles of the appropriate size and type. Label all sample bottles prior to sampling Surface (Maximum depth of 1 � 1 ½ ft)
Remove cap from appropriate sample container, taking care not to touch the container mouth.
Rinse the container with pond water by holding it by the bottom and plunging it mouth-first into the pond to about elbow depth. Your hand should always move in a forward motion to avoid water from sliding over your arm and into the container. Fill the container, turn the mouth upwards, bring it above the surface, empty the container. Rinse the cap at the same depth, holding the outside of the cap when plunging. Using the same motion, collect the sample of water in the container. Tip out some of the water to leave an air space and cap the container. Store container in cooler.
Deep Sample Using Horizontal Water Sampler
Using the self-closing horizontal water sampler, prepare the sampler for sampling and lower to the appropriate depth. Record depth in field logbook.
Move the sampler from side to side through the water to ensure that it is flushed with ambient water, then release the messenger to isolate the sample. Bring the sampler up on deck, then draw off the water into the appropriate container. Fill the appropriate container for Chlorophyll a taking care not to contaminate container or cap. Store sample in cooler. During each run a blind duplicate sample will be taken from the surface at one station and at full depth at another station. Duplicates will be collected as separate samples and are not splits of routine samples.
Draft May - 01 54

Title: Sands Pond QAPP Revision Number: 2
Date: 7/10/01 Page: 55 of 97
It is very important to put all chlorophyll sample bottles into the cooler and out of the sunlight as soon as possible. Upon completion of all sampling, return to shore and unload equipment Add ice or freezer packs to cooler to maintain proper temperature. Transport all samples to the appropriate laboratory as soon as possible or within 6 hours. Keep the lid on the cooler closed to keep sample out of sunlight.
Draft May - 01 55

Title: Sands Pond QAPP Revision Number: 2
Date: 7/10/01 Page: 56 of 97
FSOP � 4 Turbidity (T)
The following field procedures shall be followed. The laboratory shall provide clean sample bottles of the appropriate size and type. Label all sample bottles prior to sampling. Surface (Maximum depth of 1 � 1 ½ ft)
Remove cap from appropriate sample container, taking care not to touch the container mouth.
Rinse the container with pond water by holding it by the bottom and plunging it mouth-first into the pond to about elbow depth. Your hand should always move in a forward motion to avoid water from sliding over your arm and into the container. Fill the container, turn the mouth upwards, bring it above the surface, empty the container. Rinse the cap at the same depth, holding the outside of the cap when plunging. Using the same motion, collect the sample of water in the container. Tip out some of the water to leave an air space and cap the container. Store sample in cooler.
Deep Sample Using Horizontal Water Sampler
Using the self-closing horizontal water sampler, prepare the sampler for sampling and lower to the appropriate depth. Record depth in field logbook.
Move the sampler from side to side through the water to ensure that it is flushed with ambient water, then release the messenger to isolate the sample. Bring the sampler up on deck, then draw off the water into the appropriate container. Fill the appropriate container for Chlorophyll a taking care not to contaminate container or cap. Store sample in cooler. During each run a blind duplicate sample will be taken from the surface at one station and at full depth at another station. Duplicates will be collected as separate samples and are not splits of routine samples.
Draft May - 01 56

Title: Sands Pond QAPP Revision Number: 2
Date: 7/10/01 Page: 57 of 97
Deliver sample to laboratory as soon as possible. Preservatives are not practical, analysis should begin as soon as possible. Refrigeration or icing to 40 C, to minimize microbiological decomposition of solids, is recommended.
Draft May - 01 57

Title: Sands Pond QAPP Revision Number: 2
Date: 7/10/01 Page: 58 of 97
FSOP � 5 Odor
Odors are a very subjective parameter to sample, and individual samplers may have a strong or weak sense of smell. Therefore, the project manager shall make the odor observations so as to remain consistent throughout the project. The project manager will discuss with the additional staff person assisting with the sampling for confirmation of the noted odors. Discrepancies between samplers shall be noted on the field sample log sheet. Upon arriving at the sample site, the project manager shall record in the sample log sheet any indication of any odors detected at the sample site. Refer to the sample log sheet for descriptions and intensity values. Each sample site shall be sampled.
Draft May - 01 58

Title: Sands Pond QAPP Revision Number: 2
Date: 7/10/01 Page: 59 of 97
FSOP � 6 Depth Measurement
For confirmation of the correct sampling location, the depth of the pond shall be measured and recorded on the field sample log sheet. Using a calibrated anchor line, the project manager shall lower the anchor line slowly to the bottom of the pond. Avoid disturbing the bottom sediments with excess relocation of the anchor. While holding the line taut read the depth measurement from the calibrated line and record measurement on the field sample log sheet. The depth measurement should be within +/- 0.5 feet of desired depth. If depth measurement exceeds the tolerance, relocate boat by repositioning along described bearings from sample log sheet. Repeat anchoring procedure as necessary to obtain proper position, again being careful not to disturb bottom sediments.
Draft May - 01 59

Title: Sands Pond QAPP Revision Number: 2
Date: 7/10/01 Page: 60 of 97
FSOP � 7 Dissolved Oxygen (DO) and Temperature (Temp)
Sampling for Dissolved Oxygen and Temperature shall take place at all sample locations and at the two depths, the first at the surface and the second one � two feet above the bottom. A YSI Model # 85 Handheld Oxygen, Conductivity, Salinity, and Temperature System field meter shall be used. The meter shall be calibrated prior to field sampling according to manufacturer�s instructions. Field calibration is not necessary. A spare set of fresh batteries should be required equipment. The probe cable shall be calibrated using pieces of duct tape at one foot intervals in order to measure the depth of the probe at each sample station. Turn the meter on, allow the meter to run through it�s self-test procedure until completed and no internal problem is detected. Follow troubleshooting instructions provided by the manufacturer to correct any errors. Temperature is always displayed. Press and release the mode button on the meter until the legend on the far right side of the LCD reads Dissolved Oxygen in mg/l with 0 C. If the instrument is reading Dissolved Oxygen the large numbers on the display will be followed by mg/l. It is important to remember that the dissolved oxygen probe is stirring dependent. This is due to the consumption of oxygen at the sensor tip during measurement. When taking dissolved oxygen measurements the probe must be moved through the sample at a rate of one foot per second to provide adequate stirring. The meter thermistor and oxygen probe is lowered into the water to the appropriate depth as required by the project manager and as indicated on the sample log sheet. The oxygen probe must not be allowed to come in contact with the lake bottom. Lower the probe into the water just below the surface, let the probe aclimate according to manufacturer�s instructions, take a temperature and oxygen reading, and record it on the sample log sheet. Lower the probe to the required depth and repeat the above step. Turn meter off and place electrode into storage chamber. Note: If sampling sites are relatively close together, it is acceptable to leave the meter on until all measurements are recorded.
Draft May - 01 60

Title: Sands Pond QAPP Revision Number: 2
Date: 7/10/01 Page: 61 of 97
APPENDIX C UNIVERSITY OF RHODE ISLAND WATERSHED WATCH CHAIN OF CUSTODY FORM
ESS LABORATORY CHAIN OF CUSTODY FORM
Draft May - 01 61

Title: Sands Pond QAPP Revision Number: 2
Date: 7/10/01 Page: 62 of 97
Page left blank intentionally Insert URI Chain of Custody Form
Draft May - 01 62

Title: Sands Pond QAPP Revision Number: 2
Date: 7/10/01 Page: 63 of 97
page left blank intentionally Insert ESS laboratory chain of custody form
Draft May - 01 63

Title: Sands Pond QAPP Revision Number: 2
Date: 7/10/01 Page: 64 of 97
APPENDIX D LABORATORY STANDARD OPERATING PROCEDURES SOP �1 THROUGH SOP � 4 FIELD STANDARD OPERATING PROCEDURE SOP - 5
Draft May - 01 64

Title: Sands Pond QAPP Revision Number: 2
Date: 7/10/01 Page: 65 of 97
SOP -1
TOTAL PHOSPHORUS & TOTAL NITROGEN
I. References Alpkem Corporation. 1986. Operator's Manual and Methodologies for the RFA-300. PO Box 648, 9445 SW
Ridder Rd., Wilsonville, OR 97070. Ameel, JJ, RP Axler, and CJ Owen. 1993. Persulfate Digestion for Determination of Total Nitrogen and Total
Phosphorus in Low-Nutrient Waters. American Laboratory. American Public Health Association. Standard Methods for the Examination of Water and Wastewater. 1995
edition. Section 4500-Norg. D. Persulfate Method (with automated cadmium reduction) American Public Health Association. Standard Methods for the Examination of Water and Wastewater. 1995
edition. Section 4500-P F. Phosphorus - Automated Ascorbic Acid Reduction Method. Labtronics Inc. 1992. Labtronics DP-1000 Program. Labtronics Inc. 95 Crimea St, Guelph, Ontario NIH 2Y6,
Canada. Oviatt, CA and KM Hindle. 1994. Manual of Biological and Geochemical Techniques in Coastal Areas.
MERL Series, Report #1, Third Edition. Section 1.6, pp. 88-91, " Total Dissolved and Total Particulate Nitrogen and Phosphorus." The University of Rhode Island, Kingston, Rhode Island.
U S. Environmental Protection Agency. EPA Method 365 Series, EPA 600/4-79, rev. March 1983. Environmental Monitoring and Support Laboratory, Cincinnati, Ohio.
Valderrama, J.C. 1981. The simultaneous analysis of total nitrogen and total phosphorus in natural waters. Marine Chemistry 10:109-122.
II. Summary of Method: This procedure is a simultaneous digestion for total nitrogen and total phosphorus. All glassware must be thoroughly cleaned and pre-digested to avoid phosphorus contamination. Nutrient samples are collected in acid-washed brown glass bottles, stored on ice. After logging in at laboratory, 20 ml aliquots are pipetted into pre-treated glass vials. A suite of standards are similarly set up as are QC samples. A neutral potassium persulfate digesting reagent is added to samples, standards and blanks. Samples and standards are digested in a water bath - raised from room temperature to boiling, boiled for 15 minutes, and then allowed to cool to room temperature in the water bath. Vials are refrigerated until analysis. Analysis is performed using an Alpkem Model 300 Autoanalyzer. All equipment and supplies are listed at the end of this document. III. Procedure for Sample Preparation and Processing A. Before Sample Collection
1. Re-crystallize Potassium Persulfate. This procedure takes two days. It should be done at least a week before the potassium persulfate is to be used. This procedure was developed because of nitrogen contamination in commercially available low-N potassium persulfate.
•
1. Weigh out about 75 g potassium persulfate into 600 ml beaker.
Draft May - 01 65

2. Add about 500 ml Millipore water, magnetic stir bar, cover with Al Foil or cover glass.
Title: Sands Pond QAPP Revision Number: 2
Date: 7/10/01 Page: 66 of 97 3. Place beaker on magnetic stirrer. Heat, with stirring to dissolve crystals.
4. Put beaker in pan packed with ice, also cool squeeze bottle of MQ water. Put pan and squeeze bottle in refrigerator overnight.
5. Attach Buchner funnel to filter flask, attach to vacuum manifold. 6. Turn on vacuum suction. 7. Decant (pour) supernatant (liquid) from cold beaker through funnel, then pour and scrape crystals into
funnel. 8. Rinse beaker and crystals repeatedly with cold MQ water, continuing vacuuming. 9. Continue vacuuming until crystals are dry, occasionally scraping crystals away from side of funnel and
�fluffing� them up. 10. Remove from vacuum, scrape crystals into beaker. Store crystals in dessicator. 2. Prepare Glassware - this takes 3 days to complete. • (note: MQ refers to Millipore water, which is de-ionized water that has been further purified.) 1. Empty contents of vials, if they have been previously used. 2. Place vials and their tops in a bucket of (non-phosphate) soapy water. The labels of the samples are easier to remove after the vials have soaked. 3. Scrub out the vials using a brush and the soapy water. 4. Rinse the vials with tap water 3-5X. 5. Rinse the vials and caps with MQ water 3-5X. 6. Acid wash vials (not caps) by filling vials with 10% HCl. Let soak overnight. 7. Empty out acid from vials, rinse 3X with MQ water inside and out. 8. Fill vials with MQ water. Let soak overnight. 7. If the vials cannot be pre-digested that day fill them with MQ water cap and store, labeled "ready for pre-digestion." 8. If digesting reagent is available, add 5 ml to each vial, using the "old digesting reagent" re-pipette. (Directions for making the digesting reagent can be found below.) Cap the vials tightly. If the vials cannot be digested that day it is ok. Just remember to label them as to their contents. 9. Place capped vials in a rack and in a water bath. If needed add DI water to the water bath to approximately 1/3 of vial height. Put the cover on the water bath. It will not reach 100 deg C if the cover is off. Turn on water bath and bring to boiling. This takes 45-60 min. Boil for 15 minutes. Turn off the water bath. 10. Let the vials cool to room temperature in the water bath overnight. 11. Remove cooled vials and empty out digesting reagent. 12. Rinse 3-5X with MQ water. 13. Fill the vials completely with MQ water and cap them. The vials are stored filled with MQ until the day they are to be used. 14. On the day they are to be used, empty the MQ water from the vials. Rinse the vials 3X with MQ water. Shake out excess water. Stand the vials upright in their rack. Do not cap the vials.
Draft May - 01 66

15. Dry vials in 105 deg C oven (in room 018). This takes about 15-20 minutes. Put the caps face down on a paper towel stacking them like this //////. They do not need to be completely dry before they are used. Do not put the caps in the oven or they will melt.
Title: Sands Pond QAPP Revision Number: 2
Date: 7/10/01 Page: 67 of 97
3. Prepare Standards for Total and Dissolved Inorganic Phosphorus. This takes two days to complete. NOTE: All glassware should have been soapy water washed, Millipore water rinsed, 10% HCl soaked and then soaked in Millipore water overnight. Never use glassware that has just come from acid soaking. It must equilibrate in deionized water first. Use non-phosphate detergent. All phosphorus glassware should be dedicated to phosphorus analysis only and not used for any other analyses. 1. Dry KH2PO4 at 105 deg. C for 1 hour; store in dessicator. This is potassium dihydrogen phosphate, molecular weight KH2PO4 = 136.1. molecular weight P = 30.97. 2. Calibrate balance. Use a balance that weighs to at least 0.0001 g. Use the set of calibration weights (in
drawer under the balance) to check the calibration of the balance. Use forceps to lift calibration weights, not your fingers.
3. Make phosphorus stock solution. To calculate amount of KH2PO4 needed to make a 100 mg/l solution (=0.1g/l):
0.1 g X 136.1/30.97 = 0.4394 g KH2PO4) per liter For this stock solution, weigh out 0.4394 g, dilute to 1000 ml with MQ water. •
•
•
0.2127 g to 500 ml 0.1099 g to 250 ml
After making to volume, preserve with 2 ml chloroform per liter. This solution is stable for at least 6 months, stored in a refrigerator. This solution is 100 mg P04-P per liter, or 100 ug P04-P per ml, or 100 ppm.
4. Make intermediate stock solution. Dilute 100 ml of 100 ppm stock solution to 1000 ml, or 25 ml to 250 ml. This solution is 10 ppm (or ug/ml or mg/l) or 10,000 ppb P.
5. Calibrate pipette. Use Eppendorf micropipettes, room temperature deionized water and the Mettler balance to calibrate pipettes. The nominal volume on the pipettes is not always accurate. Calibrate by dispensing a chosen volume of room temperature water into a tared beaker on the balance. 1.000 ml = 1.0000 gram. Adjust pipette as needed, recheck with each change in pipette delivery volume.
6. Fill selected volumetric flasks part way with MQ water. Use appropriate sized Eppendorf micropipette to add intermediate stock solution, according to chart below. Be aware of the volumetric flask size. Bring to volume with MQ water. Cover with parafilm, shake. Allow to sit at least 1/2 hour before using.
Draft May - 01 67

Title: Sands Pond QAPP Revision Number: 2
Date: 7/10/01 Page: 68 of 97
7. To make working standards for Phosphorus:
Use these Standardsf
or "clean" water
Use these standards
for ISDS
(sewage) samples
Final Concentration(ug/l, or ppb)
ul (ml) of 10
mg/l intermediate stock solution
to use
ul (ml) of 10 mg/l intermediate
stock solution to use
dilution factor
Using 200 ml volumetric
flasks
Using 250 ml volumetric flasks
X 5 ppb (ug/l) 100 ul 125 ul 2000 X 10 200 ul 250 ul 1000 X 15 300 ul 375 ul 666.6 X 20 400 ul 500 ul 500 X 25 500 ul 625 ul 400 X 50 1000, (1.0 ml) 1250, (1.25 ml) 200 X X 100 2000, (2.0) 2500, (2.5) 100 X X 200 4000, (4.0) 5000, (5.0) 50 X 400 8000, (8.0) 10,000, (10.0) 25 X 500 10000 ul,
(10.0 ml) 12,500 ul, (12.5 ml)
20
x 1000 20,000, (20.0) 25,000, (25.0) 10
Draft May - 01 68
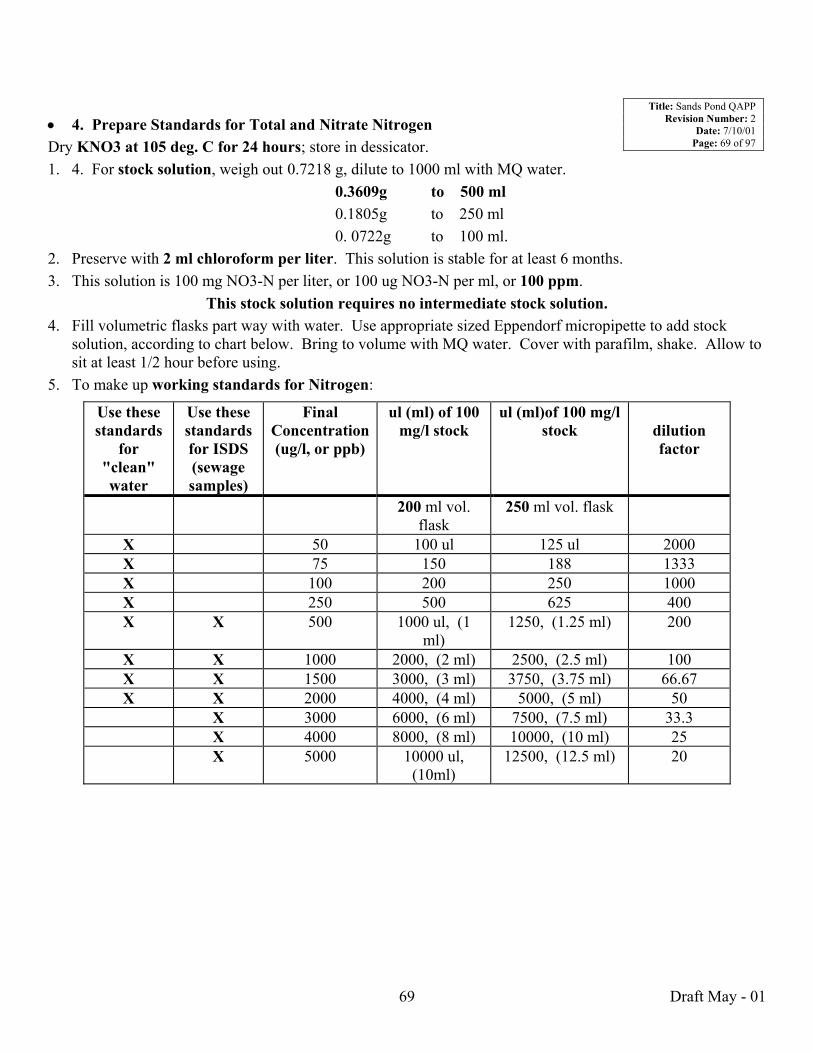
Title: Sands Pond QAPP Revision Number: 2
Date: 7/10/01 Page: 69 of 97
4. Prepare Standards for Total and Nitrate Nitrogen • Dry KNO3 at 105 deg. C for 24 hours; store in dessicator. 1. 4. For stock solution, weigh out 0.7218 g, dilute to 1000 ml with MQ water.
0.3609g to 500 ml 0.1805g to 250 ml 0. 0722g to 100 ml.
2. Preserve with 2 ml chloroform per liter. This solution is stable for at least 6 months. 3. This solution is 100 mg NO3-N per liter, or 100 ug NO3-N per ml, or 100 ppm.
This stock solution requires no intermediate stock solution. 4. Fill volumetric flasks part way with water. Use appropriate sized Eppendorf micropipette to add stock
solution, according to chart below. Bring to volume with MQ water. Cover with parafilm, shake. Allow to sit at least 1/2 hour before using.
5. To make up working standards for Nitrogen:
Use these standards
for "clean" water
Use these standards for ISDS (sewage samples)
Final Concentration (ug/l, or ppb)
ul (ml) of 100 mg/l stock
ul (ml)of 100 mg/l stock
dilution factor
200 ml vol. flask
250 ml vol. flask
X 50 100 ul 125 ul 2000 X 75 150 188 1333 X 100 200 250 1000 X 250 500 625 400 X X 500 1000 ul, (1
ml) 1250, (1.25 ml) 200
X X 1000 2000, (2 ml) 2500, (2.5 ml) 100 X X 1500 3000, (3 ml) 3750, (3.75 ml) 66.67 X X 2000 4000, (4 ml) 5000, (5 ml) 50 X 3000 6000, (6 ml) 7500, (7.5 ml) 33.3 X 4000 8000, (8 ml) 10000, (10 ml) 25 X 5000 10000 ul,
(10ml) 12500, (12.5 ml) 20
Draft May - 01 69

Title: Sands Pond QAPP Revision Number: 2
Date: 7/10/01 Page: 70 of 97
B. Day of sample collection Information about Sample Replicates, Standards, and Blanks
• •
•
•
•
Generally we prepare one replicate for every 5-10 samples. QC samples are from two sources, purchased QC standards and QC samples remaining from EPA blind water pollution QC testing. All of these QC samples are stored in the refrigerator near the TP/TN standards, some have been diluted. We typically run 1-2 of each QC sample, at each dilution, with each digestion batch. Standards: We typically run two sets of standards with each digestion batch if there are >50 samples. The standards used are indicated in the charts (above). Lab Blanks: Set up at least 2 vials of MQ water per digestion batch.
1. Prepare liquid digesting reagent The liquid digesting reagent should be made fresh for the day of use.
Use re-crystallized potassium persulfate (see end of document)
Digesting Reagent for Total Phosphorus and Total Nitrogen to make 1 liter 500 ml 250 ml 200 ml
1. Potassium Persulfate, recrystallized (see instructions at end)
50 g 25 g 12.50 g 10 g
2. Boric Acid 30 g 15 g 7.50 g 5 g 3. 1N NaOH solution 350 ml 175 ml 87.50 ml 70 ml Dilute reagents with MQ H2O to
900 ml
450 ml
200 ml
150 ml Fills ~ # vials 350 175 80 70 Use a beaker with a magnetic stir bar that has been specifically reserved for TP digestions. Weigh the dry reagents into the beaker. Add the sodium hydroxide solution. Using MQ water, dilute to the appropriate volume according to the chart above. Cover beaker with aluminum foil. Place beaker onto a heating magnetic stirrer. Stir with low heat until all crystals are dissolved. This takes 5-10 minutes. When crystals are dissolved, pour solution into appropriate sized volumetric flask specifically reserved for �TP only�. Let digesting reagent cool. Make to volume with MQ water. Transfer to an amber Repipet, labeled "new digesting reagent." Label with current date. 2.5 ml of digesting reagent are used for each 20 ml �clean water� sample. 5.0 ml of digesting reagent are used for each diluted ISDS sample. Any leftover reagent can poured into the "old TP digest" Repipet and used for �pre-digesting� vials.
Draft May - 01 70

Title: Sands Pond QAPP Revision Number: 2
Date: 7/10/01 Page: 71 of 97
• 2. Prepare the Clean Vials 1. Use vials that have been cleaned and pre-digested as described in previous section. These vials should have
been filled with MQ water and capped. 2. Pour out MQ water and rinse with 3 aliquots MQ. Shake out as much excess water as possible. 3. Stand vials upright in rack. 4. Put rack in 105 deg. C. drying oven until vials are dried (about 15-20 minutes.) Do not put caps in the oven.
Stack them face down /////// on a clean paper towel. • 3. Fill the Vials 1. Prepare labels for samples and standards. 2. Remove samples and standards from refrigerator, bring to room temperature. 3. Just prior to sampling. shake the samples/standards well. 4. Use a 20 ml glass pipette to transfer 20 ml "clean" water into a labeled vial. "Clean water" refers to samples
from non septic system source (lakes, ponds, rivers, etc.) 5. For ISDS/sewage samples: Pipette 1.0 ml sample and 19.0 ml MQ water into vial. 6. Replicate each 5 to 10 samples. 7. Rinse pipette well (with MQ water) between samples. 8. Fill all vials. 9. At this point samples in vials can be capped and stored in refrigerator until you are ready to add digesting
reagent.. 4. Add Digesting Reagent •
•
•
10. Pump Repipet containing digesting reagent several times to make sure that there are no air bubbles in the delivery tube.
11. Check calibration to make sure that repipet is dispensing desired volume by dispensing "one shot" into a tared beaker on a balance: 2.5 ml =2.5 grams.
12. Dispense 2.5 ml of digesting reagent into each vial for lake, river, pond water. 13. Dispense 5.0 ml of digesting reagent into each vial for ISDS/sewage samples. 14. Cap each vial tightly and shake vigorously. Place in rack.
5. Digest Samples and Standards 15. Put rack of vials into room temperature water bath. Add DI water to water bath to level of liquid in vials. 16. Put lid on water bath and turn it on. It will take 45 � 60 minutes to reach boiling temperature. 17. Boil gently for 15 minutes. Turn off water bath. Cool to room temperature (overnight) in water bath.
Keep cover on water bath. 6. After digestion
18. The next day, remove racks of vials from water bath. Store racks in refrigerator until day of analysis. TN should be analyzed <= 1 week, TP <= 1 month.
Draft May - 01 71

Title: Sands Pond QAPP Revision Number: 2
Date: 7/10/01 Page: 72 of 97
IV. Analytical Procedure Background: URI watershed Watch uses an Alpkem Model 300 automated spectrometer (known as an autoanalyzer) with a 880 nm filter for phosphorus and an 540 nm filter for nitrogen. Detailed instructions will not be repeated here, and can be found in the various manuals that came with the autoanalyzer. The autoanalyzer was purchased in 1988 (cost approximately $40,000). NO ONE IS ALLOWED TO USE THE AUTOANALYZER WITHOUT PERMISSION OF LINDA GREEN. A. Summary of Analytical Procedure: 1. All digested samples, standards, blanks are allowed to warm to room temperature. This takes place while
the autoanalyzer is being set up. 2. For total phosphorus we use Standard Methods #4500-P F, Automated Ascorbic Acid Reduction
Method. We follow the detailed instructions from Alpkem for reagent preparation. Since the digesting reagent is neutral we do not need to neutralize the digested samples.
3. For total nitrogen we use Standard Methods #4500- Norg D, automated cadmium reduction, as modified above.
4. Summary of Autoanalyzer Operation: A calibrated volume of sample is introduced into the RFA system by the sampler. The sample is delivered to the analytical cartridge by a peristaltic pump that compresses the pump tubing. It is then combined with reagents and air bubbles in a continuously moving stream. As the sample moves through the cartridge it passes through mixing coils, a heating bath, as specified by test conditions. A color is produced by the specific analyte in the sample. The intensity of the color is determined by the amount of analyte present. This colored stream then flows to the photometer where the color intensity is measured and converted to an electronic signal. A recorder displays these signals on calibrated chart paper. (from RFA Operator's Manual, Alpkem Corp.) The electronic signal is also sent to a computer where the Labtronics DP-1000 program processes the signal to create a standard curve and numerical results for the standards and samples. (Labtronics Operators Manual, Labtronics Inc.)
5. Each autoanalyzer tray has ninety places. A set of standards is run at the beginning and at the end of each run. Approximately 4 blanks are analyzed each run and also 1-2 sets of QC standards. This leaves about 50 spots for actual water samples. We replicate every 5-10 water samples in a run.
6. The autoanalyzer can be set for replicate sampling of each sample cup in the tray. We typically run duplicate or triplicate analyses of each sample cup.
7. There are two outputs from the autoanalyzer. The first is a chart paper recording. Analytes are recorded as peaks. This chart paper record provides a tangible hard copy record of each run. It is used to verify the baseline at beginning and end, baseline drift, the shape of the peaks, the separation of the peaks, the height of the peaks, and whether there are any offscale samples that need to be diluted and re-run. If the computer does not function, peak heights can be manually measured and sample concentrations determined using a regression equation of the standards.
8. The autoanalyzer is also connected to an IBM PC computer. We use Labtronics Corporation's program to analyze the data. This program was developed specifically for this autoanalyzer. It performs a linear regression on the standards and determines sample concentrations. A graph of concentration vs peak height of standards is displayed and can be manipulated to remove obvious outliers. The standard curve is rejected if r2 is less than 0.95. Quite often the regression is 0.9999.
9. After the computer results are printed, they are carefully compared to the recorder printout. This is a critically important comparison because the computer prints out only a number and the recorder shows peak
Draft May - 01 72

Title: Sands Pond QAPP Revision Number: 2
Date: 7/10/01 Page: 73 of 97
shape. The samples with poor peak shape can be re-analyzed. If all the samples are of low concentration, they can be re-analyzed with less concentrated standards.
10. QC results are compared to previous results as well as "true values". If the results of the run meet original EPA requirements for "acceptable" the results of the run are also deemed acceptable.
11. After the printout has been approved, the data is entered into appropriate Excel spreadsheet files, where it is subsequently re-checked for data entry errors.
B. Range, Precision, Accuracy, Blanks, Percent Recovery Phosphorus Limit of detection: 2 ug/l phosphorus Limit of quantitation: 4 ug/l phosphorus Upper Limit: 1 mg/l without sample dilution Precision: 15% coefficient of variation Accuracy: +/- 10% of EPA WP sample true values Average blank: 0-2 ug/l phosphorus Nitrogen Limit of Detection: 20 ug/l nitrogen Limit of Quantitation: 25 ug/l nitrogen Upper Limit: 5 mg/l without sample dilution Precision: 15% coefficient of variation Accuracy: +/- 10% of EPA EP sample true values Average Blank: 0-5 ug/l nitrogen
Draft May - 01 73
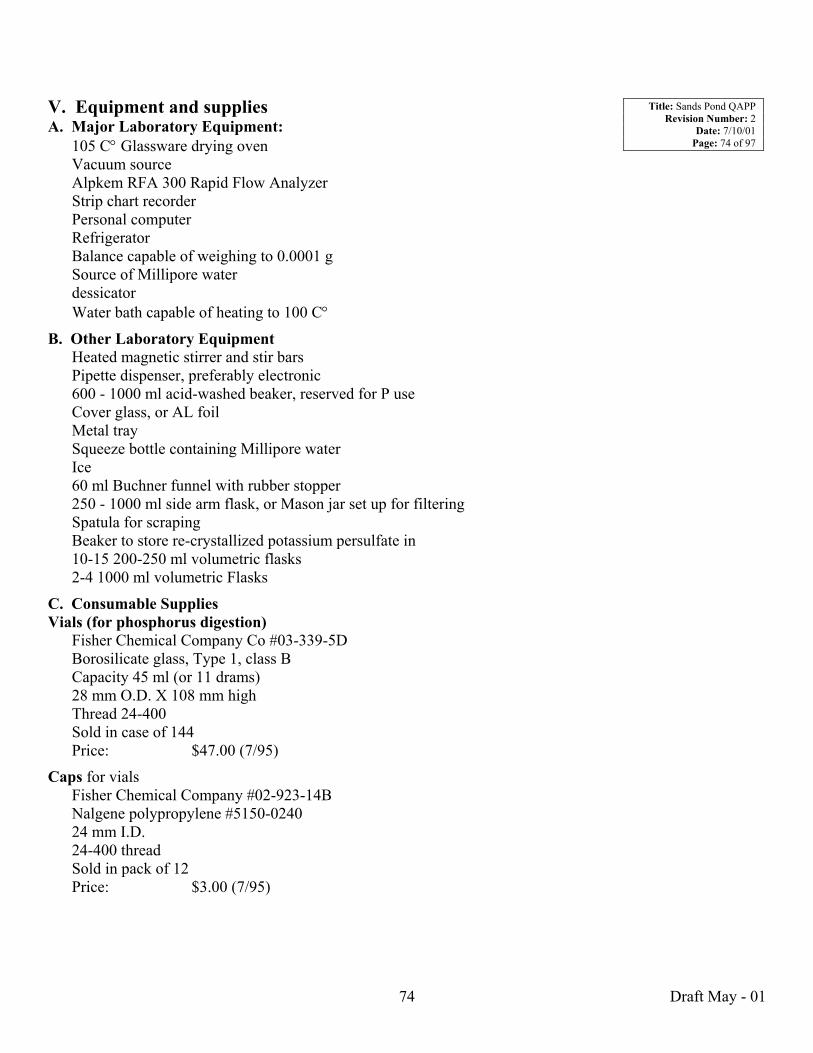
V. Equipment and supplies Title: Sands Pond QAPP Revision Number: 2
Date: 7/10/01 Page: 74 of 97
A. Major Laboratory Equipment: 105 C° Glassware drying oven Vacuum source Alpkem RFA 300 Rapid Flow Analyzer Strip chart recorder Personal computer Refrigerator Balance capable of weighing to 0.0001 g Source of Millipore water dessicator Water bath capable of heating to 100 C°
B. Other Laboratory Equipment Heated magnetic stirrer and stir bars Pipette dispenser, preferably electronic 600 - 1000 ml acid-washed beaker, reserved for P use Cover glass, or AL foil Metal tray Squeeze bottle containing Millipore water Ice 60 ml Buchner funnel with rubber stopper 250 - 1000 ml side arm flask, or Mason jar set up for filtering Spatula for scraping Beaker to store re-crystallized potassium persulfate in 10-15 200-250 ml volumetric flasks 2-4 1000 ml volumetric Flasks
C. Consumable Supplies Vials (for phosphorus digestion)
Fisher Chemical Company Co #03-339-5D Borosilicate glass, Type 1, class B Capacity 45 ml (or 11 drams) 28 mm O.D. X 108 mm high Thread 24-400 Sold in case of 144 Price: $47.00 (7/95)
Caps for vials Fisher Chemical Company #02-923-14B Nalgene polypropylene #5150-0240 24 mm I.D. 24-400 thread Sold in pack of 12 Price: $3.00 (7/95)
Draft May - 01 74

Title: Sands Pond QAPP Revision Number: 2
Date: 7/10/01 Page: 75 of 97
20 ml Volumetric pipettes, class B accuracy +/- 0.06 ml Fisher Chemical Company #13-650N Calibrated �to deliver� Sold singly price: $6.00 (7/95)
Blue coated-wire Rack (capacity 72 TP vials)
This rack is cataloged as a �Whirl-pak Bag Rack�. It is found in the �bag� section of the catalog, not in the rack section. Fisher Chemical Company #01-812-5G It is NASCO # B1048, with a capacity of 12, 710 ml samples (NASCO #B1020) Sold singly Price: $29.00 (list 7/95)
White Plastic racks (capacity 24 TP vials) For tubes 30 mm There are a variety of racks, be sure they can go in oven (to dry vials) and will not float in water bath. Fisher Chemical Company: 14-809D, list $20 singly, or $74 for case of 4 (7/95) or # 14-810-12D List $22.50
Repipet low profile dispenser (for dispensing digesting reagent) There are a variety, make sure the one you order can withstand most reagents, has two openings and has a capacity for dispensing up to 10 ml. Fisher Chemical Company # 13-687-35 Price: $225.00 (list, 7/95)
Brown Glass Bottles, Qorpak, with TFE-lined closures Fisher Chemical Company: #03-320-8D, 240 ml, case of 24 $ 54.00 (7/95) #03-320-8C, 120 ml, case of 24 $64 (list 7/95)
D. Chemical Reagents for Processing Samples Potassium Persulfate, 500 g, certified, ACS, low nitrogen (<0.001%)
for digesting reagent (K2S2O8) Fisher Chemical Company #P282-500, low nitrogen, this still needs to be re-crystallized before use Price: $90.00 (list 7/95)
Boric Acid powder, certified ACS, 500 g for digesting reagent (H3BO3) Phosphate <= 0.001% Fisher Chemical Company #A74-500 Price: $37 (list 7/95)
Draft May - 01 75

Sodium Hydroxide pellets, certified ACS, 500 g Title: Sands Pond QAPP Revision Number: 2
Date: 7/10/01 Page: 76 of 97
for digesting reagent (NaOH) Nitrogen compounds <= 0.001% Phosphate compounds <= 0.001% Fisher Chemical Company #S318-500 Price: $26.00 (list 7/95)
Potassium Dihydrogen Phosphate, also known as potassium phosphate monobasic (KH2PO4), primary standard, crystalline, 500 g
Fisher Chemical Company #P382-500 Price: $38.00 (list 7/95)
Potassium Nitrate KNO3, primary standard Fisher Chemical Company #P383-100
E. Reagents for Rapid Flow Analyzer Phosphorus •
•
Antimony Potassium Tartarate Fisher #A 867-500
Ammonium Molybdate Fisher #A674-500
Ascorbic Acid, Fisher #A61-100
DowFax Surfactant for P analysis Available from Alpkem
Sulfuric Acid, concentrated Fisher #A300-212
Nitrogen Reagents
Imidizole Fisher#03196-500
Cupric Sulfate Sigma#c7631
Sulfanilimide Fisher#04525-100
N-1-Napthylethylenediamine (NED) Sigma #N-9125
Brij-35% solution surfactant Available from Alpkem
Draft May - 01 76

Title: Sands Pond QAPP Revision Number: 2
Date: 7/10/01 Page: 77 of 97
SOP - 2 Ortho-phosphate phosphorus
I. References Alpkem Corporation. 1986. Operator's Manual and Methodologies for the RFA-300. PO Box 648, 9445 SW
Ridder Rd., Wilsonville, OR 97070. American Public Health Association. Standard Methods for the Examination of Water and Wastewater. 1995
edition. Section 4500-P F. Phosphorus - Automated Ascorbic Acid Reduction Method. Labtronics Inc. 1992. Labtronics DP-1000 Program. Labtronics Inc. 95 Crimea St, Guelph, Ontario NIH 2Y6,
Canada. U S. Environmental Protection Agency. EPA Method 365 Series, EPA 600/4-79, rev. March 1983. Environmental Monitoring and Support Laboratory, Cincinnati, Ohio.
I. Summary of Method: This method is for the simultaneaous analysis of ortho-phosphate phosphorus and nitrate-nitrogen. All glassware must be thoroughly cleaned and pre-digested to avoid phosphorus contamination. Nutrient samples are collected in acid-washed brown glass bottles, and stored on ice. Water samples are filtered through 0.45 um glass fiber filters (Gelman Type A/E) either in the field (if filtering samples for subsequent chlorophyll analyses) or in the laboratory. Filtered samples are logged in at the laboratory, and refrigerated until analysis. Analysis is performed using an Alpkem Model 300 Autoanalyzer. All equipment and supplies are listed at the end of this document. II. Procedure for Sample Preparation and Processing
A. Before Sample Collection Prepare Standards for Total and Dissolved Inorganic Phosphorus: this takes two days to complete. NOTE: MQ refers to Millipore water, which is de-ionized water that has been further purified. All glassware should have been soapy water washed, Millipore water rinsed, 10% HCl soaked and then soaked in Millipore water overnight. Never use glassware that has just come from acid soaking. It must equilibrate in deionized water first. Use non-phosphate detergent. All phosphorus glassware should be dedicated to phosphorus analysis only and not used for any other analyses. 1. Dry KH2PO4 at 105 deg. C for 1 hour; store in dessicator. This is potassium dihydrogen phosphate, molecular weight KH2PO4 = 136.1. molecular weight P = 30.97. 4. Calibrate balance. Use a balance that weighs to at least 0.0001 g. Use the set of calibration weights (in
drawer under the balance) to check the calibration of the balance. Use forceps to lift calibration weights, not your fingers.
5. Make phosphorus stock solution. To calculate amount of KH2PO4 needed to make a 100 mg/l solution (=0.1g/l):
0.1 g X 136.1/30.97 = 0.4394 g KH2PO4) per liter
Draft May - 01 77

Title: Sands Pond QAPP Revision Number: 2
Date: 7/10/01 Page: 78 of 97
For this stock solution, weigh out 0.4394 g, dilute to 1000 ml with MQ water. •
•
•
0.2127 g to 500 ml 0.1099 g to 250 ml
After making to volume, preserve with 2 ml chloroform per liter. This solution is stable for at least 6 months. This solution is 100 mg P04-P per liter, or 100 ug P04-P per ml, or 100 ppm.
8. Make intermediate stock solution. Dilute 100 ml of 100 ppm stock solution to 1000 ml, or 25 ml to 250 ml. This solution is 10 ppm (or ug/ml or mg/l) or 10,000 ppb P.
9. Calibrate pipette. Use Eppendorf micropipettes, room temperature deionized water and the Mettler balance to calibrate pipettes. The nominal volume on the pipettes is not always accurate. Calibrate by dispensing a chosen volume of room temperature water into a tared beaker on the balance. 1.000 ml = 1.0000 gram. Adjust pipette as needed, recheck with each change in pipette delivery volume.
10. 7. Fill selected volumetric flasks part way with MQ water. Use appropriate sized Eppendorf micropipette to add intermediate stock solution, according to chart below. Be aware of the volumetric flask size. Bring to volume with MQ water. Cover with parafilm, shake. Allow to sit at least 1/2 hour before using.
11. To make working standards: Standardsfor
"clean" water
Standardsfor
ISDS (sewage) samples
Final Concentration (ug/l, or ppb)
ul (ml) of 10 mg/l
intermediate stock solution
to use
ul (ml) of 10 mg/l intermediate
stock solution to use
dilution factor
Using 200 ml volumetric
flasks
Using 250 ml volumetric flasks
X 5 ppb (ug/l) 100 ul 125 ul 2000 X 10 200 ul 250 ul 1000 X 15 300 ul 375 ul 666.6 X 20 400 ul 500 ul 500 X 25 500 ul 625 ul 400 X 50 1000, (1.0 ml) 1250, (1.25 ml) 200 X X 100 2000, (2.0) 2500, (2.5) 100 X X 200 4000, (4.0) 5000, (5.0) 50 X 400 8000, (8.0) 10,000, (10.0) 25 X 500 10000 ul, (10.0
ml) 12,500 ul, (12.5
ml) 20
x 1000 20,000, (20.0) 25,000, (25.0) 10
Draft May - 01 78
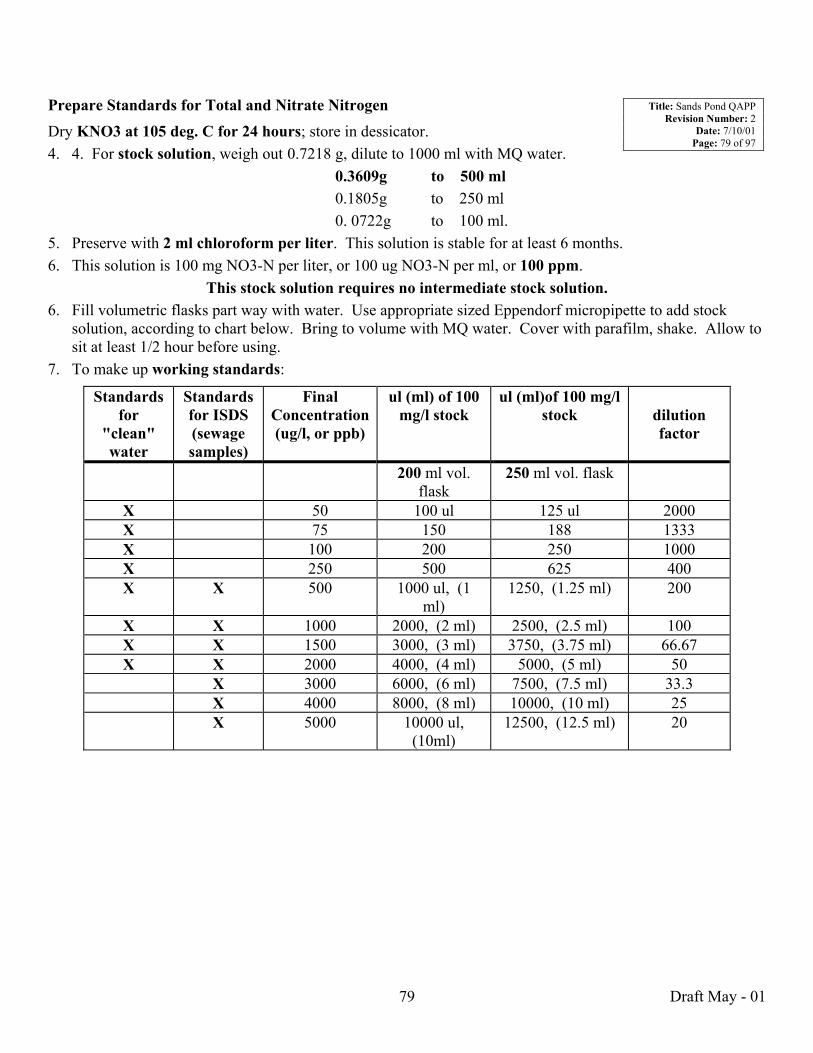
Prepare Standards for Total and Nitrate Nitrogen Title: Sands Pond QAPP Revision Number: 2
Date: 7/10/01 Page: 79 of 97
Dry KNO3 at 105 deg. C for 24 hours; store in dessicator. 4. 4. For stock solution, weigh out 0.7218 g, dilute to 1000 ml with MQ water.
0.3609g to 500 ml 0.1805g to 250 ml 0. 0722g to 100 ml.
5. Preserve with 2 ml chloroform per liter. This solution is stable for at least 6 months. 6. This solution is 100 mg NO3-N per liter, or 100 ug NO3-N per ml, or 100 ppm.
This stock solution requires no intermediate stock solution. 6. Fill volumetric flasks part way with water. Use appropriate sized Eppendorf micropipette to add stock
solution, according to chart below. Bring to volume with MQ water. Cover with parafilm, shake. Allow to sit at least 1/2 hour before using.
7. To make up working standards:
Standards for
"clean" water
Standards for ISDS (sewage samples)
Final Concentration (ug/l, or ppb)
ul (ml) of 100 mg/l stock
ul (ml)of 100 mg/l stock
dilution factor
200 ml vol. flask
250 ml vol. flask
X 50 100 ul 125 ul 2000 X 75 150 188 1333 X 100 200 250 1000 X 250 500 625 400 X X 500 1000 ul, (1
ml) 1250, (1.25 ml) 200
X X 1000 2000, (2 ml) 2500, (2.5 ml) 100 X X 1500 3000, (3 ml) 3750, (3.75 ml) 66.67 X X 2000 4000, (4 ml) 5000, (5 ml) 50 X 3000 6000, (6 ml) 7500, (7.5 ml) 33.3 X 4000 8000, (8 ml) 10000, (10 ml) 25 X 5000 10000 ul,
(10ml) 12500, (12.5 ml) 20
Draft May - 01 79

Title: Sands Pond QAPP Revision Number: 2
Date: 7/10/01 Page: 80 of 97
III. Analytical Procedure Background: We use an Alpkem Model 300 automated spectrometer (known as an autoanalyzer) with a 880 nm filter for phosphorus and an 540 nm filter for nitrogen. Detailed instructions will not be repeated here, and can be found in the various manuals that came with the autoanalyzer. The autoanalyzer was purchased in 1988 (cost approximately $40,000). NO ONE IS ALLOWED TO USE THE AUTOANALYZER WITHOUT PERMISSION OF LINDA GREEN. A. Summary of Analytical Procedure: 12. All filtered samples, standards, and blanks are allowed to warm to room temperature. This takes place while
the autoanalyzer is being set up. 13. For ortho-phosphate phosphorus we use Standard Methods #4500-P F, Automated Ascorbic Acid Reduction
Method. We follow the detailed instructions from Alpkem for reagent preparation. Since the digesting reagent is neutral we do not need to neutralize the filtered samples.
14. For nitrate-nitrogen we use Standard Methods #4500-NO3- F, automated cadmium reduction, as modified
above. 15. Summary of Autoanalyzer Operation: A calibrated volume of sample is introduced into the RFA system by
the sampler. The sample is delivered to the analytical cartridge by a peristaltic pump. It is then combined with reagents and air bubbles in a continuously moving stream. As the sample moves through the cartridge it passes through mixing coils, a heating bath, as specified by test conditions. A color is produced by the specific analyte in the sample. The intensity of the color is determined by the amount of analyte present. This colored stream then flows to the photometer where the color intensity is measured and converted to an electronic signal. A recorder displays these signals on calibrated chart paper. (from RFA Operator's Manual, Alpkem Corp.) The electronic signal is also sent to a computer where the Labtronics DP-1000 program processes the signal to create a standard curve and numerical results for the standards and samples. (Labtronics Operators Manual, Labtronics Inc.)
16. Each autoanalyzer tray has ninety places. A set of standards is run at the beginning and at the end of each run. Approximately 4 blanks are analyzed each run and also one set of QC standards. This leaves about 50 spots for actual water samples. We replicate every 5-10 water samples in a run.
17. The autoanalyzer can be set for replicate sampling of each sample cup in the tray. We typically run duplicate or triplicate analyses of each sample cup.
18. There are two outputs from the autoanalyzer. The first is a chart paper recording. Analytes are recorded as peaks. This chart paper record provides a tangible record of each run. It is used to verify the baseline at beginning and end, baseline drift, the shape of the peaks, the separation of the peaks, the height of the peaks, and whether there are any offscale samples that need to be diluted and re-run. If the computer does not function, peak heights can be manually measured and sample concentrations determined using a regression equation of the standards.
19. The autoanalyzer is also connected to an IBM PC computer. We use Labtronics Corporation's program to analyze the data. This program was developed specifically for this autoanalyzer. It performs a linear regression on the standards and determines sample concentrations. A graph of concentration vs peak height of standards is displayed and can be manipulated to remove obvious outliers. The standard curve is rejected if r2 is less than 0.99. Quite often the regression is 0.9999.
20. After the computer results are printed, they are carefully compared to the recorder printout. This is a critically important comparison because the computer prints out only a number and the recorder shows peak
Draft May - 01 80

Title: Sands Pond QAPP Revision Number: 2
Date: 7/10/01 Page: 81 of 97
shape. The samples with poor peak shape can be re-analyzed. If all the samples are of low concentration, they can be re-analyzed with less concentrated standards.
21. QC results are compared to previous results as well as "true values". If the results of the run meet original EPA requirements for "acceptable" the results of the run are also deemed acceptable.
22. After the printout has been approved, the data is entered into appropriate Excel spreadsheet files, where it is subsequently re-checked for data entry errors.
Information about Sample Replicates, Standards, and Blanks • •
•
Generally we use one replicate for every 5-10 samples. QC samples are from two sources, purchased QC standards and QC samples remaining from EPA blind water pollution QC testing. All of these QC samples are stored in the refrigerator near the TP/TN standards, some have been diluted. We typically run 1-2 of each QC sample, at each dilution, with each digestion batch. Standards: We typically run two sets of standards with each digestion batch if there are >50 samples. The standards used are indicated in the chart (above).
Blanks: Set up at least 2 vials of MQ water per digestion batch. B. Range, Precision, Accuracy, Blanks, Percent Recovery Phosphorus Limit of detection: 2 ug/l phosphorus Limit of quantitation: 4 ug/l phosphorus Upper Limit: 1 mg/l without sample dilution Precision: 15% coefficient of variation Accuracy: +/- 10% of EPA WP sample true values Average blank: 0-2 ug/l phosphorus Nitrogen Limit of Detection: 20 ug/l nitrogen Limit of Quantitation: 25 ug/l nitrogen Upper Limit: 5 mg/l without sample dilution Precision: 15% coefficient of variation Accuracy: +/- 10% of EPA EP sample true values Average Blank: 0-5 ug/l nitrogen
Draft May - 01 81

IV. Equipment and supplies Title: Sands Pond QAPP Revision Number: 2
Date: 7/10/01 Page: 82 of 97
Major Laboratory Equipment: •
•
•
•
Alpkem RFA 300 Rapid Flow Analyzer Strip chart recorder Personal computer Refrigerator Balance capable of weighing to 0.0001 g Source of Millipore water Other Laboratory Equipment Heated magnetic stirrer and stir bars Pipette dispenser 600 - 1000 ml acid-washed beaker, reserved for P use Cover glass, or AL foil Metal tray Squeeze bottle containing Millipore water 10-15 200-250 ml volumetric flasks 2-4 1000 ml volumetric Flasks
Brown Glass Bottles, Qorpak, with TFE-lined closures Fisher Chemical Company: #03-320-8D, 240 ml, case of 24 $ 54.00 (7/95) #03-320-8C, 120 ml, case of 24 $64 (list 7/95)
Chemical Reagents Potassium Dihydrogen Phosphate, also known as potassium phosphate monobasic (KH2PO4), primary standard, crystalline, 500 g Fisher Chemical Company #P382-500 Price: $38.00 (list 7/95) Potassium Nitrate KNO3, primary standard Fisher Chemical Company #P383-100 Reagents for Rapid Flow Analyzer
Phosphorus Antimony Potassium Tartarate Fisher #A 867-500 Ammonium Molybdate Fisher #A674-500
Draft May - 01 82

Ascorbic Acid, Title: Sands Pond QAPP Revision Number: 2
Date: 7/10/01 Page: 83 of 97
Fisher #A61-100 DowFax Surfactant for P analysis Available from Alpkem Sulfuric Acid, concentrated
Nitrogen Reagents • Imidizole Fisher#03196-500 Cupric Sulfate Sigma#c7631 Sulfanilimide Fisher#04525-100 N-1-Napthylethylenediamine (NED) Sigma #N-9125 Brij-35% solution surfactant Available from Alpkem
Draft May - 01 83

Title: Sands Pond QAPP Revision Number: 2
Date: 7/10/01 Page: 84 of 97
SOP - 3 URI WATERSHED WATCH CHLOROPHYLL-A ANALYSIS PROCEDURE
Fluorometric Analysis of Extracted chlorophyll
Summary of Analytical Methodology References:
• •
•
•
Standard Methods for the Examination of Water and Wastewater, 1995 edition "Chlorophyll" #10200 H. Arar, AJ and GB Collins, 1997, "In Vitro Determination of Chlorophyll a and Phaeophytin a in Marine and Freshwater Algae by Fluorescence." EPA Method 445.0, National Exposure Research Laboratory, Office of Research and Development , US EPA, Cincinnati OH. Welschmeyer, NA, 1994. �Fluorometric Analysis of Chlorophyll a in the Presence of Chlorophyll b and Phaeophytins.� Limnology and Oceanography 39:1985-1992. Turner Designs webpage, www.turnerdesigns.com, address: 845 West Maude St. Sunnyvale, CA 94086. �Measuring Extracted Chlorophyll a Free from the Errors Associated with Chlorophyll b and Phaeopigments.�
Note: This procedure covers laboratory analysis of chlorophyll a in collected samples. It does not fully address sample collection and field processing procedures.
Summary of Field Sample Filtration: Generally two replicate samples are filtered from each water sample within two hours of sample colelciton. If filtration cannot take place immediately after sample collection, water samples must be refrigeratred. In subdued light water samples are filtered through 0.45 um glass fiber filters (Gelman Type A/E). Individual filters are folded in half, wrapped first in blotting filters (for example a piece of white paper towel or white coffee filter), and then in squares of aluminum foil. A (pre-printed) label is attached and the following information is recorded: location, date, amount of water filtered, sample depth, number of filters in the foil square. The filter packets are placed in a plastic ziplock bag containing desiccant chips and then frozen. The filters are kept frozen until just prior to extraction and analysis.
Summary of Extraction Procedure: A glass fiber filter, through which has been filtered a known aliquot of water, is placed in the bottom of a sample vial. 5 ml of 90% acetone is added to the vial. The vial is capped, shaken vigorously and allowed to steep 18 � 24 hours at 4 deg. C. Prior to analysis the rack of vials is brought to room temperature. The chlorophyll filter is removed from the vial just prior to analysis.
Summary of Analysis: A Turner Designs digital fluorometer (model TD-700) is used for this analysis, using the Welschmeyer non-acidification procedure. It is equipped with a blue mercury vapor lamp, a 436 nm excitation filter and a 680nm emission filter. The fluorometer is calibrated at the start of each season, typically in May, with two liquid chlorophyll a standards, with replicate daily confirmation of calibration made using a secondary standard. Blanks of 90% acetone, and an unused filter extracted with 90% acetone are set up with each rack of 38 samples. Samples are read twice on the fluorometer. The readout is in the direct concentration mode.
Draft May - 01 84

Title: Sands Pond QAPP Revision Number: 2
Date: 7/10/01 Page: 85 of 97
Summary of Calibration and Calculation: The fluorometer is calibrated at the beginning of each monitoring season with 2 liquid pure chlorophyll-a standards and reagent blanks. At the time of calibration a solid secondary standard is also analyzed and the formula for calculating chlorophyll-a in samples is determined. That solid standard is analyzed with each batch of samples. When sample concentration is calculated an allowance for instrument drift is made using the daily batch readings of the solid standard.
Limit of Detection and Limit of Quantitation.
Limit of Detection is 1 ug/l chl-a as read on the fluorometer, which is equivalent to 0.1 ug/l chl-a in a 50 ml aliquot of water.
Limit of Quanititation is 2 ug/l chl-a as read on the fluorometer, which is equivalent to 0.2 ug/l in a 50 ml aliquot of water.
Precision: 20% relative percent difference ((A-B/A)X100) <=20. typically each measurement is replicated twice, four aliquots of water are typically filtered, yielding 8 measurements for each water sample.
Standard Operating Procedure: Basic Instrument Operation Chlorophyll a procedures must be done in a darkened room. Keep overhead lights off, and shades drawn to limit the light entering the room. The fluorometer is kept on except if use is not planned for >1 month.
1. Fill a vial with the sample to be analyzed.
2. Wipe the outside dry with a Kimwipe.
3. Insert the sample into the sample holder and close the lid.
4. Immediately press <*>. This initiates the following sequence: a 7 second delay for signal stabilization(DLY on display), a 12 second averaging period (AVG on display), then a 5 second display of readout (END on display.
5. Record the reading on the data sheet.
Calibration Procedure The calibration procedure sets the instrument�s sample concentration range and sensitivity based on the chosen fluorescent standards. In addition, the direct calibration mode assigns a digital value to the known standard so that subsequent standards or samples can be referenced to the original standards. Two purchased (from Turner Designs) standards and a blank are used. Additionally, a secondary standard is read immediately after the calibration procedure. The secondary standard is read at the beginning and end of each rack of 40 samples, and compared to its original reading in the calculation of amount of chlorophyll a in the extracted samples to account for instrument drift.
Draft May - 01 85

Title: Sands Pond QAPP Revision Number: 2
Date: 7/10/01 Page: 86 of 97
Initial Standardization with liquid primary standards
Note: A sufficient quantity of pure chlorophyll-a in 90% acetone is received with each order to fill 2 vials, so that analysis of each (of two) standards can be done in duplicate.
1. Remove standards from refrigerator and bring to room temperature. Prepare a blank of 90% acetone.
2. Press <ENT> on Home screen, press <1> for set-up, press <1> for Mode. Toggle to choose Multi-optional Mode.
3. Press <ESC> to return to previous screen, press <2> to choose calibration procedure. Toggle to the �Direct Concentration� choice.
4. Press <ESC> to return to previous screen, press <3> to choose the units. Toggle to �ug/l�. Press <ESC> twice to return to set-up/Cal screen.
5. Press <2>. The Direct Concentration calibration sequence will appear.
6. When the fluorometer calls for the maximum range press <9> and then enter 250. This is the maximum linear range of the fluorometer.
7. Key in the number of standards, press <ENT>.
8. When the fluorometer asks for the �HiStd Conc�, press <9> then enter the concentration and press <ENT>.
9. Fill a vial with that standard, wipe it dry, insert into cuvette holder, and press<*>.
10. Repeat step 8&9 for the next standard, entering its concentration. Press <ENT> when finished.
11. Prepare a vial with the blank (90% acetone) insert it when prompted, and press <ENT>. When the blank has stabilized press <0>. The instrument will read the blank and then return to the Home screen.
Initial Standardization with the Solid Secondary Standard (after above calibration is completed)
1. Place the solid standard in the cuvette holder with �L� on your left side. Press <*> to read the value. Record this number as the low standard.
2. Remove the standard from the holder, rotate it 180 degrees and place in the holder again, so that �H� is on your left.
3. Press <*> to read the value. Record as the high concentration.
4. Remove the standard and replace cuvette holder.
5. Repeat these measurements at the beginning and end of each rack of 40 samples.
Draft May - 01 86

Title: Sands Pond QAPP Revision Number: 2
Date: 7/10/01 Page: 87 of 97
Sample Preparation (day before analysis)
Gather Supplies: in the fluorometer room (Coastal Institute in Kingston, room 019) except where noted.
• • • • • • •
white test tube racks 13x100 mm disposable glass vials (test tubes) vial caps Repipet containing a buffered 90% acetone solution, in fume hood in fluorometer room forceps Chlorophyll Analysis Data Sheets Frozen filters in freezer in room 002.
Organize Data Sheets: Blank data sheets are kept next to the fluorometer in the inner room of 19A Coastal Institute-Kingston (CIK), URI, referred to as "the fluorometer room." The data sheets are set up to correspond to the sample rack. A maximum of forty samples and blanks can be accommodated in each rack (and on each data sheet.) It is recommended that no more than 4 racks be analyzed in one sitting. Begin Sample Extraction Procedure (day before analysis): 1. Turn on fan for fume hood if it is not already on. 2. Gather supplies for preparation and analysis days. 3. Fill in top of data sheet. Sheets are numbered in consecutive order, 2000-1, 2000-2, etc.. 4. If needed, make up buffered 90% acetone solution, store in Repipet. (instructions at end of section.) 5. Check calibration of Repipet. Pump several times to remove air bubbles, then dispense into tared beaker on
balance. Check to see that weight is 5.0 g. If not, adjust dispensing volume and re-check. 6. Filters are stored in ziplock bags in the walk-in freezer in room 002. 7. Bring ziplock bag(s) to darkened fluorometer lab when ready to set up for extraction. 8. Remove foil filter packs from the ziplock bags and sort by date. Set foil packets in chronological order. 9. Enter information from sample label onto the chl-a analysis data sheets. Be sure to read and enter the
information carefully. While most foil packets will contain only one filter per packet, some may contain more, and should have been labeled as such. Location, date, volume filtered and sample depth must be entered for each filter. Rack ID number and setup date must be indicated on the data sheet.
10. Turn on fan for fume hood if it is not already on. 11. Gather supplies for preparation and analysis days. 12. Fill in top of data sheet. Sheets are numbered in consecutive order, 2000-1, 2000-2, etc.. 13. If needed, make up buffered 90% acetone solution, store in Repipet. (instructions at end of section.) 14. Check calibration of Repipet. Pump several times to remove air bubbles, then dispense into tared beaker on
balance. Check to see that weight is 5.0 g. If not, adjust dispensing volume and re-check. 15. Filters are stored in ziplock bags in the walk-in freezer in room 002. 16. Bring ziplock bag(s) to darkened fluorometer lab when ready to set up for extraction. 17. Remove foil filter packs from the ziplock bags and sort by date. Set foil packets in chronological order.
Draft May - 01 87

Title: Sands Pond QAPP Revision Number: 2
Date: 7/10/01 Page: 88 of 97
18. Enter information from sample label onto the chl-a analysis data sheets. Be sure to read and enter the
information carefully. While most foil packets will contain only one filter per packet, some may contain more, and should have been labeled as such. Location, date, volume filtered and sample depth must be entered for each filter. Rack ID number and setup date must be indicated on the data sheet.
19. Once the data sheet has been completed for a row of 10 samples, using the forceps, remove the filter(s) from the aluminum foil (remember to keep the room dark for this part) and place a filter in the bottom of glass vial. Do not touch the filter with your fingers! The vial containing the filter should then be placed in the test tube rack matching the position identified on the data sheet.
20. Dispense 5ml buffered 90% acetone into each vial using the Repipet, and snap fulcon cap onto top of vial. Vigorously shake each vial, making sure that the filter remains completely submerged in acetone at end of shaking.
21. Continue until the rack has been filled. The second to last spot should be contain an unused filter, for a filter blank, the last spot on the rack should be have a vial containing just 90% acetone (no filter).
22. Cover the rack completely with aluminum foil. Tape the data sheet to its corresponding rack. 23. Place the completed racks in labeled aluminum foil covered cardboard boxes. Tape lids shut. 24. Place the box in the 4 degree walk-in refrigerated room in the CIK. Allow 18-24 hours for complete
extraction of chlorophyll from the filter.
Draft May - 01 88

Title: Sands Pond QAPP Revision Number: 2
Date: 7/10/01 Page: 89 of 97
Analysis Day: Gather Supplies: (kept in fluorometer room, except where noted)
• • • • • • •
• • • • •
Turner Fluorometer, model TD-700. racks of chlorophyll samples (from walk-in cooler) Filter remover (6" piece aluminum wire, with bent tip) 90% acetone blank, in aluminum covered box in refrigerator in room 19A CIK. Turner Designs liquid chlorophyll standards, in refrigerator in room 19A CIK. Turner Designs solid secondary standard, in drawer under fluorometer. Repipet containing 90% acetone for dilution, in fume hood in fluorometer room.
Remember to keep the lights off during analysis.
Procedure: 1. The fluorometer should already be on. 2. Remove the chlorophyll racks from the walk-in cooler, keep them covered. Bring everything to fluorometer
room and allow the samples and any liquid standards to warm to room temperature. All samples/standards must be at room temperature before analysis.
3. (This step can be done while the samples are warming to room temp) Shake the first sample vigorously. Remove the cap, and using the filter remover, remove the filter.
4. Replace the cap, and wipe outside of tube with a Kimwipe (removes fingerprints/moisture which interfere with readings). Replace tube in the rack.
5. Repeat step 3 & 4 for the remaining samples on the rack. 6. By the time step 5 has been completed, the samples should be warmed up. 7. Load sample vial into fluorometer:
wipe off fingerprints, uncap fluorometer sample holder (the cap is on a chain so you can't lose it), hold sample vial by its cap and gently put it into the fluorometer sample holder, and recap sample holder.
7. Immediately press <*>. This initiates the following sequence: a 7 second delay for signal stabilization(DLY on display), a 12 second averaging period (AVG on display), then a 5 second display of readout (END on display.)
8. Record the reading on the data sheet.
9. Analyze all the samples & blanks on the rack and then repeat to obtain a second (replicate) value.
Draft May - 01 89
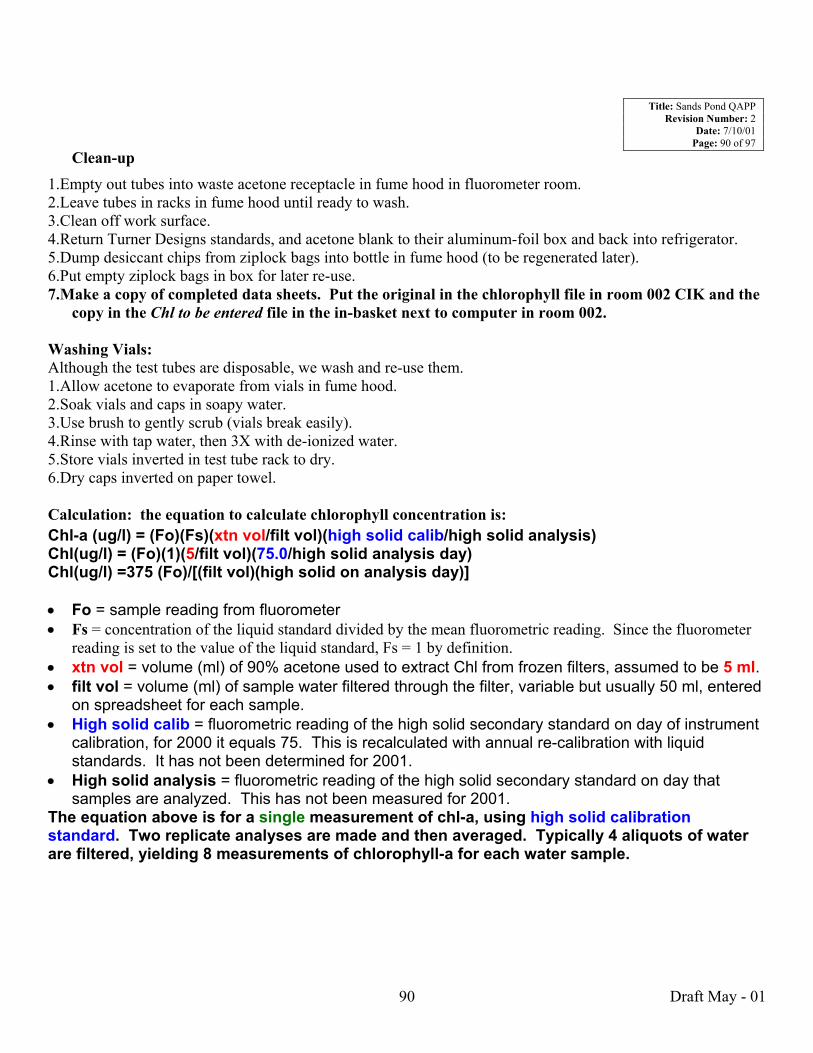
Title: Sands Pond QAPP Revision Number: 2
Date: 7/10/01 Page: 90 of 97
Clean-up 1.Empty out tubes into waste acetone receptacle in fume hood in fluorometer room. 2.Leave tubes in racks in fume hood until ready to wash. 3.Clean off work surface. 4.Return Turner Designs standards, and acetone blank to their aluminum-foil box and back into refrigerator. 5.Dump desiccant chips from ziplock bags into bottle in fume hood (to be regenerated later). 6.Put empty ziplock bags in box for later re-use. 7.Make a copy of completed data sheets. Put the original in the chlorophyll file in room 002 CIK and the
copy in the Chl to be entered file in the in-basket next to computer in room 002. Washing Vials: Although the test tubes are disposable, we wash and re-use them. 1.Allow acetone to evaporate from vials in fume hood. 2.Soak vials and caps in soapy water. 3.Use brush to gently scrub (vials break easily). 4.Rinse with tap water, then 3X with de-ionized water. 5.Store vials inverted in test tube rack to dry. 6.Dry caps inverted on paper towel. Calculation: the equation to calculate chlorophyll concentration is: Chl-a (ug/l) = (Fo)(Fs)(xtn vol/filt vol)(high solid calib/high solid analysis) Chl(ug/l) = (Fo)(1)(5/filt vol)(75.0/high solid analysis day) Chl(ug/l) =375 (Fo)/[(filt vol)(high solid on analysis day)] • •
• •
•
•
Fo = sample reading from fluorometer Fs = concentration of the liquid standard divided by the mean fluorometric reading. Since the fluorometer reading is set to the value of the liquid standard, Fs = 1 by definition. xtn vol = volume (ml) of 90% acetone used to extract Chl from frozen filters, assumed to be 5 ml. filt vol = volume (ml) of sample water filtered through the filter, variable but usually 50 ml, entered on spreadsheet for each sample. High solid calib = fluorometric reading of the high solid secondary standard on day of instrument calibration, for 2000 it equals 75. This is recalculated with annual re-calibration with liquid standards. It has not been determined for 2001. High solid analysis = fluorometric reading of the high solid secondary standard on day that samples are analyzed. This has not been measured for 2001.
The equation above is for a single measurement of chl-a, using high solid calibration standard. Two replicate analyses are made and then averaged. Typically 4 aliquots of water are filtered, yielding 8 measurements of chlorophyll-a for each water sample.
Draft May - 01 90

Title: Sands Pond QAPP Revision Number: 2
Date: 7/10/01 Page: 91 of 97
Equipment
•
• • • •
• • • • • • • •
• • •
• • • •
Fluorometer: Turner Designs model TD-700. Excitation filter 436nm, emission filter 680 nm, Property of URI Natural Resources Science Department. Turner Designs, 845 W Maude St, Sunnyvale, CA 94086, 408-749-0998. Freezer, -80 deg. C, property of URI Natural Resources Science Department Walk -in cool room or refrigerator, maintained at 4 deg. C Balance capable of weighing 0.1g Repipet, Barnstead/Thermolyne brand, volume range to 20 ml, set to dispense 5ml
Magnetic stirrer and stir bar Supplies:
13x100 mm disposable glass test tubes (Fisher # 14-958-10C, case of 1000) vial caps (Fisher �Tainer Tops�#02-706-28) 40 place test tube racks deionized water 10, 100 ml graduated cylinders dedicated 500 ml graduated cylinder 250 ml beaker forceps
Standards: ! Primary standards. Liquid chlorophyll-a standards (part # 10-850) are purchased annually from Turner
Designs. The two standards are approximately 155 ug/l (high standard) and 15.5 ug/l (low standard). Actual concentration is listed on the certificate of analysis shipped with each set of standards. They are stored in aluminum foil-covered chlorophyll vials in a 4 deg C refrigerator. They are used to calibrate the instrument and re-used to check the calibration.
! Secondary Standard. A solid secondary standard has been purchased from Turner Designs. This standard (which is a dark grey rod) has an indefinite shelf life.
Chemical Reagents
Acetone, Fisher Optima #A-929 sodium bicarbonate, certified ACS, Fisher #S-233 chlorophyll standards, liquid primary, #10-850 purchased from Turner Designs
Have on hand:
Chlorophyll data sheets, Filter remover wire (6" aluminum wire with bent tip) Kim-wipe tissues Aluminum foil
Draft May - 01 91
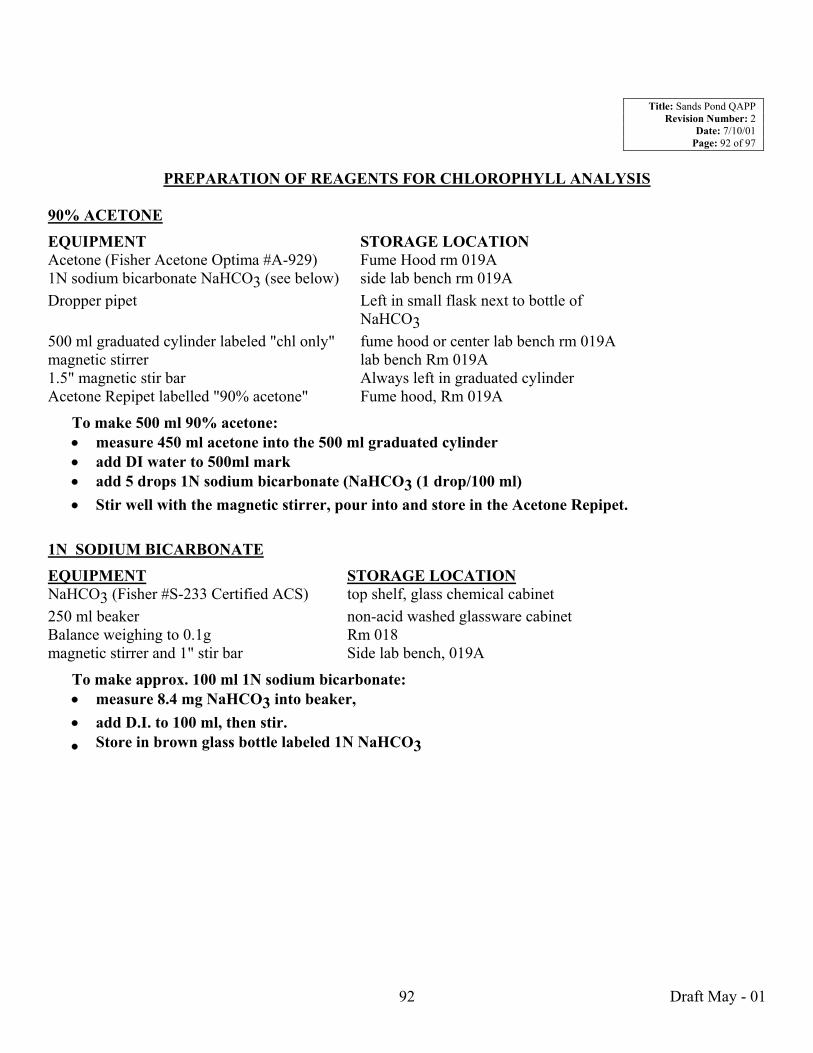
Title: Sands Pond QAPP Revision Number: 2
Date: 7/10/01 Page: 92 of 97
PREPARATION OF REAGENTS FOR CHLOROPHYLL ANALYSIS 90% ACETONE
EQUIPMENT STORAGE LOCATION Acetone (Fisher Acetone Optima #A-929) Fume Hood rm 019A 1N sodium bicarbonate NaHCO3 (see below) side lab bench rm 019A Dropper pipet Left in small flask next to bottle of
NaHCO3 500 ml graduated cylinder labeled "chl only" fume hood or center lab bench rm 019A magnetic stirrer lab bench Rm 019A 1.5" magnetic stir bar Always left in graduated cylinder Acetone Repipet labelled "90% acetone" Fume hood, Rm 019A
To make 500 ml 90% acetone: measure 450 ml acetone into the 500 ml graduated cylinder •
• • •
add DI water to 500ml mark add 5 drops 1N sodium bicarbonate (NaHCO3 (1 drop/100 ml) Stir well with the magnetic stirrer, pour into and store in the Acetone Repipet.
1N SODIUM BICARBONATE
EQUIPMENT STORAGE LOCATION NaHCO3 (Fisher #S-233 Certified ACS) top shelf, glass chemical cabinet 250 ml beaker non-acid washed glassware cabinet Balance weighing to 0.1g Rm 018 magnetic stirrer and 1" stir bar Side lab bench, 019A
To make approx. 100 ml 1N sodium bicarbonate: measure 8.4 mg NaHCO3 into beaker, •
• •
add D.I. to 100 ml, then stir. Store in brown glass bottle labeled 1N NaHCO3
Draft May - 01 92

Title: Sands Pond QAPP Revision Number: 2
Date: 7/10/01 Page: 93 of 97
SOP � 4
ESS Laboratory Standard Operating Procedure for Turbidity Analysis
Draft May - 01 93

Title: Sands Pond QAPP Revision Number: 2
Date: 7/10/01 Page: 94 of 97
SOP � 5 Field Sampling Standard Operating Procedure
Temperature, specific conductance, dissolved oxygen, salinity
Draft May - 01 94

Title: Sands Pond QAPP Revision Number: 2
Date: 7/10/01 Page: 95 of 97
Temperature, specific conductance, dissolved oxygen, salinity - SOP Equipment- YSI Model 85 Note: Field calibration is not necessary for the aforementioned parameters. However, from time to time it is wise to check the system calibration for conductivity. This should be accomplished in the laboratory by following the protocol provided in the YSI Model 85 manual. Field Operation 1. Turn the meter on- the instrument will activate all segments of the display for a few seconds, which will be followed by a self-test procedure that will last for several more seconds. During this power on self-test sequence, the instrument�s microprocessor is verifying that the instrument is working properly. 2. Select a measurement mode (dissolved oxygen %, dissolved oxygen mg/L, conductivity, specific conductance, or salinity). Temperature is always displayed. Selecting a measurement mode is accomplished by simply pressing and releasing the mode button. If the instrument is reading specific conductance (temperature compensated), the large numbers on the display will be followed by µS or mS. Additionally, the small portion of the display will show the oC flashing on and off. If the instrument is reading conductivity (NOT temperature compensated), the large numbers on the display will be followed by either a µS or an mS; however, the small portion of the display will show the oC NOT flashing. 3. Lower electrode to the desired depth (surface, middle, or bottom of the water column). When recording the bottom measurement, be sure to keep the electrode at least 0.5 ft above the bottom. Be sure not to disturb bottom substrates prior to or during measurement. 4. Record measurement 5. Cycle to the next measurement mode and record the next parameter. This step should be continued until measurements for all parameters are recorded. 6. Turn meter off and place electrode into storage chamber. Note: If sampling sites are relatively close together, it is acceptable to leave the meter on until all measurements are recorded.
Draft May - 01 95

Title: Sands Pond QAPP Revision Number: 2
Date: 7/10/01 Page: 96 of 97
APPENDIX E FIELD EQUIPMENT MANUFACTURER�S OPERATION MANUAL (EXCERPTS)
Draft May - 01 96

Title: Sands Pond QAPP Revision Number: 2
Date: 7/10/01 Page: 97 of 97
Page left blank intentionally insert operations manual
Draft May - 01 97