sandhill crane - u.s. fish and wildlife service
TRANSCRIPT

Status and Harvests of Sandhill CranesMid-continent, Rocky Mountain, Lower Colorado River Valley and Eastern Populations
U.S. Fish & Wildlife Service
Status and Harvests of Sandhill Cranes2008 Mid-continent, Rocky Mountain, and Lower Colorado River Valley Populations
U.S. Fish & Wildlife Service
2008
STATUS and HARVESTSof
SANDHILL CRANES
MID-CONTINENT, ROCKY MOUNTAIN, and LOWER COLORADO RIVER VALLEY POPULATIONS
Division of Migratory Bird ManagementU.S. Fish and Wildlife ServiceCentral Flyway Representative
P.O. Box 25486, DFCDenver, Colorado 80225
2012
Acknowledgments This report provides population status, recruitment indices, harvest trends, and other management information for the Mid-Continent (MCP), Rocky Mountain (RMP), Lower Colorado River Valley (LCRVP), and Eastern (EP) populations of sandhill cranes. Information was compiled with the assistance of a large number of biologists from across North America. We acknowledge the contributions of: D.S. Benning, J.L. Drahota, R.C. Drewien, P.P. Thorpe, T.S. Liddick and D.L. Fronczak for conducting annual aerial population surveys; R.C. Drewien for conducting RMP productivity surveys; K.D. Richkus, K.A. Wilkins and M.H. Gendron for conducting the U.S. and Canadian Federal harvest surveys for the MCP; J.R. Bohne for compiling harvest information collected on sandhill cranes in the Pacific Flyway; M.J. Rabe for compiling information for the LCRVP; S. Kelly and D.L. Fronczak for compiling population information for the EP; G.L. Krapu and D.A. Brandt for providing preliminary results from satellite-transmittered MCP cranes; and D.E. Sharp who was the mainstay behind this report until his retirement in 2011. We especially want to recognize the support of the state and provincial biologists in the Central and Pacific Flyways for the coordination of sandhill crane hunting programs and especially the distribution of crane hunting permits and assistance in conducting of annual cooperative surveys. Citation: Kruse, K.L., J.A. Dubovsky, and T.R. Cooper. 2012. Status and harvests of sandhill cranes: Mid-Continent, Rocky Mountain, Lower Colorado River Valley and Eastern Populations. Administrative Report, U.S. Fish and Wildlife Service, Denver, Colorado. 14pp.
All Division of Migratory Bird Management reports are available online at (http://www.fws.gov/migratorybirds/NewReportsPublications/PopulationStatus.html).

STATUS AND HARVESTS OF
SANDHILL CRANES
MID-CONTINENT, ROCKY MOUNTAIN, LOWER COLORADO RIVER VALLEY and EASTERN
POPULATIONS 2012
Kammie L. Kruse, Wildlife Biologist, Division of Migratory Bird Management, U.S. Fish
and Wildlife Service, Denver, Colorado James A. Dubovsky, Central Flyway Representative, Division of Migratory Bird
Management, U.S. Fish and Wildlife Service, Denver, Colorado Thomas R. Cooper, Migratory Shore and Upland Game Bird Biologist, Division of
Migratory Bird Management, U.S. Fish and Wildlife Service, Bloomington, Minnesota
Abstract: Compared to increases recorded in the 1970s, annual indices to abundance of the Mid-Continent Population (MCP) of sandhill cranes have been relatively stable since the early 1980s. The spring 2012 index for sandhill cranes in the Central Platte River Valley, Nebraska, uncorrected for visibility bias, was 259,576 birds, which was significantly lower than the previous 5 years likely due to later timing of the survey period and an early spring migration. The photo-corrected, 3-year average for 2009-11 was 579,863, which is above the established population-objective range of 349,000-472,000 cranes. All Central Flyway States, except Nebraska, allowed crane hunting in portions of their States during 2011-12. An estimated 7,836 hunters participated in these seasons, which was 11% lower than the number that participated in the previous season. Hunters harvested 14,442 MCP cranes in the U.S. portion of the Central Flyway during the 2011-12 seasons, which was 23% lower than the harvest for the previous year and 1% lower than the long-term average. The retrieved harvest of MCP cranes in hunt areas outside of the Central Flyway (Arizona, Pacific Flyway portion of New Mexico, Minnesota, Alaska, Canada, and Mexico combined) was 13,205 during 2011-12. The preliminary estimate for the North American MCP sport harvest, including crippling losses, was 31,354 birds, which was a 13% decrease from the previous year’s estimate. The long-term (1982-2008) trends for the MCP indicate that harvest has been increasing at a higher rate than population growth. The fall 2011 pre-migration survey for the Rocky Mountain Population (RMP) resulted in a count of 17,494 cranes. The 3-year average was 19,626 sandhill cranes, which is within the established population objective of 17,000-21,000 for the RMP. Hunting seasons during 2011-12 in portions of Arizona, Idaho, Montana, New Mexico, Utah, and Wyoming resulted in a harvest of 1,262 RMP cranes, a 6% decrease from the previous year’s harvest. The Lower Colorado River Valley Population (LCRVP) survey results indicate a slight increase from 2,415 birds in 2011 to 2,646 birds in 2012. The 3-

year average is 2,442 LCRVP cranes which is below the population objective of 2,500. The Eastern Population (EP) has rebounded from near extirpation in the late 1800s to over 30,000 cranes by 1996. As a result of this rebound and their range expansion, the Atlantic and Mississippi Flyway Councils developed a cooperative management plan for this population and criteria have been developed describing when hunting seasons can be opened. Kentucky held its first hunting season on this population in 2011-12 and harvested 50 cranes.

STATUS AND HARVESTS OF SANDHILL CRANES: MCP, RMP, LCRVP and EP 2012 • Kruse et al.
3
Introduction The MCP of sandhill cranes, numerically the most abundant of all North American crane populations, is comprised of lesser (Grus canadensis canadensis) and greater (G. c. tabida) subspecies of sandhill cranes. A third intermediate-sized subspecies, the Canadian sandhill crane (G. c. rowanii), was identified in the MCP (Walkinshaw 1965); however, recent genetic investigations question the differentiation of this third subspecies (Rhymer et al. 2001, Peterson et al. 2003, Jones et al. 2005). The MCP was believed to have >500,000 individuals in the spring during the 1990s (Tacha et al.1994). The breeding range extends from northwestern Minnesota and western Quebec, then northwest through Arctic Canada, Alaska, and into eastern Siberia. The MCP wintering range includes western Oklahoma, New Mexico, southeastern Arizona, Texas, and Mexico (Fig. 1). Extensive, spring aerial surveys on major concentration areas that are corrected for observer visibility bias provide annual indices of abundance used to measure population trends. These surveys are conducted in late March, at a time when birds that wintered in Mexico, Arizona, New Mexico, and Texas usually have migrated northward to spring staging areas, but before spring "break-up" conditions allow cranes to move into Canada (Benning and Johnson 1987). The MCP Cooperative Flyway Management Plan (Central, Mississippi and Pacific Flyway Councils 2006) established regulatory thresholds for changing harvest regulations that are based on an objective of maintaining sandhill crane abundances at 1982-2005 levels (i.e., spring index of 349,000–472,000 [ ̅ = 411,000 ± 15%]). Sandhill crane hunters are required to obtain either a Sandhill Crane hunting permit or register under the Harvest Information Program (HIP) to hunt MCP cranes in the U.S. portion of the Central Flyway and Minnesota in the Mississippi Flyway. The permits or HIP registration records provide the sampling frame to conduct annual harvest surveys. In Canada, the harvest survey is based on the sales of Federal Migratory Bird Hunting Permits, which are required for all crane hunters. The RMP is comprised exclusively of greater sandhill cranes that breed in isolated river valleys, marshes, and meadows of the U.S. portions of the Central and Pacific Flyways (Drewien and Bizeau 1974). The highest nesting concentrations are located in western Montana and Wyoming, eastern Idaho, northern Utah, and northwestern Colorado. The RMP migrates through the San Luis Valley (SLV) in Colorado and winters primarily in the Rio Grande Valley, New Mexico, with smaller numbers wintering in the southwestern part of New Mexico, in southeastern Arizona, and at several locations (~14) in the Northern Highlands of Mexico (Fig. 2). During 1984-96, the RMP was monitored at spring stopover areas in the SLV. However, cranes from the MCP also began to use this area, which confounded estimates of RMP abundance. In 1995, a fall pre-migration (September) survey replaced the spring count as the primary tool for monitoring population change. The RMP Cooperative Flyway Management Plan established a population objective (17,000-21,000 birds), and identifies surveys used to monitor recruitment and harvest levels that are designed to maintain a stable abundance (Pacific and Central Flyway Councils 2007). The plan contains a formula for calculating allowable annual harvests consistent with the goal of staying within the range of the population objective. All sandhill crane hunters in the range of the RMP must obtain a state permit to hunt cranes, which provides the sampling frame for independent harvest estimates and allows for assignment of harvest quotas by state. In many areas, harvest estimates are supplemented by periodic mandatory check-station reporting. The LCRVP is numerically the least abundant of the six migratory populations of sandhill cranes recognized in the U.S. (Drewien et al. 1976, Drewien and Lewis 1987). The LCRVP is comprised exclusively of greater sandhill cranes that breed primarily in northeastern Nevada, with smaller numbers in adjacent parts of Idaho, Oregon, and Utah (Fig. 3), and winters in the

STATUS AND HARVESTS OF SANDHILL CRANES: MCP, RMP, LCRVP and EP 2012 • Kruse et al.
4
Colorado River Valley of Arizona and Imperial Valley of California. LCRVP cranes have the lowest reported recruitment rate (4.8%) of any sandhill crane population in North America (Drewien et al. 1995). In the fall, these cranes leave breeding areas during late September-early October and congregate at staging areas in eastern Nevada. Wintering areas historically extended south along the Colorado River to near its delta with the Gulf of California. However, the current wintering distribution is concentrated at Cibola National Wildlife Refuge and on adjacent areas belonging to the Colorado River Indian Tribes in southwestern Arizona, with a few birds at the Sonny Bono Salton Sea NWR in southern California and the Gila River in Arizona. Collectively, these areas are believed to winter in excess of 90% of the total cranes in the LCRVP. Spring migration is generally initiated as early as the first week of February. Since 1998, an aerial cruise survey has been conducted that covers the four main winter concentration areas. The Eastern Population (EP), which consists of greater sandhill cranes, has rebounded from near extirpation in the late 1800’s (Walkinshaw 1949, 1973; Leopold 1949). Management actions, such as regulating take and the protection and restoration of habitat, have allowed this population to increase to a level that exceeded 30,000 cranes by 1996 (Meine and Archibald 1996). The majority of EP cranes breed across the Great Lakes region (Wisconsin, Michigan, Ontario, and Minnesota); however, the range of this population is currently expanding in all directions (Fig. 4). By early fall, EP cranes leave their breeding grounds and congregate in large flocks on traditional staging areas throughout the breeding range. During migration, EP cranes use traditional stopover areas which include Jasper-Pulaski Fish and Wildlife Area in northwest Indiana and Hiawassee State Wildlife Refuge in southeast Tennessee. Historically, EP cranes primarily wintered in southern Georgia and throughout Florida (Walkinshaw 1973, Lewis 1977, Tacha et al. 1992, Meine and Archibald 1996). Recent annual Midwinter Survey data, conducted by state and federal agencies, show an abundance of cranes have wintered farther north into Kentucky and Tennessee (2003-2011 U.S. Fish and Wildlife Service Reports, unpublished data). Mid-Continent Population of Sandhill Cranes No sport hunting seasons for MCP cranes were allowed in the U.S. between 1918-60. In the Central Flyway, areas open to hunting were gradually expanded during 1961-74, but since that time have remained relatively stable. Operational hunting seasons are now held annually in portions of Colorado, Kansas, Montana, New Mexico, North Dakota, Oklahoma, South Dakota, Texas, and Wyoming. Nebraska is the only Central Flyway state that does not have a sandhill crane sport hunting season. Areas open to crane hunting in the Central Flyway during 2011-2012 are shown in Fig. 5. Beginning in 2010, Minnesota, a Mississippi Flyway state, opened a limited hunt in the northwest portion of the state. During 1961-74, hunters gradually improved their knowledge of sandhill cranes and improved their hunting success. During 1975-85, a tradition of sandhill crane hunting became established. Together with improvements in equipment (decoys, calls, clothing, blinds, etc.) and a shift from pass-shooting and hunting on roosts to decoy-hunting in fields, crane hunter success increased (Sharp and Vogel 1992). Dubovsky and Araya (2008) found that in the late 1990s and early 2000s hunters were more successful in harvesting 2 or 3 cranes per day than they were during the early 1980s. However, since the late 1990s, average seasonal bags have declined for the Flyway.

STATUS AND HARVESTS OF SANDHILL CRANES: MCP, RMP, LCRVP and EP 2012 • Kruse et al.
5
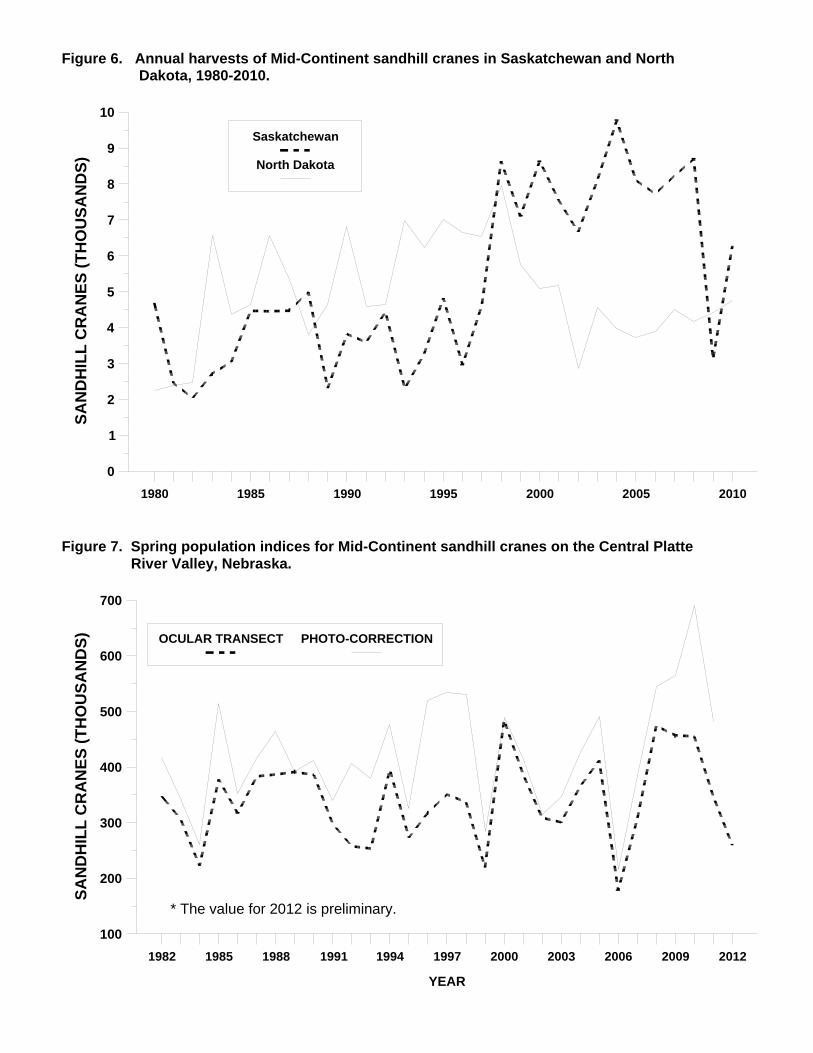
For most states, sandhill crane seasons began in relatively small areas, and expanded incrementally in subsequent years as experience with the seasons was gained. For example, sandhill crane seasons in North Dakota resumed in 1968 after being closed following the signing of the Migratory Bird Treaty Act in 1918. During 1968-79, the number of counties open for crane hunting increased from 2 to 8, and increased to 30 during 1980-92 and were grouped into two zones that were west of HW 281. Beginning in 1993, the zones were eliminated and Federal frameworks were fully utilized for the designated hunting area (Sharp and Cornely 1997). In 2001, North Dakota extended hunting to the entire state and created two zones with the area east of HW 281 open only for 37 days compared to 93 days for the western zone. Kansas was the most recent Central Flyway state to initiate a crane hunting season in 1993. Initially, crane hunting was open only in portions of 17 counties, but by 2003 the area was expanded to 62 counties, essentially the entire western portion of the state (Sharp et al. 2010). Also, during early years of these seasons, bag limits and shooting hours often were more restrictive than Federal frameworks allowed. MCP harvest areas have remained relatively consistent from year to year; however, the levels of harvest vary with respect to many factors including changes in hunting pressure, land use, and environmental factors. Most shifts in annual harvests occur locally, but large-scale changes in harvest distributions also have occurred. Since the late 1990s, harvests have increased in Saskatchewan, while harvests have declined in North Dakota (Fig. 6). Causal factors for these changes have not been determined, but are likely different because birds staging in Saskatchewan are largely from the West-central Canada-Alaska breeding affiliation whereas those in North Dakota are from the East-central Canada-Minnesota breeding affiliation (Krapu et al. 2011). Increased hunting pressure in Saskatchewan, mainly by non-resident U.S. hunters (Araya et al. 2010), has likely contributed to increases in harvests whereas declines in harvests in North Dakota appear to be more complex and involve several interrelated factors, likely including changes in hunting pressure, conversion of cropland to grass cover, and environmental conditions. The MCP included at least 510,000 sandhill cranes in March 1982, the last extensive survey involving high-altitude vertical photography of major spring migration staging concentrations. Beginning in 1982, an intensive photo-corrected ocular-transect survey of Nebraska's Central Platte River Valley (CPRV) and ocular assessments from other spring staging areas have been used to monitor the annual status and trends for this population (Table 1). Use of the CPRV count in the development of annual harvest recommendations relies on the premise that a high proportion (>90%) of the MCP are in the CPRV at the time of the annual survey. Recent research with radio-tracked birds suggests that the proportion of MCP cranes in the CPRV during the survey varies by year (G. Krapu, Northern Prairie Wildlife Research Center, personal communication). Annual variability in weather patterns can reduce the percentage below 90% in some years. However, conducting the survey a few days earlier or a few days later likely would not result in a 'better' count (i.e., a higher proportion of birds being in the CPRV), because birds migrate into and out of the area continuously (G. Krapu, Northern Prairie Wildlife Research Center, personal communication). The March 2012 index for the CPRV, which has not yet been corrected for visibility bias, was 259,576 (Table 1, Fig. 7). The number of MCP sandhill cranes observed in 2012 was significantly lower than counts from the previous 5 years. The survey is traditionally flown on the 4th Tuesday in March. Because 2012 was a leap year, the 4th Tuesday fell nearly a week later in the month. This, coupled with the very mild winter and early spring, resulted in many of the cranes migrating out of the CPRV prior to the start of the survey. The manager at the Rowe Sanctuary indicated that 20-30% of the cranes had departed the area at least a week prior to
STATUS AND HARVESTS OF SANDHILL CRANES: MCP, RMP, LCRVP and EP 2012 • Kruse et al.
6
the start of the survey. That observation is further supported by a record number of cranes being counted in South Dakota (>14,000) and North Dakota (1,100). Nebraska counted 12,800 cranes outside of the traditional survey area, a 31% decrease from 2011. Counts conducted in states south of Nebraska were very low when compared to past years and provide further evidence of an early move north. These combined factors highlight that the survey missed the peak of the cranes this year and is not likely due to a decreasing population of MCP cranes (T. Liddick, U.S. Fish and Wildlife Service, personal communication). The annual photo-corrected estimates and 95% confidence intervals for the CPRV portion of the survey indicate a relatively stable (P = 0.08) population trend for the MCP since 1982 (Fig. 8). The average index for photo-corrected counts during 2009-11 is 579,863 cranes, which is 3% lower than the previous 3-year average of 600,892 (Liddick 2011), but above the management objective level (349,000-472,000) for this population (Fig. 9). Since 1975, special Sandhill Crane Hunting Permits or more recently HIP certification have been required for crane hunters participating in seasons in the Central Flyway. Additionally, a limited MCP sandhill crane hunt was offered in Minnesota starting in 2010, for which a state-issued permit was required for hunters to participate. A sample of these permittees are mailed questionnaires soon after the completion of each hunting season. The resulting responses enable estimation of hunting activities and success (Martin 2007). Estimated numbers of hunters registering as sandhill crane hunters in Texas had been increasing since 1997 when crane hunting was included in the combination licenses issued by the state, with a record high of 122,533 permits issued in 2008. In 2009, Texas revised their licensing system and crane hunters now must go to selected locations to obtain their permit, which resulted in a 91% decrease in the number of hunters identified as crane hunters from 2008. Thus, the number of crane hunters in Texas likely did not decrease as suggested by the data; rather, the number of hunters classified as crane hunters by the Texas registration process declined. During the 2011-12 seasons in the Central Flyway, 25,945 hunters were either HIP-certified or obtained crane hunting permits, which were not limited in number (Table 2), with 7,836 of these individuals hunting at least one time (Table 3). The number of active hunters in the Central Flyway was 11% lower than the previous year (Fig. 10). In 2011, the number of hunters in Texas (35%) and North Dakota (48%) combined comprised 83% of all sandhill crane hunters in the Central Flyway. Minnesota sold 1,954 permits and had 964 active hunters in their first season but interest declined in the 2nd year by 31% (1,342 permits) and 33% (643 active hunters), respectively. Federal frameworks allowed daily bag/possession limits of 3/6, which most states selected (only portions of North Dakota, Texas and Minnesota had lower bag and possession limits). Specific dates selected by states in the Central Flyway for 2011-12 were similar to those of previous hunting seasons (Table 4). An index to crippling-loss rates (number of cranes lost/[number of cranes lost + retrieved]) in the U.S. portion of the Central Flyway has declined (R2 = 0.90, P < 0.01) from over 16% in 1975 to a preliminary estimate of about 6.9% during the most recent hunting season (Fig. 11). The number of days afield (3.8) increased slightly from the previous year (Fig. 12) and is 24% higher than the long-term average of 3.07. The preliminary estimate of seasonal bag per hunter was 1.84 birds (Fig. 13), which is 14% lower the long-term average of 2.15. The preliminary estimate of retrieved and unretrieved mortality associated with the sport harvest in the Central Flyway (15,508) was 25% lower than the previous year's estimate (Fig. 14). The increasing trend (R2 = 0.60, P < 0.01) in the Central Flyway’s harvest of MCP cranes during 1975-2011 likely was related to the gradual increase in hunter opportunity combined with improved

STATUS AND HARVESTS OF SANDHILL CRANES: MCP, RMP, LCRVP and EP 2012 • Kruse et al.
7
knowledge of crane behavior, hunting techniques, and hunter success (Sharp and Vogel 1992, Dubovsky and Araya 2008). Cranes from the MCP are also harvested in Minnesota and in the RMP hunt areas in Arizona, New Mexico, Alaska (Table 5), Canada, and Mexico. The final estimate for the 2011-12 sport harvest in Canada (Manitoba and Saskatchewan) has not been completed, but will likely be near 9,074 based on the average harvest from 2000-10 (Table 6). The estimated harvest estimate for Alaska and the RMP hunt areas in Arizona and New Mexico combined was 852 birds for 2011-2012. For Alaska, sandhill crane harvest in harvest zones 1-6 is believed to be mostly MCP cranes and zones 7-12 are sandhill cranes from the Pacific Population of lesser sandhill cranes. There also is some intermingling of MCP cranes with RMP cranes in portions of New Mexico and Arizona; however, periodic bag checks allow estimates of harvests for each population. In the 2nd year of Minnesota’s sandhill crane hunt the harvest declined by 8% from 830 to 765 cranes. No annual harvest surveys are conducted in Mexico, but annual MCP harvests probably are <10% of the retrieved harvest in the U.S. and Canada (R. Drewien and D. Nieman, personal communication). This assumed low level of harvest was supported by an independent assessment of harvest in Mexico (Kramer et al. 1995). The 2011-2012 preliminary estimate of retrieved and unretrieved kill of MCP cranes by sport hunters was 31,354, which is a 13% decrease from the previous year and a 8% decrease from the average for 2000-09 (Table 7, Fig. 15). To assess the relative rates of change between population size (abundance) and harvest, we periodically assess trends in these parameters. In the most recent analysis we used linear regression on the natural log-transformed values for these variables for the years 1982-2008. Because >10% of the MCP occurs outside the CPRV in the spring of some years, we combined the photo-corrected counts in the CPRV with the ocular cruise estimates from areas outside the CPRV for analyses of population abundance. For harvest, we used only the estimates of ‘retrieved’ harvest for the Central Flyway, RMP hunt areas in Arizona and New Mexico, Alaska, and Canada, because crippling-loss rates for the latter three areas are unknown and there are no empirical estimates of harvest from Mexico. Regression of the log-transformed values indicate a non-significant slope for the abundance values (P = 0.26; R2 = 0.05; slope = + 0.5% per year change), suggesting no trend in the abundance of cranes over the time frame. However, the regression of the harvest values suggested an increase in the rate of harvest over that same time period (P < 0.01; R2 = 0.76; slope = + 2.6% per year) (Fig. 16). These results suggest that the increase in the rate of harvest is increasing faster than the rate of growth in crane abundance, and the divergent trends cannot continue indefinitely. Methods have been developed (e.g., Araya and Dubovsky 2008, Dubovsky and Araya 2008) that will assist managers in structuring changes in harvest regulations should such need arise in the future. Results suggest that a bag-limit reduction of 1 bird per day may reduce state-specific harvests by 4%-23%, whereas fairly large restrictions in season framework dates may be needed to realize a perceptible decrease in harvest. Subsistence harvest levels of MCP sandhill cranes historically were poorly documented. However, the 1997 U.S./Canada Migratory Bird Treaty Amendment identified improvements that should be made to sandhill crane harvest-monitoring programs in both the U.S. and Canada. Intensive studies conducted on the Yukon-Kuskokwim (Y-K) Delta, Alaska, in 2006 reported an MCP harvest of 4,501 adults and fledged young and 345 eggs (Naves 2010). These estimates are relatively similar to long-term averages (1985-2005) of 3,148 adults and fledged young and 528 eggs taken by subsistence hunters on the Y-K Delta (Wentworth 2007). Efforts are being made to gather additional information on subsistence harvests for the remainder of Alaska, Siberia, and Canada.

STATUS AND HARVESTS OF SANDHILL CRANES: MCP, RMP, LCRVP and EP 2012 • Kruse et al.
8
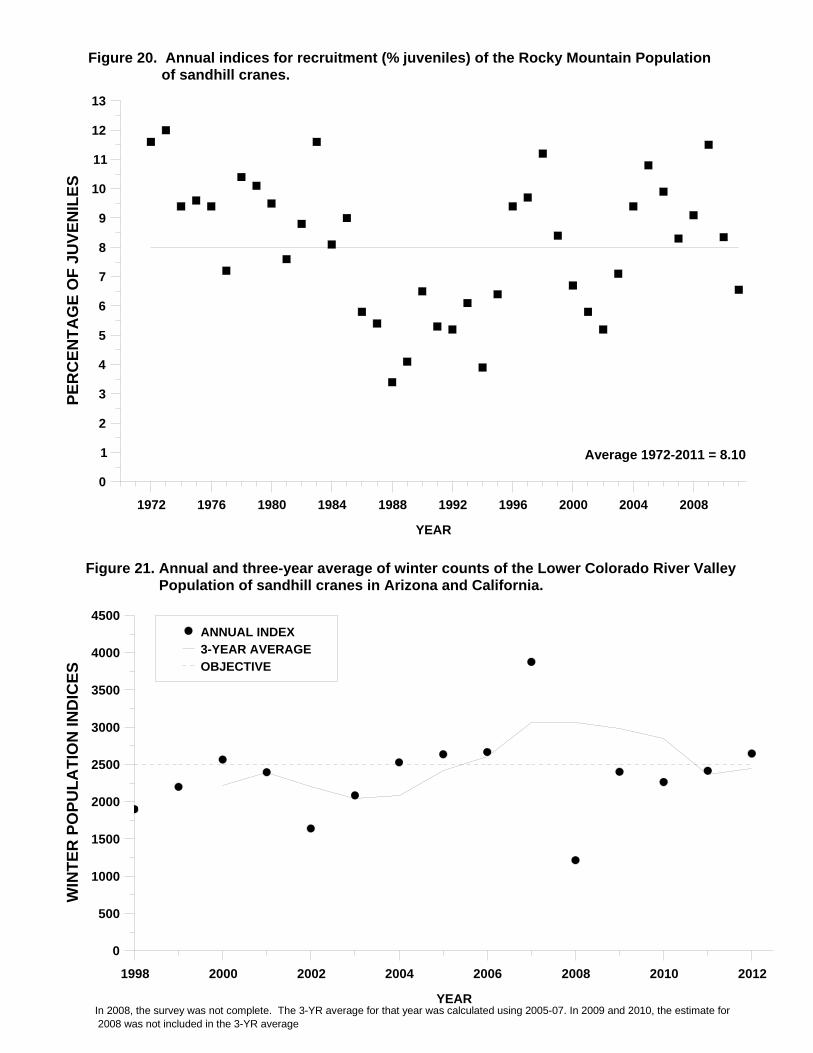
Rocky Mountain Population of Greater Sandhill Cranes The RMP was not hunted in the U.S. from 1918-80. Arizona initiated the first modern-day season in 1981. Since that time hunting programs have been guided by a cooperative management plan, including a harvest strategy that has been periodically updated and endorsed by the Central and Pacific Flyways (Kruse et al. 2008). The harvest strategy for the RMP calculate an allowable harvest based on crane survey counts and recruitment relative to the population objective. Thus, allowable harvest changes annually based on the current status of the birds. Counts conducted in the SLV during the spring migration suggested that the number of RMP cranes was relatively stable during 1984-96 (Table 9). However, survey biologists found that these estimates contained increasing numbers of the MCP (lesser subspecies). An adjustment, using ground-derived proportions, was made to correct for the lesser subspecies but was not a viable approach for the long-term (Benning et al. 1996). In 1996, the survey was discontinued (Fig. 18). In 1997, an attempt was made to survey these cranes during the fall (October) in the SLV, but MCP cranes also were present at that time. Biologists concluded that neither a spring nor a fall count in the SLV would result in a reliable index to the abundance of the RMP. As an alternative, a cooperative 5-state September pre-migration staging-area survey, experimentally tested in 1987 and 1992, has been ongoing operationally since 1995. Because no other crane population comingles with them during that time, the September pre-migration survey for the RMP appears to be a good alternative to either a spring or fall survey in the SLV and was designated as the official count for the RMP in 1997 (Table 10). Although operational in 1995 and 1996, the survey was variable in timing and survey effort. What appears to be a decrease in the population estimates (Fig. 18) in 1995 and 1996 is likely more an artifact of inconsistent survey effort (R. Drewien, personal communication). The Cooperative Flyway Management Plan (Pacific Flyway Council and Central Flyway Council 2007) recommends using the most recent three-year running average of the September survey to determine status of the RMP. The 2011 September pre-migration survey was completed successfully and resulted in 17,494 cranes counted (Thorpe and Benning 2011). For the 2011-2012 RMP hunting seasons, the 3-year average was 19,626 (Fig. 19), which was a 6% decrease from the average in 2010, but within the established population objective (17,000-21,000). During 1986-95, important breeding areas in the Intermountain West experienced extremely dry conditions and indices of recruitment (% juveniles) were low (generally between 4-6%) (Fig. 20). A return to more favorable breeding conditions during 1996-99 resulted in higher recruitment rates (8-12%), but drier conditions resulted in lower production during 2000-02. Since 2003 recruitment rates have again increased to above-average levels due to improved wetland habitats and favorable spring and summer breeding conditions. In 2011, habitat conditions were fair but cold spring temperatures and late storms delayed nesting or prevented nesting in some cases. The recruitment rate fell to 6.5%, which is 19.1% below the long-term (1972-2011) average of 8.1 (Drewien 2011). Biologists believe that the production outlook for the 2012 breeding season will be at or above average. Special limited hunting seasons during 2011-2012 resulted in a harvest of 1,262 RMP sandhill cranes (Table 8), which was 6% lower than the previous year’s harvest (Fig. 17). In 2009 Arizona increased their bag limit from 2 birds to 3 birds, which resulted in a corresponding increase in harvest but was still well below their harvest allocation. Based on population and

STATUS AND HARVESTS OF SANDHILL CRANES: MCP, RMP, LCRVP and EP 2012 • Kruse et al.
9
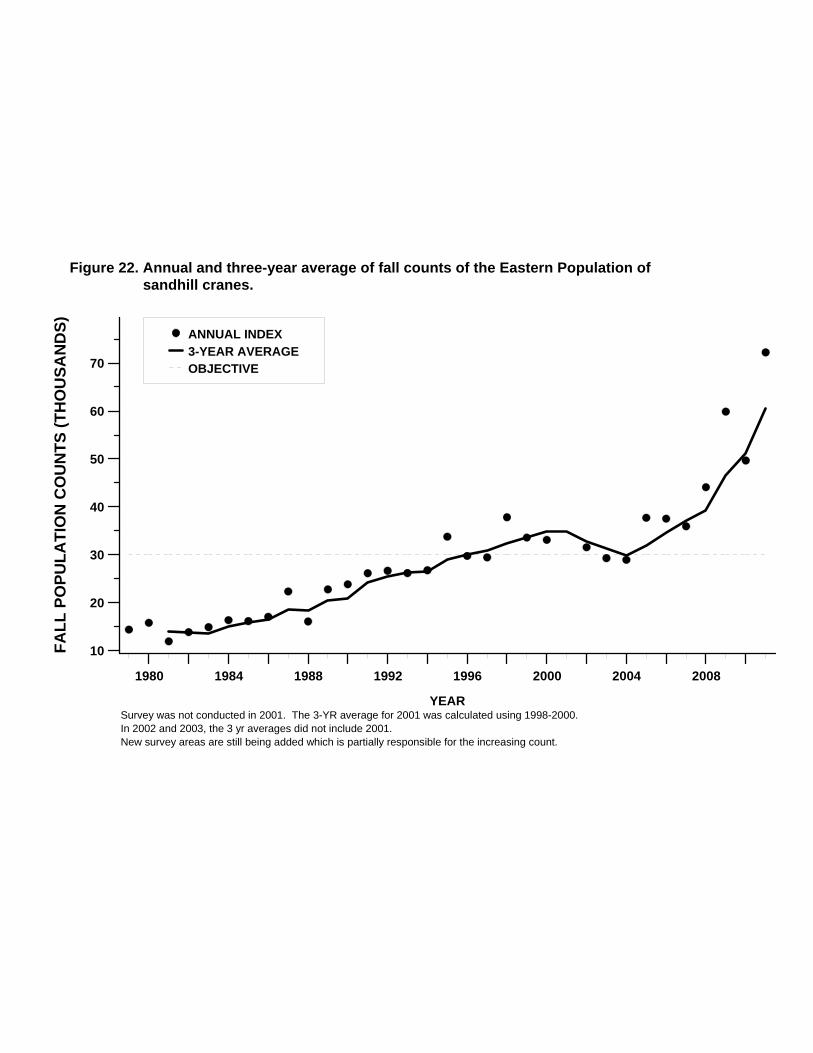
recruitment indices for the 2009-11 period, management guidelines allow for a maximum allowable take of 1,270 birds during the 2012-13 hunting season. Lower Colorado River Valley Population of Greater Sandhill Cranes The LCRVP is the smallest of the migratory populations of sandhill cranes in North America. The range of this population is believed to overlap ranges with the Rocky Mountain and Central Valley populations. Historically, winter counts of the LCRVP have not been well coordinated or conducted using a consistent methodology. However, in recent years efforts have been made to standardize areas surveyed and the timing of the survey to obtain more accurate counts and increased ability to determine trends in population abundance. Beginning in 1998, a coordinated winter aerial cruise survey with a fixed-wing aircraft has been conducted at the 4 major wintering areas: Cibola NWR, the Colorado River Indian Tribes wetland areas, Sonny Bono Salton Sea NWR, and the Gila River. Collectively these counts are believed to contain in excess of 90% of the total number of cranes in this population. The counts are not corrected for cranes present but not seen by aerial crews, and therefore have unknown bias and precision. Survey results suggested an increase from 1,900 birds in 1998 to 2,646 birds in 2012 (Table 11, Fig. 21). Using linear regression on log-transformed counts indicated an average growth rate of approximately 3% per year between 1998-2007 (U.S.D.I. 2007). The recruitment rate in 2012 was estimated to be 8.1% (Mike Rabe, Arizona Game and Fish Department, personal communication). The LCRVP was not hunted after the signing of the Migratory Bird Treaty Act in 1918. In 2007, the Service completed an Environmental Assessment “Proposed hunting regulations for the Lower Colorado River Valley Population of Greater Sandhill Cranes in the Pacific Flyway” (U.S.D.I. 2007). In 2008, the Service determined that a small allowable harvest (about 30) could be allowed on this population in years when the 3-year average of winter counts exceeded 2,500. The hunting season is guided by a cooperative management plan (Pacific Flyway Council 1995) which includes methodology for determining allowable harvests and allocation of the harvest. Once a hunting season is initiated, this season will be experimental for 3 years. After the 3 years, the season will be reviewed and revised if necessary. A limited youth hunting season for this population was conducted during 2010 in AZ, the only state that has hunted these cranes, but no LCRVP cranes were harvested. The current winter count 3-year average is 2,442 LCRVP cranes, which is below the population objective that would support promulgation of a hunting season in the 2012-13 season (as was also the case in the 2011-12 season). Eastern Population of Greater Sandhill Cranes In 1979, the Service initiated a coordinated fall survey of historic EP migratory staging areas in the Mississippi and Atlantic Flyways. This survey is conducted annually in late October by volunteers and agency personnel (Sean Kelly, USFWS, personal communication). Overall, the survey has documented a long-term increasing trend in EP cranes, with an average growth rate in the population of 3.9% per year (1979-2009) (Amundson and Johnson 2010). The most recent count from 2011 was 72,233 cranes and the 3-year average is 60,592 (Table 12, Fig. 22). The 2011 index was 45% above last year’s index of 49,666. The large increase can be attributed to the addition of counts from staging areas in eastern Minnesota into the survey for the first time as well as adding counts from several new staging areas in Wisconsin. It is

STATUS AND HARVESTS OF SANDHILL CRANES: MCP, RMP, LCRVP and EP 2012 • Kruse et al.
10
recognized that this index is not a statistically designed population estimate; however, the index does represent a minimum population estimate for EP cranes. In 2010, the Atlantic and Mississippi Flyway Councils (Ad Hoc Eastern Population Sandhill Crane Committee 2010) endorsed a management plan for EP cranes due to their increasing abundance. One of the plan’s provisions includes guidelines for potential harvest of this population when the 3-year average of the fall survey is above 30,000 cranes. Last year, Kentucky held the first season in modern times from December 15, 2011 to January 15, 2012. The hunt plan for Kentucky called for the harvest of up to 400 cranes by hunters registered through a state permit system. Statistics from the Kentucky Department of Fish and Wildlife indicated that 267 permitted hunters harvested 50 cranes during the inaugural season (Rocky Pritchert, KY Dept. of Fish and Wildlife, personal communication). Priority Research Efforts and Needs for Management of Sandhill Cranes 1. On April 7-9, 2009, a workshop was conducted to discuss the status of North American
sandhill cranes and to update research and management priorities. A published document providing outcomes of the workshop is available at: http://www.fws.gov/migratorybirds/NewReportsPublications/Research/WMGBMR/Priority_ Information_Needs_for_Sandhill_Cranes_10-09-09_FINAL.pdf. The following five priority information needs were identified (Case and Sanders, 2009).
Priority 1. Improving Sandhill Crane Harvest-Management Decision Structures- Current methods to manage harvest for RMP and MCP sandhill cranes use threshold approaches based on population objectives. Recent advances in modeling techniques and computer programs allow managers to better integrate empirical estimates of demographic parameters into models of population dynamics. Such techniques will be explored for the RMP and the MCP, which have the greatest amount of monitoring information of the 6 migratory crane populations. A graduate student was hired by Colorado State University and the Colorado Cooperative Fish and Wildlife Research Unit and is conducting this work. Priority 2. Improving the Eastern Population Sandhill Crane Survey- An assessment of the USFWS long-term coordinated fall index survey was completed in 2010 (Amundson and Johnson 2010). The conclusion clarified that the current survey is adequate to track the population trends, but is unable to estimate abundance or the geographic distribution of the population. Recommendations to improve the survey were also included. In addition, a satellite telemetry project to assess distribution and timing of movements for EP cranes throughout the migration cycle was initiated in 2010. This project will be completed in 2013. Priority 3. Information Needs for Sandhill Crane Populations in the West- These populations are monitored relatively poorly, with no standardized surveys to estimate abundance or other demographic parameters. Potential survey methodologies will be explored to provide better information to managers. Understanding use of wintering and breeding areas by these populations will assist in developing monitoring strategies and provide a better biological rationale for harvest and habitat management decisions. In March, 2011, a pilot survey using an Unmanned Aerial System (UAS) was conducted by a team of researchers and managers from the Service and the U.S. Geological Survey. A Raven RQ-11A was flown over roosting cranes at the Monte Vista National Wildlife Refuge in the San Luis Valley of Colorado, and thermal

STATUS AND HARVESTS OF SANDHILL CRANES: MCP, RMP, LCRVP and EP 2012 • Kruse et al.
11
videography taken of the cranes. Estimates were derived from the imagery and compared to counts of roosting cranes taken by biologists on the ground. Initial results proved promising, and additional work has been completed in Fall 2011 and Spring 2012. Summaries of this work and popular articles are available at http://rmgsc.cr.usgs.gov/uas/sandhillcraneproj.shtml.
Priority 4. Assessing Effects of Habitat Changes on the Rocky Mountain Population of Sandhill Cranes- The wintering habitat for RMP sandhill cranes has been identified as the limiting factor for this population. A coordinator would be hired and responsible for developing and promoting outreach and grant projects to encourage and enable private land owners to protect and improve crane habitat as well as inform and educate the public of the importance of preserving agricultural land for sandhill crane management. Priority 5. Improving Population Abundance Estimates for the Mid-Continent Population of Sandhill Cranes- The current survey framework for the annual cooperative spring survey has been in place since 1982 and has provided a reliable index of abundance for MCP sandhill cranes. However, managers are becoming increasingly concerned that habitat changes may be affecting historic spatial and temporal patterns of cranes in the survey area. Evaluation of other survey techniques is needed to compare abundance, variability, and reliability to the existing survey.
2. A monograph on the geographic distribution of Mid-Continent Population sandhill cranes
recently was published by Gary Krapu, Dave Brandt, Ken Jones, and Doug Johnson (Wildlife Monographs 175). The results provide information from many years of satellite telemetry work which followed the cranes throughout their annual cycle, and will have important implications for management of the MCP in the future.
3. The agricultural landscape on which sandhill cranes depend for a portion of their annual cycle has undergone dramatic changes in recent years. A recently published paper indicates that the percentage of cropland in the CPRV that is being planted to soybeans, which are not valuable nutritionally for cranes, is increasing whereas the percentage planted to corn is decreasing (Pearse et al. 2010). In years when availability of corn is reduced, some cranes may not be able to increase lipid reserves as much as they did historically, due not only to increased crane numbers but also increased waterfowl abundance, particularly snow geese. If corn acreage and availability decline further, major changes could occur in the abundance or condition of cranes using the area.
4. The standardized timing (4th Tuesday in March) of the cooperative Spring MCP survey in
the Central Platte River Valley is being assessed by the Northern Prairie Wildlife Research Center. They will use data from radio-marked cranes to estimate proportions of birds present during spring surveys conducted between 2000 and 2007. They also conducted roadside surveys in eastern South Dakota during the cooperative spring survey to determine presence, distribution, and number of cranes that have already left Nebraska. Preliminary survey results reveal that a sizeable but relatively similar number of cranes (10,000-15,000) move north of the Platte River by late March. Overall, preliminary information indicates that the current survey timing is appropriate (A. Pearse, Northern Prairie Wildlife Research Center, personal communication).

STATUS AND HARVESTS OF SANDHILL CRANES: MCP, RMP, LCRVP and EP 2012 • Kruse et al.
12
References Ad Hoc Eastern Population Sandhill Crane Committee. 2010. Management Plan for the Eastern
Population of Sandhill Cranes. Special Report in files of the Mississippi Flyway Representative. Minneapolis, MN.
Aldrich, J.W. 1979. Status of the Canadian sandhill crane. Pages 139-148 in J.C. Lewis, ed. Proceedings 1978 Crane Workshop. Colorado State University Printing Service, Ft. Collins, CO. 259pp.
Amundson, C. L. and D. H. Johnson. 2010. Assessment of the Eastern Population Greater Sandhill Cranes (Grus canadensis tabida) Fall migration Survey, 1979-2009. Report to the U.S. Fish and Wildlife Service, Migratory Bird Management, Region 3. 21 pp.
Araya A.C., and J.A. Dubovsky. 2008. Temporal distribution of harvested Mid-continent sandhill cranes within the Central Flyway States during the 1997-2001 hunting seasons. Proceedings North American Crane Workshop 10:50-57.
Araya, A.C., K.L. Kruse, and K.D. Warner. 2010. Summary of sandhill crane sport harvest in Canada 1975-2006. Proceedings North American Crane Workshop 11:22-30
Benning, D.S. 1996. Spring Survey - Rocky Mountain Population of Greater Sandhill Cranes. Special report in the files of the Central Flyway Representative. Denver, CO. 6pp..
Benning, D.S., R.C. Drewien, D.H. Johnson, W.M. Brown, and E.L. Boeker. 1996. Spring population estimates of Rocky Mountain Greater Sandhill Cranes in Colorado. Proceedings North American Crane Workshop 7:165-172.
Benning, D.S., and D.H. Johnson. 1987. Recent improvements to sandhill crane surveys in Nebraska's Central Platte River Valley. Pages 10-16 in J.C. Lewis, editor. Proceedings 1985 Crane Workshop. Platte River Whooping Crane Habitat Maintenance Trust, Grand Island, NE. 415pp.
Buller, R.J. 1979. Lesser and Canadian sandhill crane populations, age structure, and harvest. U.S. Fish and Wildlife Service Special Scientific Report 221. 10pp.
Buller, R.J. 1982. Distribution of sandhill cranes wintering in Mexico. Pages 266-272 in J.C. Lewis, ed. Proceedings 1981 Crane Workshop. National Audubon Society, Tavernier, FL. 296pp.
Case, D.J. and S.J. Sanders, editors, 2009. Priority information needs for sandhill cranes-a funding strategy. Special report in the files of the Central Flyway Representative. Denver, CO. 13pp.
Central, Mississippi and Pacific Flyway Councils. 1981, 1993, and 2006. Management Guidelines for the Mid-Continent Population of Sandhill Cranes. Special Report in files of the Central Flyway Representative. Denver, CO.
Drewien, R.C. 2011. October 2011 recruitment survey of the Rocky Mountain Population of Greater sandhill cranes. Special Report in files of the Central Flyway Representative. Denver, CO. 4pp.
Drewien, R.C., and E.G. Bizeau. 1974. Status and distribution of greater sandhill cranes in the Rocky Mountains. Journal of Wildlife Management 38:720-742.
Drewien, R.C. and J.C. Lewis. 1987. Status and distribution of cranes in North America. Pages 469-477 in G.W. Archibald and R.F. Pasquier, editors. Proceedings 1983 International Crane Workshop, International Crane Foundation, Baraboo, WI. 596pp.
Drewien, R.C., R.J. Oakleaf and W.H. Mullins. 1976. The sandhill crane in Nevada. Pages 130-138 in J.C. Lewis, editor., Proceedings of the 1975 International Crane Workshop, Oklahoma State University, Publication Printing, Stillwater, OK. 355pp.
Drewien, R.C., W.M. Brown, and W.L. Kendall. 1995. Recruitment in Rocky Mountain Greater Sandhill Cranes and comparisons with other crane populations. Journal of Wildlife Management 59:339-356.
Drewien, R.C., W.M. Brown, and D.S. Benning. 1996. Distribution and abundance of sandhill cranes in Mexico. Journal of Wildlife Management 60:270-285.
Drewien, R.C., W.L. Kendall, J.A. Dubovsky, and J.H. Gammonley. 2002. Developing a survival model for Rocky Mountain Population of greater sandhill cranes. Proposal submitted to the U.S. Fish and Wildlife Service Webless Migratory Bird Program, Denver, CO.
Drewien, R.C., W.M. Brown, D.C. Lockman, W.L. Kendall, K.R. Clegg, V.K. Graham, and S.S. Manes. 2000. Band recoveries, mortality factors, and survival of Rocky Mountain Greater sandhill cranes, 1969-99. Report submitted to the U.S. Fish and Wildlife Service, Division of Migratory Bird Management, Denver, CO.
Dubovsky J.A., and A.C. Araya. 2008. Hunting success for Mid-continent sandhill cranes in the Central Flyway: Comparing current and historic results. Proceedings North American Crane Workshop. 10:58-64.

STATUS AND HARVESTS OF SANDHILL CRANES: MCP, RMP, LCRVP and EP 2012 • Kruse et al.
13
Johnson, D.H. 1979. Modeling sandhill crane population dynamics. U.S. Fish and Wildlife Service Special Scientific Report 222. 10pp.
Johnson, D.H., J.E. Austin, and T.A. Shaffer. 2003. A fresh look at the taxonomy of Midcontinental Sandhill Cranes. Proceedings North American Crane Workshop. 9:37-46.
Johnson, D.H., and W.L. Kendall. 1997. Modeling the population dynamics of Gulf Coast sandhill cranes. Proceedings North American Crane Workshop 7:173-179.
Johnson, D.H., and R.E. Stewart. 1973. Racial composition of migrant populations of sandhill cranes in the northern plains states. Wilson Bulletin 85:148-162.
Jones, K.L., G.L. Krapu, D.A. Brandt, and M.V. Ashley. 2005. Population genetic structure in migratory sandhill cranes and the role of Pleistocene glaciations. Molecular Ecology 14:2645-2657.
Kendall, W.L., D.H. Johnson, and S.C. Kohn. 1997. Subspecies composition of sandhill crane harvest in North Dakota, 1968-94. Proceedings North American Crane Workshop 7:201-208.
Kramer, G.W., E. Carrera, and D. Zavaleta. 1995. Waterfowl harvest and hunter activity in Mexico. Transactions North American Wildlife and Natural Resources Conference 60:243-50.
Krapu, G.L., D.A. Brandt, K.L. Jones, and D.H. Johnson. 2011. Geographic distribution of the Mid-Continent population of sandhill cranes and related management applications. Wildlife Monographs 175:1-38.
Kruse, K.L., D.E. Sharp and J.A Dubovsky. 2008. Population status, hunting regulations, and harvests of the Rocky Mountain Population of Greater Sandhill Cranes, 1981-2005. Proceedings North American Crane Workshop. 10:71-75.
Kruse, K.L., D.E. Sharp, and J.A. Dubovsky. 2010. Status and harvests of sandhill cranes: Mid-continent, Rocky Mountain and Lower Colorado River Valley Populations. Administrative Report, U.S. Fish and Wildlife Service, Denver, CO. 11pp.
Leopold, A. 1949. A Sand County Almanac and Sketches Here and There. Oxford University Press, New York. 228 pp.
Lewis, J. C. 1977. Sandhill Crane. Pp. 4-43 in Sanderson, G. C., editor., Management of Migratory Shore and Upland Game Birds in North America. Intl. Assoc. Fish and Wildl. Agencies, Washington, D.C.
Liddick, T.S. 2011. Coordinated spring mid-continent sandhill crane survey. Administrative Report, U.S. Fish and Wildlife Service, Laurel, MD. 10pp.
Lochman, D.C., L. Serdiuk, and R.C. Drewien. 1987. An experimental greater sandhill crane and Canada goose hunt in Wyoming. Pages 47-57 in J.C. Lewis, editor. Proceedings 1985 Crane Workshop. Platte River Whooping Crane Habitat Maintenance Trust, Grand Island, NE. 415pp.
Martin, E.M. 2007. Sandhill crane harvest and hunter activity in the Central Flyway during the 2004-05 hunting season. Unnumbered Administrative Report, U.S. Fish and Wildlife Service, Laurel, MD. 12pp.
Meine, C. D. and G. W. Archibald (Eds). 1996. The cranes: - Status survey and conservation action plan. IUCN, Gland, Switzerland, and Cambridge, U.K. 294pp.
Miller, H.W.1987. Hunting in the management of Mid-continent sandhill cranes. Pages 39-46 in J.C. Lewis, editor. Proceedings 1985 Crane Workshop. Platte River Whooping Crane Habitat Maintenance Trust, Grand Island, NE. 415pp.
Montgomery, J.B. Jr. 1997. Sandhill crane use of the Mid-Pecos Valley of New Mexico. Proceedings North American Crane Workshop 7:157-164.
Naves, L.C. 2010, revised [2009]. Alaska migratory bird subsistence harvest estimates, 2004-2007, Alaska Migratory Bird Co-Management Council. Technical Paper No. 349. Alaska Department of Fish and Game, Division of Subsistence, Anchorage, AK.
Pacific Flyway Council. 1989 and 1995. Pacific Flyway Management Plan for the greater sandhill crane population wintering along the Lower Colorado River Valley. Special report in the files of the Pacific Flyway Representative, Portland, OR.
Pacific Flyway Council and Central Flyway Council. 1982, 1987, 1991, 1997 and 2007. Management Plan of the Pacific and Central Flyways for the Rocky Mountain Population of Greater Sandhill Cranes. Special Report in the files of the Central Flyway Representative. Denver, CO.
Pearse, A.T., G.L. Krapu, D.A. Brandt, and P.J. Kinzel. 2010. Changes in agriculture and abundance of snow geese affect carrying capacity of sandhill cranes in Nebraska. Journal of Wildlife Management 74:479-488.
Petersen, J.L., R. Bischof, G.L. Krapu, and A.L. Szalanski. 2003. Genetic variations in the midcontinental population of sandhill crane, Grus canadensis. Biochemical Genetics 41:1-12.
STATUS AND HARVESTS OF SANDHILL CRANES: MCP, RMP, LCRVP and EP 2012 • Kruse et al.
14
Rhymer, J.M., M.G. Fain, J.E. Austin, D.H. Johnson, and C. Krajewski. 2001. Mitochondrial phylogeography, subspecific taxonomy, and conservation genetics of sandhill cranes (Grus canadensis; Aves: Gruidae). Conservation Genetics 2:203-218.
Schmitt, C.G., and B. Hale. 1997. Sandhill crane hunts in the Rio Grande Valley and southwest New Mexico. Proceedings North American Crane Workshop 7:219-231.
Sharp, D.E., and J.E. Cornely. 1997. Summary of sandhill crane hunting seasons in North Dakota, 1968-94. Proceedings North American Crane Workshop 7:209-218.
Sharp, D.E., H.M. Hands, J.A. Dubovsky, and J.E. Cornely. 2010. Summary of sandhill crane hunting seasons in Kansas, 1993-2007. Proceedings of the North American Crane Workshop 11:31-39.
Sharp, D.E., and W.O. Vogel. 1992. Population status, hunting regulations, hunting activity, and harvests of the Mid-continent population of sandhill cranes. Proceedings North American Crane Workshop 6:24-32.
Tacha, T.C., S.A. Nesbitt, and P.A. Vohs. 1992. Sandhill crane in A. Poole, P. Stettenheim, and F. Gill, editors. The birds of North America Monograph 31. The Academy of Natural Sciences, Philadelphia and American Ornithologists' Union, Washington, D.C. 24 pp.
Tacha, T.C., S.A. Nesbitt, and P.A. Vohs. 1994. Sandhill cranes. Pages 77-94 in T.C. Tacha and C.E. Braun, editors. Migratory Shore and Upland Game Bird Management in North America. International Association of Fish and Wildlife Agencies, Washington D.C.
Tacha, T.C., and P.A. Vohs. 1984. Some population parameters of sandhill cranes from mid-continental North America. Journal of Wildlife Management 48:89-98.
Thorpe, P.P. and D.S. Benning. 2011. September 2011 count of the Rocky Mountain Population of Greater Sandhill Cranes. Special Report in the files of the Central Flyway Representative. Denver, CO. 8pp.
U.S.D.I. 2007. Proposed hunting regulations for the Lower Colorado River Valley population of greater sandhill cranes in the Pacific Flyway. U.S. Fish and Wildlife Service, Portland, OR. 13pp.
Walkinshaw, L. H. 1949. The sandhill cranes. Cranbrook Institute of Science Bulletin 29:1-202. Walkinshaw, L.H. 1965. A new sandhill crane from Central Canada. Canadian Field-Naturalist, 79:181-
184. Walkinshaw, L.H. 1973. Cranes of the World. Winchester Press, New York, New York. 370pp. Wentworth, C. 2007. Subsistence Migratory Bird Harvest Survey. Yukon-Kuskokwim Delta, 2001-2005.
With 1985-2005 species tables. U.S. Fish and Wildlife Service, Migratory Birds and State Programs, Alaska Migratory Bird Co-Management Council, Anchorage, AK. 206pp.

Figure 1. Primary wintering and breeding range and the approximate migration corridor of Mid-Continent sandhill cranes (based on figures in Tacha et al. 1994 and Krapu et al. 2011).
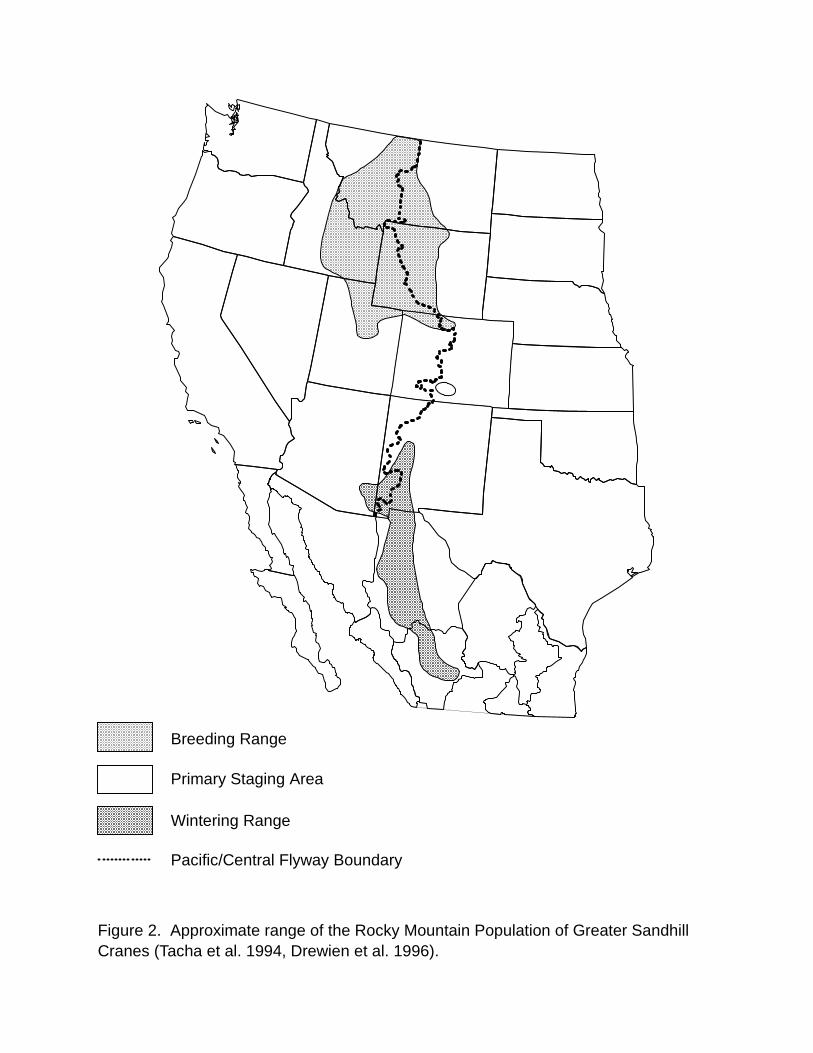
Figure 2. Approximate range of the Rocky Mountain Population of Greater SandhillCranes (Tacha et al. 1994, Drewien et al. 1996).
Breeding Range
Primary Staging Area
Wintering Range
Pacific/Central Flyway Boundary

Fish Springs NWR
Lund
Sonny BonoSalton Sea NWR
Historic winter range
Brawley
Cibola NWR
ImperialNWR
Ruby Lake NWR
Gila Bend
Historic winter range
Breeding Range
Primary Staging Area
Wintering Range
Figure 3. Approximate range of the Lower Colorado River Population of Greater SandhillCranes (Pacific Flyway Council 1995).

Figure 4. Approximate range of the Eastern Population of Greater SandhillCranes (Atlantic and Mississippi Flyway Councils 2010).

Figure 5. Areas open to the hunting of Mid-Continent sandhill cranes by Federal frameworks in the Central Flyway states, 2011-12.
1980 1985 1990 1995 2000 2005 2010
0
1
2
3
4
5
6
7
8
9
10
SAN
DH
ILL
CR
AN
ES (T
HO
USA
ND
S)
Saskatchewan
North Dakota
Figure 6. Annual harvests of Mid-Continent sandhill cranes in Saskatchewan and North Dakota, 1980-2010.
1982 1985 1988 1991 1994 1997 2000 2003 2006 2009 2012
YEAR
100
200
300
400
500
600
700
SAN
DH
ILL
CR
AN
ES (T
HO
USA
ND
S) OCULAR TRANSECT PHOTO-CORRECTION
Figure 7. Spring population indices for Mid-Continent sandhill cranes on the Central Platte River Valley, Nebraska.
* The value for 2012 is preliminary.

1982 1985 1988 1991 1994 1997 2000 2003 2006 2009100
200
300
400
500
600
700
800SA
ND
HIL
L C
RA
NES
(TH
OU
SAN
DS)
Figure 8. Photo-corrected spring population estimates (solid line) and the 95% confidence intervals (dashed lines) for Mid-Continent sandhill cranes on the Central Platte River Valley, Nebraska.
1982 1985 1988 1991 1994 1997 2000 2003 2006 2009
YEAR
150
200
250
300
350
400
450
500
550
600
650
700
SAN
DH
ILL
CR
AN
ES (T
HO
USA
ND
S)
ANNUAL INDEX3-YEAR AVERAGETHRESHOLDS
Figure 9. Annual and three-year average photo-corrected ocular transect spring population indices and population objective thresholds for Mid-Continent sandhill cranes.

1975 1978 1981 1984 1987 1990 1993 1996 1999 2002 2005 2008 2011
3
4
5
6
7
8
9
10
11C
RA
NE
HU
NTE
RS
(TH
OU
SAN
DS)
Figure 10. Active Mid-Continent sandhill crane hunters in the U.S. portion of the Central Flyway.
1975 1979 1983 1987 1991 1995 1999 2003 2007 2011
YEAR
6
8
10
12
14
16
18
CR
IPPL
ING
LO
SS R
ATE
(%)
Figure 11. Crippling-loss rate (number lost/[number retrieved + lost]) of Mid-Continent sandhill cranes in the U.S. portion of the Central Flyway.

1975 1978 1981 1984 1987 1990 1993 1996 1999 2002 2005 2008 2011
2
2.5
3
3.5
4D
AYS
PER
HU
NTE
R
Figure 12. Average number of hunting days afield reported by active Mid-Continent sandhill crane hunters in the U.S. portion of the Central Flyway.
1975 1978 1981 1984 1987 1990 1993 1996 1999 2002 2005 2008 2011
YEAR
0
1
2
3
SEA
SON
AL
SAN
DH
ILL
CR
AN
E B
AG
Figure 13. Seasonal bag per Mid-Continent sandhill crane hunter in the U.S. portion of the Central Flyway.

1975 1979 1983 1987 1991 1995 1999 2003 2007 2011
5
10
15
20
25N
UM
BER
OF
CR
AN
ES (T
HO
USA
ND
S)
Figure 14. Estimated hunting mortality (retrieved and unretrieved) of Mid-Continent sandhill cranes in the U.S. portion of the Central Flyway.
1975 1979 1983 1987 1991 1995 1999 2003 2007 2011
YEAR
0
5
10
15
20
25
30
35
40
45
NU
MB
ER O
F C
RA
NES
(TH
OU
SAN
DS)
MexicoOther Survey TotalCanadaCentral Flyway
Figure 15. Estimated hunting mortality (retrieved and unretrieved) of Mid-Continent sandhill cranes in North America.
1. In 1999, there was no estimate available for AK.2. In 2010, MN began hunting MCP in the northwestern portion of the state.
1,2

1982 1984 1986 1988 1990 1992 1994 1996 1998 2000 2002 2004 2006 200812.5
12.6
12.7
12.8
12.9
13.0
13.1
13.2
13.3
LN (A
BU
ND
AN
CE)
9.2
9.4
9.6
9.8
10.0
10.2
10.4
10.6
LN (H
AR
VEST
)
Population Harvest
Figure 16. Trend analyses of indices to abundance and harvest of Mid-Continent sandhill cranes.
1981 1984 1987 1990 1993 1996 1999 2002 2005 2008 2011
YEAR
0
100
200
300
400
500
600
700
800
900
1000
1100
1200
1300
1400
1500
ESTI
MA
TED
HA
RVE
ST
Figure 17. Estimated harvest of Rocky Mountain Population sandhill cranes.
+2.6%/yr, P<0.01, R 2=0.76+0.5%/yr, P=0.26, R 2=0.05

1984 1986 1988 1990 1992 1994 1996 1998 2000 2002 2004 2007 2009 2011
10
12
14
16
18
20
22
24
SAN
DH
ILL
CR
AN
ES (T
HO
USA
ND
S)SPRINGFALL
Figure 18. Abundance indices for the Rocky Mountain Population of sandhill cranes (Incomplete survey efforts in years prior to 1997 might have resulted in lower estimates; the official count begins in 1997. In 2006, survey was not conducted due to mechanical issues with the aircraft.)
1996 1998 2000 2002 2004 2006 2008 2010 2012
YEAR
12.5
15
17.5
20
22.5
25
FALL
PO
PULA
TIO
N IN
DIC
ES (T
HO
USA
ND
S)
ANNUAL INDEX3-YEARAVERAGEOBJECTIVE
Figure 19. Annual and three-year average of fall pre-migration abundance indices for the Rocky Mountain Population of sandhill cranes.
Incomplete survey efforts in years prior to 1997 might have resulted in lower estimates; the official count begins in 1997. In 2006, survey was not conducted due to mechanical issues with the aircraft.
1972 1976 1980 1984 1988 1992 1996 2000 2004 2008
YEAR
0
1
2
3
4
5
6
7
8
9
10
11
12
13
PER
CEN
TAG
E O
F JU
VEN
ILES
Figure 20. Annual indices for recruitment (% juveniles) of the Rocky Mountain Population of sandhill cranes.
Average 1972-2011 = 8.10
1998 2000 2002 2004 2006 2008 2010 2012
YEAR
0
500
1000
1500
2000
2500
3000
3500
4000
4500
WIN
TER
PO
PULA
TIO
N IN
DIC
ES
ANNUAL INDEX3-YEAR AVERAGEOBJECTIVE
Figure 21. Annual and three-year average of winter counts of the Lower Colorado River Valley Population of sandhill cranes in Arizona and California.
In 2008, the survey was not complete. The 3-YR average for that year was calculated using 2005-07. In 2009 and 2010, the estimate for 2008 was not included in the 3-YR average
1980 1984 1988 1992 1996 2000 2004 2008
YEAR
10
20
30
40
50
60
70
FALL
PO
PULA
TIO
N C
OU
NTS
(TH
OU
SAN
DS) ANNUAL INDEX
3-YEAR AVERAGEOBJECTIVE
Figure 22. Annual and three-year average of fall counts of the Eastern Population of sandhill cranes.
Survey was not conducted in 2001. The 3-YR average for 2001 was calculated using 1998-2000. In 2002 and 2003, the 3 yr averages did not include 2001. New survey areas are still being added which is partially responsible for the increasing count.

Table 1. Annual spring abundance indices for the Mid-Continent Population of sandhill cranes.
CENTRAL PLATTE RIVER VALLEY, NE ALL AREASOCULAR PHOTO CORRECTED OTHER OCULAR PHOTO CORRECTEDCRUISE OCULAR OCULAR TRANSECT OTHER CRUISE OCULAR OCULAR TRANSECT
YR TRANSECT TRANSECT ANNUAL 3-YR AVG NE KS TX CO1 OK1 NM1TRANSECT TRANSECT ANNUAL 3-YR AVG
1974 162,600 9,000 1,900 3,200 0 400 0 177,100
1975 223,600 2,300 900 tr 500 100 100 227,500
1976 147,500 2,800 300 800 0 100 1,000 152,500
1977 173,400 1,100 1,600 30,700 0 400 12,500 220,000
1978 149,800 188,582 2,200 700 4,900 0 0 2,300 159,900 198,682
1979 203,574 2,600 1,100 0 500 1,500 0 209,274
1980 223,400 254,417 5,000 4,100 1,400 0 100 500 234,500 265,517
1981 248,882 8,300 11,200 21,800 500 0 0 290,682
1982 347,996 417,263 7,100 2,000 7,800 2,800 0 100 367,796 437,063
1983 306,316 343,378 4,100 200 7,000 0 200 tr 317,816 354,878
1984 222,710 261,802 340,814 18,100 900 800 0 1,100 tr 243,610 282,702 358,214
1985 378,127 514,763 373,314 11,500 3,000 1,200 393,827 530,463 389,348
1986 317,025 353,040 376,535 1,000 200 2,100 320,325 356,340 389,835
1987 383,581 416,058 427,954 0 tr 400 383,981 416,458 434,420
1988 386,853 463,457 410,852 0 0 7,700 394,553 471,157 414,652
1989 391,353 391,995 423,837 100 1,000 800 393,253 393,895 427,170
1990 385,950 412,154 422,535 11,000 5,200 10,300 412,450 438,654 434,569
1991 297,831 340,645 381,598 100 800 200 298,931 341,745 391,431
1992 257,709 406,457 386,419 12,200 300 1,100 271,309 420,057 400,152
1993 253,799 378,883 375,328 16,800 37,750 13,500 321,849 446,933 402,912
1994 395,543 477,215 420,852 14,600 0 0 2,400 410,143 491,815 452,935
1995 273,376 326,181 394,093 30,400 0 0 6,700 303,776 356,581 431,776
1996 318,514 519,984 441,127 7,600 0 0 3,900 326,114 527,584 458,660
1997 350,932 534,630 460,265 16,200 100 0 367,232 550,930 478,365
1998 337,203 530,848 528,487 13,600 100 0 350,903 544,548 541,021
1999 219,794 284,858 450,112 3,500 100,000 0 323,294 388,358 494,612
2000 484,585 490,118 435,275 16,900 26,100 500 528,085 533,618 488,841
2001 387,336 413,498 396,158 10,500 42,300 3,500 443,636 469,798 463,925
2002 309,029 315,044 406,220 17,100 15,100 1,200 5,800 342,429 348,444 450,620
2003 300,918 348,023 358,855 24,800 4,100 3,800 333,618 380,723 399,655
2004 365,370 426,534 363,200 17,700 1,200 2,200 100 386,470 447,634 392,267
2005 412,285 491,915 422,157 27,100 2,900 8,700 2,600 450,985 530,615 452,991
2006 178,564 216,810 378,420 70,000 2,100 5,500 256,164 294,410 424,220
2007 307,094 384,118 364,281 20,400 3,600 5,900 336,994 414,018 413,014
2008 474,051 545,884 382,271 24,500 1,100 0 499,651 571,484 426,637
2009 457,436 565,257 498,420 29,900 tr 10,800 498,136 605,957 530,486
2010 455,104 691,534 600,892 17,600 1,300 28,000 502,004 738,434 638,625
2011 347,501 482,797 579,863 18,800 3,500 14,300 4,700 384,101 519,397 621,263
2012 2 259,576 12,800 6 1,100 273,482
1 CO, OK, and NM were eliminated from the Official Survey Area in 1985 by the CF CMU. K.L. Kruse 06/13/122 Preliminary

Table 2. Federal Mid-Continent sandhill crane permits issued in the Central Flyway.
YR CO KS MT NM ND OK SD TX WY TOTAL
1975 401 158 1,225 4,172 171 198 5,482 56 11,8631976 341 117 1,195 4,137 265 200 5,060 37 11,3521977 374 82 1,452 6,294 519 134 4,897 48 13,8001978 343 209 956 5,798 620 98 5,198 52 13,2741979 528 159 1,288 4,949 470 63 5,098 43 12,5981980 437 118 1,082 5,754 510 240 5,239 33 13,4131981 397 53 1,022 5,796 466 197 5,297 30 13,2581982 528 147 962 4,714 750 579 4,650 40 12,3701983 575 175 706 8,033 909 528 7,317 63 18,3061984 538 113 721 7,436 1,187 544 6,838 43 17,4201985 555 143 710 6,802 1,102 656 7,417 59 17,4441986 617 99 595 8,926 1,073 705 7,258 25 19,2981987 610 128 502 8,778 1,213 517 6,289 30 18,0671988 512 162 480 6,214 1,472 437 7,053 38 16,3681989 434 172 430 6,128 1,717 524 8,066 25 17,4961990 389 143 533 7,268 1,725 646 11,994 22 22,7201991 501 238 602 3,353 1,618 668 11,142 25 18,1471992 498 303 582 3,760 1,397 721 9,848 18 17,1271993 411 575 336 541 4,572 1,277 708 10,407 37 18,8641994 427 567 320 547 4,790 1,561 636 10,515 49 19,4121995 571 711 351 564 5,242 1,323 650 10,755 42 20,2091996 612 837 369 499 5,570 1,391 677 11,334 41 21,3301997 572 997 325 454 4,934 1,393 757 37,365 2 46 46,8451998 4,937 2 1,088 270 449 6,082 1,385 951 32,523 2 49 47,7341999 4,847 2 1,235 279 516 6,050 1,438 810 33,380 2 52 48,6072000 5,169 2 1,084 283 493 7,451 1,333 721 44,719 2 58 61,3112001 5,869 2 1,374 253 509 8,078 1,315 680 49,410 2 72 67,5602002 5,644 2 1,279 303 496 8,245 3 1,186 619 37,558 2 54 55,384
2003 1 5,854 2 1,206 273 471 6,030 3 1,000 563 43,199 2 50 58,6462004 1 5,784 2 1,180 3 308 548 5,788 3 780 3 307 52,161 2 61 66,9172005 1 5,766 2 805 3 281 494 7,441 3 698 3 490 51,511 2 68 67,5542006 1 4,792 2 826 3 265 512 4 7,410 3 615 3 445 5 70,968 2 78 85,9112007 1 4,931 2 598 3 238 480 4 7,442 3 731 3 390 5 101,382 2 58 116,2502008 1 5,772 2 655 3 272 677 4 6,501 3 736 3 398 5 122,553 2 73 137,6372009 1 4,038 2 540 3 139 862 4 7,774 3 1,029 3 693 5 11,332 5 62 26,4692010 1 4,280 2 508 3 283 701 4 8,375 3 1,055 3 410 5 12,560 5 86 28,2582011 1 783 2 801 3 311 575 4 8,024 3 1,104 3 356 5 13,905 5 86 25,945
AVERAGES:
1975-79 397 145 1,223 5,070 409 139 5,147 47 12,5771980-89 520 131 721 6,858 1,040 493 6,542 39 16,3441990-99 1,377 859 293 529 5,162 1,451 722 17,926 38 28,1002000-09 5,362 955 262 554 7,216 942 531 58,479 63 74,3641975-2010 2,190 893 219 690 6,280 1,040 516 24,105 48 35,534
1 Preliminary S:\CF_D\projects\speciesandpopulations\sandhillcranes\Status Reports\Shcranerep.xls K.L. Kruse 13-Jun-122 Harvest Information Program (HIP) or a point-of-sale electronic record (without cost) used to identify crane hunters in lieu of a special sandhill crane hunting permit3 States began charging a fee for crane hunting permits which reduces the number of permits issued to hunters that only
occasionally come into contact with sandhill cranes.4 NM uses a combination of electronic and paper permits.5 SD uses a special question in their HIP questionnaire to identify sandhill crane hunters; TX hunters can only obtain crane permits in selected locations.
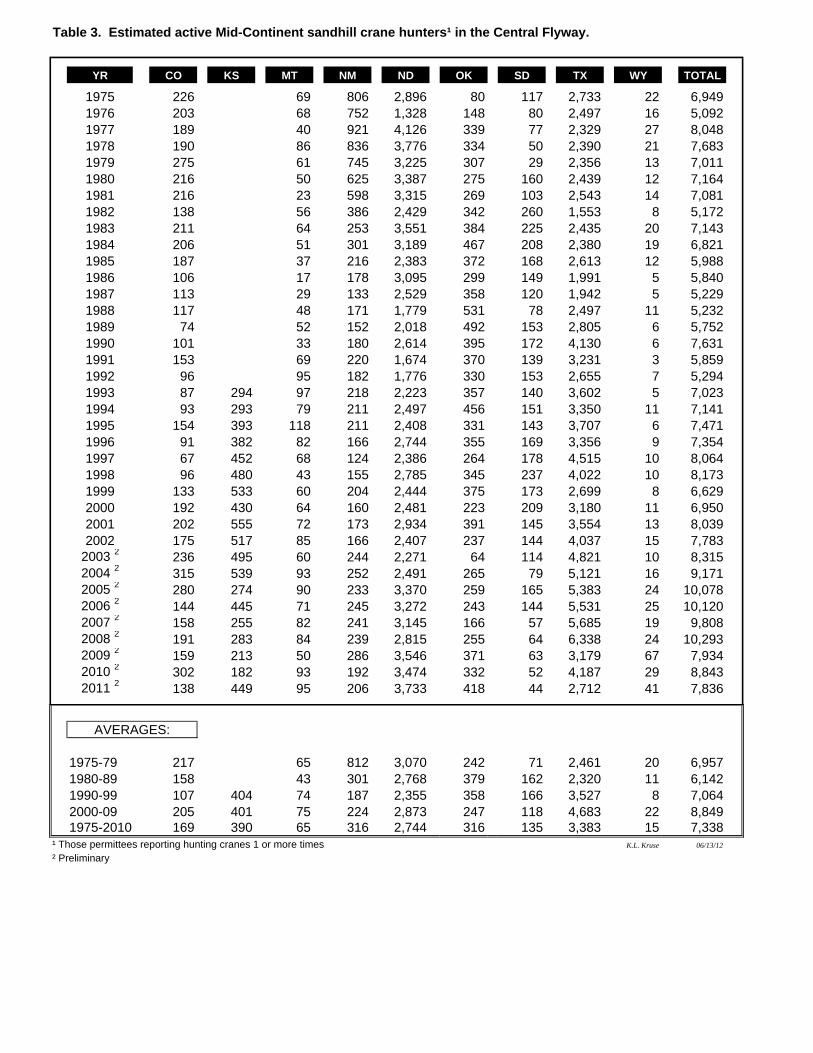
Table 3. Estimated active Mid-Continent sandhill crane hunters¹ in the Central Flyway.
YR CO KS MT NM ND OK SD TX WY TOTAL
1975 226 69 806 2,896 80 117 2,733 22 6,9491976 203 68 752 1,328 148 80 2,497 16 5,0921977 189 40 921 4,126 339 77 2,329 27 8,0481978 190 86 836 3,776 334 50 2,390 21 7,6831979 275 61 745 3,225 307 29 2,356 13 7,0111980 216 50 625 3,387 275 160 2,439 12 7,1641981 216 23 598 3,315 269 103 2,543 14 7,0811982 138 56 386 2,429 342 260 1,553 8 5,1721983 211 64 253 3,551 384 225 2,435 20 7,1431984 206 51 301 3,189 467 208 2,380 19 6,8211985 187 37 216 2,383 372 168 2,613 12 5,9881986 106 17 178 3,095 299 149 1,991 5 5,8401987 113 29 133 2,529 358 120 1,942 5 5,2291988 117 48 171 1,779 531 78 2,497 11 5,2321989 74 52 152 2,018 492 153 2,805 6 5,7521990 101 33 180 2,614 395 172 4,130 6 7,6311991 153 69 220 1,674 370 139 3,231 3 5,8591992 96 95 182 1,776 330 153 2,655 7 5,2941993 87 294 97 218 2,223 357 140 3,602 5 7,0231994 93 293 79 211 2,497 456 151 3,350 11 7,1411995 154 393 118 211 2,408 331 143 3,707 6 7,4711996 91 382 82 166 2,744 355 169 3,356 9 7,3541997 67 452 68 124 2,386 264 178 4,515 10 8,0641998 96 480 43 155 2,785 345 237 4,022 10 8,1731999 133 533 60 204 2,444 375 173 2,699 8 6,6292000 192 430 64 160 2,481 223 209 3,180 11 6,9502001 202 555 72 173 2,934 391 145 3,554 13 8,0392002 175 517 85 166 2,407 237 144 4,037 15 7,783
2003 2 236 495 60 244 2,271 64 114 4,821 10 8,3152004 2 315 539 93 252 2,491 265 79 5,121 16 9,1712005 2 280 274 90 233 3,370 259 165 5,383 24 10,0782006 2 144 445 71 245 3,272 243 144 5,531 25 10,1202007 2 158 255 82 241 3,145 166 57 5,685 19 9,8082008 2 191 283 84 239 2,815 255 64 6,338 24 10,2932009 2 159 213 50 286 3,546 371 63 3,179 67 7,9342010 2 302 182 93 192 3,474 332 52 4,187 29 8,8432011 2 138 449 95 206 3,733 418 44 2,712 41 7,836
AVERAGES:
1975-79 217 65 812 3,070 242 71 2,461 20 6,9571980-89 158 43 301 2,768 379 162 2,320 11 6,1421990-99 107 404 74 187 2,355 358 166 3,527 8 7,0642000-09 205 401 75 224 2,873 247 118 4,683 22 8,8491975-2010 169 390 65 316 2,744 316 135 3,383 15 7,338
¹ Those permittees reporting hunting cranes 1 or more times K.L. Kruse 06/13/12
² Preliminary

Table 4. Season dates (month/day) for the hunting of sandhill cranes in the Central Flyway states.
YR CO KS MT¹ MT² NM ND¹ ND² OK SD TX¹ TX² TX³ WY1960 - - - - 01/01-01/30 - - - - - - - -1961 - - - - 11/04-12/03 - - - - 11/04-12/03 - - -1962 - - - - 11/03-12/02 - - - - 11/03-12/02 - - -1963 - - - - 11/02-12/01 - - - - 11/02-12/01 - - -1964 - - - - 10/31-11/29 - - - - 10/31-11/29 - - -1965 - - - - 10/30-11/28 - - - - 10/30-11/28 - - -1966 - - - - 10/29-11/27 - - - - 10/29-11/27 - - -1967 10/01-10/30 - - - 11/04-01/02 - - - - 11/04-01/02 - - -1968 10/01-10/30 - - - 11/02-12/28 11/09-12/08 - 12/14-01/02 11/09-12/08 11/02-12/28 12/14-01/02 - -1969 10/04-11/02 - - - 11/01-12/28 11/08-12/07 - 12/13-01/11 11/08-12/07 11/01-12/28 12/13-01/11 - -
1970 10/03-11/01 - - - 10/31-01/10 11/14-12/13 - 12/05-01/10 11/14-12/13 10/31-01/10 12/05-01/10 - -1971 10/02-11/07 - - - 10/30-01/30 11/13-12/02 - 12/04-01/30 11/13-12/02 10/30-01/30 12/04-01/30 - -1972 10/01-11/05 - 10/01-11/06 - 11/03-01/31 11/11-12/10 - 12/02-01/28 11/11-12/10 10/28-01/28 12/02-01/28 - 10/07-11/051973 10/01-11/05 - 09/29-11/04 - 10/27-01/27 11/10-12/09 - 12/01-01/27 11/10-12/09 10/27-01/27 12/01-01/27 - 10/13-11/111974 10/01-11/05 - 09/28-11/03 - 10/26-01/26 11/09-12/08 - 11/30-01/26 11/09-12/08 10/26-01/26 11/30-01/26 - 10/12-11/101975 10/04-11/08 - 10/04-11/09 - 10/25-01/25 11/08-12/07 - 11/29-01/25 11/08-12/07 10/25-01/25 11/29-01/25 - 10/11-11/091976 10/02-11/06 - 10/02-11/07 - 10/30-01/30 11/06-12/05 - 11/27-01/23 11/06-12/05 10/30-01/30 12/04-01/30 - 10/09-11/071977 10/01-11/06 - 10/01-11/06 - 10/29-01/29 09/07-09/11 - 11/26-01/22 09/07-09/11 11/01-01/31 12/05-01/31 - 10/08-11/061978 09/30-11/05 - 09/30-11/05 - 10/28-01/28 09/07-09/11 - 11/25-01/21 09/07-09/11 10/31-01/31 12/05-01/31 - 10/07-11/051979 10/13-11/18 - 09/29-11/04 - 10/27-01/27 09/07-09/11 - 11/24-01/20 09/07-09/11 10/30-01/30 12/04-01/30 - 10/13-11/18
1980 10/11-11/16 - 10/04-11/09 - 10/30-01/31 09/06-09/14 09/06-09/10 11/22-01/18 09/20-09/28 10/31-01/31 12/05-01/31 - 10/11-11/161981 10/10-11/15 - 10/03-11/08 - 10/31-01/31 09/05-09/20 09/05-09/13 11/22-01/18 09/20-09/28 10/31-01/31 12/05-01/31 - 10/03-11/081982 10/02-11/28 - 10/02-11/28 - 10/31-01/31 09/04-09/19 09/04-09/12 10/23-01/23 10/02-11/11 10/30-01/30 12/04-01/30 - 09/25-11/211983 10/01-11/27 - 11/01-11/27 11/01-11/27 10/29-01/28 09/10-11/06 09/10-09/30 10/22-01/22 10/01-11/06 11/12-02/12 12/03-02/12 01/14-02/12 09/24-11/201984 09/29-11/25 - 09/29-11/25 11/01-11/25 10/27-01/27 09/08-11/04 09/08-09/28 10/13-01/13 09/29-11/04 11/10-02/10 12/01-02/10 01/12-02/10 09/22-11/181985 09/28-11/24 - 09/28-11/24 11/01-11/24 10/26-01/26 09/07-11/03 09/07-09/27 10/12-01/12 09/28-11/03 11/09-02/09 11/30-02/09 01/11-02/09 09/21-11/171986 10/04-11/30 - 10/04-11/30 11/01-11/30 10/25-01/25 09/06-11/02 09/06-10/03 10/11-01/11 09/28-11/02 11/08-02/08 11/29-02/08 01/03-02/08 09/20-11/161987 10/03-11/29 - 10/03-11/29 10/03-11/29 10/24-01/24 09/05-11/01 09/05-10/02 10/10-01/17 09/26-11/01 11/14-02/14 11/28-02/07 01/02-02/07 09/19-11/151988 10/01-11/27 - 10/01-11/27 10/01-11/27 10/22-01/22 09/10-11/06 09/10-09/30 10/22-01/22 09/24-10/30 11/12-02/12 11/26-02/05 01/07-02/12 09/17-11/131989 09/30-11/26 - 09/30-11/26 09/30-11/26 10/21-01/21 09/09-11/05 09/09-09/29 10/21-01/21 09/30-11/05 11/11-02/11 12/02-02/11 01/06-02/11 09/16-11/12
1990 09/29-11/25 - 09/29-11/25 09/29-11/25 10/20-01/20 09/08-11/04 09/08-10/14 10/20-01/20 09/29-11/04 11/10-02/10 12/01-02/10 01/05-02/10 09/15-11/111991 09/28-11/24 - 09/28-11/24 09/28-11/24 10/19-01/19 09/07-11/03 09/07-10/13 10/19-01/19 09/28-11/03 11/09-02/09 12/07-02/09 01/04-02/09 09/15-11/111992 10/03-11/29 - 09/26-11/22 09/26-11/22 10/17-01/17 09/05-11/01 09/05-10/11 10/17-01/17 09/26-11/01 11/14-02/14 12/05-02/14 01/02-02/07 09/15-11/111993 10/02-11/28 11/06-01/02 09/25-11/21 09/25-11/21 10/16-01/16 09/11-11/07 09/11-11/07 10/16-01/16 09/25-10/31 11/13-02/13 12/04-02/13 01/08-02/13 09/15-11/111994 10/01-11/27 11/05-01/01 09/24-11/20 09/24-11/20 10/15-01/15 09/10-11/06 09/10-11/06 10/15-01/15 09/24-10/30 11/12-02/12 12/03-02/12 01/07-02/12 09/15-11/111995 09/30-11/26 11/05-01/01 09/23-11/19 09/23-11/19 10/31-01/31 09/09-11/05 09/09-11/05 10/22-01/28 09/23-11/19 11/11-02/11 12/02-02/11 01/06-02/11 09/14-11/101996 10/05-12/01 11/02-12/29 09/28-11/24 09/28-11/24 10/31-01/31 09/07-11/03 09/07-11/03 10/26-01/26 09/28-11/24 11/09-02/09 11/30-02/09 01/04-02/09 09/14-11/101997 10/04-11/30 11/01-12/28 10/04-11/30 10/04-11/30 10/31-01/31 09/06-11/02 09/06-11/02 10/25-01/25 09/27-11/23 11/08-02/08 11/29-02/08 01/03-02/08 09/13-11/091998 10/03-11/29 11/07-01/03 10/03-11/29 09/12-09/20 10/31-01/31 09/05-11/01 09/05-11/01 10/24-01/24 09/26-11/22 11/07-02/07 11/28-02/07 01/02-02/07 09/12-11/081999 10/02-11/28 11/06-01/02 10/02-11/28 09/11-09/19 10/30-01/30 09/11-11/07 09/11-11/07 10/30-01/30 09/25-11/21 11/13-02/13 12/04-02/13 01/08-02/13 09/11-11/07
2000 10/07-12/03 11/04-12/31 09/30-11/26 09/09-09/17 10/31-01/31 09/16-11/12 09/16-11/12 11/04-02/04 09/23-11/19 11/11-02/11 12/02-02/11 12/30-02/04 09/09-11/052001 10/07-12/03 11/03-12/30 09/29-11/25 09/08-09/16 10/31-01/31 09/15-11/11 09/15-10/21 11/03-02/03 09/22-11/18 11/10-02/10 12/01-02/10 12/29-01/20 09/15-11/112002 10/05-12/01 11/02-12/29 09/28-11/24 09/07-09/15 10/31-01/31 09/21-11/17 09/21-10/27 11/09-02/09 09/21-11/17 11/09-02/09 11/30-02/09 12/21-01/19 09/14-11/102003 10/04-11/30 11/01-12/28 09/27-11/23 09/06-09/14 10/31-01/31 09/20-11/16 09/20-10/26 10/25-01/25 09/27-11/23 11/01-02/01 11/22-02/01 12/20-01/18 09/13-11/092004 10/02-11/28 11/06-01/02 09/25-11/21 09/11-09/19 10/31-01/31 09/18-11/14 09/18-10/24 10/30-01/30 09/25-11/21 11/06-02/01 11/27-02/01 12/18-01/16 09/18-11/142005 10/01-11/27 11/09-01/05 09/24-11/20 09/10-09/18 10/31-01/31 09/17-11/13 09/17-10/23 10/29-01/29 09/24-11/20 11/05-02/05 11/26-02/05 12/24-01/29 09/17-11/132006 09/30-11/26 11/08-01/04 09/23-11/19 09/09-09/17 10/31-01/31 09/16-11/12 09/16-10/22 10/28-01/28 09/23-11/19 11/04-02/04 11/24-02/04 12/23-01/28 09/16-11/122007 10/02-12/02 11/07-01/03 09/22-11/18 09/08-09/16 10/31-01/31 09/15-11/11 09/15-10/21 10/27-01/27 09/22-11/18 11/04-02/04 11/24-02/04 12/23-01/28 09/15-11/112008 10/04-11/30 11/05-01/01 09/27-11/23 09/06-09/21 10/31-01/31 09/20-11/16 09/20-10/26 10/25-01/25 09/27-11/23 11/08-02/08 11/28-02/08 12/20-01/25 09/13-11/092009 10/03-11/29 11/11-01/07 09/26-11/22 09/05-09/20 10/31-01/31 09/19-11/15 09/19-10/25 10/24-01/24 09/26-11/22 11/07-02/07 11/27-02/07 12/19-01/24 09/19-11/152010 10/02-11/28 11/10-01/06 09/25-11/21 09/11-09/26 10/31-01/31 09/18-11/14 09/18-10/24 10/23-01/23 09/25-11/21 11/06-02/06 11/26-02/06 12/18-01/23 09/18-11/142011 10/01-11/27 11/09-01/05 09/24-11/20 09/10-09/25 10/31-01/31 09/17-11/13 09/17-10/23 10/22-01/22 09/24-11/20 11/05-02/05 11/25-02/05 12/24-01/29 09/17-11/13
MT¹ Central Flyway portion of MT, except that area south of I-90 and west of the Bighorn River and Sheridan Co. ND¹ Area 1, ND. TX¹ Area A, TX TX³ Area C, TX MT² Sheridan County, MT. ND² Area 2, ND. TX² Area B, TX
K.L. Kruse S:\CF_D\projects\speciesandpopulations\sandhillcranes\Status Reports\Shcranerep.xls

Table 5. Estimated retrieved harvests of Mid-Continent sandhill cranes in the U.S.
CENTRAL U.S.YR CO KS MT NM ND OK SD TX WY FLYWAY AZ 4 NM 4 AK ² ³ MN 5 TOTAL TOTAL
1975 91 16 911 2,122 142 86 6,123 6 9,497 1,094 1,094 10,5911976 106 29 858 52 200 12 6,122 14 7,393 637 637 8,0301977 39 18 1,456 4,078 410 47 6,094 9 12,151 471 471 12,6221978 106 36 1,089 2,777 389 19 5,720 10 10,146 239 239 10,3851979 129 14 1,170 2,733 397 19 5,917 0 10,379 517 517 10,896
1980 68 16 1,019 2,245 363 130 6,305 6 10,152 809 809 10,9611981 92 11 907 2,395 397 78 6,245 9 10,134 20 383 403 10,5371982 49 21 335 2,469 535 212 4,295 0 7,916 62 1,160 1,222 9,1381983 70 28 354 6,471 373 177 5,471 15 12,959 17 1,540 1,557 14,5161984 85 15 414 4,367 433 139 5,811 7 11,271 23 1,986 2,009 13,2801985 82 7 334 4,650 416 101 7,184 2 12,776 48 1,197 1,245 14,0211986 33 1 250 6,563 392 99 5,149 0 12,487 108 184 539 831 13,3181987 86 15 159 5,334 957 99 6,117 3 12,770 127 318 836 1,281 14,0511988 68 18 372 3,815 1,061 100 7,330 8 12,772 172 127 1,241 1,540 14,3121989 25 33 319 4,656 1,003 194 7,400 9 13,639 126 138 545 809 14,448
1990 87 44 377 6,804 698 165 9,865 1 18,041 114 259 918 1,291 19,3321991 224 31 593 4,580 604 128 6,916 3 13,079 172 235 677 1,084 14,1631992 84 103 505 4,654 478 141 6,455 13 12,433 139 54 640 833 13,2661993 112 602 95 506 6,985 826 110 8,769 0 18,005 113 178 201 492 18,4971994 143 767 56 357 6,235 1,167 239 7,233 4 16,201 86 153 648 887 17,0881995 208 990 156 673 7,017 1,091 170 10,322 1 20,628 124 111 812 1,047 21,6751996 91 933 58 332 6,639 1,066 166 7,816 10 17,111 114 78 1,205 1,397 18,5081997 168 1,167 45 248 6,545 600 189 10,800 4 19,766 171 45 870 1,086 20,8521998 64 1,362 17 258 7,967 645 454 9,054 10 19,831 114 55 1,042 1,211 21,0421999 56 1,275 29 321 5,748 879 184 8,469 8 16,969 92 101 NA* 193 17,162
2000 363 590 15 311 5,081 552 374 8,208 10 15,504 166 100 985 1,251 16,7552001 257 1,033 43 297 5,173 713 478 6,999 7 15,000 154 106 936 1,196 16,1962002 294 1,067 23 342 2,852 490 160 7,837 22 13,087 197 92 844 1,133 14,220
2003 1 230 942 49 617 4,564 200 166 11,560 7 18,335 155 162 331 648 18,9832004 1 92 856 54 350 3,967 441 67 8,715 4 14,546 192 167 435 794 15,3402005 1 265 471 65 578 3,721 511 190 12,446 16 18,263 227 175 388 790 19,0532006 1 96 1,341 12 682 3,906 538 202 10,834 20 17,631 201 245 314 760 18,3912007 1 149 516 51 427 4,501 272 163 12,511 20 18,610 268 331 596 1,195 19,8052008 1 32 453 73 483 4,179 493 83 17,169 24 22,989 138 329 1,249 1,716 24,7052009 1 58 447 34 584 4,436 737 96 8,882 8 15,282 305 332 245 882 16,1642010 1 115 293 95 432 4,752 940 91 12,069 25 18,812 253 421 1,204 830 2,708 21,5202011 1 68 908 51 297 3,733 808 64 8,493 20 14,442 151 366 335 765 1,617 16,059
AVERAGES:
1975-79 94 23 1,097 2,352 308 37 5,995 8 9,913 592 592 10,5051980-89 66 17 446 4,297 593 133 6,131 6 11,688 78 192 1,024 1,171 12,8581990-99 124 1,014 63 417 6,317 805 195 8,570 5 17,206 124 127 779 952 18,1592000-09 184 772 42 467 4,238 495 198 10,516 14 16,925 200 204 632 1,037 17,9611975-2010 120 839 40 534 4,584 595 154 8,173 9 14,627 140 180 792 1,035 15,662
CURRENT YEAR PERCENT CHANGE FROM:
2010 -41% 210% -46% -31% -21% -14% -30% -30% -20% -23% -40% -13% -72% -8% -40% -25%1975-79 -28% 126% -73% 59% 163% 75% 42% 156% 46% -43% 173% 53%1980-89 3% 209% -33% -13% 36% -52% 39% 239% 24% 93% 91% -67% 38% 25%1990-99 -45% -10% -20% -29% -41% 0% -67% -1% 270% -16% 22% 188% -57% 70% -12%2000-09 -63% 18% 22% -36% -12% 63% -68% -19% 45% -15% -25% 79% -47% 56% -11%1975-2010 -43% 8% 29% -44% -19% 36% -58% 4% 129% -1% 8% 104% -58% 56% 3%¹ Preliminary K.L. Kruse S:\CF_D\projects\speciesandpopulations\sandhillcranes\Status Reports\Shcranerep.xls 06/13/12
² A proportion of the Alaskan harvest is composed of lesser sandhill cranes from the Pacific Coast Population³ Harvest data are from state harvest surveys for only the MCP portion of the state, except in 1977-81, 1986, 1991, and 1998-99 where federal MQS state totals are prorated by the long-term percent MC cranes; data from 2000 forward are MC portion from HIP.4 The MC harvest for AZ and NM represents MC sandhill cranes that were harvested in RMP areas and are not represented in the CF MC Sandhill Crane Federal Harvest Survey5 Minnesota initiated a hunt in the NW portion of state.* No estimate is available.
OTHER SURVEY AREAS

Table 6. Estimated retrieved harvests of Mid-Continent sandhill cranes in Canada.
YEAR MB SK TOTAL
1971 228 2,715 2,9431972 113 2,030 2,1431973 683 3,592 4,2751974 58 6,641 6,6991975 162 5,744 5,9061976 209 1,427 1,6361977 367 N/A 3671978 877 N/A 8771979 978 2,821 3,799
1980 891 4,698 5,5891981 510 2,456 2,9661982 797 2,037 2,8341983 377 2,711 3,0881984 661 3,042 3,7031985 691 4,448 5,1391986 1,662 4,452 6,1141987 664 4,480 5,1441988 1,958 4,990 6,9481989 2,652 2,323 4,975
1990 1,023 3,812 4,8351991 1,771 3,547 5,3181992 1,221 4,718 5,9391993 482 2,433 2,9151994 544 3,286 3,8301995 1,004 4,823 5,8271996 1,351 2,961 4,3121997 1,279 4,621 5,9001998 889 8,637 9,5261999 1,300 7,100 8,400
2000 805 8,645 9,4502001 1,247 7,539 8,7862002 1,282 6,665 7,9472003 1,474 8,111 9,5852004 1,267 9,770 11,0372005 1,776 8,100 9,8762006 2,688 7,729 10,4172007 3,554 8,232 11,7862008 742 8,697 9,4392009 1,037 3,128 4,1652010 1,051 6,280 7,331
2011 1 9,074
AVERAGES:
1971-79 408 3,567 3,1831980-89 1,086 3,564 4,6501990-99 1,086 4,594 5,6802000-09 1,587 7,662 9,2491971-2010 1,058 4,985 5,794
2010 HARVEST: PERCENT CHANGE FROM:
2009 1% 101% 76%1971-79 157% 76% 130%1980-89 -3% 76% 58%1990-99 -3% 37% 29%2000-09 -34% -18% -21%1971-2010 -1% 26% 27%
1 Harvest data was not available in time for the report so the average from the 2000-2010 harvests was used for 2011.
K.L. Kruse S:\CF_D\projects\speciesandpopulations\sandhillcranes\Status R 06/13/12
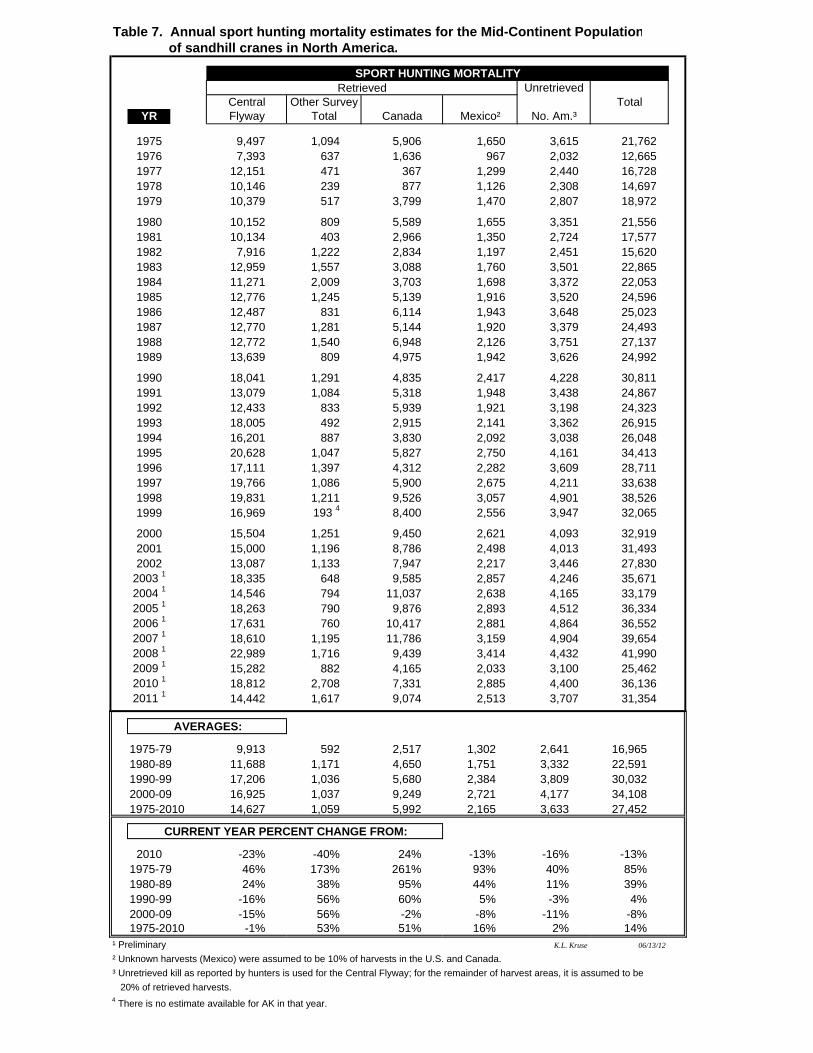
Table 7. Annual sport hunting mortality estimates for the Mid-Continent Population of sandhill cranes in North America.
SPORT HUNTING MORTALITYRetrieved Unretrieved
Central Other Survey TotalYR Flyway Total Canada Mexico² No. Am.³
1975 9,497 1,094 5,906 1,650 3,615 21,7621976 7,393 637 1,636 967 2,032 12,6651977 12,151 471 367 1,299 2,440 16,7281978 10,146 239 877 1,126 2,308 14,6971979 10,379 517 3,799 1,470 2,807 18,972
1980 10,152 809 5,589 1,655 3,351 21,5561981 10,134 403 2,966 1,350 2,724 17,5771982 7,916 1,222 2,834 1,197 2,451 15,6201983 12,959 1,557 3,088 1,760 3,501 22,8651984 11,271 2,009 3,703 1,698 3,372 22,0531985 12,776 1,245 5,139 1,916 3,520 24,5961986 12,487 831 6,114 1,943 3,648 25,0231987 12,770 1,281 5,144 1,920 3,379 24,4931988 12,772 1,540 6,948 2,126 3,751 27,1371989 13,639 809 4,975 1,942 3,626 24,992
1990 18,041 1,291 4,835 2,417 4,228 30,8111991 13,079 1,084 5,318 1,948 3,438 24,8671992 12,433 833 5,939 1,921 3,198 24,3231993 18,005 492 2,915 2,141 3,362 26,9151994 16,201 887 3,830 2,092 3,038 26,0481995 20,628 1,047 5,827 2,750 4,161 34,4131996 17,111 1,397 4,312 2,282 3,609 28,7111997 19,766 1,086 5,900 2,675 4,211 33,6381998 19,831 1,211 9,526 3,057 4,901 38,5261999 16,969 193 4 8,400 2,556 3,947 32,065
2000 15,504 1,251 9,450 2,621 4,093 32,9192001 15,000 1,196 8,786 2,498 4,013 31,4932002 13,087 1,133 7,947 2,217 3,446 27,830
2003 1 18,335 648 9,585 2,857 4,246 35,6712004 1 14,546 794 11,037 2,638 4,165 33,1792005 1 18,263 790 9,876 2,893 4,512 36,3342006 1 17,631 760 10,417 2,881 4,864 36,5522007 1 18,610 1,195 11,786 3,159 4,904 39,6542008 1 22,989 1,716 9,439 3,414 4,432 41,9902009 1 15,282 882 4,165 2,033 3,100 25,4622010 1 18,812 2,708 7,331 2,885 4,400 36,1362011 1 14,442 1,617 9,074 2,513 3,707 31,354
AVERAGES:
1975-79 9,913 592 2,517 1,302 2,641 16,9651980-89 11,688 1,171 4,650 1,751 3,332 22,5911990-99 17,206 1,036 5,680 2,384 3,809 30,0322000-09 16,925 1,037 9,249 2,721 4,177 34,1081975-2010 14,627 1,059 5,992 2,165 3,633 27,452
CURRENT YEAR PERCENT CHANGE FROM:
2010 -23% -40% 24% -13% -16% -13%1975-79 46% 173% 261% 93% 40% 85%1980-89 24% 38% 95% 44% 11% 39%1990-99 -16% 56% 60% 5% -3% 4%2000-09 -15% 56% -2% -8% -11% -8%1975-2010 -1% 53% 51% 16% 2% 14%
¹ Preliminary K.L. Kruse 06/13/12
² Unknown harvests (Mexico) were assumed to be 10% of harvests in the U.S. and Canada.
³ Unretrieved kill as reported by hunters is used for the Central Flyway; for the remainder of harvest areas, it is assumed to be
20% of retrieved harvests.4 There is no estimate available for AK in that year.

Table 8. Estimated retrieved harvests of the Rocky Mountain Population of sandhill cranes.
YR UT NM AZ WY MT ID TOTAL
1981 20 201982 9 143 1521983 35 154 1891984 33 101 1341985 40 138 1781986 23 195 2181987 60 190 2501988 310 40 128 4781989 54 483 51 125 713
1990 35 79 9 58 1811991 48 47 44 101 2401992 147 39 168 42 3961993 28 297 61 115 45 5461994 34 416 27 150 40 6671995 27 270 33 77 41 4481996 32 236 27 84 49 20 4481997 30 114 22 82 62 136 4461998 34 180 37 93 59 135 5381999 54 198 21 124 71 190 658 ¹
2000 69 257 37 163 91 193 810 ²2001 77 288 26 142 87 278 8982002 60 164 42 132 51 194 6432003 57 169 34 72 50 146 5282004 53 189 35 124 51 142 5942005 62 236 50 116 49 189 7022006 87 327 10 194 54 235 9072007 103 276 43 138 73 187 8202008 101 379 24 162 85 185 9362009 149 603 67 195 124 254 1,3922010 190 547 56 182 108 253 1,336
2011 3 154 522 37 166 90 293 1,262
AVERAGES:
1981-89 54 397 35 147 2591990-99 36 198 32 105 51 120 4572000-09 82 289 37 144 72 200 8231981-2010 66 270 35 133 65 182 549
CURRENT YEAR PERCENT CHANGE FROM:
2010 -19% -5% -34% -9% -17% 16% -6%1981-89 32% 7% 13% 387%1990-99 330% 163% 16% 58% 76% 144% 176%2000-09 88% 81% 1% 15% 26% 46% 53%1981-2010 134% 93% 5% 25% 39% 61% 130%
¹ RMP Sandill cranes (40) were also taken as part of research project in the San Luis Valley, CO K.L. Kruse 06/13/12
² RMP Sandill cranes (20) were also taken as part of research project in the San Luis Valley, CO 3
Harvest includes crippling loss.

Table 9. Spring population indices for Rocky Mountain sandhill cranes, 1984-96.
SAN LUIS VALLEY, COLORADORAW ADJ. FOR ADJ. TO OTHER SURVEY
YR COUNT EST. BIAS¹ REM. LES.² AREAS INDEX COND.
1984 10,962 14,488 13,562 550 14,112 POOR1985 18,393 21,773 20,382 0 20,382 GOOD1986 14,031 14,031 13,135 20 13,155 POOR1987 13,561 15,661 14,660 0 14,660 POOR1988 17,510 17,510 16,381 22 16,403 POOR1989 17,302 18,389 17,004 0 17,004 GOOD1990 20,851 24,593 21,221 275 21,496 GOOD1991 19,990 18,405 16,045 175 16,220 GOOD1992 23,516 23,516 19,999 9 20,008 GROUND1993 17,576 17,576 16,478 1,260 17,738 POOR1994 17,229 16,036 15,063 203 15,266 FAIR1995 25,276 23,390 20,229 0 20,229 GOOD1996 23,019 26,379 22,737 1,010 23,747 GOOD
¹ Raw estimate adjusted by photography for estimation bias² Population estimate adjusted to remove the number of lesser sandhill cranes (non-RMP cranes).
Table 10. Fall pre-migration population indices for Rocky Mountain sandhill cranes.
YR UT CO ID WY MT TOTAL 3-YR AVG
1987 1,578 1,443 10,686 2,327 1,447 17,481
1992 2,810 3,181 5,801 2,248 5,264 19,304
1995 1,528 2,284 6,864 1,671 3,681 16,028
1996 1,849 1,255 8,334 2,526 2,974 16,93819971, 2 2,450 1,604 8,132 2,255 3,595 18,036 17,001
1998 2,185 1,273 8,067 3,162 3,415 18,102 17,692
1999 2,292 1,102 8,761 4,205 3,141 19,501 18,546
2000 2,416 749 9,337 3,890 3,598 19,990 19,198
2001 1,522 666 7,160 2,626 4,585 16,559 18,683
2002 1,869 1,355 7,698 3,038 4,843 18,803 18,451
2003 2,546 745 7,822 3,446 4,964 19,523 18,295
2004 2,239 1,410 7,152 3,072 4,637 18,510 18,945
2005 2,646 1,052 7,668 3,911 5,588 20,865 19,6332006 3 NS 19,6332007 4 2,401 1,743 8,262 3,907 6,509 22,822 20,7322008 5 3,708 1,080 6,123 3,826 6,419 21,156 21,614
2009 2,283 1,162 6,934 3,613 6,329 20,321 21,433
2010 3,242 985 5,776 3,726 7,335 21,064 20,847
2011 1,498 1,347 5,029 2,978 6,642 17,494 19,6261 Incomplete survey efforts in years prior might have resulted in lower estimates; the official count begins in 1997. 06/13/122 In October 1997, a special survey was also conducted in the SLV, Colorado and other areas, which resulted in a total
of 27,090 Rocky Mountain and Mid-Continent cranes being counted.3 In 2006, the survey was not conducted due to mechanical issues with the survey plane. The 3-yr Avg for 2006 is calculated using 2003-05.4 The 3-yr average for 2007 was calculated using 2004, 2005, and 2007 because there was no survey in 2006.5 The 3-yr average for 2008 was calculated using 2005, 2007, and 2008 because there was no survey in 2006.

Table 11. Winter counts of Lower Colorado River Valley Population of sandhill cranes in Arizona and California.
YRCibola NWR
Colorado River Indian Tribe
Salton Sea NWR
Gila River TOTAL 3-YR AVG
1998 775 596 351 178 1,9001999 1,200 511 325 163 2,1992000 820 1,259 235 252 2,566 2,2222001 961 952 350 134 2,397 2,3872002 1,003 168 417 52 1,640 2,2012003 1,200 455 430 0 2,085 2,0412004 1,341 354 521 312 2,528 2,0842005 1,513 457 476 191 2,637 2,4172006 1,141 673 493 360 2,667 2,6112007 2,322 809 295 450 3,876 3,0602008 1 115 NS 687 413 1,215 3,0602009 2 289 1216 603 293 2,401 2,9812010 3 266 729 904 365 2,264 2,8472011 553 636 899 327 2,415 2,3602012 1,097 474 924 151 2,646 2,442
NS = No survey was conducted. 06/13/121 In 2008, the survey was not complete. The 3-YR average for that year was calculated using 2005-07.2 In 2009, the 3-YR average was calculated with 2006, 2007 and 2009 due to an incomplete survey in 2008.3 In 2010, the 3-YR average was calculated with 2007, 2009, and 2010 due to an incomplete survey in 2008.
S:\CF_D\projects\speciesandpopulations\sandhillcranes\Status Reports\Shcranerep.xls

Table 12. Fall index survey for Eastern Population of sandhill cranes.
YR TOTAL 3-YR AVG
1979 14,385
1980 15,808
1981 11,943 14,045
1982 13,879 13,877
1983 14,898 13,573
1984 16,363 15,047
1985 16,170 15,810
1986 17,043 16,525
1987 22,342 18,518
1988 16,086 18,490
1989 22,785 20,404
1990 23,852 20,908
1991 26,156 24,264
1992 26,656 25,555
1993 26,187 26,333
1994 26,783 26,542
1995 33,774 28,915
1996 29,753 30,103
1997 29,448 30,992
1998 37,827 32,343
1999 33,583 33,619
2000 33,105 34,838 2001 1 NS 34,838 2002 2 31,575 32,754 2003 3 29,300 31,327
2004 28,947 29,941
2005 37,708 31,985
2006 37,529 34,728
2007 35,945 37,061
2008 44,110 39,195
2009 59,876 46,644
2010 49,666 51,217
2011 72,233 60,592
NS = No survey conducted 06/13/121 In 2001, the survey was not conducted. The 3-YR average for that year was calculated using 1998-2000.2 In 2002, the 3-YR average was calculated with 1999, 2000 and 2002 since the survey was not conducted in 2001.3 In 2003, the 3-YR average was calculated with 2000, 2002 and 2003 since the survey was not conducted in 2001.

U.S. Fish and Wildlife Service Division of Migratory Bird Management Central Flyway RepresentativeP.O. Box 25486, DFC Denver, Colorado 80225