san mateo county climate action plan - smcgov.org€¦ · san mateo county is a unique combination...
TRANSCRIPT
San Mateo County Climate Action Plan
Climate Change
Vulnerability Assessment
Final
Prepared by ICLEI For
San Mateo County December 2011

2
TABLE OF CONTENTS
Section 1. Introduction ............................................................................................................................. 3 1.1. The Time to Plan for Climate Change ............................................................................................. 3 1.2. Planning Process and Anticipated Outcomes................................................................................... 4 1.3. The Role of the Vulnerability Assessment ...................................................................................... 5
Section 2. Climate Change Scenarios and Impacts .................................................................................. 6 2.1. Global Climate Change Overview ................................................................................................... 6 2.2. Creating Future Climate Change Projections ................................................................................... 6 2.3. Creating Regional Climate Change Scenarios ................................................................................. 7 2.4. Additional Climate Change Factors ................................................................................................. 7
2.4.1. Mathematics of Averages ................................................................................................... 8 2.4.2. Timing of Climate Change.................................................................................................. 8 2.4.3. Climate Conditions Interacting ........................................................................................... 9 2.4.4. The Web of Impacts ............................................................................................................ 9
2.5. Climate Projections for the San Mateo County Region ................................................................. 10 2.5.1. Temperature ...................................................................................................................... 11 2.5.2. Precipitation ...................................................................................................................... 11 2.5.3. Sea Level Rise .................................................................................................................. 11
Section 3. Vulnerability Assessment ...................................................................................................... 12 3.1. Assessment Approach .................................................................................................................... 12
3.1.1. Exposure ........................................................................................................................... 13 3.1.2. Sensitivity ......................................................................................................................... 13 3.1.3. Adaptive Capacity ............................................................................................................. 13 3.1.4. Timing ............................................................................................................................... 14
3.2. Summary Vulnerability Findings ................................................................................................... 14 3.2.1. Key Interactions and Intersections .................................................................................... 14 3.2.2. Agriculture / Silviculture .................................................................................................. 15 3.2.3. Built Environment in the Coastal Zone ............................................................................ 15 3.2.4. Coastal Ecosystems ........................................................................................................... 16 3.2.5. Fire Threatened Areas ....................................................................................................... 17 3.2.6. Public Health..................................................................................................................... 18 3.2.7. Water and Wastewater Infrastructure ............................................................................... 19 3.2.8. Exposures Requiring More Research ................................................................................ 20 3.2.9. Additional Exposures Identified ....................................................................................... 20
Section 4. Conclusion and Next Steps ................................................................................................... 21 References ................................................................................................................................................... 22 Appendix I. Climate Change Summaries by Focus Area ........................................................................... 23 Appendix II. Complete Vulnerability Assessment Responses .................................................................... 37
3
Section 1. Introduction
1.1. The Time to Plan for Climate Change
San Mateo County is a unique combination of open space and urban centers in Northern California. The County has long been known for its remarkable and dramatic landscapes, economic prowess, and prestigious academic institutions. While the County’s growth and status as an economic center is projected to continue for the foreseeable future, real threats to this status are posed by the impacts of climate change to the social, economic, and environmental well-being of San Mateo County.
The County faces threats from the three primary climate change conditions – rising temperatures, accelerated sea level rise and changing precipitation patterns – as well as from the complex interactions that result from these changes. Impacts to public health from increases in temperature could be dramatic. For example, in July of 2006 there was a two-week heat wave that impacted most of California with 140 deaths directly attributable to heat exposure. The County’s infrastructure and natural environment also face serious risks from the impacts of sea level rise, which is projected to rise between 10 and 17 inches by 2050 and between 31 and 69 inches by 2100.1 A high-range 2100 100-year flood scenario threatens $98.5 billion in property and 480,000 people in the state of California, 115,900 of whom are San Mateo County residents.2 Finally, there are serious impacts from projected declines in water supply and increased incidences of wildfires that are likely to affect the County.3
Climate change adaptation is a process in which a community evaluates climate-related impacts and vulnerabilities and identifies ways to reduce those vulnerabilities and build community resilience. There are a number of general reasons why climate change adaptation is a smart planning approach. Provided below are some of the most compelling reasons for San Mateo County to move forward with climate change adaptation:
1. The climate has already changed and future changes are highly certain.4 These changes have serious direct and indirect impacts on communities that advanced planning can address.
2. Climate change poses a threat to existing community priorities and affects a local government’s ability to deliver on its existing commitments. For example, many local governments are committed to providing safe public open spaces for citizens; however, if current stormwater standards are used for future conditions, local governments may be unable to achieve this established goal.
3. Local officials are making major development decisions today that will have long legacies; therefore, today’s choices will influence tomorrow’s vulnerabilities. Infrastructure designed and built today could be expected to have a useful life of between 30 and 100 years depending on materials. Homes permitted and built today are often expected to last 50 to 80 years. Siting, design, and construction decisions need to take into account not only current risk of adverse impacts, but future risk as influenced by climate change.
1 State of California, Climate Action Team, 2010. 2 Heberger, 2009 3 State of California, Cal-Adapt.org, 2010. 4 Hansen, 2005

4
Figure 1: Five Milestones for Climate Adaptation planning framework (from ICLEI-USA’s Climate Resilient Communities™
4. Planning now can save money, while inaction now will lead to higher costs in the future. Paying for effective preventive action upfront can avoid more significant costs in the future. For example, it has been found that one dollar of hazard mitigation can prevent the expenditure of as much as four dollars of post-disaster reconstruction.5 This principle also extends to reducing the future costs of incremental climate change impacts.6
5. Planning for uncertainty and future variability is not a new process, and can be integrated into current planning frameworks. Many local governments create long-term plans such as comprehensive or master plans that establish a future vision for their communities while dealing with uncertainties in population growth and economic trends. While there will always be uncertainty about the precise ways in which climate change will impact specific communities, local governments can make informed decisions about how to adapt based on the best available information and integrate these choices into existing planning efforts.7
6. Adaptation can have co-benefits for climate change mitigation and local sustainability efforts that a local government already may have adopted. Some actions can achieve greenhouse gas emissions reductions while at the same time helping cities adapt to expected climate change. Energy efficiency, for example, is a common strategy to reduce greenhouse gas (GHG) emissions; it can also increase a city’s energy security – including the capacity to cope with future climate impacts to the energy sector – by decreasing electricity consumption and thereby reducing vulnerability to grid overload and outages.
Given these known threats and anticipated benefits, the San Mateo County Planning and Building Department has initiated a planning process that will result in a Climate Action Plan that can guide the County toward a more resilient future.
1.2. Planning Process and Anticipated Outcomes
San Mateo County recently received a grant from the federal government to enable the County to complete an energy efficiency assessment, a greenhouse gas inventory and a climate change vulnerability assessment. The results of these assessments will inform the County’s development of its first Climate Action Plan (CAP). This work will also result in an update to the County’s General Plan and may result in zoning and subdivision ordinance revisions, or updates and amendments to the Local Coastal Program.
The climate adaptation component of this effort will address the early steps of ICLEI adaptation planning framework, called the Five Milestones of Adaptation. As shown in Figure 1, the Five Milestone framework is a guide that enables local governments to make their communities more resilient in a systematic,
5 GFDRR, 2010. 6 Snover, 2007. 7 Dessler, 2010.

5
transparent way—from understanding the problem, to setting goals, developing policy, implementation, and monitoring. This Vulnerability Assessment is Milestone 1 of the climate change adaptation planning framework. The next step of the project—development of policy recommendations—will address Milestones 2 and 3. Having completed the first three milestones San Mateo County will then be ready to undertake Milestone 4 by implementing the policies. Finally, ICLEI recommends re-evaluating the policies over time and incorporating lessons learned into a new iteration of the Five Milestone process.
1.3. The Role of the Vulnerability Assessment
Generally, a climate change vulnerability assessment is a tool to identify opportunities to make substantive changes today to enhance future resilience. The tool is an analysis that determines the degree to which a system is susceptible to, and unable to accommodate, the adverse effects of climate change including climate variability and extremes. Vulnerability assessments provide information about the nature of the problem that is critical to understand in order to develop effective policy. The assessment informs policymaking in several ways. First, it identifies the functional systems that are likely to be affected by climate change-related impacts, such as buildings, utilities, emergency response, or ecosystems. Second, it enhances understanding of the causes and components of each system’s vulnerabilities, going beyond intuitive assumptions to explicitly identify vulnerable points in the system. Finally, it provides information about the relationships between vulnerabilities of different systems to allow both for prioritization and for a systems approach to policy-making.
A vulnerability assessment includes three primary components – exposure, sensitivity and adaptive capacity – each of which contributes to the overall vulnerability of a functional system. Exposure is a determination of whether the system will experience a specific changing climate condition or impact. Sensitivity is the degree to which the system would be impaired by the impact if it were exposed. Adaptive capacity is the ability of the system to change in order to maintain its primary functions even as it is exposed to an impact. When a system is exposed, with high sensitivity and low adaptive capacity, it is likely to be vulnerable. Application of these concepts and other methods are described in more detail in Section 3.1, Assessment Approach.
This assessment specifically looks at the threats faced by unincorporated portions of the County; however at a high level these threats are shared across jurisdictional lines and in communities within the County. Based on the risk of the impact (a function of likelihood and potential consequences) and the extent of County jurisdiction or influence over the affected system, the following six focus areas were identified for this vulnerability assessment. Detailed vulnerability information for each can be found in Sections 3.2.2 – 3.2.7.
1. Agricultural system considerations including farms and managed timber.
2. Threats to built infrastructure in the coastal zone on both the Bay and the Ocean from sea level rise.
3. Threats to coastal ecosystems on both the Bay and the Ocean from sea level rise.
4. Property and safety threats from an increased incidence of wildfires.
5. Public health threats from increased temperatures.
6. Impacts on water supply.

6
Figure 2: Emissions Scenarios used by the Intergovernmental Panel on Climate Change (IPCC, 2007, p.44).
Section 2. Climate Change Scenarios and Impacts
This section provides a brief climate change background and then describes the basic climate change information that was used as the basis for the vulnerability assessment. It covers summary information for three primary climatic conditions—temperature, precipitation and sea level rise—as well as the associated interactions and effects of these changes. Additional sector-specific information can be found in Appendix I - Climate Change Summaries by Focus Area.
2.1. Global Climate Change Overview
Over the past century, numerous changes in climate—which refers to long term average trends in weather—have been documented globally. To date, the world has seen increases in annual average temperatures, altered precipitation patterns, and sea level rise. Globally, temperatures have increased an average of 1.3°F over the past century, resulting in less snow accumulation in the winter and an earlier arrival of spring in many parts of the world. Sea level has been rising globally at a rate of 0.8 inches per decade or 0.67 feet over the century, another documented impact of the earth’s changing climate. These global climate change trends – increasing temperatures, altered precipitation patterns, and rising sea levels – are expected to continue into the future, and the rate of change is expected to increase.8 2.2. Creating Future Climate Change Projections
When determining future climate conditions globally, scientists rely on global circulation models (GCMs), which are mathematical models that include a wide variety of physical processes such as wind motion, cloudiness, and ocean currents, as well as geographical features such as topography and vegetation. The efficacies of these models are tested by using them to predict past climate conditions (known as hindcasting) and then comparing model outputs with data of past climates. Greenhouse gas (GHG) emissions scenarios are introduced into the climate models to create future climate projections.
The Intergovernmental Panel on Climate Change (IPCC) has developed a suite of GHG emissions scenarios shown in Figure 2. The scenarios factor in variables including population growth, energy use, and societal choices in order to project GHG emissions over the coming century. The scenarios themselves are considered alternative images of how the future might unfold. Probabilities or likelihoods of future occurrence are not assigned.9
Most analyses of changing climatic conditions and associated impacts include, at a minimum, a high- emissions scenario and a low-emissions scenario to create a range of possible future climates. One high emissions scenario shown is the A2 scenario (red), which is based upon a world with high 8 IPCC, 2007 9 Ibid.
7
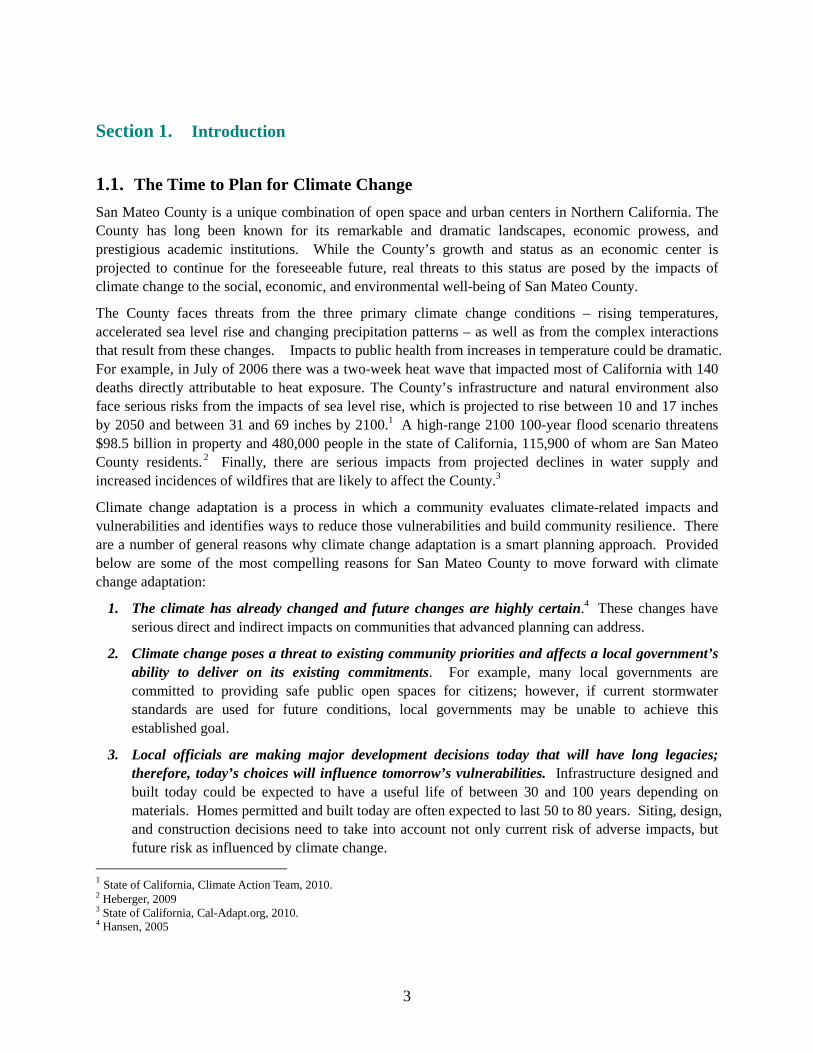
population growth, rapid economic development, and high fossil fuel use. The B1 scenario (dark blue), a low emissions scenario, envisions a population that peaks in mid-century and economic prosperity that is managed in a more sustainable way.10
Because carbon dioxide persists in the atmosphere for about 100 years once emitted, the effects of today’s emissions are “banked” in the atmosphere and will persist through this century, even if aggressive global mitigation action is taken immediately. As a result, climate adaptation will need to be standard practice in local government affairs for the foreseeable future.
2.3. Creating Regional Climate Change Scenarios
Given that regional and local climate conditions can vary significantly from the world wide averages, it is necessary to translate global climate model results into regionally relevant information. In order to make these coarse resolution projections relevant at the regional scale, a modeling process called “downscaling” is used. This assessment utilizes downscaled data obtained from Cal Adapt (cal-adapt.org), a State data clearinghouse that includes results from a wide range of models for temperature, precipitation, sea level, and related impacts.
Another important consideration in using climate change data is uncertainty. Most models produce similar projections for another 25 to 50 years regardless of the emissions scenarios used because there is a lag in the response of the climate system to GHG emissions. In other words, key projected conditions for the next 25 to 50 years are driven by past GHG emissions and will occur regardless of future global GHG emissions reductions. However, there is greater uncertainty in the projected conditions in the later half of the century because of the different GHG emissions scenarios.11 Additionally, communities should be aware of the fact that a new set of emissions scenarios are being developed for the next IPCC assessment in order to reflect that fact that greenhouse gas emissions over the past decade have been at or above the upper range of the scenarios originally created. This assessment is expected to be released in a series of reports between September 2013 and October 2014. While the trajectory of future emissions will always create uncertainty that must be addresses in adaptation planning, trends suggest that planning with the higher-emissions scenarios and more severe climate effects is a reasonable and more risk-averse approach.
2.4. Additional Climate Change Factors
The changing climatic conditions described in Section 2.5, though important in and of themselves, are primarily averages and do not fully address the many subtleties necessary to capture climate change and the future that it can create. Detailed below are four additional factors – mathematics, timing, interactions and impacts – that were integrated into the San Mateo County vulnerability assessment. These factors were captured in the assessment through the exposures identified. For example, the concepts described in section 2.4.1 helped to inform the heat health threats that the public health department identified. These exposures are primarily based on increases in extreme events rather than increases in annual averages.
10 Ibid 11 State of California, 2009

8
Figure 3: Graphic depiction of shifting both mean and variance resulting in increased in extreme events.
2.4.1. Mathematics of Averages
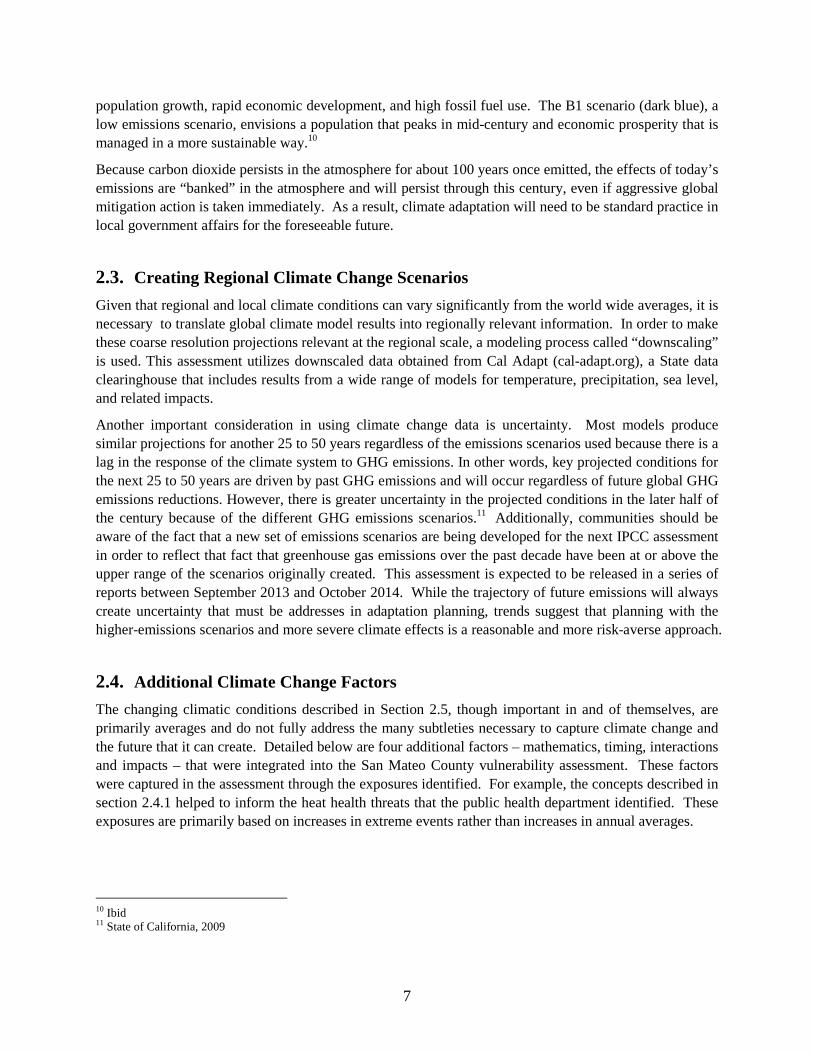
Averages provide a summary and therefore a simpler way of transferring information, but important details can be lost in presenting only averages. Figure 3 shows the details that are lost when simplifying climate change to average trends. The first detail is that when an average increases the entire curve associated with that average shifts. In other words, the extremes also move in the direction of the average. In the case of average temperature increases that means more extreme heat days. The second detail associated with averages is the variability the curve contains. In the case of climate change, scientists also agree that variability will increase. The combined effect of these two changes (as shown in the bottom graphic) is more extreme heat days with less change in cold weather.12
This mathematical concept can and should be applied appropriately to all climate change averages that are presented, meaning that generally more extremes are to be expected with climate change. In the case of this vulnerability assessment extreme events were considered with respect to heat and sea level rise threats.
2.4.2. Timing of Climate Change
There are several timing components that are crucial to consider when understanding climate change. First, although sometimes thought of as a smooth transition from one steady state to another, climate change could happen very abruptly. Environmental systems are highly complex and dynamic, making them very resilient. However, there are tipping points that can cause changes to happen more rapidly than currently projected. Given this complexity, local governments would benefit from greater planning for more extreme contingencies.
Another timing element that must be considered is when a specific changing condition might occur. For example, it is not simply that temperatures will be warmer year round; instead there is both a seasonality and daily component to this change. All simulations used for the California State report show that higher
12 State of California, 2009
9
Figure 4: The complex web of changing climate conditions, their second order interactions and impacts. .
temperatures both in the daytime and nighttime will increase in frequency.13 Given that recent findings indicate that nighttime highs played a critical role in the 2006 heat wave death toll, this finding related to the timing of temperature is critical to understanding climate change vulnerabilities.14
2.4.3. Climate Conditions Interacting
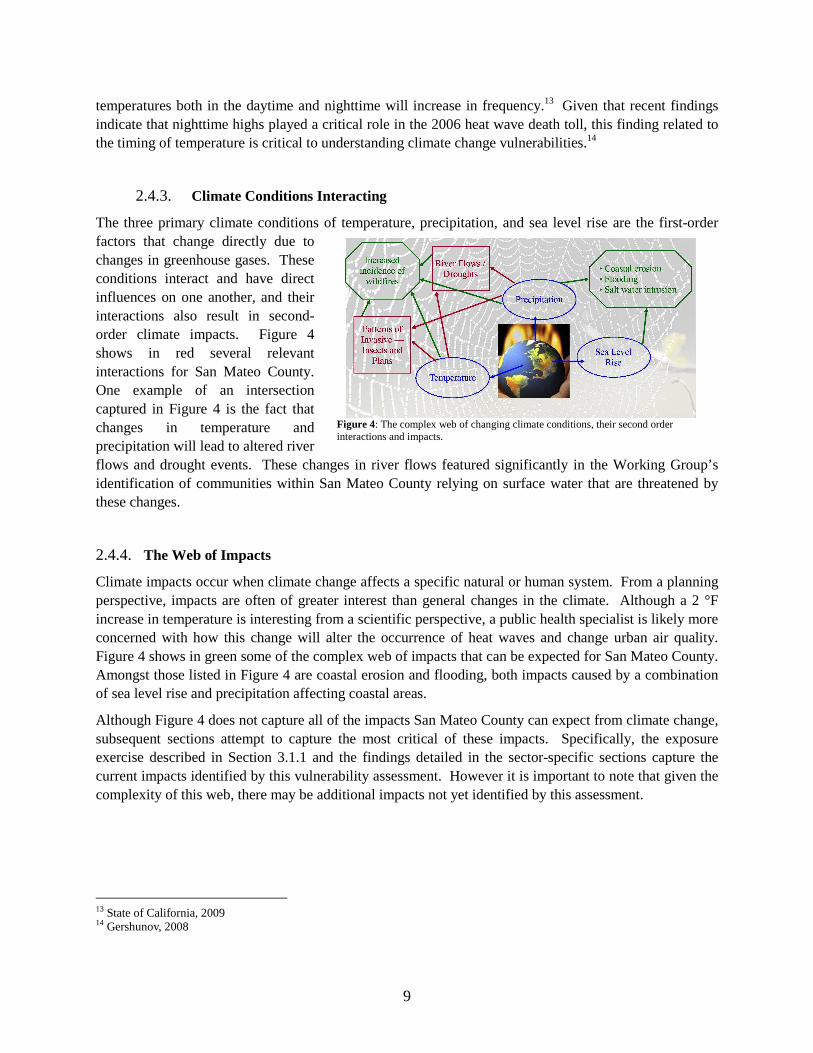
The three primary climate conditions of temperature, precipitation, and sea level rise are the first-order factors that change directly due to changes in greenhouse gases. These conditions interact and have direct influences on one another, and their interactions also result in second-order climate impacts. Figure 4 shows in red several relevant interactions for San Mateo County. One example of an intersection captured in Figure 4 is the fact that changes in temperature and precipitation will lead to altered river flows and drought events. These changes in river flows featured significantly in the Working Group’s identification of communities within San Mateo County relying on surface water that are threatened by these changes.
2.4.4. The Web of Impacts
Climate impacts occur when climate change affects a specific natural or human system. From a planning perspective, impacts are often of greater interest than general changes in the climate. Although a 2 °F increase in temperature is interesting from a scientific perspective, a public health specialist is likely more concerned with how this change will alter the occurrence of heat waves and change urban air quality. Figure 4 shows in green some of the complex web of impacts that can be expected for San Mateo County. Amongst those listed in Figure 4 are coastal erosion and flooding, both impacts caused by a combination of sea level rise and precipitation affecting coastal areas.
Although Figure 4 does not capture all of the impacts San Mateo County can expect from climate change, subsequent sections attempt to capture the most critical of these impacts. Specifically, the exposure exercise described in Section 3.1.1 and the findings detailed in the sector-specific sections capture the current impacts identified by this vulnerability assessment. However it is important to note that given the complexity of this web, there may be additional impacts not yet identified by this assessment.
13 State of California, 2009 14 Gershunov, 2008

10
Near Term (2030)
Medium Term (2050)
Long Term (2100)
Examples of Possible Impacts
Temperature + 1.6 °F + 2.8 °F
● Increased public health threats.
● Increased wildfire incidences.
● Decreases in water availability for drinking, habitats and agriculture.
● Change in fog patterns ● Impacts on species
survival, ranges, and distribution
Precipitation Increased Variability
Increased Variability
● Increases in frequency and magnitude of flooding events and drought events.
● Decreases in water availability for drinking, habitats and agriculture.
● Threat to forest health.
Sea level rise + 5 to 8 inches (avg. 7) above 2000 baseline.
+ 10 to 17 inches (avg. 14) above 2000 baseline.
Low GHG: + 31 – 50 inches (avg. 40) above 2000 baseline. High GHG: + 43 to 69 inches (avg. 55) above 2000 baseline.
● Flooding of homes and civil infrastructure.
● Conversion of dry land to wetland.
● Erosion ● Changes to the water
table – rise and salt water intrusion.
Wildfire15 + 1% + 1 %
● Threats to homes and people.
● Loss of habitat. ● Loss of timber, ag
productivity
2.5. Climate Projections for the San Mateo County Region
Provided below and summarized in Table 1 are projections for the three primary climate conditions – temperature, precipitation and sea level rise – for San Mateo County. In addition to these primary conditions, wildfire projections are provided. For each condition, some general implications are provided; however, sector-specific effects are more thoroughly discussed in Section 3 as well as Appendix I.
Temperature, precipitation and wildfire projections provided are given in near term (202015-2030) and medium term (2050) time frames in order to match with planning frameworks; however, it is important to recognize that changes will continue beyond these dates. Sea level rise projections provided are given in near term (2030), medium term (2050) and long term (2100) time frames in order to better capture the
15 Due to availability of data, the wildfire projections are for 2020 and not 2030.

11
anticipated changes for one of the County’s greatest threats. Most projections are provided as a single value that is based on the average of several different model runs.16
2.5.1. Temperature
Projected temperature increases for San Mateo County are 1.6 °F by 2030 and 2.8 °F by 2050.17 Moreover, generally across the state the models indicate that there will be greater warming in summer than in winter months. Additionally, all models indicate that extreme day and nighttime temperatures will increase in frequency, magnitude and duration.
These increasing temperatures can pose a serious threat to public health. The 2006 heat wave resulted in over 140 deaths in California directly attributable to heat exposure, not accounting for the loss of life that was due to complications of other illnesses exacerbated by heat events. Certain populations—such as the elderly, infants, and young children—are especially vulnerable to these impacts. Higher temperatures can also decrease the water supply through increased evaporation rates and increased irrigation demand. Finally, temperature increases can lead to an increased incidence of wildfires.
2.5.2. Precipitation
Precipitation, unlike temperature and sea level rise, remains difficult to model due to the complexity of factors affecting precipitation patterns. In the case of San Mateo County, it is currently very problematic to decipher precipitation trends related to the average, due to extreme annual variability that is influenced by non-climate change factors. However, a state wide assessment found that California will likely retain its current basic precipitation pattern and will continue to have a high likelihood of drought. Finally, there is a general understanding that precipitation patterns are heading toward increased variability. This variability means that rain events could be more extreme followed by longer periods of drought.18
These changes pose serious threats to San Mateo County in the areas of agriculture, silviculture, water resources and flooding threats. Changing precipitation patterns can mean that the end users can no longer rely on water supply as they have in the past. Additionally, during dry periods the forests are more at risk from wildfires, while wet periods could lead to increased flooding.
2.5.3. Sea Level Rise
As shown in Table 1, the sea level rise projections for the state are an average increase of 7 inches by 2030 and 14 inches by 2050. By 2100, the sea level rise projections are between 31 and 69 inches depending on both the model and the GHG emissions scenario used. As with all climate projections, these figures are not certain; in this case, they are based on research recommended for use by the State of California. As with temperature, it is not simply that sea levels will rise, but also that extreme events will inflict more damage. There will be an increased rate of extreme high sea level events, which occur when high tides coincide with winter storm events and El Nino-Southern Oscillation (ENSO) occurrences.19
16 State of California, 2009 17 Cal-adapt.org 18 State of California, 2009 19 State of California, 2009

12
ENSO is a periodic cycle of higher ocean temperatures and air surface pressure in the tropical Pacific Ocean region that can lead to higher water levels on the west coast of the United States.
Both sea level rise and potential changes in storm events can result in the following five impacts in the coastal zone considered in this assessment.
● Flooding: In areas already prone to flooding, these events are likely to become more frequent and last longer. Additionally, flooding is expected to impact locations that are not currently at risk.
● Inundation: Areas that are not currently within the tidal range will shift to being in the tidal range and will therefore experience frequent or even permanent salt water cover.
● Erosion: Higher water levels cause changes in wave activity which can cause erosion along non-hardened shorelines to increase.
● Water Table Rise: Commonly referred to as the top of the freshwater aquifer, the rise in sea water can cause some freshwater aquifers to rise. This shift reduces the area considered buildable for underground structures such as pipes and basements.
● Salt Water Intrusion: Higher seas can cause salt water to enter into freshwater aquifers, contaminating parts of the aquifer.20
Section 3. Vulnerability Assessment
3.1. Assessment Approach
The San Mateo County vulnerability assessment was conducted as a collaborative effort between ICLEI – Local Governments for Sustainability, PMC, San Mateo County’s Planning and Building Department as well as the San Mateo County Vulnerability Assessment Working Group The Working Group consisted of staff representatives from County departments including Parks and Recreation, Planning, Public Health, and Public Works, as well as external experts and stakeholders including the San Francisco Bay Conservation and Development Commission (BCDC), the California Coastal Commission, CalFIRE, and PG&E. The Working Group provided local data and information needed to create the analysis through email communications as well as five online web meetings, which can be accessed at: http://www.co.sanmateo.ca.us/planning/ rechargesmc/vulnerability.html.
The assessment itself considered four components of vulnerability – exposure, sensitivity, adaptive capacity and timing. The exposure assessment was used to identify key impacts that the County is likely to face. In cases where an impact is identified, sensitivity and adaptive capacity levels will be used to create a vulnerability level based upon the general relationship displayed in Figure 5.
20 http://risingtides.csc.noaa.gov/climateimpacts.html
Figure 5: Vulnerability level based on sensitivity and adaptive capacity.

13
Finally, the potential timing of impacts was used to create an additional screen to determine the County’s greatest current threats.
3.1.1. Exposure
Exposure is a determination of whether the system as a whole or parts of the system will experience a specific changing climate condition. It is often an inventory of the “assets”—people, property, systems, and functions—that could be lost, injured, or damaged due to an impact of climate change.
For the San Mateo County vulnerability assessment the VAWG was asked to provide the exposure information by answering the following three questions:
1. Who or what systems could be impacted?
2. How do weather and / or climate currently affect this system / population and / or location?
3. Describe potential climate change impact
As background, the Working Group had already participated in a climate change webinar and was given the six detailed climate change background documents shown in Appendix 1. The results of the responses were then further discussed amongst the group and finally converted into summary findings that included a description of potential climate change impact and noted local examples. These findings were then used for the sensitivity, adaptive capacity and timing considerations.
3.1.2. Sensitivity
Sensitivity is the degree to which a system would be impaired by the impacts of climate change. Systems that are greatly impaired by changes in climate have a high sensitivity, while systems that are minimally impaired by the same changes in climate have a relatively low sensitivity. For the San Mateo County vulnerability assessment the Working Group was asked to provide a sensitivity assessment and ranking by answering the following two questions:
1. If the impact were to occur how impaired would the county / system be?
2. What additional non-climate factors currently affect the system component identified as being impacted?
Working group members were also asked to rank the sensitivity of the system to specific exposures on a scale from 0 to 4. Zero is considered to be low sensitivity, with no effect being experienced from the impact. Four is the high end of the scale, reflecting a system greatly affected by the impact. Background and guidance was also provided to the Working Group prior to completing this assessment.
3.1.3. Adaptive Capacity
Adaptive capacity is defined as the ability of a specific system to make adjustments or changes in order to maintain its primary functions even with the impacts of climate change. This does not mean that the system must look the same as before the climate change impact, but it must provide the same services.

14
For the San Mateo County vulnerability assessment the Working Group was asked to provide an adaptive capacity assessment and ranking by answering the following three questions:
1. What does the system have to adapt?
2. What does the system need to adapt?
3. Of these needs, which are of the highest priority?
Working group members were also asked to rank the adaptive capacity of the system to specific exposures on the same basic 0 to 4 scale as sensitivity. However, in this case, zero adaptive capacity is a negative rather than a positive attribute. Background and guidance was also provided to the Working Group prior to completing this assessment.
3.1.4. Timing
Timing can mean many things in the context of climate change. It can be a question of seasonality or daily changes associated with a specific changing condition as described in section 2.4.2. However in the context of this part of the assessment, timing was considered to be the timeframe within which a given exposure concern could or would be experienced. For the County’s assessment ICLEI used the State’s 2009 Climate Action Team Biennial Report to propose near term, medium term or long term expectations for each exposure. The Working Group provided feedback on this proposal and identified impacts that are being experienced currently.
3.2. Summary Vulnerability Findings
Presented here are the key vulnerability findings for San Mateo County captured through the assessment process outlined above. All key vulnerabilities identified received a ranking of 3.5 or higher. Additionally, in a few circumstances, vulnerabilities that ranked below 3.5 are listed because they are already occurring. The complete set of responses received can be found in Appendix II.
3.2.1. Key Interactions and Intersections
As noted in sections 2.4.3 and 2.4.4, climate change impacts on a community are not necessarily straightforward and easy to identify. Virtually all climate impacts are interrelated, and during the San Mateo County vulnerability assessment process, the following key intersections and interactions were identified as being specifically relevant:
● The health of the forest, which is contingent upon temperatures, precipitation and the lack of pests, greatly influences the forest fire threats in the county. Conversely, the lack of devastating fires generally contributes to the health of the forest, notwithstanding the ecological benefits of limited periodic burns.
● Precipitation patterns can greatly influence the water table level, which can then alter the flooding patterns that occur at a location.
● The amount of water used in agricultural irrigation depends on precipitation levels.

15
* Starred vulnerabilities are those that have been identified as already occurring, whether due directly to climate change or
because the threat exists for other reasons.
Many of these can be seen through the sensitivities identified below. The details of these relationships should be further considered during future assessments. Additionally when identifying possible adaptation actions, the County should consider actions that benefit both pieces of the interactions.
3.2.2. Agriculture / Silviculture
The following key vulnerabilities were identified for the agriculture / silviculture sector:
1. Agricultural productivity is vulnerable to changes in water availability.*
2. Forest health is vulnerable to lower rainfall levels and higher temperatures.
Sensitivity Considerations:
For the agricultural vulnerability, the sensitivities included water availability and economic demands. Additionally, the issue of increased fog and its impact on sunlight, water availability, and plant growth were discussed as possible agriculture sensitivity factors, but research was not available to expand on these concerns. The silviculture-related sensitivity factors identified include fires, water and precipitation availability, economic demands, pests and homes in the urban-rural boundary. These factors all were stresses on the health of the forest that could exacerbate the climate change stressor.
Adaptive Capacity Considerations:
Both agriculture and silviculture benefit from current zoning ordinances that provide for productive land dedicated to these local economic opportunities. However, adaptive capacity is limited currently by the lack of long-term management plans for these resources. On the agricultural side, this management plan would need to focus on water management and include habitat considerations, while for silviculture, effective implementation of existing plans is a barrier to adaptation.
Timing Considerations:
While concerns related to water availability already exist for the agricultural sector, the threat to forest health is mostly in the medium term – 2050 timeframe. This later timeframe provides the County some time to plan and prepare for future impacts.
3.2.3. Built Environment in the Coastal Zone
The following key vulnerabilities were identified for built structures in the coastal zone on the Bay- and ocean-side:
1. Homes and businesses could be completely lost due to severe storm damage or erosion in erosion-prone locations such as Seal Cove. A better understanding of future bluff erosion rates would provide greater clarity about this vulnerability.
2. Public access and recreation are vulnerable to flooding and erosion, including loss of beaches and trails, in low-lying locations such as Coyote Point Recreation Area and Coyote Point Marina.*
16
* Starred vulnerabilities are those that have been identified as already occurring, whether due directly to climate change or
because the threat exists for other reasons.
3. Sewer systems in certain areas could be vulnerable to flooding and could experience back ups and sewer districts could experience localized flooding due to sea level rise.21
4. Homes and businesses are vulnerable to more frequent problems with localized due to storm drainage backups in low-lying areas such as North Fair Oaks, Pescadero, Princeton, and Moss Beach,.*
5. Homes or other structures and systems, particularly septic system leach fields near coastal bluffs, could be destroyed due to increased bluff erosion.*
6. Certain sections of major roads, specifically Highway 1 near Surfers Beach and Devil’s Slide, as well as local county roads could be lost or destroyed by erosion and landsides.*
Sensitivity Considerations:
For built structures the impacts of sea level rise will be exacerbated by a number of factors. A structure’s current integrity (or lack thereof) could significantly increase its sensitivity. Additionally, design and construction materials, as well as conditions in the surrounding landscape, can play a role. For example, a building’s base floor elevation and the amount of impervious surface around the site could alter the outcome of a flooding event. Similarly, sediment management practices—or the lack thereof—can impact homes near eroding bluffs or beaches.
Adaptive Capacity Considerations:
All the built environment assets in this section were considered to have relatively low adaptive capacities. Some development regulations currently in place—such as Local Coastal Program provisions for hazard mitigation—could provide some adaptation benefits, but the group identified a number of key adaptive capacity factors that were still needed, including improved development regulations, infrastructure improvements, increased funding, and systems for managed retreat.
Timing Considerations:
As noted with asterisks above, the County currently faces a number of threats from erosion and localized flooding. The other key vulnerabilities identified are considered to be medium term (20 – 50 year) threats, thus providing the County with an opportunity to plan and prepare for these impacts.
3.2.4. Coastal Ecosystems
The following three key vulnerabilities were identified for coastal ecosystems:
1. Tide pools could be lost due to changing sea levels and pollution associated with bluff erosion.*
2. Where beaches such as Surfers Beach at Highway 1 cannot move inland with higher tides, they will be vulnerable to erosion, inundation and even complete loss.*
21 These are generally outside county jurisdiction; however they impact the county and there may be ways for the county to
increase collaboration, improve cooperation and change its permitting submittal requirements to improve outcomes.

17
* Starred vulnerabilities are those that have been identified as already occurring, whether due directly to climate change or
because the threat exists for other reasons.
* Starred vulnerabilities are those that have been identified as already occurring, whether due directly to climate change or
because the threat exists for other reasons.
3. Coastal wetlands will be vulnerable where they cannot migrate inland as sea level rise accelerates, and could be entirely lost along with the habitat they provide for migratory birds and rare or endangered species. Pescadero Marsh and Pillar Point Marsh were identified by the Working Group as particular concerns.
Sensitivity Considerations:
Tide pools, beaches, and wetlands had similar factors that exacerbated climate change impacts. The elevation of the site as well as their current health were considered to be primary factors that would effect a specific location’s sensitivity level. Additionally, current pollution levels, which are associated with habitat health, were sited as a sensitivity consideration. Finally, for some locations, shoreline structures could make ecosystems more sensitive to sea level rise impacts, in that they impede natural adaptive migration of ecosystems.
Adaptive Capacity Considerations:
All three ecosystem types currently have some open space protections that increase their adaptive capacity. Additionally, for some locations there is space for ecosystems to naturally migrate inland, thereby increasing adaptive capacity. Despite having some adaptive traits, the systems generally lack the ability to migrate inland due to limited space. Moreover, funding and monitoring were sited as key limiting features for these systems long-term adaptive capacity.
Timing Considerations:
The County already faces serious impacts from erosion to both its beaches and tide pools, as sea levels rise, these impacts are likely to become more severe, placing greater stresses on the ecosystems as a whole. The impacts to coastal wetlands are considered to be medium term (20 – 50 year) consideration, thus providing the County with an opportunity to plan and prepare for these impacts.
3.2.5. Fire Threatened Areas
The following key vulnerabilities were identified as San Mateo County’s fire threats:
1. Undeveloped lands and structures in the urban rural interface could see more fire events, and those areas that are considered "less" fire prone today have the potential to become "more" fire prone with climate change.*
2. Water supply and associated infrastructure could be destroyed by wildfires.*
3. Sensitive habitats may be vulnerable due to increased incidence of fire and species could be lost.

18
* Starred vulnerabilities are those that have been identified as already occurring, whether due directly to climate change or because the
threat exists for other reasons.
Sensitivity Considerations:
Many factors affecting sensitivity were identified for all fire-related threat, including heat waves, water availability, home and road layout, and forest health as it relates to existence of pests and other external threats. The drier, hotter, and less resilient conditions brought about by these factors exacerbate wildfire threats. Additionally, the sensitivity of many tree species to fire increases their particular vulnerability to wildfire.
Adaptive Capacity Considerations:
Existing vegetation management programs were identified as providing adaptive capacity benefit for the urban-wildland interface, and these programs could be even more critical if the type of vegetation shifts to that of a drier climate. As related to key vulnerability #2, the water supply was noted as being publicly-owned and managed for fire risk. Across all three wildfire-related vulnerabilities, similar adaptive capacity needs were cited. Generally, it was noted that wildfire vegetation management plans, funding, improved standards, and possibly more firefighting infrastructure would increase overall adaptive capacity.
Timing Considerations:
Many parts the County are already considered fire risk zones, including much of the urban/rural boundary and the Crystal Springs watershed. Fire threats to specific habitats are a near term (next 15 years) concern and therefore the County has an opportunity to address these adaptation considerations as well.
3.2.6. Public Health
The following key vulnerabilities were identified in the public health area:
1. Users of outdoor recreation areas could be vulnerable to heat health risks where these areas lack proper shade, facilities, and public awareness.
2. Low-income and other residents may be vulnerable to extreme heat events due to their limited ability to cool their homes.
3. People with impaired respiratory systems will be vulnerable to heat-related air quality impacts and experience higher hospitalization and mortality rates.
4. Elderly populations, infants, children, and outdoor workers generally will be vulnerable to health risks due to increases in extreme heat events.*
Sensitivity Considerations:
Many of the sensitivity factors were similar across the public health vulnerabilities. Specifically, access to cooling centers or cooling systems, isolation, and inadequate communication were identified as things that could exacerbate individual heat health threats. Language access increases the sensitivity of non-native English speakers. The amount of appropriate shade and cooling options in public spaces was

19
* Starred vulnerabilities are those that have been identified as already occurring, whether due directly to climate change or because the
threat exists for other reasons.
identified as a factor in this area. For individuals with impaired respiratory systems, existing air quality problems was an additional factor.
Adaptive Capacity Considerations:
To address heat threats, adaptive capacity needs include more cooling centers, education, engagement programs and urban heat island mitigation techniques such as planting shade trees. It is important to note that some programs already exist that fulfill these needs to some extent. Current air quality standards may need to be strengthened to mitigate future respiratory illness threats.
Timing Considerations:
Elderly populations already face heat health threats, while the majority of the other populations impacted by heat health considerations have a near term (next 15 years) vulnerability for the County. Improving the County’s adaptive capacity through the development of a heat response plan could provide immediate and future benefits. The vulnerabilities related to outdoor recreation users and air quality concerns are medium term (20 – 50 years) considerations thus providing the County with an opportunity to plan and prepare for these impacts.
3.2.7. Water and Wastewater Infrastructure
The following key vulnerabilities were identified for water supply:
1. Wastewater treatment plants and related infrastructure such as sewer mains and treated effluent outfalls could be impaired by sea level rise, potentially resulting in back ups and overflows.
2. Water supply districts that rely on surface waters could have supply interrupted more frequently by changes in precipitation patterns.
3. Water supply that relies on Sierra Nevada snowpack will be vulnerable to changes in the quantity of snowpack and timing of snow melt.
Sensitivity Considerations:
The sensitivity considerations for the water supply vulnerability were demand for water from multiple sectors and reliance on distant sources such as the Sierra Nevada snowpack. The sensitivities for the wastewater threat of sea level rise included the age of infrastructure and the County-wide demand for services.
Adaptive Capacity Considerations:
There are a number of programs in place that promote water conservation, as well as sediment reduction in surface sources, that contribute to adaptive capacity; however, more resources are needed for these programs to generate increasingly positive outcomes. Diversification of supply sources through increased reliance on conservation, water reuse, and/or desalination is also a challenge. For these reasons, the adaptive capacity of this system remained low. The wastewater system currently needs replacement and

20
that is likely to drive actions forward, to the extent that planned capital projects can be designed with adaptation in mind. However, even this approach may entail additional costs and challenges related to design and management.
Timing Considerations:
Both the sea level rise threats to wastewater and the threats to water supply are medium term (20-50 years). Therefore, the County has an opportunity to plan and prepare for these impacts but must start soon. Two other vulnerabilities that require more research to effectively evaluate were identified in this sector – water supply infrastructure in the coastal zone and groundwater supplies. Both are threatened by sea level rise impacts. It should be noted that the impacts to infrastructure are already occurring and the groundwater concerns may be near term (next 15 years), so more information should be gathered to enable the County to act in a timely manner.
3.2.8. Exposures Requiring More Research
The following exposures were identified, but due to the lack of specific data and understanding they were not able to be fully assessed. Noting these gaps can help to guide future assessments and identify research needs.
● Water supply districts in the coastal zone could have infrastructure destroyed by storms.
● Earthquake risk could change for homes, businesses, and infrastructure due to changing groundwater table.
● Groundwater could experience salt water intrusion as sea level rise occurs.
● Water districts could experience backup and localized, drainage-related flooding due to sea level rise.
● Levees and seawalls could experience increased damages from sea level rise and erosion.
3.2.9. Additional Exposures Identified
Three climate change threats were identified at a late stage in the assessment and could not be directly addressed in the vulnerability assessment; however these threats should be noted as they are concerns for San Mateo County.
● The electrical system may be exposed due to above ground wires that go through both wetlands and mountain areas and fire / flooding putting them at risk.
● Underground electricity distribution lines may be impacted by increased moisture in the soil and saltwater corrosion due to sea level rise.
● Bluff erosion in areas of old septic system leach fields could result in a public health impact at public beaches and other nearby open spaces.

21
Section 4. Conclusion and Next Steps
The climate change vulnerability assessment for San Mateo County revealed a number of key areas that the County can focus on to increase its overall resilience to climate impacts. By understanding the threats that the County faces from climate change staff and stakeholders can begin to identify actions that will alleviate specific stresses. For example, having recognized that heat impacts on public health are a near term threat to many populations within the county, cooling centers can be identified, educational materials created and engagement programs can be tested. Moreover, the County can explore comprehensive strategies to address multiple vulnerabilities. Creating regional collaborations, developing a Climate Change Adaptation Committee, or enhancing research initiatives are possible ways for the County to increase adaptive capacity across multiple sectors. In fact, awareness among staff and stakeholders of future climate impacts and vulnerabilities raised by this effort, has increased the County’s capacity to carry out further adaptation planning.
In the next phase of this project, the County will work on identifying climate change adaptation actions that it can employ to become a more resilient place to live. Potential actions will be identified by looking for national and international best practices identified by ICLEI’s Climate Resilient Communities™ (CRC) program and other networks of local governments working on climate change adaptation. Initial ideas will be presented during the climate change adaptation workshop in November where further suggestions and guidance from stakeholders will be sought.
22
References
Dessler, Andrew E., and Edward A. Parson. (2006). The Science and Politics of Global Climate Change:
a guide to the debate. Cambridge: University Press. Gershunov, A., and D. Cayan. (2008). “Recent increase in California heat waves: July 2006 and the last
six decades.” CEC-500-2008-XXX. In press. Global Facility for Disaster Risk Reduction (GFDRR). (2011). “Disaster Risk Financing and Insurance
Product Note.” Washington, DC. World Bank. Available online: http://www.gfdrr.org/gfdrr/sites/gfdrr.org/files/documents/DRFI_MultiCatProgram_Jan11.pdf.
Hansen, J. et al. (2005). “Earth’s energy imbalance: Confirmation and implications.” Science 308 (5727): 1431-1435.
Heberger, M., Cooley, H., Herrera P., Gleik, P. and Moore, E. (2009). “The Impacts of Sea-Level Rise on the California Coast.” CEC-500-2009-024-D. Available online: http://www.dbw.ca.gov/csmw/pdf/PacificInstitute_SLR_final.pdf
Intergovernmental Panel on Climate Change (IPCC). (2007). “Climate Change 2007: Synthesis Report for the Fourth Assessment Report of the Intergovernmental Panel on Climate Change.” Available online: www.ipcc.ch/pdf/assessment-report/ar4/syr/ar4_syr.pdf
Snover, A.K., et. al. (2007). “Preparing for Climate Change: A Guidebook for Local, Regional and State Governments.” In association with and published by ICLEI – Local Governments for Sustainability. ICLEI: Oakland, CA. Available online: http://www.icleiusa.org/action-center/planning/climate-adaptation-planning-resources/adaptation-guidebook
State of California. (2009). “Climate Action Team Biennial Report.” available online: www.energy.ca.gov/2009publications/CAT-1000-2009-003/CAT-1000-2009-003-D.PDF.
State of California. (2010). “State of California Sea‐Level Rise Interim Guidance Document.” Available online: http://www.slc.ca.gov/Sea_Level_Rise/SLR_Guidance_Document_SAT_Responses.pdf.

23
Appendix I. Climate Change Summaries by Focus Area
I. Climate Change and Agriculture Potential impacts to agriculture from climate change The USDA recently revised its plant hardiness zones - areas in which a specific category of plant life is capable of growing. The revisions indicate that there has been a general trend northward, with plants increasing able to survive at higher latitudes. Although based on a combination of factors, this shift is associated with climate change and the following conditions: ● Increasing temperature averages and increasing temperature maximums and minimums. ● Changes in winter lows, which were warmer across the United States. ● Increases in precipitation variability may make certain plants less viable.
Other climate change conditions that could affect agriculture and forestry are: ● The length of the growing season, which for California is thought to be becoming longer. ● Pests and weeds whose ranges are also increasing. ● Changing wildfire patterns – according to Cal-Adapt, San Mateo County could see an
increase in wildfire areas burned. Specific findings for California: ● Lee and Six (2008) found that in 2050 cotton, maize, sunflower, and wheat yields
decrease from 3 percent to 8 percent compared to 2000; while rice and tomato yields were essentially the same. Alfalfa yields increased, but the results were not consistent across counties. However by the end of the century yields of all crops except alfalfa decreased.
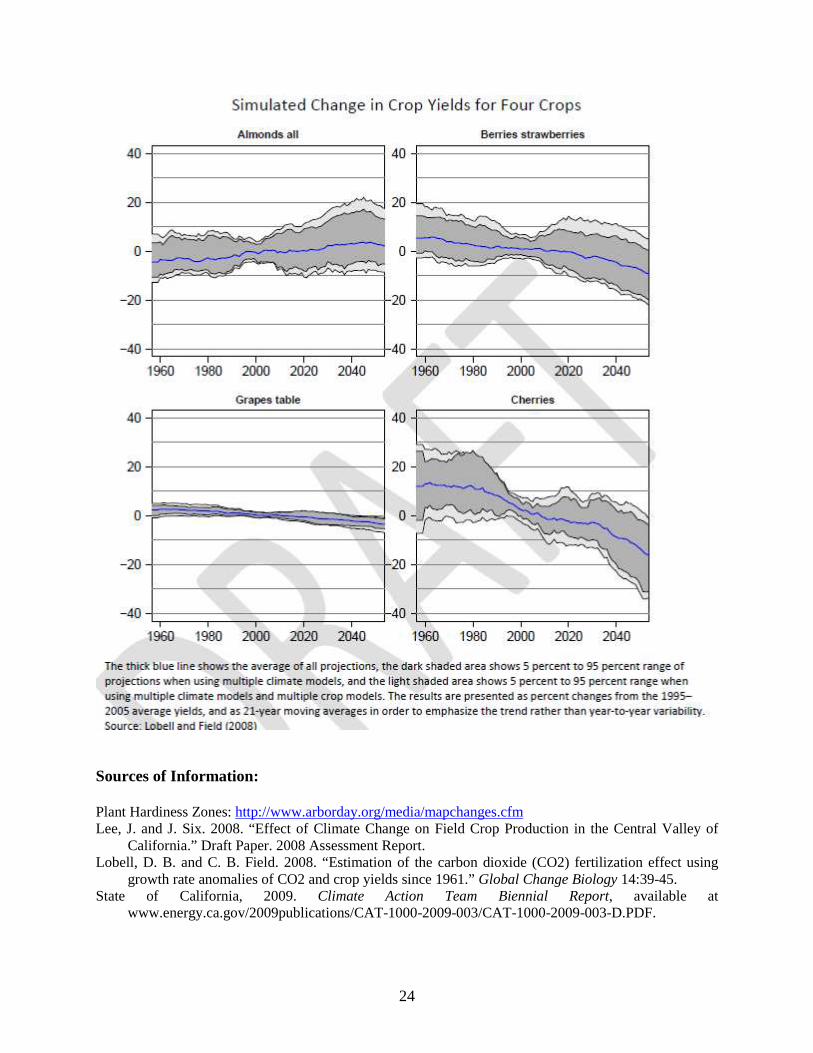
● Using historical county crop yields and weather data to establish models Lobell and Field projected the impacts of climate changes on crop yields through 2050. The figure below shows that strawberries and cherries are projected to decrease their yields, while there could be a slight positive impact on crop yields for almonds.
24
Sources of Information: Plant Hardiness Zones: http://www.arborday.org/media/mapchanges.cfm Lee, J. and J. Six. 2008. “Effect of Climate Change on Field Crop Production in the Central Valley of
California.” Draft Paper. 2008 Assessment Report. Lobell, D. B. and C. B. Field. 2008. “Estimation of the carbon dioxide (CO2) fertilization effect using
growth rate anomalies of CO2 and crop yields since 1961.” Global Change Biology 14:39-45. State of California, 2009. Climate Action Team Biennial Report, available at
www.energy.ca.gov/2009publications/CAT-1000-2009-003/CAT-1000-2009-003-D.PDF.
25
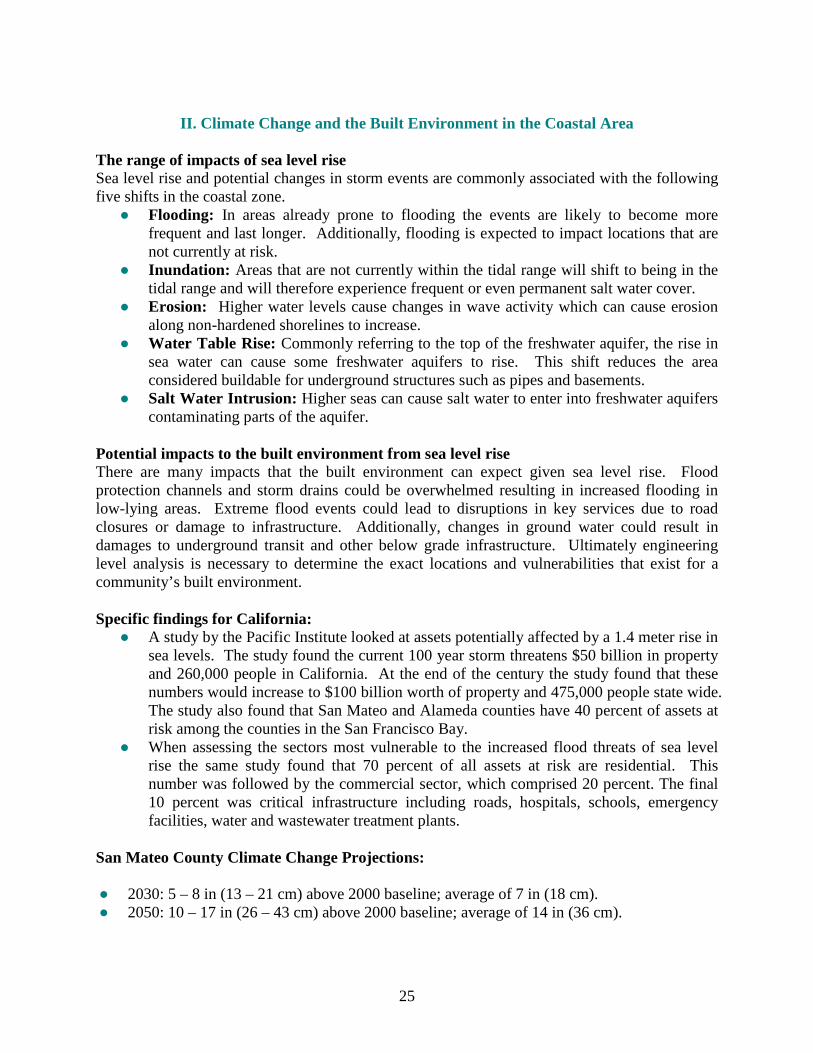
II. Climate Change and the Built Environment in the Coastal Area
The range of impacts of sea level rise Sea level rise and potential changes in storm events are commonly associated with the following five shifts in the coastal zone. ● Flooding: In areas already prone to flooding the events are likely to become more
frequent and last longer. Additionally, flooding is expected to impact locations that are not currently at risk.
● Inundation: Areas that are not currently within the tidal range will shift to being in the tidal range and will therefore experience frequent or even permanent salt water cover.
● Erosion: Higher water levels cause changes in wave activity which can cause erosion along non-hardened shorelines to increase.
● Water Table Rise: Commonly referring to the top of the freshwater aquifer, the rise in sea water can cause some freshwater aquifers to rise. This shift reduces the area considered buildable for underground structures such as pipes and basements.
● Salt Water Intrusion: Higher seas can cause salt water to enter into freshwater aquifers contaminating parts of the aquifer.
Potential impacts to the built environment from sea level rise There are many impacts that the built environment can expect given sea level rise. Flood protection channels and storm drains could be overwhelmed resulting in increased flooding in low-lying areas. Extreme flood events could lead to disruptions in key services due to road closures or damage to infrastructure. Additionally, changes in ground water could result in damages to underground transit and other below grade infrastructure. Ultimately engineering level analysis is necessary to determine the exact locations and vulnerabilities that exist for a community’s built environment. Specific findings for California: ● A study by the Pacific Institute looked at assets potentially affected by a 1.4 meter rise in
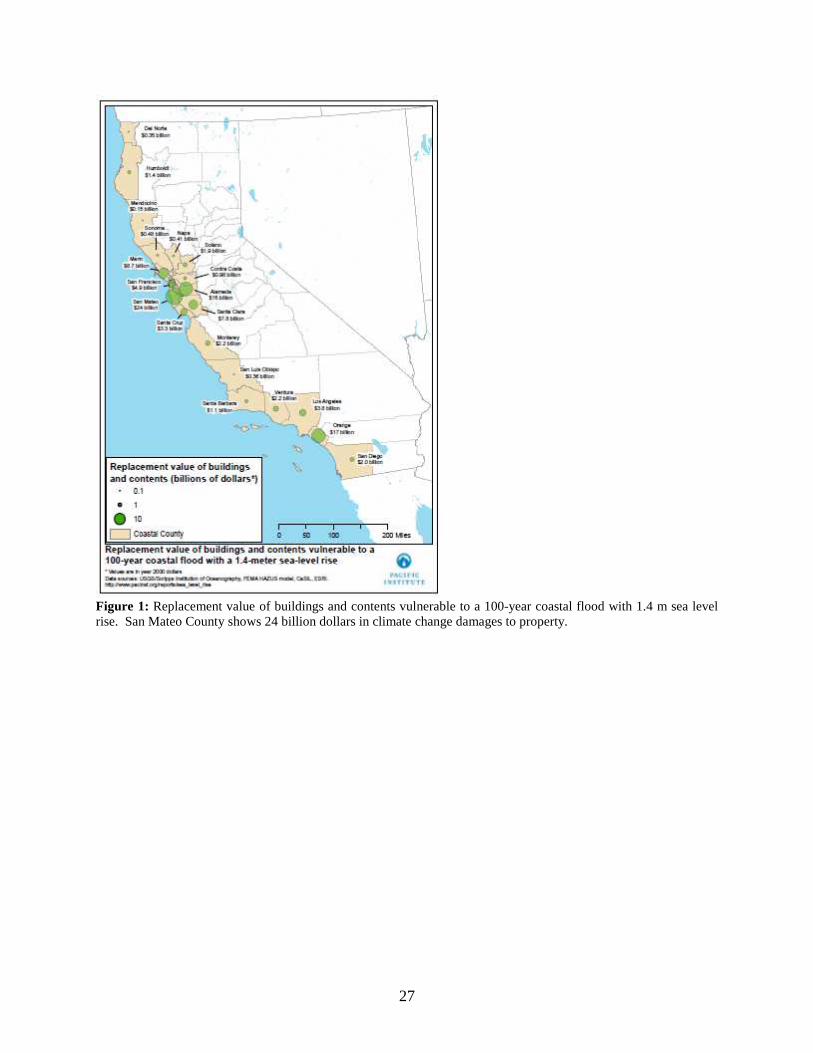
sea levels. The study found the current 100 year storm threatens $50 billion in property and 260,000 people in California. At the end of the century the study found that these numbers would increase to $100 billion worth of property and 475,000 people state wide. The study also found that San Mateo and Alameda counties have 40 percent of assets at risk among the counties in the San Francisco Bay.
● When assessing the sectors most vulnerable to the increased flood threats of sea level rise the same study found that 70 percent of all assets at risk are residential. This number was followed by the commercial sector, which comprised 20 percent. The final 10 percent was critical infrastructure including roads, hospitals, schools, emergency facilities, water and wastewater treatment plants.
San Mateo County Climate Change Projections: ● 2030: 5 – 8 in (13 – 21 cm) above 2000 baseline; average of 7 in (18 cm). ● 2050: 10 – 17 in (26 – 43 cm) above 2000 baseline; average of 14 in (36 cm).

26
● 2100 Low GHG: 31 – 50 in (78 – 128 cm) above 2000 baseline; average of 40 in (101 cm). ● 2100 High GHG: 43 – 69 in (110 – 176 cm) above 2000 baseline; average of 55 in (140 cm). These projections are from the State of California Sea‐Level Rise Interim Guidance Document, which used projections from the December 2009 Proceedings of National Academy of Sciences Vermeer and Rahmstorf publication and further updated them to reference 2000 as the baseline. These numbers are for global mean sea level rise, which the State’s guidance indicates compares well with California coastal trends. Given that changes in the next 50 years do not vary dramatically due to greenhouse gas GHG emissions there is only one set of numbers provided for the near (2030) and medium term (2050). The range that is presented in these time frames comes from variability in the models. However later in the century today’s greenhouse gas emissions have a greater impact and the two sets of numbers are presented to reflect that. Sources of Information: Heberger, M., Cooley, H., Herrera P., Gleik, P. and Moore, E. 2009. “The Impacts of Sea-Level
Rise on the California Coast.” CEC-500-2009-024-D. Available at: http://www.dbw.ca.gov/csmw/pdf/PacificInstitute_SLR_final.pdf
State of California, 2009. Climate Action Team Biennial Report, available at www.energy.ca.gov/2009publications/CAT-1000-2009-003/CAT-1000-2009-003-D.PDF.
State of California, 2010. State of California Sea‐Level Rise Interim Guidance Document, available at http://www.slc.ca.gov/Sea_Level_Rise/SLR_Guidance_Document_SAT_Responses.pdf.
Summary sea level rise impacts and effects available from The Adapting to Rising Tides project: http://risingtides.csc.noaa.gov/climateimpacts.html
27
Figure 1: Replacement value of buildings and contents vulnerable to a 100-year coastal flood with 1.4 m sea level rise. San Mateo County shows 24 billion dollars in climate change damages to property.

28
III. Climate Change and Coastal Ecosystems The range of impacts of sea level rise Sea level rise and potential changes in storm events are commonly associated with the following five shifts in the coastal zone. ● Flooding: In areas already prone to flooding the events are likely to become more
frequent and last longer. Additionally, flooding is expected to impact locations that are not currently at risk.
● Inundation: Areas that are not currently within the tidal range will shift to being in the tidal range and will therefore experience frequent or even permanent salt water cover.
● Erosion: Higher water levels cause changes in wave activity which can cause erosion along non-hardened shorelines to increase.
● Water Table Rise: Commonly referring to the top of the freshwater aquifer, the rise in sea water can cause some freshwater aquifers to rise. This shift reduces the area available for the roots of freshwater plants or the area considered buildable for underground structures.
● Salt Water Intrusion: Higher seas can cause salt water to enter into freshwater aquifers contaminating parts of the aquifer.
Potential impacts to coastal ecosystems from sea level rise These five shifts in coastal areas can cause many impacts on coastal ecosystems. Specifically, there are tidal habitats that may be pushed to move inland; however if there are barriers behind these habitats they may drown, causing loss of important habitat areas and potentially reducing flood protection benefits of tidal marsh and mudflats to inland communities. Additionally, erosion could result in the loss of beaches or public access to shorelines over time. Flooding and water table changes could result in the re-mobilization of contaminants which could end up in coastal ecosystems. Ultimately, the changes could be summarized into three categories: 1) degraded quality of a coastal ecosystem, 2) loss of some percentage of the ecosystem; and 3) complete loss of the coastal ecosystem. Specific findings for California: ● A study by the Pacific Institute assessed the lands neighboring wetlands to determine
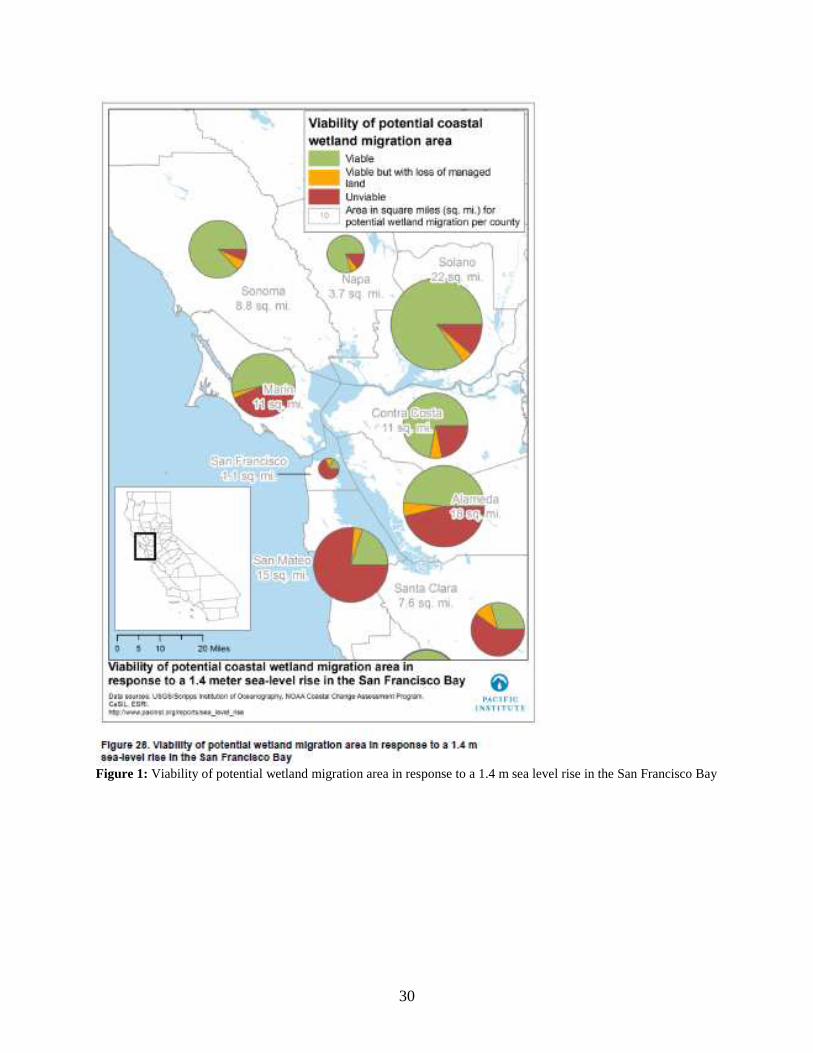
their viability for inland migration. Using 1.4 meters of sea level rise the assessment found that statewide 55 % (83 square miles) of the area currently neighboring wetlands would make viable future wetland habitat. An additional 15 % (23 square miles) could be suitable however it would involve the loss of value to human uses. Finally, 30 % was considered unsuitable for wetland migration because it’s currently developed. Figure 1 shows the results for counties around San Francisco Bay.
● A study by Adams and Inman looked at beaches in Southern California and estimated changes in beach width and volume. The authors found that beaches varied based on their specific conditions, with some experiencing continued erosion, others continued accretion. All beaches experienced the greatest amount of change during severe winter storms, especially during El Niño events.

29
San Mateo County Climate Change Projections: ● 2030: 5 – 8 in (13 – 21 cm) above 2000 baseline; average of 7 in (18 cm). ● 2050: 10 – 17 in (26 – 43 cm) above 2000 baseline; average of 14 in (36 cm). ● 2100 Low GHG: 31 – 50 in (78 – 128 cm) above 2000 baseline; average of 40 in (101 cm). ● 2100 High GHG: 43 – 69 in (110 – 176 cm) above 2000 baseline; average of 55 in (140 cm). These projections are from the State of California Sea‐Level Rise Interim Guidance Document which used the most up to date scientific projections from the Vermeer and Rahmstorf publication and further updated them to have 2000 as the baseline. These numbers are for global mean sea level rise, which the State’s guidance indicates compares well with California coastal trends. Given that changes in the next 50 years do not vary dramatically due to greenhouse gas GHG emissions there is only one set of numbers provided for the near (2030) and medium term (2050). The range that is presented in these time frames comes from variability in the models. However later in the century today’s greenhouse gas emissions have a greater impact and the two sets of numbers are presented to reflect that. Sources of Information: Adams, P.N. and D.L. Inman. 2008. “Climate Change and Potential Hotspots of Coastal Erosion
Along the Southern California Coast.” Draft Paper. 2008 Assessment Report Heberger, M., Cooley, H., Herrera P., Gleik, P. and Moore, E. 2009. “The Impacts of Sea-Level
Rise on the California Coast.” CEC-500-2009-024-D. Available at: http://www.dbw.ca.gov/csmw/pdf/PacificInstitute_SLR_final.pdf
State of California, 2009. Climate Action Team Biennial Report, available at www.energy.ca.gov/2009publications/CAT-1000-2009-003/CAT-1000-2009-003-D.PDF.
State of California, 2010. State of California Sea‐Level Rise Interim Guidance Document, available at http://www.slc.ca.gov/Sea_Level_Rise/SLR_Guidance_Document_SAT_Responses.pdf.
Summary sea level rise impacts and effects available from The Adapting to Rising Tides project: http://risingtides.csc.noaa.gov/climateimpacts.html
30
Figure 1: Viability of potential wetland migration area in response to a 1.4 m sea level rise in the San Francisco Bay

31
IV. Climate Change and Fire Risk Potential impacts to fire risk from climate change According to the US Forest Service (USFS)’s Western Wildlands Environmental Threat Assessment Center “There is growing scientific evidence that climate change is in part responsible for catastrophic fire events that are increasingly common.” Although wildfires are based on a combination of factors, this growing trend is associated with climate change through following conditions: ● Increasing temperatures, especially increasing temperature maximums ● Increasing evapotranspiration rates + increased drought events caused by more variable
precipitation that results in drier plants that serve as fire fuel sources. Other climate change conditions that could affect fire risk are: ● Changes in water availability making fire suppression increasingly difficult. ● Changes in plant viability and health due to shifting plant hardiness zones (see
agriculture & climate change for more information). ● Changes in the ranges of pests (specifically the western bark beetle) resulting in forest
grove die off. Specific findings for California: ● According the State’s Clime Impacts Report: “A more sophisticated analysis of forest
fires confirms prior studies suggesting an alarming, increasing trend in the frequency of these fires.”
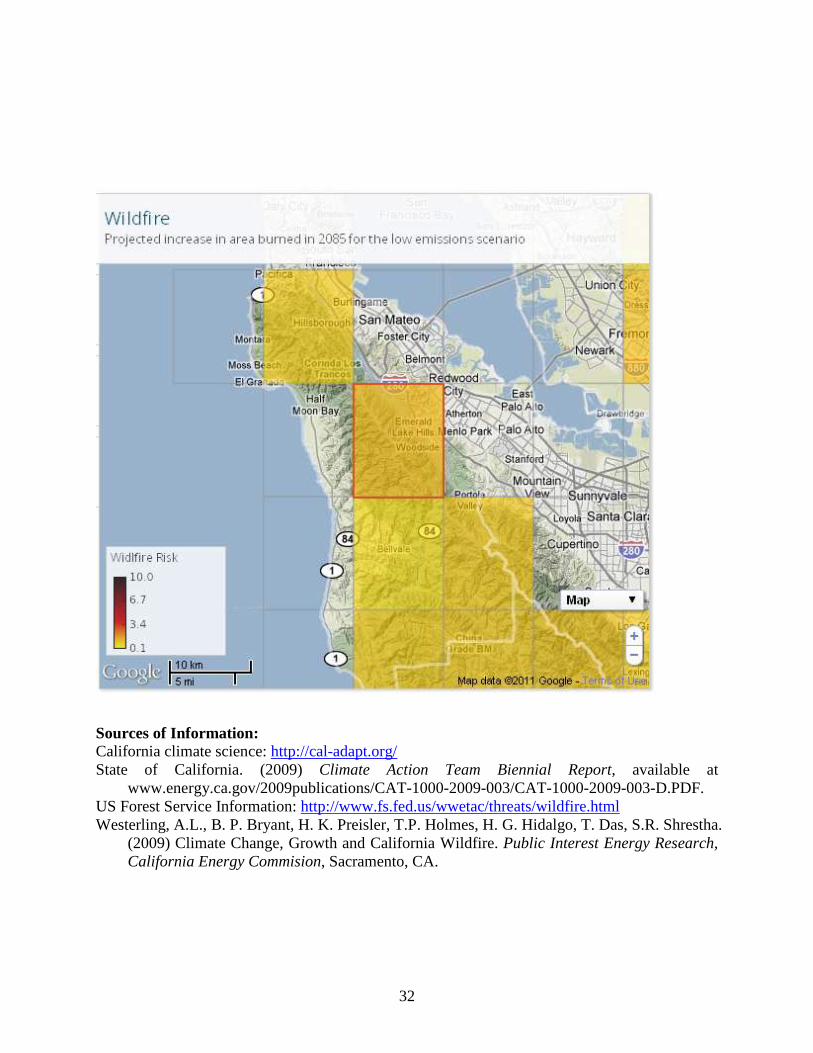
● Westerling et al. constructed a model of wildfire as a function of climate and land surface characteristics in California. Two key findings were made based on this model:
o The area burned from forest fires increases. Specifically the threat found for San Mateo County was a 1 % increase by 2020 and in 2050 above the baseline average from 1961 – 1990 (See Figure Below).
o There is a long-term (50 – 100 years) increase in the number and frequency of fire occurrence above the baseline average from 1961 – 1990.
San Mateo County Fire Risk Projections: ● 2020: + 1 % ● 2050: + 1 %
These projections downloaded from Cal-Adapt are the average of several different model runs. Although the projects at the end of the century vary based on greenhouse gas emissions scenarios, the middle of the century shows little or no difference due to greenhouse gas emissions scenarios.
32
Sources of Information: California climate science: http://cal-adapt.org/ State of California. (2009) Climate Action Team Biennial Report, available at
www.energy.ca.gov/2009publications/CAT-1000-2009-003/CAT-1000-2009-003-D.PDF. US Forest Service Information: http://www.fs.fed.us/wwetac/threats/wildfire.html Westerling, A.L., B. P. Bryant, H. K. Preisler, T.P. Holmes, H. G. Hidalgo, T. Das, S.R. Shrestha.
(2009) Climate Change, Growth and California Wildfire. Public Interest Energy Research, California Energy Commision, Sacramento, CA.
33
V. Climate Change and Public Health Potential impacts to public health from climate change associated temperature increases According to the Center for Disease Control and Prevention (CDC) “increased average temperatures and increasingly frequent and severe extreme heat events produce increased risks of heat-related illness and death that can be significant.” In addition, these direct heat health risks are exacerbated by the following: ● Heat aggravating several chronic diseases namely cardiovascular and respiratory disease. ● Heat increasing ground-level ozone concentrations thereby causing direct lung injury and
increasing the severity of respiratory diseases such as asthma and chronic obstructive pulmonary disease.
● Higher temperatures leading to increased demand for electricity and thus generating airborne particulates leading to increased respiratory disease.
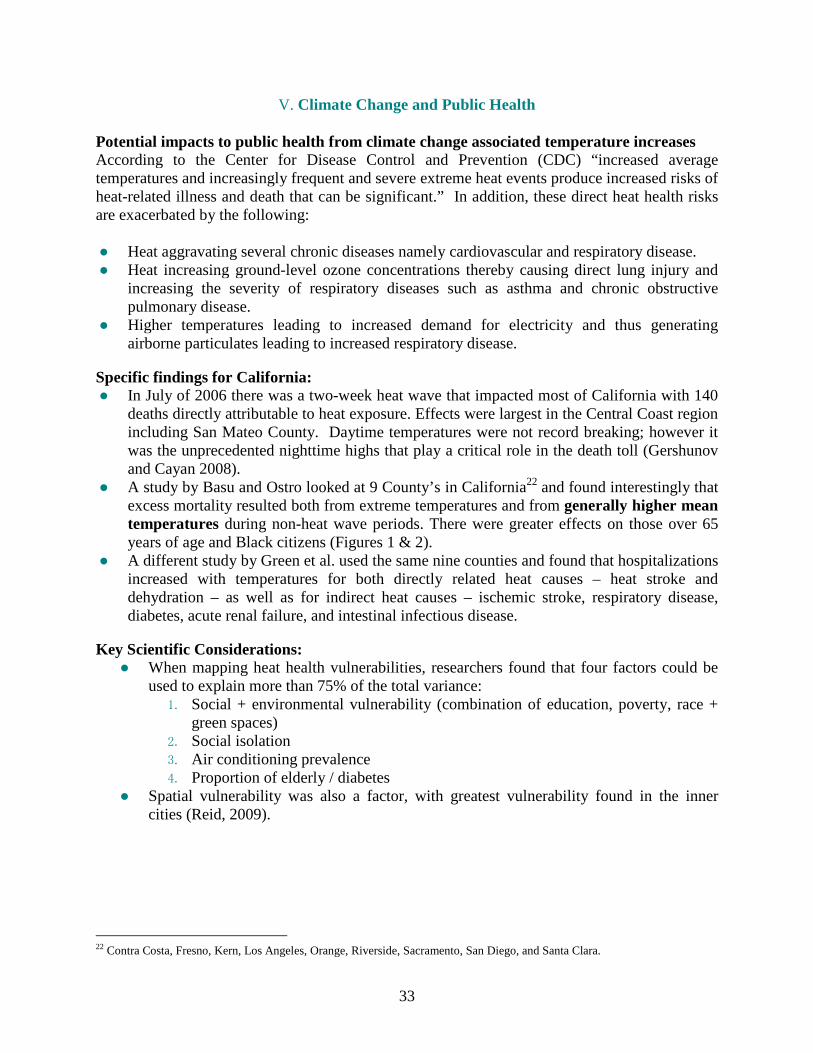
Specific findings for California: ● In July of 2006 there was a two-week heat wave that impacted most of California with 140
deaths directly attributable to heat exposure. Effects were largest in the Central Coast region including San Mateo County. Daytime temperatures were not record breaking; however it was the unprecedented nighttime highs that play a critical role in the death toll (Gershunov and Cayan 2008).
● A study by Basu and Ostro looked at 9 County’s in California22 and found interestingly that excess mortality resulted both from extreme temperatures and from generally higher mean temperatures during non-heat wave periods. There were greater effects on those over 65 years of age and Black citizens (Figures 1 & 2).
● A different study by Green et al. used the same nine counties and found that hospitalizations increased with temperatures for both directly related heat causes – heat stroke and dehydration – as well as for indirect heat causes – ischemic stroke, respiratory disease, diabetes, acute renal failure, and intestinal infectious disease.
Key Scientific Considerations: ● When mapping heat health vulnerabilities, researchers found that four factors could be
used to explain more than 75% of the total variance: 1. Social + environmental vulnerability (combination of education, poverty, race +
green spaces) 2. Social isolation 3. Air conditioning prevalence 4. Proportion of elderly / diabetes
● Spatial vulnerability was also a factor, with greatest vulnerability found in the inner cities (Reid, 2009).
22 Contra Costa, Fresno, Kern, Los Angeles, Orange, Riverside, Sacramento, San Diego, and Santa Clara.

34
Figure 1: Estimated percent change in mortality associated with a 10 °F increase in mean daily temperature by age.
Figure 2: Estimated percent change in mortality associated with a 10 °F increase in mean daily temperature by ethnicity.
San Mateo County Temperature Projections: ● 2030: + 1.6 °F ● 2050: + 2.8 °F
These projections downloaded from Cal-Adapt are the average of several different model runs. Although the projects at the end of the century vary based on greenhouse gas emissions scenarios, the middle of the century shows little or no difference due to greenhouse gas emissions scenarios. Sources of Information: Center for Disease Control and Prevention (CDC). Climate and Health Program:
http://www.cdc.gov/climatechange/default.htm Gershunov, A., and D. Cayan. 2008. Recent increase in California heat waves: July 2006 and the last six
decades. CEC-500-2008-XXX. In press. Green, R., R. Basu, B. Malig, R. Broadwin, J. Kim, and B. Ostro. 2008. The effect of temperature on
hospital admissions in nine California counties. Draft paper. 2008 Assessment Report Reid C E, O’Neill M S, Gronlund C J, Brines S J, Brown D G, Diez-Roux A V and Schwartz J 2009
Mapping community determinants of heat vulnerability Environ. Health Perspect. 117 1730–6 State of California, 2009. Climate Action Team Biennial Report, available at
www.energy.ca.gov/2009publications/CAT-1000-2009-003/CAT-1000-2009-003-D.PDF.

35
VI. Climate Change and Water Supply Potential impacts to water supply from climate change The hydrologic cycle, which determines the amount of water in the system at any given time, is highly complex. The cycle depends on the timing of rain and snow, evaporation rates and many other environmental factors. Although complex, it is generally thought that the following water supply shifts will be associated with climate change: ● Increasing temperature will increase the loss of water in the system through increased
evaporation rates. ● Precipitation’s trend toward increased variability will result in less water in the system at
times of greatest water need and more water in the system when there isn’t a capacity to handle the increased levels.
● Changes in snow cover and snow melt timing are likely to lead to decreased water availability. Sierra snowpack is projected to decline by 25 to 40 percent by 2050 and by up to 90 percent by 2100.
Other factors that could affect water supply: ● Changes in flood patterns and water table levels resulting in water supply infrastructure
damages (see coastal structures & climate change). ● Changes in water quality due to two factors: a) precipitation pattern changes causing
increased run-off and erosion; and b) changes in ground water salinity levels (see coastal structures & climate change).
● The change in water demand from population growth, agriculture or the energy sector. Specific findings for California: ● Two studies of water resources in California were conducted using two different models.
The CALVIN model is an engineering-economic optimization model that give best case scenario assessments. The CalSim-II model assumes that current rules and regulations will remain unchanged and therefore produces conservative results. Taken together, these models can provide a range of future possibilities.
● The CALVIN model found that under most future climate change scenarios water demand in urban areas was largely met – with the exception of some small shortages in southern California. However meeting this demand came at the cost of environmental water flows.
● The CalSim – II model indicated that the reliability of water supply from the State Water Project (SWP) and the Central Valley Project (CVP) are expected to be reduced for the range of future climate projections studies. Figure 1 shows some of the projected reductions in outflows.

36
Sources of Information: Environmental Protection Agency’s Water Availability Information:
http://www.epa.gov/climatechange/effects/water/availability.html California Department of Water Resources – Modeling Support Branch, 2006, “Climate Change
Impacts on the Sacramento-San Joaquin Delta” available at: http://baydeltaoffice.water.ca.gov/climatechange/ClimateChangeDelta_jamiea_DSM2UserGroup_%20Jan06.pdf
State of California, 2009. Climate Action Team Biennial Report, available at www.energy.ca.gov/2009publications/CAT-1000-2009-003/CAT-1000-2009-003-D.PDF.
Figure 1: Water outflows in 2050 based on CalSim Results using 4 different climate scenarios.

37
Appendix II. Vulnerability Assessment Responses
This Appendix is available as a separate PDF document entitled Appendix II - Vulnerability Assessment Responses.