san fernando, 1203 n maclay ave - images3.loopnet.com · fernmont st adelphia ave 0.02 sw 747 2017...
TRANSCRIPT

SAN FERNANDO, 1203 N MACLAY AVE
EXECUTIVE SUMMARY
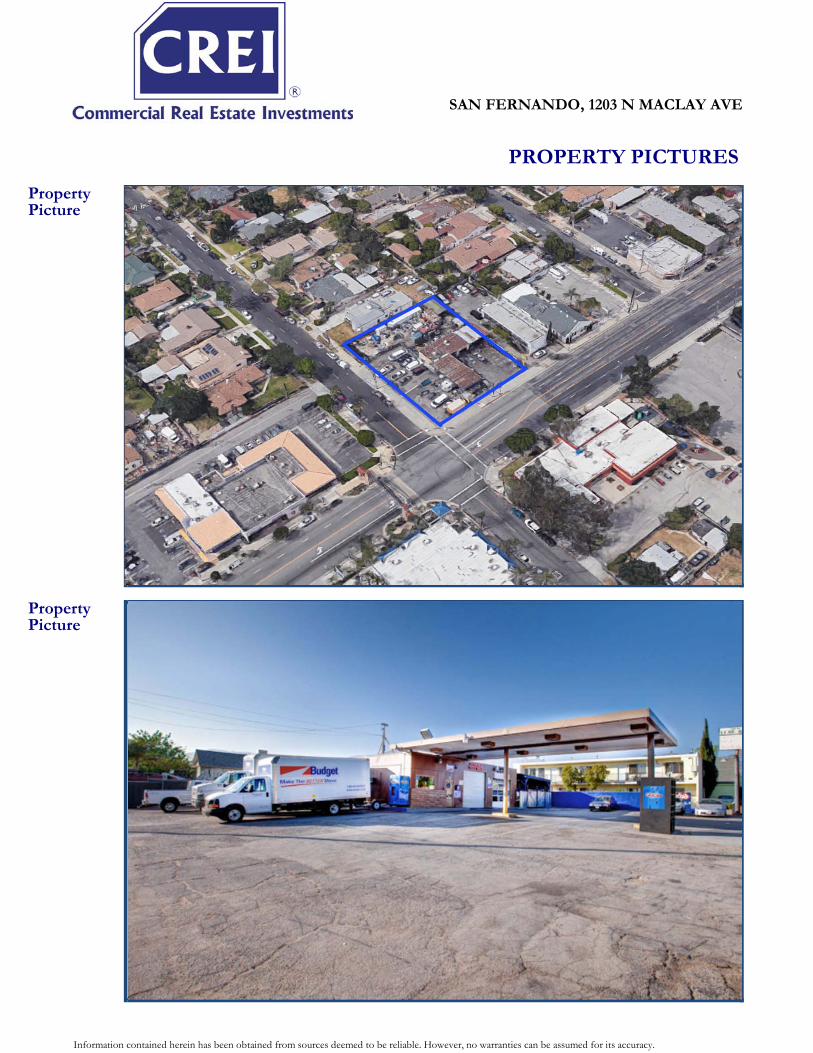
HIGHLIGHTS:KARL NIEHAUS • 18,000 SF Signalized Corner Lot - Corner of Maclay & 8th St
(310) 880-7900 • Zoning Allows for 21 Unit Mixed-Use Project(310) 300-1222 - [email protected] • 270 Feet of Signalized Frontage01450751 - RE License • 5 Blocks to 210 Freeway & Easy access to 3 Other Freeways
(118, 5 & 405)
DEMOGRAPHICS: The population within a 1 mile radius was estimated at over 28,000 as well as over 183,000 within a 3 mile radius, and this population is expected to grow at 1.22% annually. The average household income was estimated at approximately $71,000 within a 3 mile radius.
OFFERING SUMMARY: 1203 N Maclay offers a developer a 21 unit over retail mixed use project within 5 blocks of the 210 freeway. The property is located in the 'Maclay District' and one of the few properties chosen for the 'Neighborhood Services Overlay' specifically sought out by the city for Mixed-Use developments. The City of San Fernando has been revitalizing the 'Maclay District' since 2012, and will continue to further improve the district for a walkable pedestrian friendly community.
Insert property picture. Make both pictures as large as possible, yet still asthetically pleasing
SALES PRICE: $1,425,000 - 18,000 SF Lot
• One of the few parcels chosen for the 'Neighborhood Services Overlay' specifically for Mixed-Use Development
Information contained herein has been obtained from sources deemed to be reliable. However, no warranties can be assumed for its accuracy.
SAN FERNANDO, 1203 N MACLAY AVE
PROPERTY PICTURES
Insert property picture #2
Insert property picture
PropertyPicture
PropertyPicture
Information contained herein has been obtained from sources deemed to be reliable. However, no warranties can be assumed for its accuracy.

SAN FERNANDO, 1203 N MACLAY AVE
PROPERTY PICTURES
Overlays
Local AreaMap
Insert aerial map (lalife.com). Bird's Eye View
Insert local area map (lalife.com) - large enough to see local highways and major streets
District
Information contained herein has been obtained from sources deemed to be reliable. However, no warranties can be assumed for its accuracy.

SAN FERNANDO, 1203 N MACLAY AVE
WALK SCORE
Walk ScorePicture
Walk ScoreSummary
Walk Score Map (WalkScore.com)
Walk Score Nearby Tenant List (WalkScore.com)
Information contained herein has been obtained from sources deemed to be reliable. However, no warranties can be assumed for its accuracy.
SAN FERNANDO, 1203 N MACLAY AVE
PROPERTY PICTURES
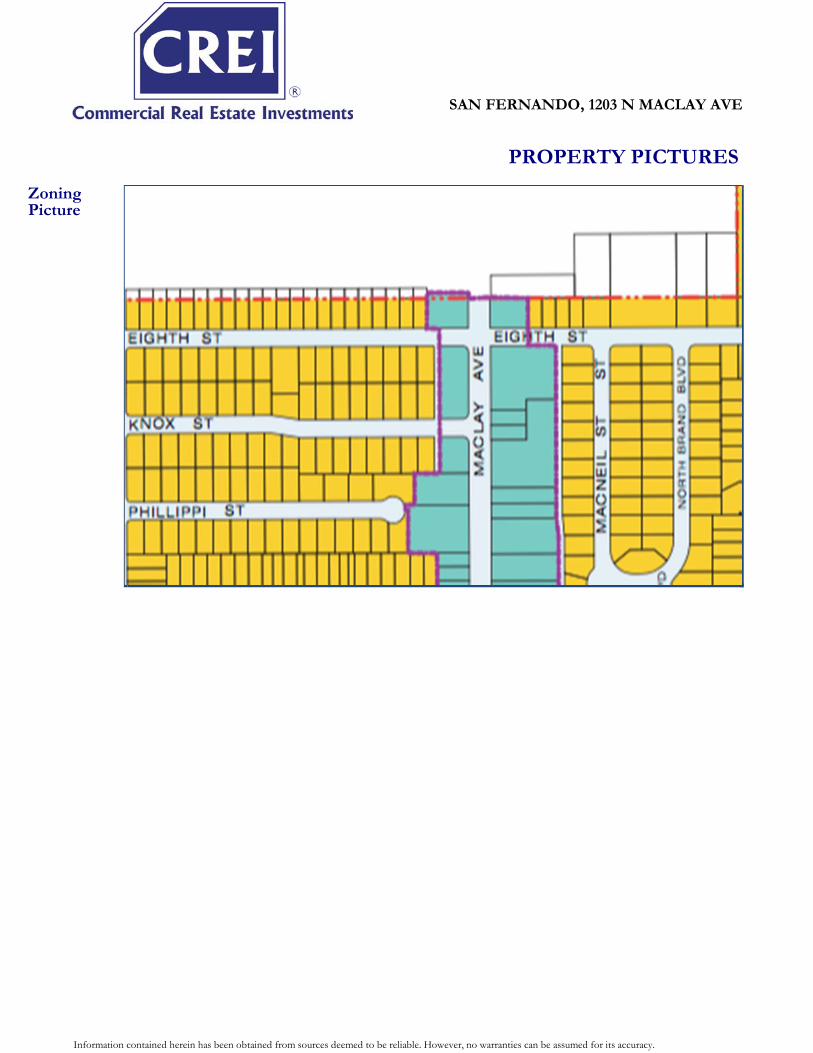
ZoningPicture
Insert zoning picture (Zimas.com)
Information contained herein has been obtained from sources deemed to be reliable. However, no warranties can be assumed for its accuracy.

SAN FERNANDO, 1203 N MACLAY AVE
DEMOGRAPHICSRadius 1 Mile 3 Mile 5 MilePopulation:
2023 Projection 29,312 186,182 358,4162018 Estimate 28,829 183,943 353,5272010 Census 27,956 182,929 348,439Growth 2018-2023 1.68% 1.22% 1.38%Growth 2010-2018 3.12% 0.55% 1.46%2018 Population Hispanic Origin 25,157 155,176 265,424
2018 Population by Race:White 25,643 159,759 293,082Black 1,063 8,570 14,910Am. Indian & Alaskan 650 3,783 6,377Asian 855 7,827 30,570Hawaiian & Pacific Island 71 409 819Other 547 3,594 7,768
U.S. Armed Forces: 0 22 52Households:2023 Projection 6,825 44,136 89,9262018 Estimate 6,707 43,626 88,7562010 Census 6,468 43,499 87,800Growth 2018 - 2023 1.76% 1.17% 1.32%Growth 2010 - 2018 3.70% 0.29% 1.09%Owner Occupied 4,479 26,903 55,303
Renter Occupied $2,228 $16,723 $33,453 2018 Avg Household Income $77,007 $71,799 $77,191 2018 Med Household Income $64,451 $58,308 $61,660
2018 Households by Household Inc:<$25,000 1,063 9,038 17,110$25,000 - $50,000 1,411 9,696 19,259$50,000 - $75,000 1,527 8,557 16,590$75,000 - $100,000 1,012 6,227 12,872$100,000 - $125,000 564 4,071 8,631$125,000 - $150,000 628 2,790 5,721$150,000 - $200,000 336 2,169 5,207$200,000+ 167 1,077 3,367
Information contained herein has been obtained from sources deemed to be reliable. However, no warranties can be assumed for its accuracy.
SAN FERNANDO, 1203 N MACLAY AVE
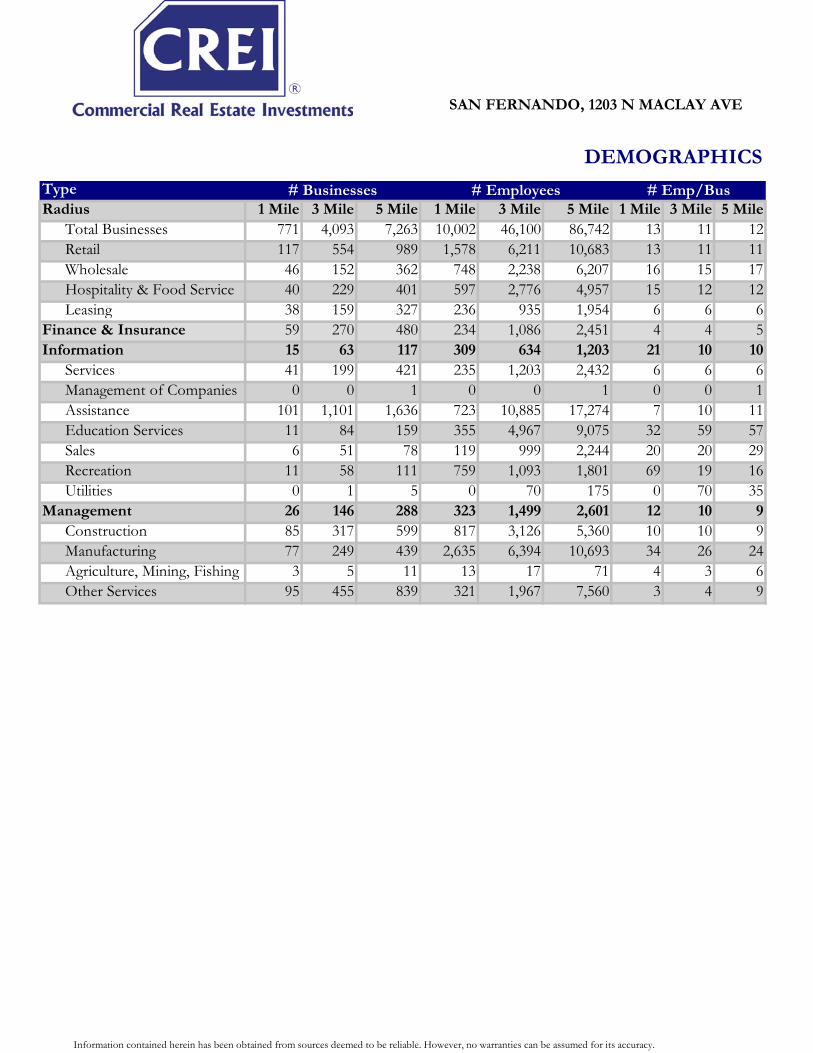
DEMOGRAPHICSTypeRadius 1 Mile 3 Mile 5 Mile 1 Mile 3 Mile 5 Mile 1 Mile 3 Mile 5 Mile
Total Businesses 771 4,093 7,263 10,002 46,100 86,742 13 11 12Retail 117 554 989 1,578 6,211 10,683 13 11 11Wholesale 46 152 362 748 2,238 6,207 16 15 17Hospitality & Food Service 40 229 401 597 2,776 4,957 15 12 12Leasing 38 159 327 236 935 1,954 6 6 6
Finance & Insurance 59 270 480 234 1,086 2,451 4 4 5Information 15 63 117 309 634 1,203 21 10 10
Services 41 199 421 235 1,203 2,432 6 6 6Management of Companies 0 0 1 0 0 1 0 0 1Assistance 101 1,101 1,636 723 10,885 17,274 7 10 11Education Services 11 84 159 355 4,967 9,075 32 59 57Sales 6 51 78 119 999 2,244 20 20 29Recreation 11 58 111 759 1,093 1,801 69 19 16Utilities 0 1 5 0 70 175 0 70 35
Management 26 146 288 323 1,499 2,601 12 10 9Construction 85 317 599 817 3,126 5,360 10 10 9Manufacturing 77 249 439 2,635 6,394 10,693 34 26 24Agriculture, Mining, Fishing 3 5 11 13 17 71 4 3 6Other Services 95 455 839 321 1,967 7,560 3 4 9
# Businesses # Employees # Emp/Bus
Information contained herein has been obtained from sources deemed to be reliable. However, no warranties can be assumed for its accuracy.

SAN FERNANDO, 1203 N MACLAY AVE
DEMOGRAPHICSSPENDINGRadius 1 Mile 3 Mile 5 Mile 1 Mile 3 Mile 5 MileTotal Specified Consumer Spending ($)
209,010 1,290,674 2,660,521 233,907 1,431,141 2,952,509Apparel:
Total Apparel 14,260 89,459 177,786 15,301 95,155 189,539Women's Apparel 5,370 33,542 67,820 5,785 35,789 72,399Men's Apparel 2,975 18,594 37,617 3,212 19,881 40,239Girl's Apparel 1,189 7,571 14,473 1,265 7,942 15,325Boy's Apparel 842 5,264 10,033 887 5,526 10,621Infant Apparel 695 4,373 8,417 749 4,709 9,106Footwear 3,189 20,115 39,427 3,403 21,308 41,848
Entertainment, Hobbies & Pets:Total Entertainment,
Hobbies & Pets15,362 94,067 195,750 16,116 97,715 203,548
Entertainment 4,579 27,321 55,804 4,785 28,284 57,908Audio & Visual Equipment/Service
6,202 38,514 79,742 6,508 40,013 82,947Reading Materials 564 3,526 8,067 607 3,748 8,528Pets, Toys, Hobbies 4,017 24,706 52,136 4,216 25,670 54,166Personal Items 11,526 73,314 156,632 12,805 80,595 171,788
Food & Alcohol:Total Food & Alcohol 59,690 374,877 759,834 66,357 413,367 839,115Food at Home 35,503 225,687 450,793 39,680 250,460 500,784Food Away From Home 20,859 128,619 266,326 23,147 141,278 293,367Alcoholic Beverages 3,328 20,571 42,715 3,529 21,629 44,963
Household:Total Household 27,327 166,854 355,566 29,218 176,535 376,341House Maintenance & Repair
5,015 30,130 63,412 5,287 31,533 66,436Household Equipment & Furnishings
10,880 66,854 140,954 11,330 68,840 145,321Household Operations 8,817 54,031 115,156 9,790 59,383 126,412Housing Costs 2,614 15,839 36,044 2,811 16,780 38,173
Transportation and Maintenance:Total Transportation and Mai 58,129 350,661 715,677 68,494 410,015 838,084
Vehicle Purchases 27,052 158,308 318,587 30,631 177,568 358,231Vehicle Expenses 1,122 7,045 16,560 1,312 8,092 19,061Gasoline 19,250 118,710 238,241 24,597 150,645 302,873Transportation 4,048 25,492 57,203 4,683 29,181 65,598Automotive Repair & Maintenance
6,655 41,106 85,086 7,270 44,528 92,322Health Care:
Total Health Care 9,602 60,931 127,794 11,215 70,392 147,232Medical Services 5,832 36,516 75,928 6,715 41,646 86,542Prescription Drugs 2,828 18,459 39,298 3,390 21,828 46,145Medical Supplies 943 5,956 12,567 1,110 6,918 14,545
20222017
Information contained herein has been obtained from sources deemed to be reliable. However, no warranties can be assumed for its accuracy.

SAN FERNANDO, 1203 N MACLAY AVE
DEMOGRAPHICSCollection Street Cross Street Dist/Dir Volume Year from Type
N Maclay Ave 0 13,220 2017 0 MPSI...Foothill Blvd Maclay St 0.08 SE 19,040 2017 0 MPSI...Foothill Blvd Maclay St 0.06 NW 25,400 2017 0.25 MPSI...N Maclay Ave 0 18,540 2017 0.27 MPSI...N Brand Blvd Lucas St 0.04 SW 1,501 2017 0.35 MPSI...N Maclay Ave 0 17,000 2017 0.37 MPSI...Maclay St Lucas St 0.03 SW 20,198 2014 0 MPSI...Foothill Blvd Harding St 0.06 SE 19,185 2017 0 MPSI...Fernmont St Adelphia Ave 0.02 SW 747 2017 0.4 MPSI...8th St Orange Grove Ave 0.05 NW 1,593 2017 0.42 MPSI...
Information contained herein has been obtained from sources deemed to be reliable. However, no warranties can be assumed for its accuracy.

Mixed-Use Development: 1203 N MaclayProposed Apartment Building: Units SF/Unit Parking/Unit
0% Lo Mod Units x 550 SF 0 SF 0.00Singles/1 Bedrooms 14 x 725 SF 10,150 SF 1.002 Bedrooms x 1,050 SF 0 SF 2.002 Bedrooms + Den 7 x 1,250 SF 8,750 SF 2.003 Bedroom x 1,325 SF 0 SF 2.00Retail 7,750 SF 7,750 SF 3 per 1,000 SF
Total Units 21 Total New Building Size 26,650 SF
Parking:For a 21 Unit Building, Parking Spaces Required 51 = 15,375 SF GarageParking Spaces Available (Less on Grade Construction) 10,250 SF
Thus 5,125 SF Additional Garage Needed300 SF/Parking Space (Parking Space SF includes all Driveways & Parking Spaces)
Property Income: Rent/SF $/Unit $/Month0 Lo Mod Units /per Unit - - 14 Singles/1 Bedrooms $2.38 /per Unit 1,725 24,150 0 2 Bedrooms /per Unit - - 7 2 Bedrooms + Den $2.36 /per Unit 2,950 20,650 0 3 Bedroom /per Unit -
Apartment Annual Gross Income 537,600 Operating Expenses Paid by Landlord (177,408)
Retail Income 2.15 /SF all Retail $16,663 199,950 5% Vacancy Reserve (36,878)
523,265 NOI
70% of Completed Project Value to be new Permanent LoanPermanent Loan to replace Construction Loan (Total Development & Construction Financing Costs): 7,441,372
30 Year Amortization with interest rate of .50% under Prime Rate 5.00% (452,452) Yrly MortgageYrly Cash on Cash Return if Held for Income 4.10% 70,812 Yrly Cash Flow
Principle Reduction Return in 1st Yr if Held for Income 8.42% 120,046 Principle ReductionTotal Investor Capital Return 12.52% 190,859 Total Return
Sale Price of Completed Project: Based on 4.75% Cap 11,016,095 $524,576 $/Unit
3.0 % Broker Compensation from Sales Price (330,483) 0.5 % Closing/Legal Costs (from Sales Price) (55,080)
Total Net Sales 10,630,531
Development Costs: Price/sf Price/Unit Building Hard Costs (including Contractor Fees) (4,530,500)$ 170 215,738 Soft Costs (932,750) 35 44,417 Closings/Legal Costs (1% of Land Price) (14,250) 679 On Grade Garage Hard Costs 10,250 SF Garage (512,500) 50 24,405 Subterranean Garage Hard Costs 5,125 SF Garage (384,375) 75 18,304 Contingency Factor (5% of Construction Costs) (272,081) 12,956 Total Development Costs (6,646,456) 249 Land Price (bought all cash) Cost/Buildable Unit $67,857 (1,425,000) 79 (Land/sf)
Total Development & Land Cost: (8,071,456)$ Total Finance Cost @ Prime rate+interest only of 2.00% over Prime Rate 5.00% (565,002) 7.00% IO Loan
Total Development & Construction Financing Costs: (8,636,458) Total Project (with Land) is Investor Capital 80% Construction Financed 6,909,167$
Profit as % of Investor Capital: 115.4% Profit as % on Total Cost: 23.1%Profit from Sale of Project 1,994,073$
33%
If H
eld
for
In
com
e:
1,727,292
80%
20%
Information contained herin has been obtained from sources deemed to be reliable. however, no warranties can be assumed for its accuracy

Mixed-Use Development: 1203 N Maclay
Site Parameters
Zoning: SP5 Width LengthApprox Lot Area: (Width x Length) 150 Feet x 120 Feet =
Alley (1/2 of Width x Length) x =Alley #2 (1/2 of Width x Length) x = 0 SFHighway Dedication (Width x Length) x =
FAR Lot Area
Buildable Unit CalculationAllowed per SF of Buildable Lot for Zoning: 1,177 SF Therefore 21 Max # Buildable Units
FARFAR with current zoning less set backs allows for max building of 27,000 SF
27,000 SF Max Building Size per FAR
Set Backs on Residential Use Stories Zoning Standards Bonuses if Any Net After BonusesSide Yard Set Back ( Deduct half from each side) 10 Feet Less Required 10 FeetFront Yard Set Back Less Required 0 FeetBack Yard Set Back 15 Feet Less Required 15 FeetMax Height 40 Feet Additional 40 Feet
Buildable Dimensions on Residential Use Stories (Lot Less Set Backs)Buildable Lot Width 135 FeetBuildable Lot Length 110 Feet
Buildable Lot Area on Residental Use Stories Width Length135 Feet x 110 Feet =
Buildable Lot Area on Commercial Use Stories Width Length150 Feet x 120 Feet =
18,000 SF
14,850 SF
0 SF
18,000 SF
0 SF
1.50
18,000 SF
Information contained herin has been obtained from sources deemed to be reliable. however, no warranties can be assumed for its accuracy