san diego county trauma system 20-year report€¦ · emergency medical services ... trauma patient...
TRANSCRIPT
County of San Diego Board of Supervisors Greg Cox, District 1 Dianne Jacob, District 2 Pam Slater, District 3 Ron Roberts, District 4 Bill Horn, District 5 Walter F. Ekard Chief Administrative Officer Jean M. Shepard., Director, Health and Human Services Agency Nancy Bowen, M.D., M.P.H. Public Health Officer
Gary M. Vilke, M.D., F.A.C.E.P Medical Director, Emergency Medical Services
County of San Diego Health and Human Services Agency Emergency Medical Services
San Diego County Trauma System 20-Year Report
December 2004


San Diego County Trauma System
20-Year Report


Table of Contents
San Diego County Trauma System 20 Year Report Page i
Table of Contents
Chapter 1: Perspectives on the San Diego County Trauma System................................................1 Chapter 2: History of the Trauma System.....................................................................................21 Trauma System History .....................................................................................................21 Timeline .............................................................................................................................23 Chapter 3: System Overview .........................................................................................................27 Introduction........................................................................................................................27 Trauma Registry Data ........................................................................................................30 Trauma Patient Outcomes ..................................................................................................31 Chapter 4: Severe Trauma Patients ................................................................................................33 Severe Trauma Patients......................................................................................................33 Transportation-Related Injuries .........................................................................................39 Motor Vehicle Occupant Injuries.......................................................................................40 Motorcyclist Injuries..........................................................................................................41 Pedalcyclist Injuries ...........................................................................................................42 Pedestrian Injuries..............................................................................................................43 Fall Injuries ........................................................................................................................44 Self-Inflicted Injuries .........................................................................................................46 Assault Injuries ..................................................................................................................48 Chapter 5: Traumatic Deaths .........................................................................................................51 Death from Trauma ............................................................................................................51 Transportation-Related Deaths ..........................................................................................54 Motor Vehicle Occupant Deaths........................................................................................55 Motorcyclist Deaths ...........................................................................................................56 Pedalcyclist Deaths ............................................................................................................57 Pedestrian Deaths ...............................................................................................................58 Fall Deaths .........................................................................................................................59 Suicide ...............................................................................................................................61 Homicide ............................................................................................................................63

Table of Contents
Page ii San Diego County Trauma System 20 Year Report
List of Tables
Table 3-1: Trauma Center Admissions by Fiscal Year.................................................................27 Table 3-2: Trauma Center Admissions by Injury Type ................................................................28 Table 3-3: Total MTOS Patients and Trauma Center Admissions ...............................................30 Table 3-4: Trauma Patient Outcomes by Injury Severity Score ...................................................31 Table 4-1: Severely Injured (ISS>9) Trauma Patient Outcomes by Fiscal Year, FY 1986/87 – 2002/03 .......................................................................................................33 Table 4-2: Number of Severely Injured (ISS>9) Trauma Patients by Cause of Injury, FY 1986/87 – 2002/03 .......................................................................................................35 Table 4-3: Severe Injury Rates by Cause of Injury, FY 1986/87 – 2002/03 ................................36 Table 4-4: Severe Injury Rates by Age Group, FY 1986/87 – 2002/03 .......................................37 Table 4-5: MVO Severe Injury Rates by Age Group, FY 1986/87 – 2002/03 .............................40 Table 4-6: Motorcycle Severe Injury Rates by Age Group, FY 1986/87 – 2002/03 ....................41 Table 4-7: Pedalcycle Severe Injury Rates by Age Group, FY 1986/87 – 2002/03 .....................42 Table 4-8: Pedestrian Severe Injury Rates by Age Group, FY 1986/87 – 2002/03......................43 Table 4-9: Fall Severe Injury Rates by Age Group, FY 1986/87 – 2002/03 ................................44 Table 4-10: Fall Severe Injury Rates by Age Group, Older Adults, FY 1986/87 – 2002/03 .......45 Table 4-11: Self- Inflicted Severe Injury Rates by Age Group, FY 1986/87 – 2002/03 ...............46 Table 4-12: Self- Inflicted Severe Injury Rates by Cause of Injury, FY 1986/87 – 2002/03 ........47 Table 4-13: Assault-Related Severe Injury Rates by Age Group, FY 1986/87 – 2002/03...........48 Table 4-14: Assault-Related Severe Injury Rates by Cause of Injury, FY 1986/87 – 2002/03....49 Table 5-1: Number of Deaths from Trauma by Cause of Injury, FY 1988/89 – 2002/03 ............51 Table 5-2: Traumatic Death Rates by Cause of Injury, FY 1988/89 – 2002/03 ...........................52 Table 5-3: Traumatic Death Rates by Age Group, FY 1988/89 – 2002/03 ..................................53 Table 5-4: Transportation-Related Death Rates by Cause, FY 1988/89 – 2002/03 .....................54 Table 5-5: MV Occupant Death Rates by Age Group, FY 1988/89 – 2002/03............................55 Table 5-6: Motorcycle Death Rates by Age Group, FY 1988/89 – 2002/03 ................................56 Table 5-7: Pedestrian Death Rates by Age Group, FY 1988/89 – 2002/03..................................58 Table 5-8: Fall Death Rates by Age Group, FY 1988/89 – 2002/03 ............................................59 Table 5-9: Traumatic Suicide Rates by Age Group, FY 1988/89 – 2002/03 ...............................61 Table 5-10: Traumatic Suicide Rates by Cause of Injury, FY 1988/89 – 2002/03 ......................62 Table 5-11: Traumatic Homicide Rates by Age Group, FY 1988/89 – 2002/03..........................63 Table 5-12: Traumatic Homicide Rates by Cause of Injury, FY 1988/89 – 2002/03...................64

Table of Contents
San Diego County Trauma System 20 Year Report Page iii
List of Figures
Figure 3-1: Rates of Blunt and Penetrating Injury by Fiscal Year ..............................................29 Figure 4-1: Percent of Severely Injured Trauma Patients Expired, FY 1986/87 – 2002/03.........34 Figure 4-2: Severe Injury Rates by Age Group, FY 1986/87 – 2002/03 ......................................37 Figure 4-3: Age Distribution of Severely Injured Trauma Patients by Fiscal Year .....................38 Figure 4-4: Transportation-Related Severe Injury Rates by Cause, FY 1985/86 – 2002/03 ........39 Figure 4-5: Motor Vehicle Occupant Severe Injury Rates by Age Group, FY 1986/87 – 2002/03 ................................................................................................40 Figure 4-6: Motorcycle Severe Injury Rates by Age Group, FY 1986/87 – 2002/03 ..................41 Figure 4-7: Pedalcycle Severe Injury Rates by Age Group, FY 1986/87 – 2002/03....................42 Figure 4-8: Pedestrian Severe Injury Rates by Age Group, FY 1986/87 – 2002/03 ....................43 Figure 4-9: Fall-Related Severe Injury Rates by Age Group, FY 1986/87 – 2002/03 .................44 Figure 4-10: Fall-Related Severe Injury Rates to Adults 45 Years and Older, FY 1986/87 – 2002/03 .............................................................................................45 Figure 4-11: Self-Inflicted Severe Injury Rates by Age Group, FY 1986/87 – 2002/03..............46 Figure 4-12: Self-Inflicted Severe Injury Rates by Cause, FY 1986/87 – 2002/03......................47 Figure 4-13: Assault-Related Severe Injury Rates by Age Group, FY 1986/87 – 2002/03 .........48 Figure 4-14: Assault-Related Severe Injury Rates by Cause, FY 1986/87 – 2002/03 .................49 Figure 5-1: Traumatic Death Rates by Age Group, All Causes, FY 1988/89 – 2002/03 .............53 Figure 5-2: Transportation-Related Traumatic Death Rates by Cause, FY 1988/89 – 2002/03...54 Figure 5-3: Motor Vehicle Occupant Death Rates by Age Group, FY 1988/89 – 2002/03 .........55 Figure 5-4: Motorcycle Death Rates by Age Group, FY 1988/89 – 2002/03...............................56 Figure 5-5: Pedalcycle Death Rates, FY 1988/89 – 2002/03........................................................57 Figure 5-6: Pedestrian Death Rates by Age Group, FY 1988/89 – 2002/03 ................................58 Figure 5-7: Fall Death Rates by Age Group, FY 1988/89 – 2002/03 ...........................................59 Figure 5-8: Fall Death Rates by Age Group, Older Adults, FY 1988/89 – 2002/03 ....................60 Figure 5-9: Fall Death Rates by Level of Fall, FY 1988/89 – 2002/03 ........................................60 Figure 5-10: Traumatic Suicide Rates by Age Group, FY 1988/89 – 2002/03 ............................61 Figure 5-11: Traumatic Suicide Rates by Cause, FY 1988/89 – 2002/03 ....................................62 Figure 5-12: Traumatic Homicide Rates by Age Group, FY 1988/89 – 2002/03 ........................63 Figure 5-13: Traumatic Homicide Rates by Cause, FY 1988/89 – 2002/03 ................................64


Perspectives Chapter 1
San Diego County Trauma System 20 Year Report Page 1
Perspectives
Prior to the establishment of the San Diego County Trauma System: "If you are seriously injured on a major highway in San Diego, you have less chance of surviving than a Marine seriously injured in Viet Nam." Dick Virgilio, MD 1977 After twenty years as a system: “The San Diego County Trauma System is the envy of the nation.”
Vice Admiral Richard H. Carmona, M.D., MPH, F.A.C.S.
Surgeon General of the United States Public Health Service
2004
The San Diego County Trauma System is unique in that it is a true collaborative effort. The following section contains the reflections of those physicians and nurses currently involved in the system.

Chapter 1 Perspectives
Page 2 San Diego County Trauma System 20 Year Report
David B. Hoyt, MD
UCSD Medical Center One of the fondest memories I will have when I retire 10-15 years from now is the opportunity I had to participate with all the trauma directors, nurse coordinators, and county staff in the Medical Audit Process of San Diego County. On this 20th anniversary, this stands out in my mind as one of the most important things that has made it successful and I hope we will all recommit to this important effort over the next ten years. This is one thing that we have done better than anyone and it’s one of the most important things that makes us a unique trauma system. David B. Hoyt

Perspectives Chapter 1
San Diego County Trauma System 20 Year Report Page 3
Raul Coimbra, MD UCSD Medical Center
We are all aware of how great the San Diego Trauma System is. People all over the world cite our system’s QI process, organization, and results as being one of the greatest if not the greatest of all. However, only being part of it and working in it on a daily basis gives the exact idea of what we have, who we are, what we represent to the community, and how much we need to preserve what is in place. As we celebrate the 20th anniversary, we have a lot to be proud of, but we cannot forget that there is a lot more that can be done and improved, particularly in the areas of research and prevention. The beauty of the system is the ability we have to work as a group, to accept criticism, to make changes based on our peer review process, and collectively move on. As we enter the third decade of the system’s existence we will face financial, strategical, and political challenges. Working together, staying united and focused on our mission will get us through those challenges.

Chapter 1 Perspectives
Page 4 San Diego County Trauma System 20 Year Report
Peggy Hollingsworth-Fridlund, BSN, RN UCSD Medical Center
A Nurse Manager's Perspective The San Diego Trauma System is really like no other trauma system in the world and it is world famous. People from other states and countries have no idea how large the county is. Once they consider the total coordination of trauma care with all hospitals and multiple types of pre-hospital models for a county approximately the size of a small US state, they are amazed. My perspective is one of having been with the system from the beginning since its' official initialization in August 1, 1984. All the involved personnel - fire, paramedic, hospitals, community programs - had been working towards making everything ready for the August date; however the real first test of the system was prior to that date and occurred with the infamous McDonald's mass shooting in July 1984. Because of how all the elements of the system worked together that day to triage patients and manage them in trauma hospitals, I knew every healthcare provider involved was committed to a team approach to injured patients in San Diego County. Since its beginning in 1984 the people involved in the system have strived to continuously improve all aspects in every phase of care; pre-hospital, resuscitation, acute care, outpatient and rehabilitation not to forget public outreach, education and prevention. Peggy Hollingsworth-Fridlund, BSN, RN Trauma Division UCSD Medical Center

Perspectives Chapter 1
San Diego County Trauma System 20 Year Report Page 5
Michael J. Sise, MD Scripps Mercy Hospital
Reflections on the twenty years of the San Diego County Trauma System
Every day of the San Diego County Trauma System’s first 20 years has seen countless acts of courage, commitment and compassion by the professionals who created and sustained this precious community asset. From the dispatchers at the 911 call center, to the paramedics who answer those calls, to the trauma teams waiting at our six trauma centers, to the EMS staff who keep it all running, we’ve been blessed in San Diego to have men and women of exceptional ability watching over us and our families. Excellent results in the care of the injured don’t just happen, they are earned. The future of our Trauma System will depend upon the same professionalism and commitment that made the first 20 years possible. Each of us who is dedicated to this system is keeping the promise we made to be there for the injured in their hour of need and to hold ourselves accountable to the highest possible standards. There have never been, nor will there ever be, easy days in Trauma. The only certainty is that the community will always need men and women who know what it is to overcome the often overwhelming challenges that caring for the severely injured involves. Michael J. Sise, MD Trauma Medical Director Scripps Mercy Hospital

Chapter 1 Perspectives
Page 6 San Diego County Trauma System 20 Year Report
Dot Kelley, MSN, RN, CEN Scripps Mercy Hospital
San Diego Trauma System 20th Anniversary
In 1984 San Diego was mostly thought of as a seaside destination characterized by a naval base, tourist attractions and great weather. But, over the last two decades it’s grown into a dynamic metropolitan area of almost three million citizens who justifiably think of their home as America's Finest City. Those same twenty years also produced stunning growth in what was once an embryonic emergency medical response team, but now may well be America's Finest Trauma System. The key element in that growth was the initial vision of the County Board of Supervisors. The idea of coordinating municipal resources with 6 different medical centers to reduce preventable death from traumatic injuries was unprecedented and ambitious twenty years ago. By focusing on collaborative efforts between County EMS Administration, prehospital providers, and the existing trauma centers, San Diego’s healthcare professionals were able to cast a wider, and significantly more effective, medical safety net. Nowhere is that ability more apparent than in our Medical Audit Committee process. Trauma staff from the individual Trauma Centers set aside corporate labels to focus on quality-of-care issues and ensure they are discussed openly and objectively. The sole purpose of this process is to improve patient care every day. That focus, practiced so routinely here, is without equal anywhere in the country. This special partnership of public and private resources enables each organization to look beyond individual interests and competitive business strategies, and instead focus on one common purpose, continuously improving the trauma care provided to the people of San Diego. Dot Kelley, MSN, RN, CEN Director, Trauma Services Scripps Mercy Hospital

Perspectives Chapter 1
San Diego County Trauma System 20 Year Report Page 7
Brent Eastman, MD, FACS Scripps Memorial Hospital – La Jolla
Trauma Reflections
Brent Eastman, MD, FACS
Twenty years ago, in 1984, I was a proud partner in two of the most satisfying creations of my life: that of the San Diego Trauma System and of my only daughter, Alexandra. I had come to San Diego twelve years before, direct from the San Francisco General Hospital (SFGH) which was at that time the single great trauma receiving hospital of the city and county of San Francisco. Ambulance drivers picked up their victims all over town and sped directly to the famous “Mission Emergency” at SFGH – with no thought of stopping at the many community hospitals along the way without a committed staff standing by to save a life. We young surgeons at “The Mission” in that era were baptized by immersion in trauma, and we left our training with an abiding passion for the care of injured patients. So that when I arrived in San Diego in 1972, I became aware of the fragmentation of trauma care in our County. Here, injured patients were taken to the nearest hospital, regardless of the nature of the calamity or the resources available to treat them. It was the luck of the draw – if you were in danger of bleeding to death from a ruptured liver or spleen, the ED you entered might or might not be able to locate the surgeon on call, have staff trained to resuscitate, or even have a lab tech at work after midnight. Injured patients arrived at hospitals alive, only to die anyway of what the newspapers still called “internal injuries” – meaning that no surgeon had even determined the cause of death. I was one of a handful of young physicians fresh from training where things were done differently – San Francisco, Viet Nam - and we slowly found one another and began plotting to build a new system. The political hurdles were formidable. We were aided in our quest by publication of the sentinel autopsy study by Trunkey and West comparing the preventable death rate in San Francisco, which had a trauma system, and Orange County, which did not. As expected, the study showed a 20-fold increase in preventable deaths (i.e., deaths of persons who could have been saved with prompt care) in our northern neighbor, Orange County. When the major political debate over trauma care erupted in San Diego, a similar investigation, the Amherst Study was conducted here – and again, the results were the same. Injured patients in San Diego were 20 times more likely to die unnecessarily than in cities with an organized trauma system. An interesting and compelling bit

Chapter 1 Perspectives
Page 8 San Diego County Trauma System 20 Year Report
of data from the Amherst Study was that it was not a matter of good and bad hospitals: the preventable deaths were spread among all thirty hospitals in the County with EDs. Rather it was the lack of a system which ensured that patients were transported directly to designated trauma centers with the resources immediately available to care for any injury. Out of several years of turbulent, impassioned discussions, studies and debates, the San Diego Trauma System was born. To fast forward, the rest, as they say, is history. The San Diego County Trauma System has evolved as a model for the nation and the world. Our system addresses the continuum of care from prevention, to acute care, and through rehabilitation and palliative care. Today the trauma system is also an integral part of our comprehensive San Diego Disaster Preparedness Plan, This grand accomplishment only happened because of the hard work of a committed multitude – people who were there at the turbulent beginning and have been there every day and night for the last twenty years. At this time of a “broken” health care system in the United States, I believe that the San Diego County Trauma System stands as a beacon of optimal medical care.

Perspectives Chapter 1
San Diego County Trauma System 20 Year Report Page 9
Fred J. Simon, Jr, MD
Scripps Memorial Hospital –La Jolla
Reflections
A Trauma System-commitment with the diversity, excellence, integrity of a cooperative team that has endured two decades for a single purpose. As this system enters the third decade of success, it is the human hands of cooperation, collegiality and single unified goal minded team approach which is the most remarkable accomplishment. It is hard to find in history the same partners in an endeavor that is altruistic to mankind that has endured the many years of participation. With the values of trust, honesty, cooperation, integrity, quality assurance and improvement, I applaud the county government participants, the administrators, nurses, physicians, pre-hospital personnel on CHARACTER. This system bespeaks of character and integrity which is the legacy and the example to all healthcare systems and to the general public as a whole. The system works using the best values of life to defeat a significant problem that faces human kind. I appreciate this system and my colleagues for all you have done as a unified cooperative team. Fred J. Simon, Jr, MD Director of Trauma Scripps Memorial Hospital –La Jolla
Chapter 1 Perspectives
Page 10 San Diego County Trauma System 20 Year Report
Cheryl Wooten, MSN, RN, CNRN Scripps Memorial Hospital-La Jolla
Reflections of the Past 20 Years of the San Diego County Trauma System
As I reflect back of the past 20 years of the Trauma System in San Diego County, I am thankful every day that our leaders within our trauma centers, the county partners and County Board of Supervisors had the foresight and vision to see the future of a Trauma System within the county. I am grateful to have the opportunity to work in a system that has been viable for so long. I have seen our system grow and contribute not only to each of our centers, the county and the state, but to the national and international community as well. While I was not directly involved in the implementation and designation years, I have been intimately involved since 1984, when Scripps Memorial Hospital-La Jolla was designated as one of the six trauma centers in the county. I joined the La Jolla Trauma Team in 1985. During my 23 years at Scripps, I have been the acting trauma program manager on numerous occasions, and had the opportunity to attend many of the trauma meetings. Now as the manger of the trauma program, I have the opportunity to attend those same meetings and directly contribute to the continued success of our system. I remember those early years and those tedious Pre-MAC meetings. Discussing the 20 minute transport time of the pre-hospital providers and how that time could be shortened. Over time we gained experience, knowledge and comfort that we did not need to spend all those long hours meeting in a room together. We learned that we could accomplish the same thing by turning in our information and having the trauma directors review it. Now we no longer have the Pre-MAC meeting, we simply turn in our books for review. I remember discussing every complication at the very long and arduous MAC meetings, so that we might learn how we might prevent them from occurring. Again which experience and comfort our MAC meetings are three hours in nature and are focused on more specific issues. In the future, as we have talked about previously in our MAC meetings, I hope that we will be able to utilize the data that we have obtained over the last 20 years and develop more specific policies, protocols, and guidelines which we all will use in our centers. That would be most beneficial in really setting the standard. I remember the first review we had by the American College of Surgeons, Committee on Trauma (COT) review team. I wondered if we had provided all of the information for the review team and if our own presentation of the quality information was satisfactory. I later learned that at each of our reviews thereafter, we must have done something that they liked. We later learned from our Trauma Directors, that what we had done in San Diego for our review had been recommended to others in the nation for inclusion on “How it Should Be Done”. I felt flattered that a national reviewing agency would think that San Diego was doing it right. I am proud that in some way we have contributed to a national standard. Each time we underwent our review, we tried to not only make it easy for ourselves, but for our reviewers as well by having all of the information in one spot so they wouldn’t have to hunt for it in numerous binders.
Perspectives Chapter 1
San Diego County Trauma System 20 Year Report Page 11
I am also reminded that San Diego contributed to the development of a standard complication list with specific definitions so everyone in San Diego was using the same definitions for our complications. Much of what San Diego County Trauma System did was noted at the COT when A. Brent Eastman, MD, FACS, Trauma Director at Scripps Memorial and David Hoyt, MD, FACS, Trauma Director at UCSD held the prestigious national position of Chairman for the Committee on Trauma. Through their leadership and experience others across the country and internationally have incorporated many of these ideas and standards into their own practices. Thanks to much hard work by everyone in San Diego, the national and international trauma community soon recognized that San Diego was a system to be closely looked at, if not emulated. Since those early years, when we all “hung in there” together, our efforts have been rewarded by others wanting to come and see how things are done in San Diego. I appreciate very much what Brent and David have done for our system on a national level. I am also proud of all the previous Trauma Directors and Trauma Program Managers. The hard work and sacrifices that they made during those early years ensured that today we remain a cohesive system. Without those early efforts and the efforts of all of us who have followed, our system might have a much different look, or be non-existent. Our community is enriched by having such an organized system in place thereby ensuring that many more lives would be saved than lost. So HAPPY BIRTHDAY San Diego Trauma System and thank you for allowing me to play a small part in ensuring the continued success of our system. Cheryl Wooten, MSN, RN, CNRN Trauma Program Manager Scripps Memorial Hospital-La Jolla

Chapter 1 Perspectives
Page 12 San Diego County Trauma System 20 Year Report
Frank Kennedy, M.D. Sharp Memorial Hospital
REFLECTIONS ON TRAUMA SYSTEM
The initiation of a great organization has two major parts. One is having a worthwhile cause. The other is having good people to promote and support that cause. The trauma system in San Diego has both. It has been scientifically supported for many years that the implementation of trauma systems results in better outcome and lives saved. When the trauma system was initiated here in San Diego, nationally recognized leaders in trauma participated in the organization. Once a successful organization is up and running and working well, it depends less on a given individual and more so of a critical mass and momentum of a strong system. When I came here in 1997 it was clear that the San Diego trauma system was exactly that; an extremely well run system with many working parts, all of who were “well oiled and well maintained”. Critical to a mature trauma system or a mature organization of any kind, is that after the initial enthusiasm has diminished and the initial start up individuals have gone away, that it be continued and maintained at a high level. Indeed, it is clear that after 20 years of a trauma system being in place, this has been the case in San Diego. Despite the extreme pressures on hospitals and physicians in this region for a number of sociodemographic and economic reasons, the trauma system in San Diego has been maintained. Not only has it survived but also it has survived essentially intact without major revisions in its hospital participation, governmental oversight and quality assurance process. This speaks to the great commitment of all involved. However, in addition, the healthcare systems that are typically in competition in most arenas have worked to have a healthy cooperation moving toward one goal. That is to optimize and maintain superlative trauma care delivery to our county of now 3 million people. Finally, a true test of a strong organization is being able to adapt, survive and thrive in a changing environment. Clearly that is the case with the healthcare delivery in Southern California. As the Trauma Medical Director at Sharp Memorial Hospital, I look forward to working with my colleagues within Sharp and throughout the trauma system to face the many challenges as we move into the future. Frank Kennedy, M.D. Medical Director, Trauma Service Sharp Memorial Hospital

Perspectives Chapter 1
San Diego County Trauma System 20 Year Report Page 13
Kathi Ayers, MSN, CFNP, RN
Sharp Memorial Hospital How did Florence Nightingale survive being a Trauma Coordinator? The Nightingale Pledge “I solemnly pledge myself before God and presence of this assembly; to pass my life in purity and to practice my profession faithfully. I will abstain from whatever is deleterious and mischievous and will not take or knowingly administer any harmful drug. I will do all in my power to maintain and elevate the standard of my profession and will hold in confidence all personal matters committed to my keeping and family affairs coming to my knowledge in the practice of my calling. With loyalty will I endeavor to aid the physician in his work, and devote myself to the welfare of those committed to my care.” It was 33 years ago that as a “probie” I took a pledge named after Florence Nightingale. The ceremony remains in my memory as if it was yesterday and I continue to revere my official school cap that I received that night. Now, after a 30-year career, nearly all of it in trauma nursing, I am still passionate about the specialty of trauma nursing but question if I should continue as a trauma coordinator. Am I stale or a little “fried around the edges”? Do I need a role change, an attitude adjustment, a vacation, a few more FTE’s or a maybe just a few less site surveys? Perhaps I need to reconnect with the reasons I became a nurse and later Trauma Coordinator. For whatever reason, I decided to read some of the historical information written about Florence Nightingale. As I read excerpts from her writings and biographies, the similarities of her role and the issues she dealt with and that of today’s Trauma Coordinator seemed strikingly similar! How did she survive? Here are some comparisons of her philosophy and actions with similar challenges and resulting questions facing the modern Trauma Coordinator. Administrator/Leader: Florence Nightingale was born into wealth and privilege. She was well educated in the arts. Her father planned for her to travel and to live the life of an aristocrat. In that era, nursing was far from a respectable or safe profession for women. Determined to do something of value with her life, she was willing to break the rules established for women of her day. There were few nurses and she worked tirelessly to develop, recruit and retain the quality and quantity of women into the nursing profession. As it is true for all of nursing, Trauma Programs throughout the country are experiencing a trauma nursing shortage. Do you know why nurses are attracted to trauma nursing? When you hire personnel do you have a profile of the nurse best suited for trauma nursing? Do you have a plan to retain nurses for the trauma program? Are you willing to serve as a mentor and coach? Does the hospital collect and provide you with the information that identifies why trauma nurses are leaving? Do you have a plan to provide the trauma nurse with the diverse clinical skills to deal with the challenges and chaos of trauma nursing? We must do our best to recruit and retain trauma nurses. Nurses should remain because we have instilled the love of trauma nursing as a specialty, not because it is familiar or comfortable.

Chapter 1 Perspectives
Page 14 San Diego County Trauma System 20 Year Report
Liaison: Ms. Nightingale respected the chain of command and believed in doing things quietly, working behind the scenes on conflicts, rather than airing them in the presence of many others. Although at times she was described as a “turbulent” character, her goal was to be a person who facilitated conflict resolution. The trauma program is often known as a “disruptive service”. Other services may refer to the program as “the fair-haired child that causes sibling rivalry.” Are you using wisdom and stamina to guide the program effectively? Do you have the courage to delegate when it is not popular, admit defeat or profess your humility? Are we doing our best to acknowledge others when they play a role in promoting the Trauma Program? Do you have a recognition program for “trauma MVP’s”? Do the nurses have the communication skills to deal with the conflicts that arise with even the simplest things like needing a bed--now? Do you have committees in place with the appropriate representation to resolve process issues that need changing? Expert Clinician: Ms. Nightingale is quoted as saying, “ If you cannot get the habit of observation one way or other, you had better give up being a nurse, for it is not your calling, however kind and anxious you may be.” She not only nursed adults, but children as well. Her initial experiences came from working in the battlefields of the Crimean War where her patients were mostly young males injured from penetrating trauma. She worked in a war zone with minimally trained nurses with limited experience. Sound familiar? She studied diligently to develop her skills in observation and assessment. She believed that until pain and suffering were controlled, the patient could not accurately be evaluated. She also recognized the necessity of good nutrition for healing and the need to be compassionate yet controlled in the face of suffering. To her, light was important in the patient’s recovery. It is interesting that JCAHO now mandates the solutions to problems that have been recognized for over a century. For example, Intensive Care Units are now required to have windows that help to deter sensory deprivation. Do your trauma clinicians incorporate all aspects of the patient into their care? Do they focus on the technology and not the touch? Is mouth care as important as A-line calibration? When the patient is in the trauma room, do you pain medicate as soon as possible? Do you have a bereavement program? Are multidisciplinary rounds a part of the patient’s care planning? Do you make time to keep the family informed of the patient’s plan and progress? Have you reviewed the literature for best practice models? Educator: She wrote, “…nor nurses of hospitals are taught anything about those laws assigned to the relations of our bodies with the world.” Florence Nightingale was student of the disease process and believed it was necessary that the nurse be educated. She used her influence to convince hospitals to improve the training of the nurses. Trauma Coordinators today are urging administrators to maintain the education budgets for trauma nurse education. In an effort to further standardize the education of trauma nurses across the nation, the Society of Trauma Nurses has developed the Advanced Trauma Core Nursing (ATCN). Do you have an educational reimbursement program or do you offer scholarships for nurses interested in trauma education programs? Are you willing to be a preceptor for schools of nursing or other health care professionals? Are you willing to publish articles in your area of expertise? Have you met with the trauma nurses in your facility to assess the educational needs and professional growth opportunities? Do you realize that every nurse that touches the patient is a trauma nurse? Do you have succession planning built into your position?

Perspectives Chapter 1
San Diego County Trauma System 20 Year Report Page 15
Quality/Researcher: She stressed, “Whereas, if you could but arrange that the thing should always be done whether you are there or not, then he (the patient) need never think about it.” In other words, there should be standards of practice, policies and procedures, and a systematic way of doing things. Ms. Nightingale was an innovator in the systematic collection, tabulation, interpretation and trending of data. She was able to graphically display her statistics and is known for developing the pie chart! On return from the Crimean war she collected data that demonstrated a high mortality rate from preventable disease. Through her tireless efforts to improve the art of nursing, the mortality rate among the sick and wounded was reduced from 420 per thousand to 22 per thousand. She understood how room ventilation was key to the patient’s return to health. In fact, the nurses were taught to raise the windows for ventilation and the physicians would come by and close them! Maybe this was the beginning of the first trauma coordinator and trauma medical director “ I told you so”. As we budget for negative airflow rooms, and work to prevent infection and the unnecessary use of antibiotics, I marvel at her foresight. Her writings contained comments on prevention of pressure ulcers through placement of pillows and turning the patient frequently. It is told that she once expressed that even one pressure ulcer was too many and the development of a pressure ulcer was a direct reflection of the nursing care received. You go, Flo! Skin care has been my personal soapbox since my diploma nursing school days. Several years ago our facility developed a trauma patient profile for those at risk for pressure ulcers. Do you have documentation standards regarding backboard times? Does the OR have standards of care for padding trauma patients? How many of you have incorporated skin issues as a part of daily trauma rounds? Do nurses recognize the importance of the bath as a means to assess and cleanse the skin? Do you review the literature for evidence based practice models? Does your library have publications such as the Journal of Trauma Nursing? Are the nurses encouraged to be involved in research projects? Finance: Ms. Nightingale believed in being thrifty. It is a well-known fact that trauma care is expensive and is a target for cost cutting. Each year the budget planning process becomes more difficult. Sources of funding are scarce. Is there a trauma utilization facet to the your trauma program? Is the program being as cost effective as possible? Are you working to pursue alternative revenues or sources of funding for program opportunities? Do employees have performance improvement standards for cost containment as a part of their annual performance evaluation? Do the trauma surgeons take part in the discussions regarding cost containment? Do you have reports that are easily interpreted and useful for cost containment? Advocate: Through her advocacy, the stature of nursing was raised to a medical profession with high standards of education and important responsibilities. She was adamant that nursing be placed entirely under the direction of the physician. Okay, so she didn’t have the vision for advanced practice nurses! She believed strong female leadership and discipline would protect the nurses from sexual harassment by the physicians, male patients, and other male employees. She was responsible for obtaining the respect the nursing profession deserved.

Chapter 1 Perspectives
Page 16 San Diego County Trauma System 20 Year Report
How many of you are working on a policy for physician behavior standards or have been to human resources due to the sexual harassment of a nurse? Have we created the mutual respect and collegial relationships necessary to be seen as an equal voice with our physician partners? At this time the Society of Trauma Nurses collaborates with the American College of Surgeons and other professional organizations to further the cause for trauma systems, patients, and health care professionals. Are you a member of your professional organization? Community Servant/Volunteer: Ms. Nightingale did not receive a salary for much of the work she did during her career. After serving her country with the military in the Crimean War, it is believed she suffered from Post Traumatic Stress Disorder. In spite of being bedridden most of her later life, she always seized the opportunity to use her influence and writings for change. Do you volunteer to help in your community even for both trauma and non-trauma events? Does the community understand the concept of trauma programs and systems? Are you able to get community support for issues impacting the trauma program? Do you work with the media in your area to highlight prevention education topics or legislative issues? Are you a member of a speaker’s bureau? Balance: “The most devoted nurse cannot always be there. Nor is it desirable that she should be.” Florence Nightingale taught the importance of the nurse to fully recognize the fact that she could not always be with her patient and that it was greatly to the advantage of the patient that the nurse keep in good health. She instructed it was incumbent upon the nurse to arrange for proper rest and exercise. In the mid-nineties, hospitals were downsizing, rightsizing and capsizing. Now, we are asked to address the issues of downshifting. We are all trying to go at a slower pace, stop to smell the roses, realize there is more to life than work, or understand that our younger personnel want quality of life. We must address employee satisfaction. Can we change our processes and still maintain the integrity of the program? Have you read any of the books that discuss workaholics or finding balance? Have you taken courses in being organized, delegating, or setting priorities? Do you use available technology to make your life easier? Do you realize that taking time off may increase your productivity? What I have learned through my journey of the Nightingale literature is that I still love the challenge, the chaos, the crisis, and the conflict that comes with and draws me to the trauma coordinator role. I laugh when I think that I once pictured myself as a hamster on a wheel. If I just worked faster, I could get ahead. Recently I spotted a T-shirt with the phrase “the hamster is dead”. Now that was a rude awakening! There is still work to do. This role didn’t kill Florence so I guess it won’t kill me. But, I now see that I need a little more fresh air, sunlight, a healthier diet, exercise, time off and a warm cleansing bath. There, now Florence would be proud. Kathi Ayers, MSN, CFNP, RN Trauma Program Manager Sharp Memorial Hospital

Perspectives Chapter 1
San Diego County Trauma System 20 Year Report Page 17
Barry LoSasso, M.D. Children’s Hospital and Health Center
The Trauma Program at Children’s Hospital has been, for twenty years, a cornerstone of our institutional commitment to “restore, sustain and enhance the health and developmental potential of children.” The uniqueness of this clinical program lies in the community commitment we share with the County Department of Health and Human Services, the pre-hospital providers and our adult trauma center and community hospital partners. Together through our tireless commitment to clinical excellence and improvement, we have saved the lives of countless children, our community’s most precious resource. Children’s Hospital would like to thank the County Board of Supervisors for their vision, which inspired the Trauma System 20 years ago, and their enduring commitment to the health of our community. Barry LoSasso, M.D., Trauma Medical Director, Children’s Hospital

Chapter 1 Perspectives
Page 18 San Diego County Trauma System 20 Year Report
Sue Cox, RN, MS
Children’s Hospital and Health Center The Importance of Prevention Reflecting on the 20th Anniversary of the San Diego Trauma System is especially satisfying to those of us who have been in the trauma hospitals for the entire time and have had the privilege of watching our system mature and improve over time. Twenty years ago, there was no defined model of trauma care. San Diego leaders had to make it up as they went along. During the early years, the focus was appropriately on clinical and rehabilitative care--developing and refining protocols and collaborating with each other to provide the best care possible to our patients and families and measuring the effectiveness of our care. Through the hard work and commitment of many people, the San Diego County Trauma System has been recognized for many years as one of the premier trauma models in the world with regard to providing optimal clinical care to injured patients. But a trauma system is more than providing clinical care to patients. It must include components such as education, research and injury prevention strategies. We can all be proud that our system has embraced and met these challenges also. San Diego physician and nurse leaders were instrumental in the development of both the medical and nursing basic educational models for trauma care: ATLS and TNCC. San Diego trauma research projects have been, and continue to be, conducted and published to expand the trauma body of knowledge. Most importantly, however, the San Diego Trauma System has taken very seriously it's role in the primary prevention of injuries in our county and country. The San Diego County Trauma leaders have crafted an effective and dynamic approach to injury prevention appropriate to the fickle funding related to such activities. We have asserted ourselves as advocates locally and nationally providing data and spokespersons to support and retain legislation aimed at reducing preventable injuries. Helmet, seat belt and child safety seat laws have all been effective in reducing serious head injuries in our region. Injury prevention education in schools and community groups and development of a strong and effective partnerships with the media are some of the strategies that have been employed to increase awareness of the preventability of many serious injuries. Effective coalitions have been developed and sustained over many years with the sole focus of public education and advocacy in injury prevention. While it will never be possible to prevent every traumatic injury, we can and will continue to do everything we can to prevent as many as possible. Sue Cox Trauma Program Manager Children’s Hospital and Health Center

Perspectives Chapter 1
San Diego County Trauma System 20 Year Report Page 19
Beverly Neal, CCRN, BSN Palomar Medical Center
Trauma Care in the 21st Century
As we embark on the next 20 years of trauma care in San Diego County we reflect on the past to understand how far we have come. Those that have been instrumental in providing the opportunities for our high quality of trauma services know who they are. It has been through their perseverance, dedication, vision, and high regard for our citizens that San Diego is viewed as one of the founding fathers of the trauma systems in our country, and for that I thank you. We should be very proud and take a moment to recognize our accomplishments.
We are facing financial challenges and a shortage of professional staff that limits our ability to keep pace with the needs of our growing community as our aging health care providers are not being replaced. The daily struggles to maintain our high level of expertise and trauma team stability weighs heavily on our minds as we prepare for our future. The changing workforce and external demands of our health care system require us to join forces as we explore opportunities to support our trauma system ideals, beliefs, and quality of care. We carry a heavy burden as we work towards the future and prepare to pass the torch to the next generation, but we have much to be hopeful for. It is through our leadership, planning, role modeling, and setting the standard for quality trauma care that we can best serve our communities. It is something we do well without even thinking, and it is the mission we will complete to feel the satisfaction of our life’s work. As we toil through our busy lives with daily tasks, we should not loose sight of our vision for the future. We should be proactively seeking opportunities to recruit and mentor those who are within our community and workplaces that aspire to serve their fellow citizens with the respect, dignity, and dedication that has made us so proud of our trauma system. It is through our partnerships and recognition of new opportunities that we will maintain the quality of trauma care in San Diego County.
Those who follow will appreciate our vision and ability to integrate the current with the future needs of our communities. May our accomplishments of the past be appreciated, our days work make a difference, and our planning of the future ease the transition as we forge into the 21st century and beyond.
Beverly Neal Trauma Program Manager Palomar Medical Center

Chapter 1 Perspectives
Page 20 San Diego County Trauma System 20 Year Report
Gary M. Vilke, M.D., FACEP, FAAEM County of San Diego, Emergency Medical Services
Growing up in the San Diego County Trauma System Although my history with the San Diego County Trauma System does not go back twenty years, I have had a unique opportunity to participate and learn about the best trauma system in the country from several perspectives. As a medical student in 1990, I got my first taste of this specialty during my clinical rotation on the trauma service at UCSD. I was taken by the precision and structure of the trauma team working closely together to save critically injured patients. My role, performing the ABCs of the medical student (Arterial blood gas, Buttocks check for blood, and Catheter placement) at the time seemed somewhat trivial. But as I have grown to learn, it is this type of attention to detail and compulsiveness that has allowed the San Diego Trauma System to reduce preventable traumatic death to below 1%. During my surgical internship I continued to work with closely with the trauma service while on my various rotations at UCSD. And when I was involved with my emergency medicine residency, I had the opportunity to work at several other San Diego County hospitals and participate as a member of the trauma teams at four of the trauma centers. Additionally, as a flight crew member with Life Flight and Mercy Air, I had the chance to deliver critically ill patients to all of the centers and watch as the trauma personnel quickly moved into action, using teamwork and a structured approach to saving lives. As my career has brought me to my current position as County EMS Medical Director, I, once again have learned even more about the San Diego County Trauma System. I have had the opportunity to participate in what is called the MAC (Medical Audit Committee) process – the countywide peer review of the trauma care in our county. I am truly amazed at the level of patient care review done by these busy trauma surgeons to screen all patient care and to critically evaluate all unique cases. There is a collegiality among the directors of the trauma centers and their community partners that has enabled and fostered the growth of the system, to share information and techniques and to fine tune our trauma system into the finest of its kind. I am honored to have had the opportunity to grow up in the San Diego County Trauma System and look forward to the next twenty years. Gary M. Vilke, M.D., FACEP, FAAEM Medical Director County of San Diego, Emergency Medical Services

History of the Trauma System Chapter 2
San Diego County Trauma System 20 Year Report Page 21
TRAUMA SYSTEM HISTORY
The San Diego County Trauma System emerged as a result of dedicated physicians, nurses, and system specialists within the county working to develop an environment for the careful evolution of a regional trauma system. The input from these groups generated the discussion and in-depth analysis of relevant public health policy options. A needs assessment study to determine if San Diego County would benefit from a regionalized truma system was undertaken by the Hospital Council (now the Healthcare Association) of San Diego and Imperial Counties during 1982. The study represents the first comprehensive concurrent and retrospective audit of trauma care in the nation (“Trauma Needs Assessment Study” by Amherst and Associates). The findings and recommendations of the Trauma Needs Assessment Study, released in November of 1982, led to the development of a joint Hospital Council and Medical Society plan for care of major trauma victims in San Diego County. In October 1983, with support and direction from the San Diego County Board of Supervisors, the Department of Health Services created an Ad Hoc Trauma Advisory Task Force to assist in the review and evaluation of the Hospital Council – Medical Society Trauma Plan. The advisory group of outside trauma experts conducted public hearings and informal sessions with inhospital and prehospital trauma providers, and synthesized the experiences of other trauma systems into a single set of recommendations for the Department and the Board of Supervisors to consider. The recommendations urged the county to adopt trauma standards that closely approximated the American College of Surgeons guidelines. The community consensus that emerged from their effort resulted in the formal adoption of their recommendations by the County Board of Supervisors in November 1983. Once the trauma standards were adopted, the Department implemented a competitive selection process, seeking to designate five adult trauma centers and one pediatric trauma center. Designation criteria were incorporated in a Request for Proposal and the Ad Hoc Trauma Advisory Task Force became the Proposal Review Committee to evaluate and recommend hospitals for designation. Six facilities were awarded provisional designation status based ont he quality of trauma services provided. On August 1, 1984, after sixteen months of direct preparation, major trauma victims in San Diego County began bypassing community hospitals in favor of designated trauma centers.

Chapter 2 History of the Trauma System
Page 22 San Diego County Trauma System 20 Year Report
In October of 1987, the County Board of Supervisors established a Board Subcommitted on the San Diego County Trauma System to evaluate the current trauma center contractual agreements for the San Diego County Trauma System and make appropriate recommendations for policy change as necessary. In February 1992, the Board’s subcommittee was reconvened, and renamed the Trauma Advisory Task Force. This task force developed recommendations specific to the clinical, financial, and legal issues confronting the trauma system at the time. In February 2002, at the request of Supervisor Roberts, the Board of Supervisors directed the Chief Administrative Officer to conduct a voluntary assessment of the Trauma System, and to provide recommendations for enhancing trauma services provided in San Diego County. This assessment was conducted by The Abaris Group. The consultants released their report in February 2003, with detailed recommendations on system configuration, clinical care, and fiscal issues. Through it all, the San Diego County Trauma System has responded to nearly 150,000 patients in need of trauma care, and saved untold numbers of lives. The six trauma centers currently designated are: Children’s Hospital and Health Center Scripps Mercy Hospital Palomar Medical Center (Entered system in January 1985) Scripps Memorial Hospital – La Jolla Sharp Memorial Hospital U.C.S.D. Medical Center

History of the Trauma System Chapter 2
San Diego County Trauma System 20 Year Report Page 23
Twenty (plus) Years of the San Diego County Trauma System TIMELINE
FY 1982/83:
• Trauma Needs Assessment Study (Amherst & Associates) FY 1983/84
• 1983: Trauma Research and Education Foundation (TREF) established • October 1983: Ad hoc Trauma Advisory Task Force
o November 1983: Recommendations formally adopted by County of San Diego Board of Supervisors
FY 1984/85
• Trauma Admissions: 3,218 • San Diego County population: 2,102,486 • July 17, 1984: San Ysidro McDonald’s Massacre • August 1, 1984: Trauma system officially open: Major trauma victims routed directly to
designated trauma facilities • January 1985: Palomar Medical Center replaces Grossmont Hospital in trauma system
FY 1985/86
• Trauma Admissions: 4,374 • San Diego County population: 2,169,967 • Injury Prevention Legislation
o January 1986: Secondary seat belt law FY 1986/87
• Trauma Admissions: 5,466 • San Diego County population: 2,248,471
FY 1987/88
• Trauma Admissions: 6,148 • San Diego County population: 2,328,331 • Injury Prevention Legislation
o July 1987: California Motorcyclist Safety Program implemented o 1987: Bicycle helmets required for riders under 5 years
FY 1988/89
• Trauma Admissions: 3,218 • San Diego County population: 2,102,486 • Injury Prevention Legislation
o 1989: Roberti-Roos Assault Weapons Control Act of 1989 (Semi-automatic assault weapons control)

Chapter 2 History of the Trauma System
Page 24 San Diego County Trauma System 20 Year Report
FY 1989/90 • Trauma Admissions: 6,650 • San Diego County population: 2,498,016 • Injury Prevention Legislation
o January 1990: 0.08% blood alcohol concentration limit and administrative license suspension laws implemented
FY 1990/91
• Trauma Admissions: 7,036 • San Diego County population: 2,529,800 • Injury Prevention Legislation
o January 1992: motorcycle helmet law FY 1991/92
• Trauma Admissions: 7,111 • San Diego County population: 2,572,500
FY 1992/93
• Trauma Admissions: 6,460 • San Diego County population: 2,594,100 • Injury Prevention Legislation
o January 1993: primary seat belt law • October 1992: Trauma Advisory Task Force report released
FY 1993/94
• Trauma Admissions: 6,399 • San Diego County population: 2,604,400 • October 1993: Children’s Hospital Emergency Department opens and pediatric trauma resuscitation
moves to the new facility • Injury Prevention Legislation
o January 1994: Bicycle Helmet Law (riders under 18 years) o January 1994: Illegal for anyone to ride in back of a pickup on a public highway o January 1994: “Zero tolerance” alcohol law: illegal for anyone under 21 years to drive with
BAC of 0.01% or greater o 1994: Brady Handgun Violence Prevention Act (5-day waiting period, background check)
FY 1994/95
• Trauma Admissions: 6,474 • San Diego County population: 2,613,100
FY 1995/96
• Trauma Admissions: 7,516 • San Diego County population: 2,621,100 • Crash Injury Research and Engineering Network (CIREN) project starts in San Diego County

History of the Trauma System Chapter 2
San Diego County Trauma System 20 Year Report Page 25
FY 1996/97
• Trauma Admissions: 7,257 • San Diego County population: 2,653,400
FY 1997/98
• Trauma Admissions: 7,653 • San Diego County population: 2,702,800
FY 1998/99
• Trauma Admissions: 8,435 • San Diego County population: 2,751,000 • Injury Prevention Legislation
o July 1998: Brady Jared Teen Driver Act: Graduated licensing system for under age 18 FY 1999/00
• Trauma Admissions: 8,984 • San Diego County population: 2,813,833
FY 2000/01
• Trauma Admissions: 9,351 • San Diego County population: 2,856,000 • March 5, 2001: Santana High School shooting • March 22, 2001: Granite Hills High School shooting
FY 2001/02
• Trauma Admissions: 9,545 • San Diego County population: 2,908,505 • September 11, 2001: Terrorist attacks on World Trade Center and Pentagon lead to systems changes
focusing more on disaster preparation and response • Injury Prevention Legislation
o January 2002: Child safety restraints required until children reach 6 years or 60 lbs. (previously 4 years and 40 lbs.)
o January 2002: Bicycle helmet law expanded to include nonmotorized scooters, skateboards, roller skates, and in-line skates
FY 2002/03
• Trauma Admissions: 9,990 • San Diego County population: 2,961,579 • Injury Prevention Legislation
o January 2003: All handgun buyers required to obtain safety license • Trauma System Assessment Study: The Abaris Group (released February 2003)

Chapter 2 History of the Trauma System
Page 26 San Diego County Trauma System 20 Year Report
System Overview Chapter 3
San Diego County Trauma System 20 Year Report Page 27
Introduction
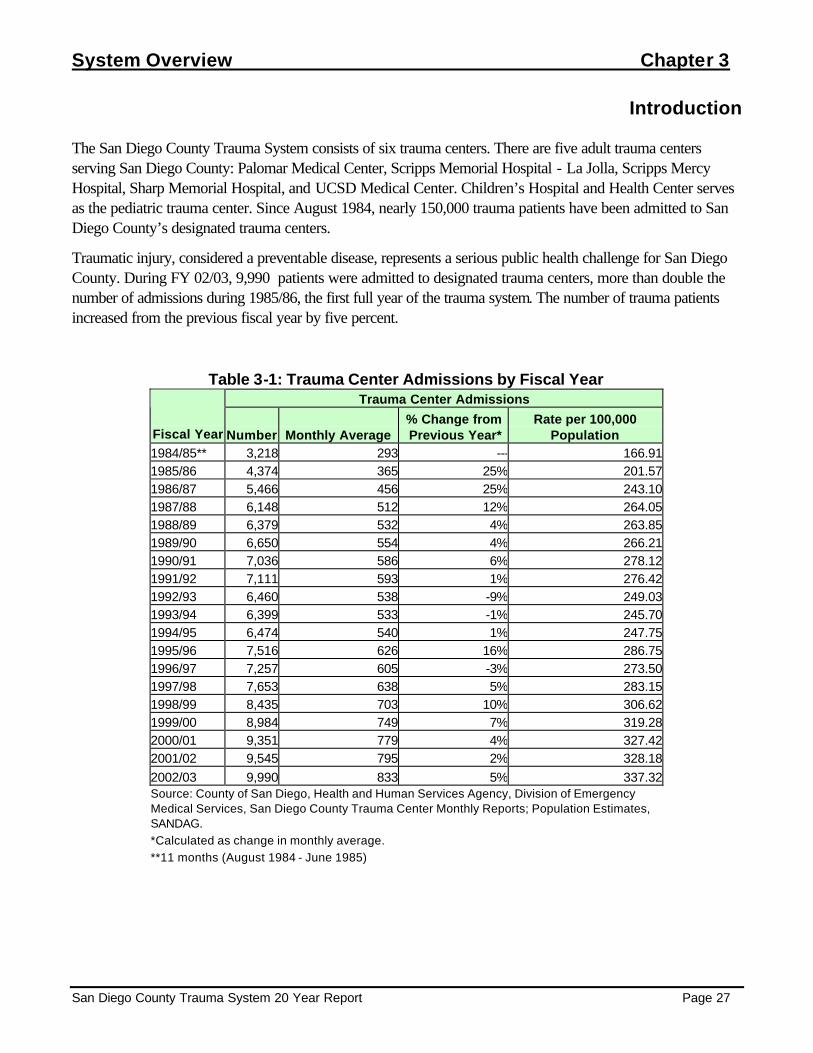
The San Diego County Trauma System consists of six trauma centers. There are five adult trauma centers serving San Diego County: Palomar Medical Center, Scripps Memorial Hospital - La Jolla, Scripps Mercy Hospital, Sharp Memorial Hospital, and UCSD Medical Center. Children’s Hospital and Health Center serves as the pediatric trauma center. Since August 1984, nearly 150,000 trauma patients have been admitted to San Diego County’s designated trauma centers.
Traumatic injury, considered a preventable disease, represents a serious public health challenge for San Diego County. During FY 02/03, 9,990 patients were admitted to designated trauma centers, more than double the number of admissions during 1985/86, the first full year of the trauma system. The number of trauma patients increased from the previous fiscal year by five percent.
Table 3-1: Trauma Center Admissions by Fiscal Year Trauma Center Admissions
Fiscal Year Number Monthly Average % Change from Previous Year*
Rate per 100,000 Population
1984/85** 3,218 293 --- 166.911985/86 4,374 365 25% 201.571986/87 5,466 456 25% 243.101987/88 6,148 512 12% 264.051988/89 6,379 532 4% 263.851989/90 6,650 554 4% 266.211990/91 7,036 586 6% 278.121991/92 7,111 593 1% 276.421992/93 6,460 538 -9% 249.031993/94 6,399 533 -1% 245.701994/95 6,474 540 1% 247.751995/96 7,516 626 16% 286.751996/97 7,257 605 -3% 273.501997/98 7,653 638 5% 283.151998/99 8,435 703 10% 306.621999/00 8,984 749 7% 319.282000/01 9,351 779 4% 327.422001/02 9,545 795 2% 328.182002/03 9,990 833 5% 337.32Source: County of San Diego, Health and Human Services Agency, Division of Emergency Medical Services, San Diego County Trauma Center Monthly Reports; Population Estimates, SANDAG. *Calculated as change in monthly average. **11 months (August 1984 - June 1985)

Chapter 3 System Overview
Page 28 San Diego County Trauma System 20 Year Report
Population
Traumatic injuries are typically classified as either penetrating or blunt. The number of patients admitted to county trauma facilities with penetrating injuries, mostly due to firearms and cutting/piercing injuries, increased steadily from fiscal year 1985/86 to 1992/93. Since then, the number of penetrating injuries decreased 57% to a seventeen-year low in FY 2001/02. The number of blunt injuries, primarily resulting from motor vehicle related injuries and falls, has continued to increase by an average of about 8% per year. The injury rate, which expresses the number of injuries as a proportion of the population, similarly shows a dramatic decrease in admissions for penetrating injuries and a general increase in admissions for blunt trauma during the time period under study.
Table 3-2: Trauma Center Admissions by Injury Type Penetrating Blunt
Fiscal Year # % % Change from Previous Year
Rate per 100,000
Population # % % Change from Previous Year
Rate per 100,000
Population 1985/86 721 16% --- 34.29 3,653 84% --- 173.751986/87 841 15% 17% 38.76 4,625 85% 27% 213.141987/88 845 14% <1% 37.58 5,303 86% 15% 235.851988/89 967 15% 14% 41.53 5,412 85% 2% 232.441989/90 1078 16% 11% 44.59 5,572 84% 3% 230.471990/91 1301 18% 21% 52.08 5,735 82% 3% 229.581991/92 1362 19% 5% 53.84 5,749 81% <1% 227.251992/93 1375 21% 1% 53.45 5,085 79% -12% 197.671993/94 1192 19% -13% 45.95 5,207 81% 2% 200.721994/95 1043 16% -13% 40.05 5,431 84% 4% 208.531995/96 1083 14% 4% 41.45 6,428 86% 18% 245.991996/97 883 12% -18% 33.69 6,226 88% -3% 237.531997/98 759 10% -14% 28.60 6,890 90% 10% 259.671998/99 726 9% -4% 26.86 7,709 91% 12% 285.221999/00 660 7% -9% 23.99 8,317 93% 8% 302.332000/01 679 7% 3% 24.13 8,668 93% 4% 308.052001/02 597 6% -12% 20.90 8,453 93% -2% 295.972002/03 735 7% 23% 25.27 9,142 92% 8% 314.32Source: County of San Diego, Health and Human Services Agency, Division of Emergency Medical Services, San Diego County Trauma Center Monthly Reports; Population Estimates, SANDAG.
A rate is calculated as incidents per 100,000 population. Rates were calculated using annual January population estimates calculated from estimates and forecasts from the San Diego Association of Governments (SANDAG). Rates were not calculated for categories with less than five occurrences. Rate =
Number of incidents X 100,000

System Overview Chapter 3
San Diego County Trauma System 20 Year Report Page 29
Figure 3-1: Rates of Blunt and Penetrating Injury by Fiscal Year
0
50
100
150
200
250
300
350
1985
/86
1986
/87
1987
/88
1988
/89
1989
/90
1990
/91
1991
/92
1992
/93
1993
/94
1994
/95
1995
/96
1996
/97
1997
/98
1998
/99
1999
/00
2000
/01
2001
/02
2002
/03
Fiscal Year
Rat
e p
er 1
00,0
00
Penetrating Blunt
Source: County of San Diego, Health and Human Services Agency, Division of Emergency Medical Services, San Diego
County Trauma Center Monthly Reports; Population Estimates, SANDAG.
Blunt Injuries
1992/93: 195 per
2002/03: 309 per
Penetrating Injuries
1991/92: 52.7 per 100,000
2001/02: 20.5 per

Chapter 3 System Overview
Page 30 San Diego County Trauma System 20 Year Report
Trauma Registry Data
The American College of Surgeons Committee on Trauma initiated a study which pooled data from more than 100 trauma centers nationwide. To be included, trauma patients had to meet Major Trauma Outcome Study (MTOS) criteria which reflected either the severity of the patient’s injuries or the resources required to care for the patient.
Members of the San Diego County trauma system modified these criteria for the San Diego County Trauma Registry. To be entered into the registry, a trauma patient must have met one of the following: admission to the hospital for at least three days, or admission to an intensive or intermediate care unit, or interfacility transfer to or from an acute care hospital, or death from traumatic injuries. In January 2000, these criteria were revised to the following: admission for at least 24 hours, or interfacility transfer to or from an acute care hospital, or death from traumatic injuries.
Since 1986, each of the designated trauma centers has submitted data on each trauma patient admission who met the modified MTOS criteria to the Division of EMS. These summaries contained more than 100 variables, including demographic, cause of injury, diagnostic, treatment and patient outcome data.
Of the 9,351 patients who were admitted to a trauma center during FY 2002/03, 5,739 (57%) met expanded trauma registry criteria for inclusion into the San Diego County Trauma Registry. While total trauma admissions increased by 7% during the last fiscal year, the number of modified MTOS patients increased eleven percent.
Table 3-3: Total MTOS Patients and Trauma Center Admissions
Total Trauma Admissions
Percentage Change
Modified MTOS Patients
Percentage Change
MTOS Percent of Total
1985/86 4,374 --- *** *** *** 1986/87 5,466 25% *** *** *** 1987/88 6,148 12% *** *** *** 1988/89 6,379 4% *** *** *** 1989/90 6,650 4% *** *** *** 1990/91 7,036 6% *** *** *** 1991/92 7,111 1% 4,645 --- 65%1992/93 6,460 -9% 4,492 -3% 70%1993/94 6,399 -1% 4,235 -6% 66%1994/95 6,474 1% 4,085 -4% 63%1995/96 7,516 16% 4,250 4% 57%1996/97 7,257 -3% 5,007 18% 69%1997/98 7,653 5% 4,951 -1% 65%1998/99 8,435 10% 4,995 1% 59%1999/00 8,984 7% 5,093 2% 57%2000/01 9,351 4% 5,169 1% 55%2001/02 9,545 6% 5,307 4% 56%2002/03 9,990 7% 5,739 11% 57%Total 95,175 --- 57,968 --- 61%Source: County of San Diego, Health and Human Services Agency, Division of Emergency Medical Services, San Diego County Trauma Registry and Trauma Center Monthly Reports.
***Data not available

System Overview Chapter 3
San Diego County Trauma System 20 Year Report Page 31
Trauma Patient Outcomes Please note that the following section only includes patients who were admitted to designated trauma centers and does not include patients who died at a non-trauma center or on scene. Of the trauma patients who were admitted to designated trauma centers, 95% survived.
The severity of a trauma patient's injuries is calculated by using the Injury Severity Score (ISS). The ISS increases in relation to the severity of the injuries. Trauma Patients with an ISS of less than 15 have an approximate 99% survival rate in San Diego County. As shown in the table below, as a patient’s ISS increases to 15 or more, the survival rate from injuries decreases to 81%.
Table 3-4: Trauma Patient Outcomes by Injury Severity Score
Injury Severity Score <9 9-14 15+ Fiscal
Year Survived (%) Expired (%) Survived (%) Expired (%) Survived (%) Expired (%) 1986/87 2345 (99.9%) 3 (0.1%) 1144 (99.7%) 3 (0.3%) 1037 (79.2%) 272 (20.8%) 1987/88 5 (83.3%) 1 (16.7%) 946 (99.4%) 6 (0.6%) 1167 (77.6%) 336 (22.4%) 1988/89 1120 (99.8%) 2 (0.2%) 1264 (99.6%) 5 (0.4%) 1268 (78.6%) 346 (21.4%) 1989/90 1456 (99.9%) 1 (0.1%) 1264 (99.2%) 10 (0.8%) 1393 (81.1%) 325 (18.9%) 1990/91 1630 (99.6%) 6 (0.4%) 1350 (99.4%) 8 (0.6%) 1310 (79.3%) 342 (20.7%) 1991/92 1780 (99.9%) 2 (0.1%) 1301 (99.6%) 5 (0.4%) 1217 (79.1%) 322 (20.9%) 1992/93 1877 (99.9%) 1 (0.1%) 1296 (99.3%) 9 (0.7%) 1000 (77.6%) 288 (22.4%) 1993/94 1701 (99.8%) 4 (0.2%) 1239 (98.9%) 14 (1.1%) 986 (78.5%) 270 (21.5%) 1994/95 1593 (99.7%) 4 (0.3%) 1236 (99.6%) 5 (0.4%) 944 (76.0%) 298 (24.0%) 1995/96 1853 (99.9%) 1 (0.1%) 1323 (99.3%) 9 (0.7%) 1072 (80.4%) 261 (19.6%) 1996/97 1953 (99.7%) 5 (0.3%) 1363 (99.8%) 3 (0.2%) 933 (79.9%) 234 (20.1%) 1997/98 2261 (99.9%) 3 (0.1%) 1381 (99.4%) 8 (0.6%) 977 (80.9%) 230 (19.1%) 1998/99 2250 (99.6%) 10 (0.4%) 1392 (99.0%) 14 (1.0%) 1057 (82.7%) 221 (17.3%) 1999/00 2329 (99.5%) 11 (0.5%) 1503 (99.4%) 9 (0.6%) 954 (82.8%) 198 (17.2%) 2000/01 2171 (99.3%) 15 (0.7%) 1634 (99.2%) 14 (0.8%) 1038 (80.7%) 249 (19.3%) 2001/02 2265 (99.3%) 15 (0.7%) 1633 (99.0%) 17 (1.0%) 1114 (83.2%) 225 (16.8%) 2002/03 2296 (99.5%) 12 (0.5%) 1860 (99.0%) 18 (1.0%) 1254 (82.6%) 264 (17.4%)
1The Injury Severity Score (ISS) is a modification of the Abbreviated Injury Scale (AIS) developed to deal with multiple injuries. The ISS
incorporates the AIS scores for the most significant injuries in three different body regions. The ISS is calculated by summing the squares of
the AIS scores for these injuries. AIS scores up to five are squared, so that the maximum ISS is 75. An AIS score of 6 in any body region is
an automatic ISS of 75.

Chapter 3 System Overview
Page 32 San Diego County Trauma System 20 Year Report
Severe Trauma Patients Chapter 4
San Diego County Trauma System 20 Year Report Page 33
Severe Trauma Patients
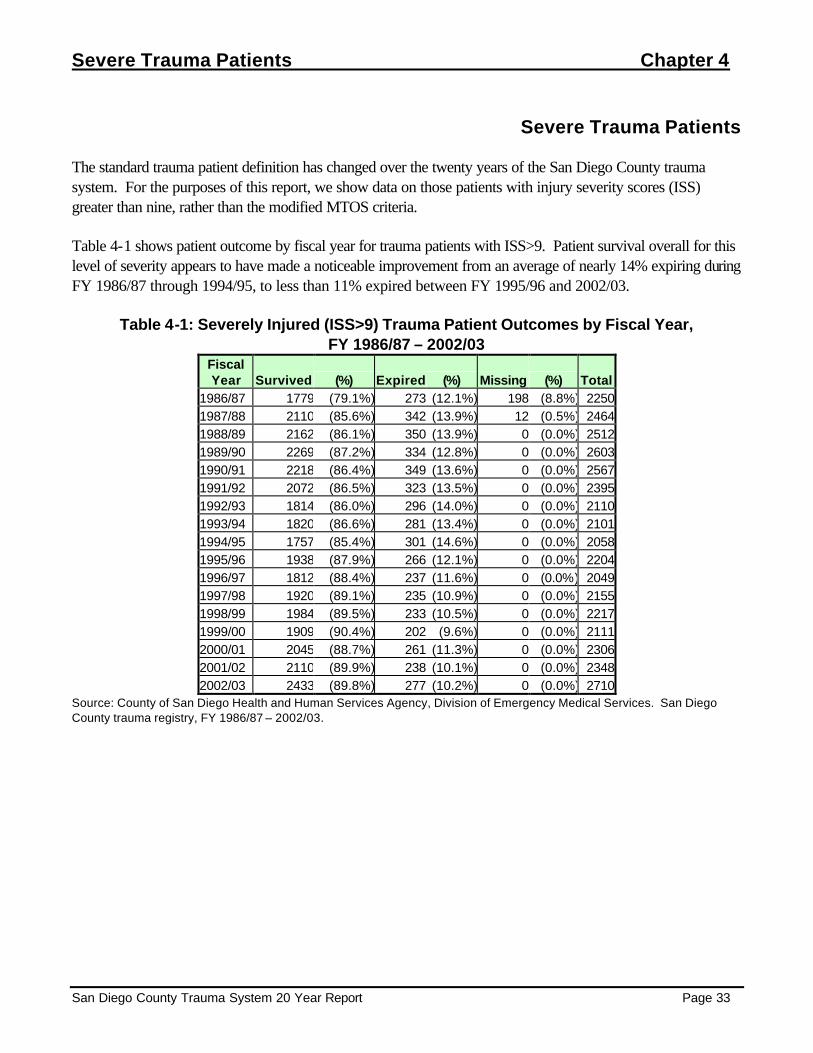
The standard trauma patient definition has changed over the twenty years of the San Diego County trauma system. For the purposes of this report, we show data on those patients with injury severity scores (ISS) greater than nine, rather than the modified MTOS criteria.
Table 4-1 shows patient outcome by fiscal year for trauma patients with ISS>9. Patient survival overall for this level of severity appears to have made a noticeable improvement from an average of nearly 14% expiring during FY 1986/87 through 1994/95, to less than 11% expired between FY 1995/96 and 2002/03.
Table 4-1: Severely Injured (ISS>9) Trauma Patient Outcomes by Fiscal Year, FY 1986/87 – 2002/03
Fiscal Year Survived (%) Expired (%) Missing (%) Total
1986/87 1779 (79.1%) 273 (12.1%) 198 (8.8%) 22501987/88 2110 (85.6%) 342 (13.9%) 12 (0.5%) 24641988/89 2162 (86.1%) 350 (13.9%) 0 (0.0%) 25121989/90 2269 (87.2%) 334 (12.8%) 0 (0.0%) 26031990/91 2218 (86.4%) 349 (13.6%) 0 (0.0%) 25671991/92 2072 (86.5%) 323 (13.5%) 0 (0.0%) 23951992/93 1814 (86.0%) 296 (14.0%) 0 (0.0%) 21101993/94 1820 (86.6%) 281 (13.4%) 0 (0.0%) 21011994/95 1757 (85.4%) 301 (14.6%) 0 (0.0%) 20581995/96 1938 (87.9%) 266 (12.1%) 0 (0.0%) 22041996/97 1812 (88.4%) 237 (11.6%) 0 (0.0%) 20491997/98 1920 (89.1%) 235 (10.9%) 0 (0.0%) 21551998/99 1984 (89.5%) 233 (10.5%) 0 (0.0%) 22171999/00 1909 (90.4%) 202 (9.6%) 0 (0.0%) 21112000/01 2045 (88.7%) 261 (11.3%) 0 (0.0%) 23062001/02 2110 (89.9%) 238 (10.1%) 0 (0.0%) 23482002/03 2433 (89.8%) 277 (10.2%) 0 (0.0%) 2710
Source: County of San Diego Health and Human Services Agency, Division of Emergency Medical Services. San Diego County trauma registry, FY 1986/87 – 2002/03.

Chapter 4 Severe Trauma Patients
Page 34 San Diego County Trauma System 20 Year Report
Source: County of San Diego Health and Human Services Agency, Division of Emergency Medical Services, San Diego
County Trauma Registry, FY 1986/87 – 2002/03.
*ISS>9
Figure 4-1: Percent of Severely Injured Trauma Patients* Expired, FY 1986/87 - 2002/03
0%
2%
4%
6%
8%
10%
12%
14%
16%
1986
/87
1987
/88
1988
/89
1989
/90
1990
/91
1991
/92
1992
/93
1993
/94
1994
/95
1995
/96
1996
/97
1997
/98
1998
/99
1999
/00
2000
/01
2001
/02
2002
/03
Fiscal Year
Per
cen
t Exp
ired
1986/87 - 1994/95: Average = 13.7%
1995/96 – 2002/03: Average = 10.8%

Severe Trauma Patients Chapter 4
San Diego County Trauma System 20 Year Report Page 35
Table 4-2 examines cause of injury for severely injured patients since FY 1986/87. Motor vehicle occupant (MVO) injuries have historically comprised the largest group of patients, but injuries from falls are on the rise. While falls have increased from seven to 22 percent of severe trauma patients, motor vehicle occupants have declined from 31 to 28 percent of severe injuries from FY 1986/87 to 2002/03.
Table 4-2 Number of Severely Injured (ISS>9) Trauma Patients by Cause of Injury,
FY 1986/87 – 2002/03 Cause of Injury
Fiscal Year
MV Occupant Motorcycle PedalcyclePedestrian
Other Vehicle Falls
Self Inflicted Assault
Other/ Unknown Total
1986/87 689 373 91 228 39 162 57 331 280 2250 1987/88 919 319 108 282 40 223 73 361 139 2464 1988/89 909 271 116 333 53 226 74 391 139 2512 1989/90 923 259 102 339 49 242 77 459 153 2603 1990/91 785 285 125 305 40 233 83 553 158 2567 1991/92 758 212 120 265 40 251 77 541 131 2395 1992/93 650 154 102 246 28 222 71 517 120 2110 1993/94 638 140 119 217 26 244 68 480 169 2101 1994/95 638 115 101 228 29 250 77 440 180 2058 1995/96 670 133 113 223 37 293 57 476 202 2204 1996/97 604 133 124 209 34 327 57 369 192 2049 1997/98 596 132 116 257 32 367 57 362 236 2155 1998/99 703 136 98 209 32 411 56 336 236 2217 1999/00 654 155 113 186 24 439 46 260 234 2111 2000/01 674 195 96 201 98 498 56 295 193 2303 2001/02 678 210 107 197 107 485 41 289 234 2348 2002/03 772 207 124 208 133 617 40 358 251 2710
Source: County of San Diego Health and Human Services Agency, Division of Emergency Medical Services, San Diego County Trauma Registry, FY 1986/87 – 2002/03.

Chapter 4 Severe Trauma Patients
Page 36 San Diego County Trauma System 20 Year Report
The change in rates of severe injury over time reflects the same pattern as the change in absolute counts. The overall rate of severe trauma declined by nine percent over this time period, with large drops seen in the rates of motor vehicle occupant, motorcycle, and pedestrian injuries. The rate of severe trauma from falls rose significantly, to nearly three times the rate of 1986/87, while assault injuries rose into the early 1990s before falling significantly.
Table 4-3 Severe Injury* Rates by Cause of Injury, FY 1986/87 – 2002/03
Cause of Injury Fiscal Year
MV Occupant Motorcycle PedalcyclePedestrian
Other Vehicle Falls
Self Inflicted Assault
Other/ Unknown Total
1986/87 30.64 16.59 4.05 10.14 1.73 7.20 2.54 14.72 12.45 100.071987/88 39.47 13.70 4.64 12.11 1.72 9.58 3.14 15.50 5.97 105.831988/89 37.60 11.21 4.80 13.77 2.19 9.35 3.06 16.17 5.75 103.901989/90 36.95 10.37 4.08 13.57 1.96 9.69 3.08 18.37 6.12 104.201990/91 31.03 11.27 4.94 12.06 1.58 9.21 3.28 21.86 6.25 101.471991/92 29.47 8.24 4.66 10.30 1.55 9.76 2.99 21.03 5.09 93.101992/93 25.06 5.94 3.93 9.48 1.08 8.56 2.74 19.93 4.63 81.341993/94 24.50 5.38 4.57 8.33 1.00 9.37 2.61 18.43 6.49 80.671994/95 24.42 4.40 3.87 8.73 1.11 9.57 2.95 16.84 6.89 78.761995/96 25.56 5.07 4.31 8.51 1.41 11.18 2.17 18.16 7.71 84.091996/97 22.76 5.01 4.67 7.88 1.28 12.32 2.15 13.91 7.24 77.221997/98 22.05 4.88 4.29 9.51 1.18 13.58 2.11 13.39 8.73 79.731998/99 25.55 4.94 3.56 7.60 1.16 14.94 2.04 12.21 8.58 80.591999/00 23.24 5.51 4.02 6.61 0.85 15.60 1.63 9.24 8.32 75.022000/01 23.60 6.83 3.36 7.04 3.43 17.44 1.96 10.33 6.76 80.742001/02 23.31 7.22 3.68 6.77 3.68 16.68 1.41 9.94 8.05 80.732002/03 26.07 6.99 4.19 7.02 4.49 20.83 1.35 12.09 8.48 91.51Source: County of San Diego Health and Human Services Agency, Division of Emergency Medical Services, San Diego County Trauma Registry, FY 1986/87 – 2002/03. *ISS>9

Severe Trauma Patients Chapter 4
San Diego County Trauma System 20 Year Report Page 37
Figure 4-2: Severe Injury* Rates by Age Group, FY 1986/87 - 2002/03
0
50
100
150
200
250
1986
/87
1987
/88
1988
/89
1989
/90
1990
/91
1991
/92
1992
/93
1993
/94
1994
/95
1995
/96
1996
/97
1997
/98
1998
/99
1999
/00
2000
/01
2001
/02
2002
/03
Fiscal Year
Rat
e p
er 1
00,0
00
0-14 15-24 25-44 45-64 65+
Source: County of San Diego Health and Human Services Agency, Division of Emergency Medical Services, San Diego County Trauma Registry, FY 1986/87 – 2002/03. *ISS>9 The rate of severe injuries to older adults has more than doubled from FY 1986/87 to FY 2002/03, while that for patients aged 15 to 24 and 25 to 44 has decreased since the beginning of the trauma system. These changes reflect the changes in different causes of injuries, with injuries from falls increasing dramatically over this time period while motor vehicle related and violent injury rates have decreased.
Table 4-4 Severe Injury Rates (per 100,000)
by Age Group, FY 1986/87 – 2002/03 Age Group
Fiscal Year 0-14 15-24 25-44 45-64 65+ All
Ages 1986/87 49.24 186.56 121.50 56.84 55.84 100.07 1987/88 53.79 198.92 121.21 63.22 75.04 105.83 1988/89 61.97 190.17 114.67 65.87 72.46 103.90 1989/90 56.05 176.22 120.60 78.11 68.46 104.20 1990/91 50.39 174.84 118.97 70.69 76.52 101.47 1991/92 53.84 169.12 105.95 55.73 71.29 93.10 1992/93 49.08 131.92 97.49 51.95 63.66 81.34 1993/94 55.11 127.83 88.15 53.05 81.18 80.67 1994/95 43.60 121.67 89.41 61.15 79.38 78.76 1995/96 50.90 128.31 93.20 70.88 76.51 84.09 1996/97 50.47 110.53 77.63 62.78 101.69 77.22 1997/98 43.52 119.37 79.77 77.75 99.99 79.73 1998/99 45.68 114.71 83.03 82.97 99.18 80.59 1999/00 46.14 109.78 73.28 69.06 99.12 75.02 2000/01 45.47 115.73 79.54 74.98 113.39 80.74 2001/02 38.86 127.68 82.02 72.26 107.42 80.73 2002/03 41.78 126.65 95.15 86.05 136.06 91.51 Source: County of San Diego Health and Human Services Agency, Division of Emergency Medical Services, San Diego County Trauma Registry, FY 1986/87 – 2002/03 *Rates not calculated on fewer than five incidents

Chapter 4 Severe Trauma Patients
Page 38 San Diego County Trauma System 20 Year Report
Figure 4-3 shows the age distribution of severely injured trauma patients over time. Seventy-five percent of patients were between 15 and 44 years of age in FY 1986/87, decreasing to 54% in 2002/03, while the proportion age 45 years and older has increased from 15% to 36%.
Figure 4-3 Age Distribution of Severely Injured Trauma Patients (ISS>9) by Fiscal Year
FY 1986/870-1410%
15-2434%
45-649%
65+6%
25-4441%
FY 1988/890-1413%
15-2432%
45-6410%
65+8%
25-4437%
FY 1990/910-1410%
15-2429%
45-6412%
65+8%
25-4441%
FY 1992/930-1413%
15-2427%
45-6411%
65+9%
25-4440%
FY 1994/950-1412%
15-2425%
45-6414%
65+11%
25-4438%
FY 1996/970-1414%
15-2423%
45-6415%
65+15%
25-4433%
FY 1998/990-1411%
15-2421%45-64
19%
65+15%
25-4434%
FY 2000/010-1412%
15-2422%45-64
19%
65+16%
25-4431%
FY 2002/030-1410%
15-2422%
45-6420%
65+16%
25-4432%
Source: County of San Diego Health and Human Services Agency, Division of Emergency Medical Services, San Diego County Trauma Registry, FY 1986/87 – 2002/03.

Severe Trauma Patients Chapter 4
San Diego County Trauma System 20 Year Report Page 39
Transportation-Related Injuries Rates of severe trauma to motor vehicle occupants, motorcyclists, and pedestrians have declined over time, while injuries to pedalcyclists have remained steady. A number of laws addressing motor vehicle-related injury have been introduced during this time period, including a secondary seat belt law (1986), upgraded to a primary enforcement law in 1993, a mandatory motorcycle safety program (1987), and the motorcycle helmet law (1992).
Figure 4-4: Transportation-Related Severe Injury Rates (ISS>9) by Cause,
FY 1985/86 - 2002/03
05
1015202530354045
1985
/86
1986
/87
1987
/88
1988
/89
1989
/90
1990
/91
1991
/92
1992
/93
1993
/94
1994
/95
1995
/96
1996
/97
1997
/98
1998
/99
1999
/00
2000
/01
2001
/02
2002
/03
Fiscal Year
Rat
e p
er 1
00,0
00
Motor Vehicle Occupant Motorcycle PedalcyclePedestrian Other Vehicle
Source: County of San Diego Health and Human Services Agency, division of Emergency Medical Services, San Diego County Trauma Registry, FY 1986/87 – 2002/03.
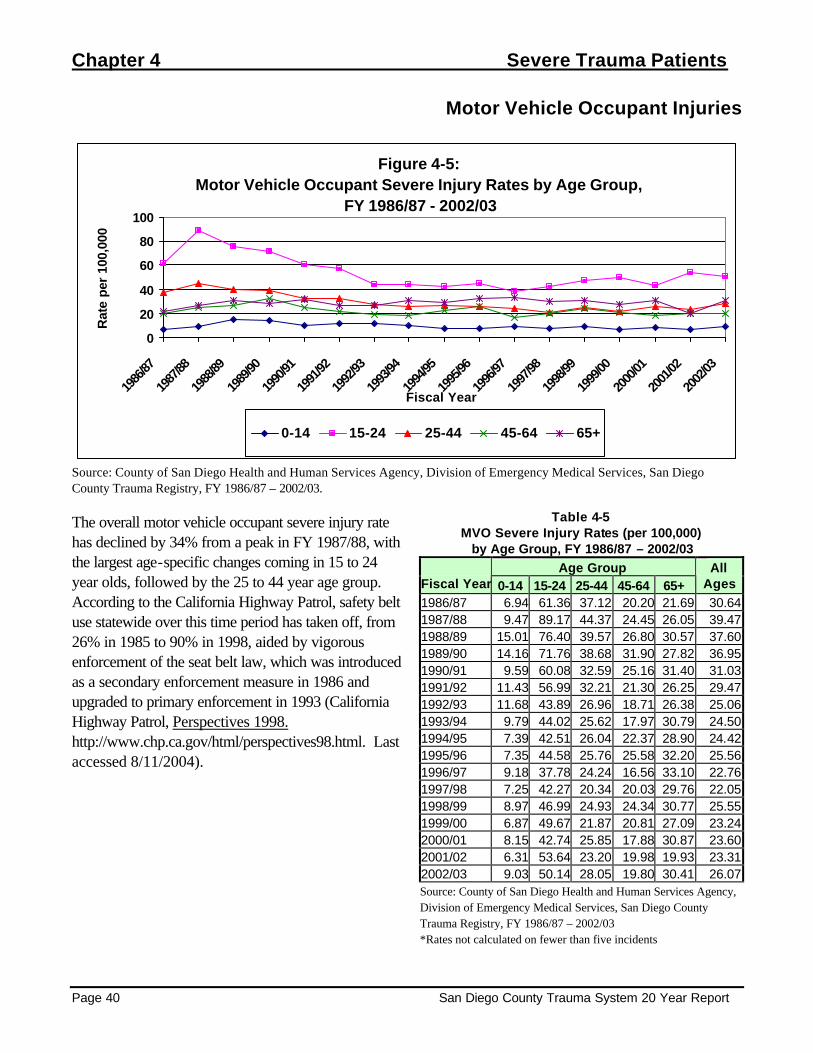
Chapter 4 Severe Trauma Patients
Page 40 San Diego County Trauma System 20 Year Report
Motor Vehicle Occupant Injuries
Figure 4-5: Motor Vehicle Occupant Severe Injury Rates by Age Group,
FY 1986/87 - 2002/03
0
20
40
60
80
100
1986
/87
1987
/88
1988
/89
1989
/90
1990
/91
1991
/92
1992
/93
1993
/94
1994
/95
1995
/96
1996
/97
1997
/98
1998
/99
1999
/00
2000
/01
2001
/02
2002
/03
Fiscal Year
Rat
e pe
r 10
0,00
0
0-14 15-24 25-44 45-64 65+
Source: County of San Diego Health and Human Services Agency, Division of Emergency Medical Services, San Diego County Trauma Registry, FY 1986/87 – 2002/03. The overall motor vehicle occupant severe injury rate has declined by 34% from a peak in FY 1987/88, with the largest age-specific changes coming in 15 to 24 year olds, followed by the 25 to 44 year age group. According to the California Highway Patrol, safety belt use statewide over this time period has taken off, from 26% in 1985 to 90% in 1998, aided by vigorous enforcement of the seat belt law, which was introduced as a secondary enforcement measure in 1986 and upgraded to primary enforcement in 1993 (California Highway Patrol, Perspectives 1998. http://www.chp.ca.gov/html/perspectives98.html. Last accessed 8/11/2004).
Table 4-5 MVO Severe Injury Rates (per 100,000) by Age Group, FY 1986/87 – 2002/03
Age Group Fiscal Year 0-14 15-24 25-44 45-64 65+
All Ages
1986/87 6.94 61.36 37.12 20.20 21.69 30.64 1987/88 9.47 89.17 44.37 24.45 26.05 39.47 1988/89 15.01 76.40 39.57 26.80 30.57 37.60 1989/90 14.16 71.76 38.68 31.90 27.82 36.95 1990/91 9.59 60.08 32.59 25.16 31.40 31.03 1991/92 11.43 56.99 32.21 21.30 26.25 29.47 1992/93 11.68 43.89 26.96 18.71 26.38 25.06 1993/94 9.79 44.02 25.62 17.97 30.79 24.50 1994/95 7.39 42.51 26.04 22.37 28.90 24.42 1995/96 7.35 44.58 25.76 25.58 32.20 25.56 1996/97 9.18 37.78 24.24 16.56 33.10 22.76 1997/98 7.25 42.27 20.34 20.03 29.76 22.05 1998/99 8.97 46.99 24.93 24.34 30.77 25.55 1999/00 6.87 49.67 21.87 20.81 27.09 23.24 2000/01 8.15 42.74 25.85 17.88 30.87 23.60 2001/02 6.31 53.64 23.20 19.98 19.93 23.31 2002/03 9.03 50.14 28.05 19.80 30.41 26.07 Source: County of San Diego Health and Human Services Agency, Division of Emergency Medical Services, San Diego County Trauma Registry, FY 1986/87 – 2002/03 *Rates not calculated on fewer than five incidents

Severe Trauma Patients Chapter 4
San Diego County Trauma System 20 Year Report Page 41
Motorcyclist Injuries
Figure 4-6: Motorcycle Severe Injury Rates by Age Group, FY 1986/87 - 2002/03
0
10
20
30
40
50
1986
/87
1987
/88
1988
/89
1989
/90
1990
/91
1991
/92
1992
/93
1993
/94
1994
/95
1995
/96
1996
/97
1997
/98
1998
/99
1999
/00
2000
/01
2001
/02
2002
/03
Fiscal Year
Rat
e p
er 1
00,0
00
0-14 15-24 25-44 45-64 65+
Source: County of San Diego Health and Human Services Agency, Division of Emergency Medical Services, San Diego County Trauma Registry, FY 1986/87 – 2002/03. The severe injury rate to motorcyclists has plummeted since the trauma system opened. Two legislative acts are thought to have had an impact. The first was the implementation of the California Motorcyclist Safety Program (CMSP) in July 1987, and the second was the law, effective January 1992, requiring that all motorcyclists wear helmets.
Table 4-6 Motorcycle Severe Injury Rates (per 100,000)
by Age Group, FY 1986/87 – 2002/03 Age Group
Fiscal Year 0-14 15-24 25-44 45-64 65+ All
Ages 1986/87 1.89 46.52 21.5 3.77 * 16.59 1987/88 1.01 36.99 18.41 4.42 * 13.70 1988/89 1.15 31.38 14.70 2.50 * 11.21 1989/90 * 28.70 13.65 3.01 * 10.37 1990/91 * 26.28 16.30 5.99 * 11.27 1991/92 * 21.02 11.61 3.17 * 8.24 1992/93 * 14.24 8.76 2.20 * 5.94 1993/94 * 12.17 7.52 3.25 * 5.38 1994/95 * 7.28 6.62 3.84 * 4.40 1995/96 * 10.85 7.21 4.40 * 5.07 1996/97 * 9.15 6.83 5.52 2.05 5.01 1997/98 0.86 9.29 7.75 3.17 * 4.88 1998/99 * 7.37 7.01 6.13 1.64 4.94 1999/00 1.15 9.75 7.33 6.46 * 5.51 2000/01 * 14.10 9.24 8.16 * 6.83 2001/02 0.81 9.31 11.66 7.99 2.49 7.22 2002/03 * 8.64 10.79 9.42 1.54 6.99 Source: County of San Diego Health and Human Services Agency, Division of Emergency Medical Services, San Diego County Trauma Registry, FY 1986/87 – 2002/03 *Rates not calculated on fewer than five incidents
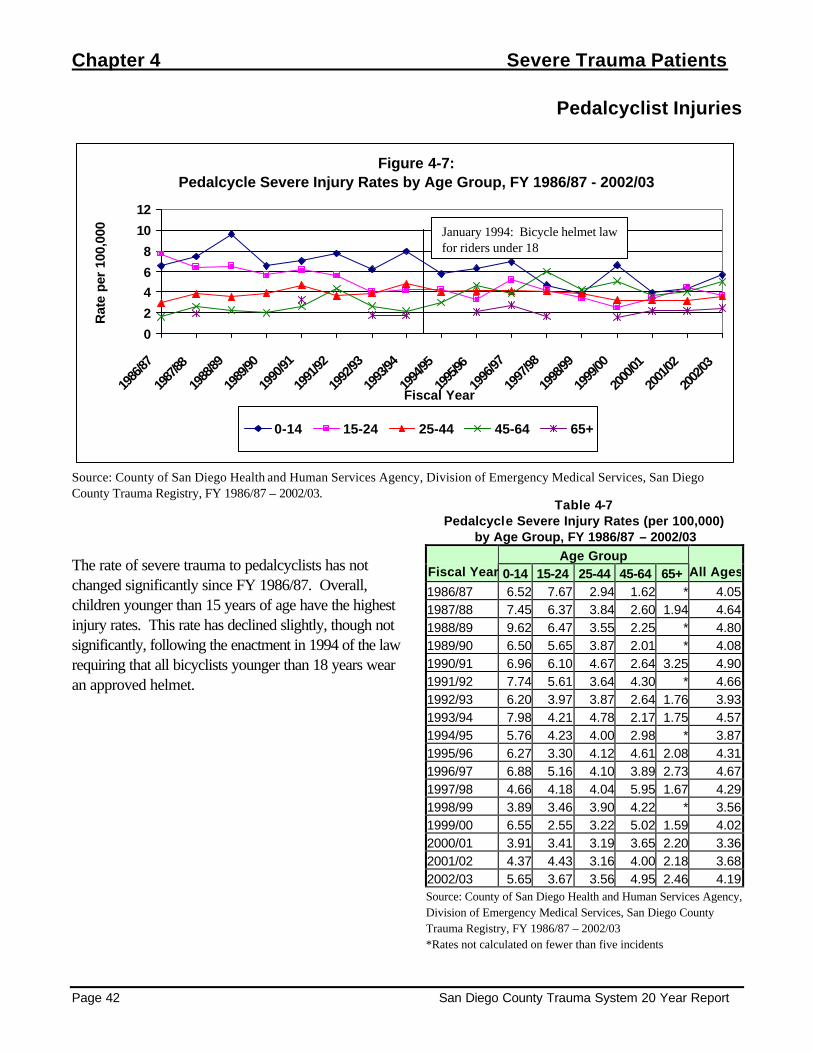
Chapter 4 Severe Trauma Patients
Page 42 San Diego County Trauma System 20 Year Report
Pedalcyclist Injuries
Figure 4-7: Pedalcycle Severe Injury Rates by Age Group, FY 1986/87 - 2002/03
0
2
46
8
10
12
1986
/87
1987
/88
1988
/89
1989
/90
1990
/91
1991
/92
1992
/93
1993
/94
1994
/95
1995
/96
1996
/97
1997
/98
1998
/99
1999
/00
2000
/01
2001
/02
2002
/03
Fiscal Year
Rat
e pe
r 10
0,00
0
0-14 15-24 25-44 45-64 65+
Source: County of San Diego Health and Human Services Agency, Division of Emergency Medical Services, San Diego County Trauma Registry, FY 1986/87 – 2002/03.
The rate of severe trauma to pedalcyclists has not changed significantly since FY 1986/87. Overall, children younger than 15 years of age have the highest injury rates. This rate has declined slightly, though not significantly, following the enactment in 1994 of the law requiring that all bicyclists younger than 18 years wear an approved helmet.
Table 4-7 Pedalcycle Severe Injury Rates (per 100,000)
by Age Group, FY 1986/87 – 2002/03 Age Group
Fiscal Year 0-14 15-24 25-44 45-64 65+ All Ages
1986/87 6.52 7.67 2.94 1.62 * 4.05 1987/88 7.45 6.37 3.84 2.60 1.94 4.64 1988/89 9.62 6.47 3.55 2.25 * 4.80 1989/90 6.50 5.65 3.87 2.01 * 4.08 1990/91 6.96 6.10 4.67 2.64 3.25 4.90 1991/92 7.74 5.61 3.64 4.30 * 4.66 1992/93 6.20 3.97 3.87 2.64 1.76 3.93 1993/94 7.98 4.21 4.78 2.17 1.75 4.57 1994/95 5.76 4.23 4.00 2.98 * 3.87 1995/96 6.27 3.30 4.12 4.61 2.08 4.31 1996/97 6.88 5.16 4.10 3.89 2.73 4.67 1997/98 4.66 4.18 4.04 5.95 1.67 4.29 1998/99 3.89 3.46 3.90 4.22 * 3.56 1999/00 6.55 2.55 3.22 5.02 1.59 4.02 2000/01 3.91 3.41 3.19 3.65 2.20 3.36 2001/02 4.37 4.43 3.16 4.00 2.18 3.68 2002/03 5.65 3.67 3.56 4.95 2.46 4.19 Source: County of San Diego Health and Human Services Agency, Division of Emergency Medical Services, San Diego County Trauma Registry, FY 1986/87 – 2002/03 *Rates not calculated on fewer than five incidents
January 1994: Bicycle helmet law for riders under 18

Severe Trauma Patients Chapter 4
San Diego County Trauma System 20 Year Report Page 43
Pedestrian Injuries
Figure 4-8: Pedestrian Severe Injury Rates by Age Group, FY 1986/87 - 2002/03
0
5
10
15
20
1986
/87
1987
/88
1988
/89
1989
/90
1990
/91
1991
/92
1992
/93
1993
/94
1994
/95
1995
/96
1996
/97
1997
/98
1998
/99
1999
/00
2000
/01
2001
/02
2002
/03
Fiscal Year
Rat
e pe
r 10
0,00
0
0-14 15-24 25-44 45-64 65+
Source: County of San Diego Health and Human Services Agency, Division of Emergency Medical Services, San Diego County Trauma Registry, FY 1986/87 – 2002/03. Pedestrian severe trauma has had a general trend downward over time, with the injury rate among children less than 15 years dropping by 75% from 1986/87 to 2002/03.
Table 4-8 Pedestrian Severe Injury Rates (per 100,000)
by Age Group, FY 1986/87 – 2002/03 Age Group
Fiscal Year 0-14 15-24 25-44 45-64 65+ All Ages
1986/87 15.99 10.14 7.48 8.08 10.04 10.14 1987/88 14.50 13.72 9.97 9.11 15.94 12.11 1988/89 15.97 12.21 12.50 12.02 18.11 13.73 1989/90 17.22 12.47 12.74 12.81 11.72 13.53 1990/91 14.29 9.62 13.68 9.58 10.11 12.06 1991/92 13.65 9.58 8.76 8.61 12.41 10.30 1992/93 10.77 7.24 9.90 9.24 9.15 9.44 1993/94 11.24 4.92 7.40 7.80 11.55 8.33 1994/95 9.01 6.81 8.68 8.10 12.19 8.73 1995/96 10.39 7.55 8.82 6.71 8.31 8.51 1996/97 8.47 6.10 6.49 6.14 16.38 7.88 1997/98 9.15 7.90 7.75 9.92 17.06 9.51 1998/99 7.61 6.45 6.46 9.20 9.82 7.60 1999/00 6.38 6.73 6.00 7.00 7.97 6.61 2000/01 7.66 5.46 5.61 8.51 9.45 7.04 2001/02 5.99 8.42 5.77 6.66 9.03 6.77 2002/03 3.87 7.56 7.44 7.82 9.52 7.02 Source: County of San Diego Health and Human Services Agency, Division of Emergency Medical Services, San Diego County Trauma Registry, FY 1986/87 – 2002/03 *Rates not calculated on fewer than five incidents

Chapter 4 Severe Trauma Patients
Page 44 San Diego County Trauma System 20 Year Report
Fall Injuries
Figure 4-9: Fall-Related Severe Injury Rates by Age Group, FY 1986/87 - 2002/03
0102030405060708090
1986
/87
1987
/88
1988
/89
1989
/90
1990
/91
1991
/92
1992
/93
1993
/94
1994
/95
1995
/96
1996
/97
1997
/98
1998
/99
1999
/00
2000
/01
2001
/02
2002
/03
Fiscal Year
Rat
e p
er 1
00,0
00
0-14 15-24 25-44 45-64 65+
Source: County of San Diego Health and Human Services Agency, Division of Emergency Medical Services, San Diego County Trauma Registry, FY 1986/87 – 2002/03. Severe trauma from falls showed the greatest increase of any of the causes of injury over this time period, with almost all of the increase isolated among the older adult population. From FY 1992/93 to 2002/03, the fall-related severe trauma rate among adults age 65 and older increased by more than four times.
Table 4-9 Fall Severe Injury Rates (per 100,000) by Age Group, FY 1986/87 – 2002/03
Age Group Fiscal Year 0-14 15-24 25-44 45-64 65+
All Ages
1986/87 6.31 6.19 7.08 6.47 12.05 7.20 1987/88 8.06 7.59 9.08 9.11 17.50 9.58 1988/89 9.05 10.78 8.70 7.51 12.08 9.35 1989/90 8.03 8.23 9.67 9.54 15.38 9.69 1990/91 5.64 7.28 8.43 10.78 19.13 9.21 1991/92 9.77 10.04 7.74 6.57 20.57 9.76 1992/93 10.22 6.30 8.19 5.28 15.12 8.56 1993/94 10.15 4.45 8.54 5.63 23.79 9.37 1994/95 7.03 4.93 7.76 9.59 26.81 9.57 1995/96 8.60 9.20 7.90 13.21 25.62 11.18 1996/97 10.41 6.81 7.63 12.68 37.54 12.32 1997/98 8.98 7.43 9.21 15.87 40.46 13.58 1998/99 9.47 4.61 11.69 15.71 48.44 14.94 1999/00 11.45 6.73 9.66 17.22 50.04 15.60 2000/01 11.25 6.37 11.44 19.61 57.95 17.44 2001/02 8.91 7.32 10.46 17.48 61.03 16.68 2002/03 8.39 8.00 13.16 22.51 81.39 20.83 Source: County of San Diego Health and Human Services Agency, Division of Emergency Medical Services, San Diego County Trauma Registry, FY 1986/87 – 2002/03 *Rates not calculated on fewer than five incidents

Severe Trauma Patients Chapter 4
San Diego County Trauma System 20 Year Report Page 45
Figure 4-10: Fall-Related Severe Injury Rates to Adults 45 Years and Older,
FY 1986/87 - 2002/03
0
50
100
150
200
250
1986
/87
1987
/88
1988
/89
1989
/90
1990
/91
1991
/92
1992
/93
1993
/94
1994
/95
1995
/96
1996
/97
1997
/98
1998
/99
1999
/00
2000
/01
2001
/02
2002
/03
Fiscal Year
Rat
e p
er 1
00,0
00
45-54 55-64 65-74 75-84 85+
Source: County of San Diego Health and Human Services Agency, Division of Emergency Medical Services, San Diego County Trauma Registry, FY 1986/87 – 2002/03. Examining the older adult population in more detail, the injury rate is magnified with increasing age, as those age 85 and older approached 200 per 100,000 compared with 85 per 100,000 among 75 to 84, and 49 per 100,000 among 65 to 74 year olds.
Table 4-10 Fall Severe Injury Rates (per 100,000)
by Age Group, Older Adults, FY 1986/87 – 2002/03 Age Group
Fiscal Year 45-54 55-64 65-74 75-84 85+ Total 45+
1986/87 4.43 8.93 8.96 15.12 20.43 8.71 1987/88 8.86 9.41 17.51 13.29 30.86 12.47 1988/89 5.30 10.43 12.55 6.96 25.52 9.33 1989/90 9.51 9.58 11.03 18.86 31.86 11.92 1990/91 9.71 12.19 17.22 13.60 49.55 14.11 1991/92 6.64 6.47 16.65 24.94 28.99 12.03 1992/93 4.49 6.41 10.55 12.68 49.14 9.07 1993/94 4.75 6.91 19.34 29.07 30.88 12.57 1994/95 6.77 13.77 17.55 33.69 53.85 16.13 1995/96 11.15 16.33 13.83 31.16 66.06 17.89 1996/97 14.16 11.96 27.55 41.13 64.06 21.99 1997/98 14.28 20.91 31.01 40.77 96.00 25.03 1998/99 13.05 20.00 34.46 52.10 95.20 27.80 1999/00 17.86 16.12 27.49 63.95 104.38 29.04 2000/01 21.10 17.05 30.64 62.82 157.13 33.24 2001/02 17.27 17.84 40.71 73.37 104.47 32.66 2002/03 21.44 24.24 49.29 84.65 193.23 42.65 Source: County of San Diego Health and Human Services Agency, Division of Emergency Medical Services, San Diego County Trauma Registry, FY 1986/87 – 2002/03 *Rates not calculated on fewer than five incidents
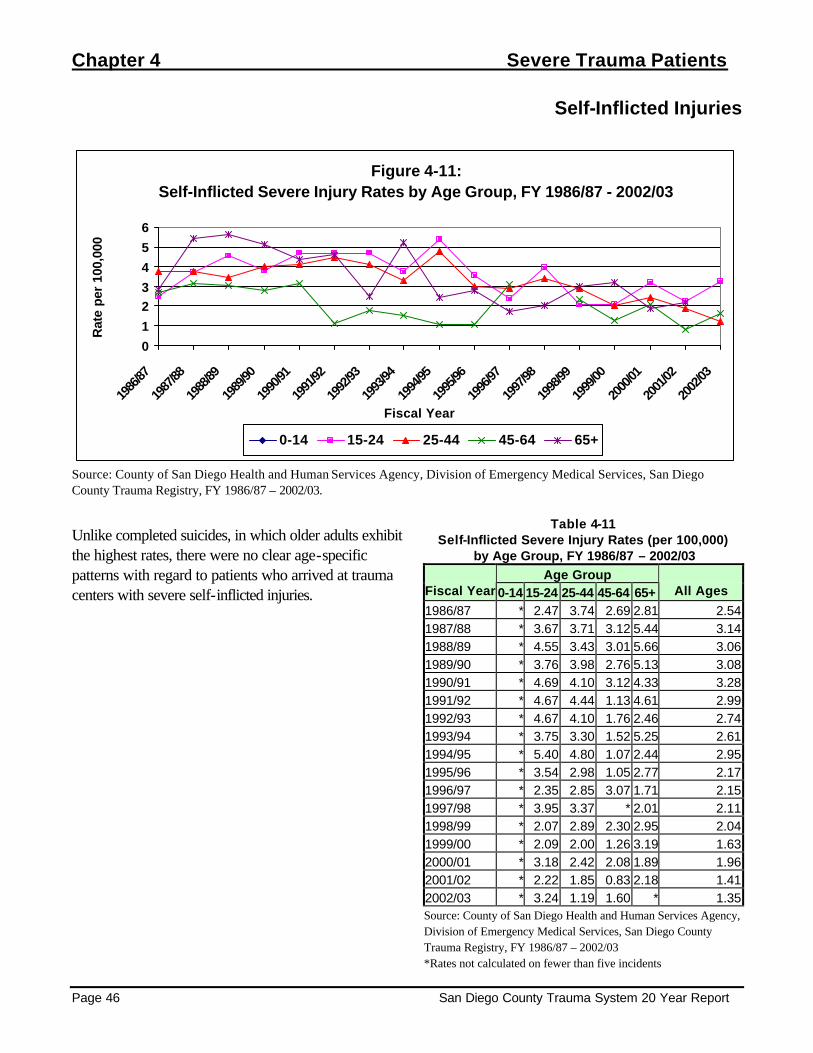
Chapter 4 Severe Trauma Patients
Page 46 San Diego County Trauma System 20 Year Report
Self-Inflicted Injuries
Figure 4-11: Self-Inflicted Severe Injury Rates by Age Group, FY 1986/87 - 2002/03
0
1
23
4
5
6
1986
/87
1987
/88
1988
/89
1989
/90
1990
/91
1991
/92
1992
/93
1993
/94
1994
/95
1995
/96
1996
/97
1997
/98
1998
/99
1999
/00
2000
/01
2001
/02
2002
/03
Fiscal Year
Rat
e pe
r 10
0,00
0
0-14 15-24 25-44 45-64 65+
Source: County of San Diego Health and Human Services Agency, Division of Emergency Medical Services, San Diego County Trauma Registry, FY 1986/87 – 2002/03.
Unlike completed suicides, in which older adults exhibit the highest rates, there were no clear age-specific patterns with regard to patients who arrived at trauma centers with severe self-inflicted injuries.
Table 4-11 Self-Inflicted Severe Injury Rates (per 100,000)
by Age Group, FY 1986/87 – 2002/03 Age Group
Fiscal Year 0-14 15-24 25-44 45-64 65+ All Ages
1986/87 * 2.47 3.74 2.69 2.81 2.54 1987/88 * 3.67 3.71 3.12 5.44 3.14 1988/89 * 4.55 3.43 3.01 5.66 3.06 1989/90 * 3.76 3.98 2.76 5.13 3.08 1990/91 * 4.69 4.10 3.12 4.33 3.28 1991/92 * 4.67 4.44 1.13 4.61 2.99 1992/93 * 4.67 4.10 1.76 2.46 2.74 1993/94 * 3.75 3.30 1.52 5.25 2.61 1994/95 * 5.40 4.80 1.07 2.44 2.95 1995/96 * 3.54 2.98 1.05 2.77 2.17 1996/97 * 2.35 2.85 3.07 1.71 2.15 1997/98 * 3.95 3.37 * 2.01 2.11 1998/99 * 2.07 2.89 2.30 2.95 2.04 1999/00 * 2.09 2.00 1.26 3.19 1.63 2000/01 * 3.18 2.42 2.08 1.89 1.96 2001/02 * 2.22 1.85 0.83 2.18 1.41 2002/03 * 3.24 1.19 1.60 * 1.35 Source: County of San Diego Health and Human Services Agency, Division of Emergency Medical Services, San Diego County Trauma Registry, FY 1986/87 – 2002/03 *Rates not calculated on fewer than five incidents
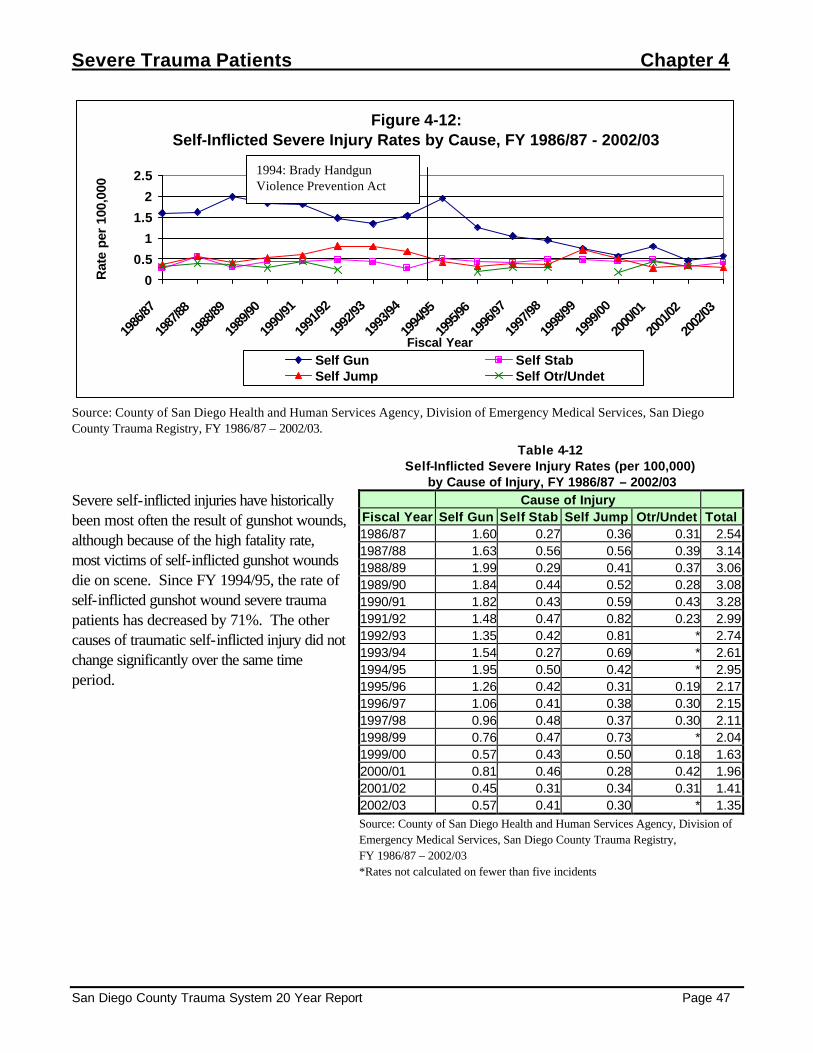
Severe Trauma Patients Chapter 4
San Diego County Trauma System 20 Year Report Page 47
Figure 4-12: Self-Inflicted Severe Injury Rates by Cause, FY 1986/87 - 2002/03
0
0.5
1
1.5
2
2.5
1986
/87
1987
/88
1988
/89
1989
/90
1990
/91
1991
/92
1992
/93
1993
/94
1994
/95
1995
/96
1996
/97
1997
/98
1998
/99
1999
/00
2000
/01
2001
/02
2002
/03
Fiscal Year
Rat
e pe
r 10
0,00
0
Self Gun Self StabSelf Jump Self Otr/Undet
Source: County of San Diego Health and Human Services Agency, Division of Emergency Medical Services, San Diego County Trauma Registry, FY 1986/87 – 2002/03.
Severe self-inflicted injuries have historically been most often the result of gunshot wounds, although because of the high fatality rate, most victims of self-inflicted gunshot wounds die on scene. Since FY 1994/95, the rate of self-inflicted gunshot wound severe trauma patients has decreased by 71%. The other causes of traumatic self-inflicted injury did not change significantly over the same time period.
Table 4-12 Self-Inflicted Severe Injury Rates (per 100,000)
by Cause of Injury, FY 1986/87 – 2002/03 Cause of Injury
Fiscal Year Self Gun Self Stab Self Jump Otr/Undet Total 1986/87 1.60 0.27 0.36 0.31 2.54 1987/88 1.63 0.56 0.56 0.39 3.14 1988/89 1.99 0.29 0.41 0.37 3.06 1989/90 1.84 0.44 0.52 0.28 3.08 1990/91 1.82 0.43 0.59 0.43 3.28 1991/92 1.48 0.47 0.82 0.23 2.99 1992/93 1.35 0.42 0.81 * 2.74 1993/94 1.54 0.27 0.69 * 2.61 1994/95 1.95 0.50 0.42 * 2.95 1995/96 1.26 0.42 0.31 0.19 2.17 1996/97 1.06 0.41 0.38 0.30 2.15 1997/98 0.96 0.48 0.37 0.30 2.11 1998/99 0.76 0.47 0.73 * 2.04 1999/00 0.57 0.43 0.50 0.18 1.63 2000/01 0.81 0.46 0.28 0.42 1.96 2001/02 0.45 0.31 0.34 0.31 1.41 2002/03 0.57 0.41 0.30 * 1.35 Source: County of San Diego Health and Human Services Agency, Division of Emergency Medical Services, San Diego County Trauma Registry, FY 1986/87 – 2002/03 *Rates not calculated on fewer than five incidents
1994: Brady Handgun Violence Prevention Act

Chapter 4 Severe Trauma Patients
Page 48 San Diego County Trauma System 20 Year Report
Assault Injuries
Figure 4-13: Assault-Related Severe Injury Rates by Age Group,
FY 1986/87 - 2002/03
0102030405060
1986
/87
1987
/88
1988
/89
1989
/90
1990
/91
1991
/92
1992
/93
1993
/94
1994
/95
1995
/96
1996
/97
1997
/98
1998
/99
1999
/00
2000
/01
2001
/02
2002
/03
Fiscal Year
Rat
e p
er 1
00,0
00
0-14 15-24 25-44 45-64 65+
Source: County of San Diego Health and Human Services Agency, Division of Emergency Medical Services, San Diego County Trauma Registry, FY 1986/87 – 2002/03.
The highest rates of severe trauma due to assault have consistently been among individuals age 15 to 24, followed by 25 to 44 year olds. The rates for both of these groups declined from FY 1991/92 through 1999/00 by more than half.
Table 4-13 Assault-Related Severe Injury Rates (per 100,000)
by Age Group, FY 1986/87 – 2002/03 Age Group
Fiscal Year 0-14 15-24 25-44 45-64 65+ All
Ages 1986/87 2.74 27.71 24.30 5.39 * 14.68 1987/88 3.83 30.38 23.27 6.24 4.67 15.50 1988/89 3.27 35.45 23.77 6.01 3.02 16.17 1989/90 4.40 33.17 28.21 9.04 3.66 18.33 1990/91 6.96 47.88 30.66 7.19 4.33 21.82 1991/92 3.50 50.22 30.61 7.02 2.48 21.03 1992/93 4.93 45.06 28.67 7.48 3.87 19.93 1993/94 6.89 47.29 22.55 7.80 2.10 18.43 1994/95 5.76 40.40 22.38 6.39 3.48 16.84 1995/96 5.91 38.21 27.82 6.71 2.08 18.16 1996/97 5.12 34.97 16.62 6.34 4.78 13.91 1997/98 3.97 31.82 17.08 8.73 2.01 13.39 1998/99 2.88 25.80 16.25 9.39 3.93 12.21 1999/00 3.93 20.66 12.55 4.48 2.87 9.24 2000/01 4.24 24.33 11.33 6.77 6.30 10.33 2001/02 2.59 23.50 13.72 5.00 3.43 9.94 2002/03 3.23 26.80 16.83 8.46 1.54 12.09 Source: County of San Diego Health and Human Services Agency, Division of Emergency Medical Services, San Diego County Trauma Registry, FY 1986/87 – 2002/03 *Rates not calculated on fewer than five incidents

Severe Trauma Patients Chapter 4
San Diego County Trauma System 20 Year Report Page 49
Figure 4-14: Assault-Related Severe Injury Rates by Cause, FY 1986/87 - 2002/03
0
2
4
6
8
10
1986
/87
1987
/88
1988
/89
1989
/90
1990
/91
1991
/92
1992
/93
1993
/94
1994
/95
1995
/96
1996
/97
1997
/98
1998
/99
1999
/00
2000
/01
2001
/02
2002
/03
Fiscal Year
Rat
e pe
r 10
0,00
0
Assault by Gun Assault by Stab Assault Other/Unarmed
Source: County of San Diego Health and Human Services Agency, Division of Emergency Medical Services, San Diego County Trauma Registry, FY 1986/87 – 2002/03.
The rates of severe trauma from assault by gun and by stabbing have both declined significantly from the early 90s, while other and unarmed assault injuries have increased.
Table 4-14 Assault-Related Severe Injury Rates (per 100,000)
by Cause of Injury, FY 1986/87 – 2002/03 Cause of Injury
Fiscal Year Assault by Gun
Assault by Stab
Assault Other Total
1986/87 5.96 5.78 2.98 14.681987/88 5.84 5.93 3.74 15.501988/89 7.16 5.50 3.52 16.171989/90 7.61 5.96 4.80 18.331990/91 7.71 9.09 5.06 21.821991/92 8.79 8.12 4.12 21.031992/93 8.75 6.63 4.55 19.931993/94 7.95 5.34 5.15 18.431994/95 7.23 4.48 5.13 16.841995/96 6.03 5.49 6.64 18.161996/97 4.26 3.69 5.95 13.911997/98 3.96 3.48 5.96 13.391998/99 3.31 3.09 5.82 12.211999/00 1.71 2.88 4.66 9.242000/01 2.07 2.87 5.39 10.332001/02 1.96 2.78 5.19 9.942002/03 2.53 3.34 6.21 12.09Source: County of San Diego Health and Human Services Agency, Division of Emergency Medical Services, San Diego County Trauma Registry, FY 1986/87 – 2002/03 *Rates not calculated on fewer than five incidents

Chapter 4 Severe Trauma Patients
Page 50 San Diego County Trauma System 20 Year Report

Traumatic Deaths Chapter 5
San Diego County Trauma System 20 Year Report Page 51
Death from Trauma The San Diego County Medical Examiner investigates all deaths resulting from trauma, regardless of whether they occur in a trauma facility, another hospital, or elsewhere. The Medical Examiner is integral to the trauma quality assurance process, providing autopsy reports for case review and actively participating in the Medical Audit Committee (MAC). This chapter examines the trends of traumatic deaths using data from the Medical Examiner’s Office from fiscal year 1988/89 through 2002/03. During this time period, the total number and rate of deaths resulting from trauma in San Diego County have declined steadily from a high of 1001 deaths (rate: 40 per 100,000 population) in FY 1989/90 to 754 (25/100,000) in 2002/03. The decline in the traumatic death rate was reflected in every cause of traumatic death except for deaths from falls, which have increased by more than double from 1994/95 to 2002/03.
Table 5-1 Number of Deaths from Trauma by Cause of Injury, FY 1988/89 – 2002/03
Cause of Injury Fiscal Year
MV Occupant Motorcycle Pedalcycle Pedestrian Other VehicleFalls Suicide Homicide
Other/ Unknown Total
1988/89 245 50 15 119 18 78 183 172 44 924 1989/90 249 57 13 135 11 90 189 212 45 1001 1990/91 217 55 14 117 32 65 202 247 37 986 1991/92 226 46 13 108 17 75 198 272 30 985 1992/93 196 25 16 96 20 71 208 235 30 897 1993/94 171 32 15 87 25 60 222 229 26 867 1994/95 186 25 11 92 21 60 228 203 36 862 1995/96 198 27 18 54 25 91 201 203 26 843 1996/97 186 21 17 55 31 97 206 149 31 793 1997/98 145 30 11 66 19 99 182 112 30 694 1998/99 215 20 8 70 23 125 180 96 51 788 1999/00 167 23 10 79 17 145 168 94 31 734 2000/01 211 36 7 75 24 115 187 106 45 806 2001/02 192 28 15 76 23 142 172 81 34 763 2002/03 206 32 7 66 15 156 167 84 21 754 Source: County of San Diego Health and Human Services Agency, Division of Emergency Medical Services, Medical Examiner Database, FY 1988/89 – 2002/03

Chapter 5 Traumatic Deaths
Page 52 San Diego County Trauma System 20 Year Report
Table 5-2
Traumatic Death Rates* by Cause of Injury, FY 1988/89 – 2002/03 Cause of Injury
Fiscal Year
MV Occupant Motorcycle Pedalcycle Pedestrian Other VehicleFalls Suicide Homicide
Other/ Unknown Total
1988/89 10.13 2.07 0.62 4.92 0.74 3.23 7.57 7.11 1.82 38.22 1989/90 9.97 2.28 0.52 5.40 0.44 3.60 7.57 8.49 1.80 40.07 1990/91 8.58 2.17 0.55 4.62 1.26 2.57 7.98 9.76 1.46 38.98 1991/92 8.79 1.79 0.51 4.20 0.66 2.92 7.70 10.57 1.17 38.29 1992/93 7.56 0.96 0.62 3.70 0.77 2.74 8.02 9.06 1.16 34.58 1993/94 6.57 1.23 0.58 3.34 0.96 2.30 8.52 8.79 1.00 33.29 1994/95 7.12 0.96 0.42 3.52 0.80 2.30 8.73 7.77 1.38 32.99 1995/96 7.55 1.03 0.69 2.06 0.95 3.47 7.67 7.74 0.99 32.16 1996/97 7.01 0.79 0.64 2.07 1.17 3.66 7.76 5.62 1.17 29.89 1997/98 5.36 1.11 0.41 2.44 0.70 3.66 6.73 4.14 1.11 25.68 1998/99 7.82 0.73 0.29 2.54 0.84 4.54 6.54 3.49 1.85 28.64 1999/00 5.93 0.82 0.36 2.81 0.60 5.15 5.97 3.34 1.10 26.09 2000/01 7.39 1.26 0.25 2.63 0.84 4.03 6.55 3.71 1.58 28.22 2001/02 6.60 0.96 0.52 2.61 0.79 4.88 5.91 2.78 1.17 26.23 2002/03 6.96 1.08 0.24 2.23 0.51 5.27 5.64 2.84 0.71 25.46 Source: County of San Diego Health and Human Services Agency, Division of Emergency Medical Services, Medical Examiner Database, FY 1988/89 – 2002/03 *Rates are per 100,000

Traumatic Deaths Chapter 5
San Diego County Trauma System 20 Year Report Page 53
Figure 5-1: Traumatic Death Rates by Age Group,
All Causes, FY 1988/89 - 2002/03
01020304050607080
1988
/89
1989
/90
1990
/91
1991
/92
1992
/93
1993
/94
1994
/95
1995
/96
1996
/97
1997
/98
1998
/99
1999
/00
2000
/01
2001
/02
2002
/03
Fiscal Year
Rat
e p
er 1
00,0
00
0-14 15-24 25-44 45-64 65+
Source: County of San Diego Health and Human Services Agency, Division of Emergency Medical Services, Medical Examiner Database, FY 1988/89 – 2002/03. N=12,697 Note: Age was unknown for 197 cases. The traumatic death rate has declined steadily among those aged 15 to 44, while the population 65 years of age and older has experienced a general increase in traumatic death rate since FY 1992/93. This trend reflects the observed increase in deaths from falls at the same time that death from other traumatic causes have been on the decline.
Table 5-3 Traumatic Death Rates (per 100,000) by Age Group, FY 1988/89 – 2002/03
Age Group Fiscal Year 0-14 15-24 25-44 45-64 65+ All Ages
1988/89 7.51 53.65 40.80 30.31 64.53 38.221989/90 8.23 54.35 44.60 33.66 61.14 40.071990/91 9.40 55.86 41.71 37.38 53.78 38.981991/92 9.04 56.99 41.54 32.40 57.10 38.291992/93 8.58 51.83 40.04 28.61 47.13 34.581993/94 7.07 47.53 36.10 29.23 57.04 33.291994/95 6.49 40.63 38.14 30.47 58.84 32.991995/96 6.81 36.56 36.87 26.84 65.08 32.161996/97 8.65 35.20 30.62 26.79 64.15 29.891997/98 5.01 30.42 23.15 27.77 62.20 25.681998/99 4.57 32.25 27.83 29.70 67.43 28.641999/00 4.09 33.19 22.87 27.62 63.75 26.092000/01 5.87 36.61 26.62 30.03 59.53 28.222001/02 2.43 31.48 23.09 30.64 64.14 26.232002/03 2.74 27.23 22.76 28.90 66.34 25.46Source: County of San Diego Health and Human Services Agency, Division of Emergency Medical Services, Medical Examiner Database, FY 1988/89 – 2002/03.

Chapter 5 Traumatic Deaths
Page 54 San Diego County Trauma System 20 Year Report
Transportation-Related Deaths
Figure 5-2: Transportation-Related Traumatic Death Rates by Cause,
FY 1988/89 - 2002/03
0
2
4
6
8
10
12
1988
/89
1989
/90
1990
/91
1991
/92
1992
/93
1993
/94
1994
/95
1995
/96
1996
/97
1997
/98
1998
/99
1999
/00
2000
/01
2001
/02
2002
/03
Fiscal Year
Rat
e p
er 1
00,0
00
MV Occupant Motorcycle PedalcyclePedestrian Other Vehicle
Source: County of San Diego Health and Human Services Agency, Division of Emergency Medical Services, Medical Examiner Database, FY 1988/89 – 2002/03. N=5,323 By far the most common cause of transportation-related death is injuries to motor vehicle occupants, with 57% of transportation-related deaths and 23% of all traumatic deaths during this time period. However, the death rates from motor vehicle occupant, motorcycle, and pedestrian injury have all declined from 1988/89 to 2002/03.
Table 5-4 Transportation-Related Death Rates (per 100,000) by Cause,
FY 1988/89 – 2002/03 Fiscal Year
MV Occupant
Motor- cycle
Pedal-cycle Pedestrian
Other Vehicle Total
1988/89 10.1 2.1 0.6 4.9 0.7 18.51989/90 10.0 2.3 0.5 5.4 0.4 18.61990/91 8.6 2.2 0.6 4.6 1.3 17.21991/92 8.8 1.8 0.5 4.2 0.7 15.91992/93 7.6 1.0 0.6 3.7 0.8 13.61993/94 6.6 1.2 0.6 3.3 1.0 12.71994/95 7.1 1.0 0.4 3.5 0.8 12.81995/96 7.6 1.0 0.7 2.1 1.0 12.31996/97 7.0 0.8 0.6 2.1 1.2 11.71997/98 5.4 1.1 0.4 2.4 0.7 10.01998/99 7.8 0.7 0.3 2.5 0.8 12.21999/00 5.9 0.8 0.4 2.8 0.6 10.52000/01 7.4 1.3 0.2 2.6 0.8 12.42001/02 6.6 1.0 0.5 2.6 0.8 11.52002/03 7.0 1.1 0.2 2.2 0.5 11.0Source: County of San Diego Health and Human Services Agency, Division of Emergency Medical Services, Medical Examiner Database, FY 1988/89 – 2002/03.
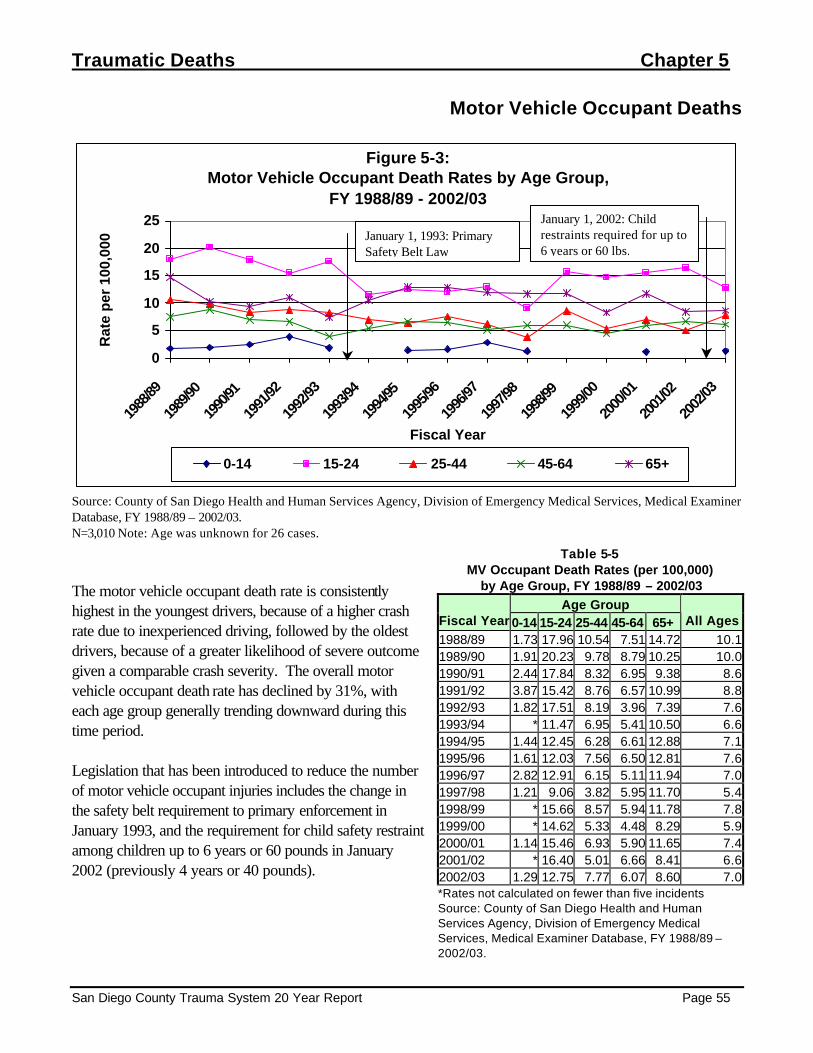
Traumatic Deaths Chapter 5
San Diego County Trauma System 20 Year Report Page 55
Motor Vehicle Occupant Deaths
Figure 5-3: Motor Vehicle Occupant Death Rates by Age Group,
FY 1988/89 - 2002/03
0
5
10
15
20
25
1988
/89
1989
/90
1990
/91
1991
/92
1992
/93
1993
/94
1994
/95
1995
/96
1996
/97
1997
/98
1998
/99
1999
/00
2000
/01
2001
/02
2002
/03
Fiscal Year
Rat
e p
er 1
00,0
00
0-14 15-24 25-44 45-64 65+
Source: County of San Diego Health and Human Services Agency, Division of Emergency Medical Services, Medical Examiner Database, FY 1988/89 – 2002/03. N=3,010 Note: Age was unknown for 26 cases. The motor vehicle occupant death rate is consistently highest in the youngest drivers, because of a higher crash rate due to inexperienced driving, followed by the oldest drivers, because of a greater likelihood of severe outcome given a comparable crash severity. The overall motor vehicle occupant death rate has declined by 31%, with each age group generally trending downward during this time period. Legislation that has been introduced to reduce the number of motor vehicle occupant injuries includes the change in the safety belt requirement to primary enforcement in January 1993, and the requirement for child safety restraint among children up to 6 years or 60 pounds in January 2002 (previously 4 years or 40 pounds).
Table 5-5 MV Occupant Death Rates (per 100,000)
by Age Group, FY 1988/89 – 2002/03 Age Group
Fiscal Year 0-14 15-24 25-44 45-64 65+ All Ages 1988/89 1.73 17.96 10.54 7.51 14.72 10.1 1989/90 1.91 20.23 9.78 8.79 10.25 10.0 1990/91 2.44 17.84 8.32 6.95 9.38 8.6 1991/92 3.87 15.42 8.76 6.57 10.99 8.8 1992/93 1.82 17.51 8.19 3.96 7.39 7.6 1993/94 * 11.47 6.95 5.41 10.50 6.6 1994/95 1.44 12.45 6.28 6.61 12.88 7.1 1995/96 1.61 12.03 7.56 6.50 12.81 7.6 1996/97 2.82 12.91 6.15 5.11 11.94 7.0 1997/98 1.21 9.06 3.82 5.95 11.70 5.4 1998/99 * 15.66 8.57 5.94 11.78 7.8 1999/00 * 14.62 5.33 4.48 8.29 5.9 2000/01 1.14 15.46 6.93 5.90 11.65 7.4 2001/02 * 16.40 5.01 6.66 8.41 6.6 2002/03 1.29 12.75 7.77 6.07 8.60 7.0 *Rates not calculated on fewer than five incidents Source: County of San Diego Health and Human Services Agency, Division of Emergency Medical Services, Medical Examiner Database, FY 1988/89 – 2002/03.
January 1, 1993: Primary Safety Belt Law
January 1, 2002: Child restraints required for up to 6 years or 60 lbs.

Chapter 5 Traumatic Deaths
Page 56 San Diego County Trauma System 20 Year Report
Motorcyclist Deaths
Figure 5-4: Motorcycle Death Rates by Age Group,
FY 1988/89 - 2002/03
01234567
1988
/89
1989
/90
1990
/91
1991
/92
1992
/93
1993
/94
1994
/95
1995
/96
1996
/97
1997
/98
1998
/99
1999
/00
2000
/01
2001
/02
2002
/03
Fiscal Year
Rat
e p
er 1
00,0
00
0-14 15-24 25-44 45-64 65+
Source: County of San Diego Health and Human Services Agency, Division of Emergency Medical Services, Medical Examiner Database, FY 1988/89 – 2002/03. N=507 Note: Age was unknown for 1 case. The majority of motorcycle riders are between 15 and 44 years of age, with crashes, injuries, and deaths concentrated in this age range. The death rate from motorcycle injuries declined dramatically from 1988/89 to 1992/93, and remained relatively stable since that time. Two major legislative initiatives may have influenced this trend. First, the California Motorcyclist Safety Program (CMSP), was implemented in July 1987 and required for all new motorcyclists under age 18 in January 1988. In January 1991, all new riders under 21 years were required to take this course. The second, and possibly most important, major step in motorcyclist safety, was the law to make motorcycle helmet use mandatory for all riders, effective January 1992.
Table 5-6 Motorcycle Death Rates (per 100,000) by Age Group, FY 1988/89 – 2002/03
Age Group Fiscal Year 0-14 15-24 25-44 45-64 65+ All Ages 1988/89 * 6.23 2.70 * * 2.07 1989/90 * 4.00 4.21 * * 2.28 1990/91 * 4.46 3.30 1.20 * 2.15 1991/92 * 5.84 1.93 * * 1.78 1992/93 * 3.27 1.02 * * 0.96 1993/94 * 2.58 1.82 * * 1.23 1994/95 * * 1.94 * * 0.96 1995/96 * 1.42 2.18 * * 1.03 1996/97 * * 1.25 1.02 * 0.78 1997/98 * 2.79 1.46 0.99 * 1.10 1998/99 * 1.38 1.22 * * 0.72 1999/00 * 2.55 0.56 1.26 * 0.81 2000/01 * 2.05 1.76 1.39 * 1.25 2001/02 * 1.77 0.98 1.67 * 0.95 2002/03 * 1.30 1.62 1.44 * 1.07 *Rates not calculated on fewer than five incidents Source: County of San Diego Health and Human Services Agency, Division of Emergency Medical Services, Medical Examiner Database, FY 1988/89 – 2002/03.
January 1992: Motorcycle Helmet Law
July 1987: CA Motorcyclist Safety Program
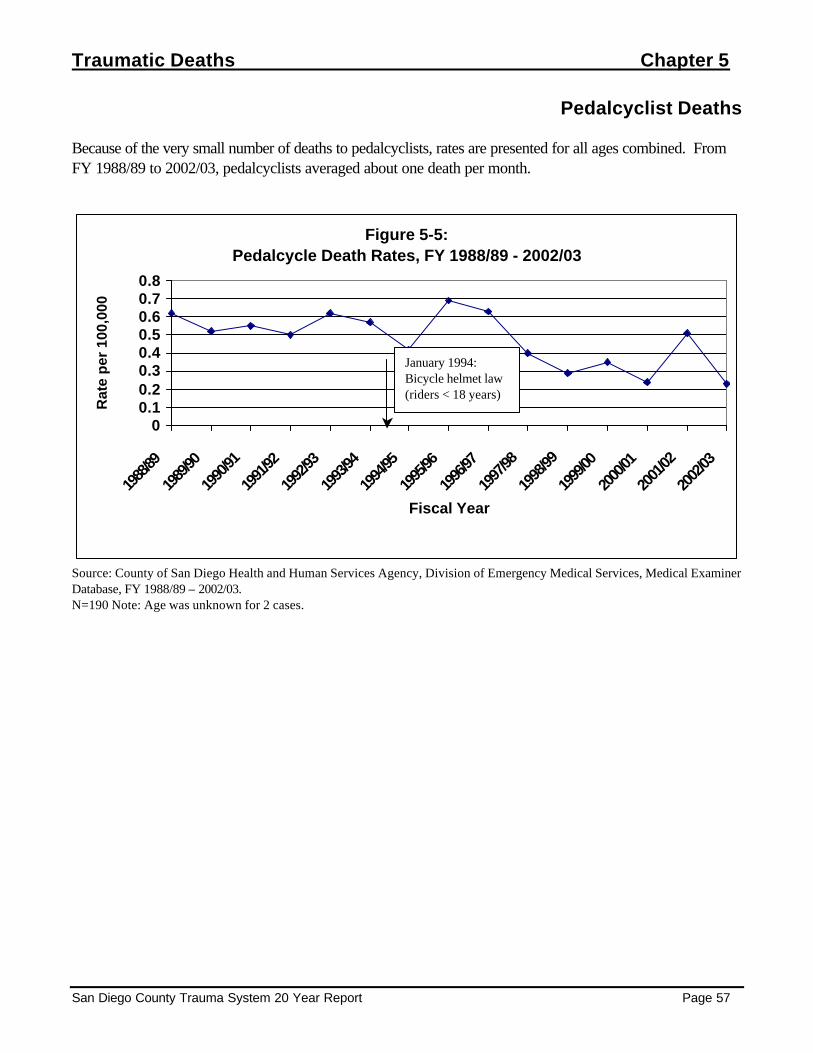
Traumatic Deaths Chapter 5
San Diego County Trauma System 20 Year Report Page 57
Pedalcyclist Deaths Because of the very small number of deaths to pedalcyclists, rates are presented for all ages combined. From FY 1988/89 to 2002/03, pedalcyclists averaged about one death per month.
Figure 5-5: Pedalcycle Death Rates, FY 1988/89 - 2002/03
00.10.20.30.40.50.60.70.8
1988
/89
1989
/90
1990
/91
1991
/92
1992
/93
1993
/94
1994
/95
1995
/96
1996
/97
1997
/98
1998
/99
1999
/00
2000
/01
2001
/02
2002
/03
Fiscal Year
Rat
e p
er 1
00,0
00
Source: County of San Diego Health and Human Services Agency, Division of Emergency Medical Services, Medical Examiner Database, FY 1988/89 – 2002/03. N=190 Note: Age was unknown for 2 cases.
January 1994: Bicycle helmet law (riders < 18 years)
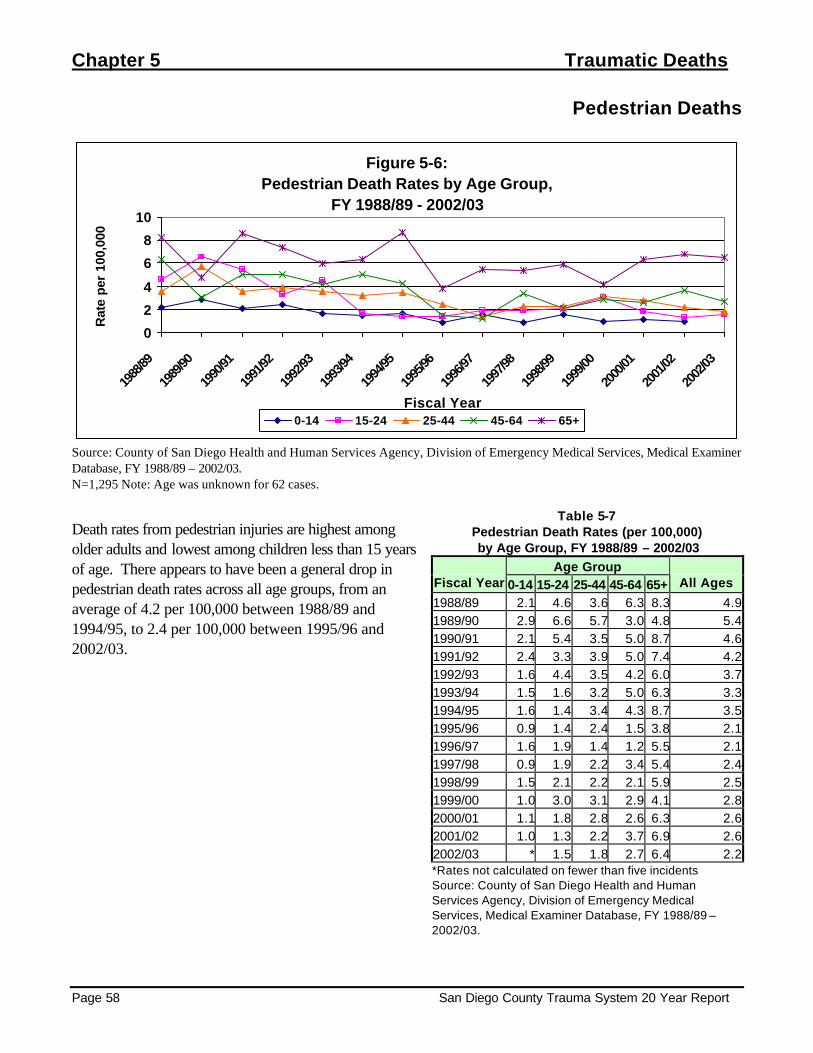
Chapter 5 Traumatic Deaths
Page 58 San Diego County Trauma System 20 Year Report
Pedestrian Deaths
Figure 5-6: Pedestrian Death Rates by Age Group,
FY 1988/89 - 2002/03
0
2
4
6
8
10
1988
/89
1989
/90
1990
/91
1991
/92
1992
/93
1993
/94
1994
/95
1995
/96
1996
/97
1997
/98
1998
/99
1999
/00
2000
/01
2001
/02
2002
/03
Fiscal Year
Rat
e pe
r 10
0,00
0
0-14 15-24 25-44 45-64 65+
Source: County of San Diego Health and Human Services Agency, Division of Emergency Medical Services, Medical Examiner Database, FY 1988/89 – 2002/03. N=1,295 Note: Age was unknown for 62 cases.
Death rates from pedestrian injuries are highest among older adults and lowest among children less than 15 years of age. There appears to have been a general drop in pedestrian death rates across all age groups, from an average of 4.2 per 100,000 between 1988/89 and 1994/95, to 2.4 per 100,000 between 1995/96 and 2002/03.
Table 5-7 Pedestrian Death Rates (per 100,000) by Age Group, FY 1988/89 – 2002/03
Age Group Fiscal Year 0-14 15-24 25-44 45-64 65+ All Ages
1988/89 2.1 4.6 3.6 6.3 8.3 4.9 1989/90 2.9 6.6 5.7 3.0 4.8 5.4 1990/91 2.1 5.4 3.5 5.0 8.7 4.6 1991/92 2.4 3.3 3.9 5.0 7.4 4.2 1992/93 1.6 4.4 3.5 4.2 6.0 3.7 1993/94 1.5 1.6 3.2 5.0 6.3 3.3 1994/95 1.6 1.4 3.4 4.3 8.7 3.5 1995/96 0.9 1.4 2.4 1.5 3.8 2.1 1996/97 1.6 1.9 1.4 1.2 5.5 2.1 1997/98 0.9 1.9 2.2 3.4 5.4 2.4 1998/99 1.5 2.1 2.2 2.1 5.9 2.5 1999/00 1.0 3.0 3.1 2.9 4.1 2.8 2000/01 1.1 1.8 2.8 2.6 6.3 2.6 2001/02 1.0 1.3 2.2 3.7 6.9 2.6 2002/03 * 1.5 1.8 2.7 6.4 2.2 *Rates not calculated on fewer than five incidents Source: County of San Diego Health and Human Services Agency, Division of Emergency Medical Services, Medical Examiner Database, FY 1988/89 – 2002/03.

Traumatic Deaths Chapter 5
San Diego County Trauma System 20 Year Report Page 59
Fall Deaths
Figure 5-7: Fall Death Rates by Age Group,
FY 1988/89 - 2002/03
05
10152025303540
1988
/89
1989
/90
1990
/91
1991
/92
1992
/93
1993
/94
1994
/95
1995
/96
1996
/97
1997
/98
1998
/99
1999
/00
2000
/01
2001
/02
2002
/03
Fiscal Year
Rat
e p
er 1
00,0
00
0-14 15-24 25-44 45-64 65+
Source: County of San Diego Health and Human Services Agency, Division of Emergency Medical Services, Medical Examiner Database, FY 1988/89 – 2002/03. N=1,469 Note: Age was unknown for 32 cases. The death rate from falls has increased continuously in recent years, especially among older adults. The rate among the 65 and older population in 2002/03 (37 per 100,000) was nearly four times higher than it was during FY 1990/91 (10 per 100,000). This trend grew more pronounced with increasing age, with the fall death rate among those 85 years and older surpassing 100 per 100,000 during FY 2002/03. As Figure 5-9 illustrates, the increase in death rate from falls was almost entirely due to a large increase in the rate of falls from the same level, while falls from height remained relatively stable.
Table 5-8 Fall Death Rates (per 100,000)
by Age Group, FY 1988/89 – 2002/03 Age Group
Fiscal Year0-14 15-24 25-44 45-64 65+ All Ages
1988/89 * * 1.10 3.01 17.36 3.231989/90 * * 1.71 3.01 20.50 3.601990/91 * * 0.80 5.27 10.11 2.571991/92 * 1.17 1.93 2.49 12.06 2.921992/93 * * 1.25 3.96 11.26 2.741993/94 * * 1.14 2.60 11.90 2.301994/95 * * 1.14 1.49 14.27 2.301995/96 * 1.42 0.69 * 25.62 3.471996/97 * * 1.37 3.27 21.84 3.661997/98 * * 0.67 3.17 24.08 3.661998/99 * * 1.11 3.83 29.79 4.541999/00 * * 1.22 5.92 31.55 5.152000/01 * 1.14 1.21 5.90 20.16 4.032001/02 * * 0.98 4.00 33.01 4.882002/03 * * * 4.95 37.16 5.27*Rates not calculated on fewer than five incidents Source: County of San Diego Health and Human Services Agency, Division of Emergency Medical Services, Medical Examiner Database, FY 1988/89 – 2002/03.

Chapter 5 Traumatic Deaths
Page 60 San Diego County Trauma System 20 Year Report
Figure 5-8: Fall Death Rates by Age Group,
Older Adults, FY 1988/89 - 2002/03
0
20
40
60
80
100
120
1988
/89
1989
/90
1990
/91
1991
/92
1992
/93
1993
/94
1994
/95
1995
/96
1996
/97
1997
/98
1998
/99
1999
/00
2000
/01
2001
/02
2002
/03
Fiscal Year
Rat
e p
er 1
00,0
00
45-54 55-64 65-74 75-84 85+
Source: County of San Diego Health and Human Services Agency, Division of Emergency Medical Services, Medical Examiner Database, FY 1988/89 – 2002/03. N=1,234
Figure 5-9: Fall Death Rates by Level of Fall,
FY 1988/89 - 2002/03
0
1
2
3
4
5
1988
/89
1989
/90
1990
/91
1991
/92
1992
/93
1993
/94
1994
/95
1995
/96
1996
/97
1997
/98
1998
/99
1999
/00
2000
/01
2001
/02
2002
/03
Fiscal Year
Rat
e p
er 1
00,0
00
Fall Same Level Fall from height
Source: County of San Diego Health and Human Services Agency, Division of Emergency Medical Services, Medical Examiner Database, FY 1988/89 – 2002/03. N=1,460. Level of fall was unknown in nine cases.

Traumatic Deaths Chapter 5
San Diego County Trauma System 20 Year Report Page 61
Suicide
Figure 5-10: Traumatic Suicide Rates by Age Group,
FY 1988/89 - 2002/03
0
5
10
15
20
25
1988
/89
1989
/90
1990
/91
1991
/92
1992
/93
1993
/94
1994
/95
1995
/96
1996
/97
1997
/98
1998
/99
1999
/00
2000
/01
2001
/02
2002
/03
Fiscal Year
Rat
e p
er 1
00,0
00
0-14 15-24 25-44 45-64 65+
Source: County of San Diego Health and Human Services Agency, Division of Emergency Medical Services, Medical Examiner Database, FY 1988/89 – 2002/03. N=2,893 Note: Age was unknown for 12 cases Adults 65 years of age and older have had the highest traumatic suicide rate overall. Since FY 1996/97, the traumatic suicide rate in this age group has dropped in half, from 20 to 10 traumatic suicide deaths per 100,000 population.
Table 5-9 Traumatic Suicide Rates (per 100,000) by Age Group, FY 1988/89 – 2002/03
Age Group Fiscal Year 0-14 15-24 25-44 45-64 65+ All Ages
1988/89 * 6.71 8.09 8.01 20.38 7.57 1989/90 * 5.65 8.65 9.04 18.67 7.57 1990/91 * 6.57 9.57 8.87 18.77 7.98 1991/92 * 6.07 7.74 9.29 21.28 7.70 1992/93 * 5.14 10.12 10.12 17.24 8.02 1993/94 * 8.43 9.68 8.01 21.35 8.52 1994/95 * 8.22 10.96 10.23 16.71 8.73 1995/96 * 5.90 9.27 10.07 15.58 7.67 1996/97 * 5.63 8.76 9.41 19.79 7.76 1997/98 * 6.04 7.08 8.13 17.39 6.73 1998/99 * 3.69 6.57 10.73 16.04 6.54 1999/00 * 3.95 6.77 7.00 15.94 5.97 2000/01 * 5.46 5.72 10.94 14.49 6.55 2001/02 * 4.66 6.10 9.32 12.14 5.91 2002/03 * 4.75 5.93 9.10 10.14 5.64 *Rates not calculated on fewer than five incidents Source: County of San Diego Health and Human Services Agency, Division of Emergency Medical Services, Medical Examiner Database, FY 1988/89 – 2002/03.

Chapter 5 Traumatic Deaths
Page 62 San Diego County Trauma System 20 Year Report
Figure 5-11: Traumatic Suicide Rates by Cause,
FY 1988/89 - 2002/03
012345678
1988
/89
1989
/90
1990
/91
1991
/92
1992
/93
1993
/94
1994
/95
1995
/96
1996
/97
1997
/98
1998
/99
1999
/00
2000
/01
2001
/02
2002
/03
Fiscal Year
Rat
e p
er 1
00,0
00
Self Gun Self Stab Self Jump Self Otr/Undet
Source: County of San Diego Health and Human Services Agency, Division of Emergency Medical Services, Medical Examiner Database, FY 1988/89 – 2002/03. N=2,893 The greatest change by suicide method has been in those committed by firearms, which has dropped 40%, from 7.3 to 4.4 deaths per 100,000 population from FY 1994/95 to 2002/03.
Table 5-10 Traumatic Suicide Rates (per 100,000)
by Cause of Injury, FY 1988/89 – 2002/03 Cause of Injury
Fiscal Year Self Gun Self Stab Self Jump Otr/Undet Total 1988/89 6.45 0.41 0.58 * 7.57 1989/90 6.45 * 0.80 0.20 7.57 1990/91 6.96 0.28 0.63 * 7.98 1991/92 6.61 0.19 0.62 0.27 7.70 1992/93 6.59 0.23 0.81 0.39 8.02 1993/94 6.91 0.38 0.96 0.27 8.52 1994/95 7.31 0.19 0.88 0.34 8.73 1995/96 6.41 0.31 0.61 0.34 7.67 1996/97 6.44 0.26 0.64 0.41 7.76 1997/98 5.55 0.33 0.52 0.33 6.73 1998/99 4.98 0.25 0.95 0.36 6.54 1999/00 4.62 0.36 0.89 * 5.97 2000/01 5.04 0.28 0.91 0.32 6.55 2001/02 4.71 0.34 0.48 0.38 5.91 2002/03 4.39 0.20 0.68 0.37 5.64 *Rates not calculated on fewer than five incidents Source: County of San Diego Health and Human Services Agency, Division of Emergency Medical Services, Medical Examiner Database, FY 1988/89 – 2002/03.
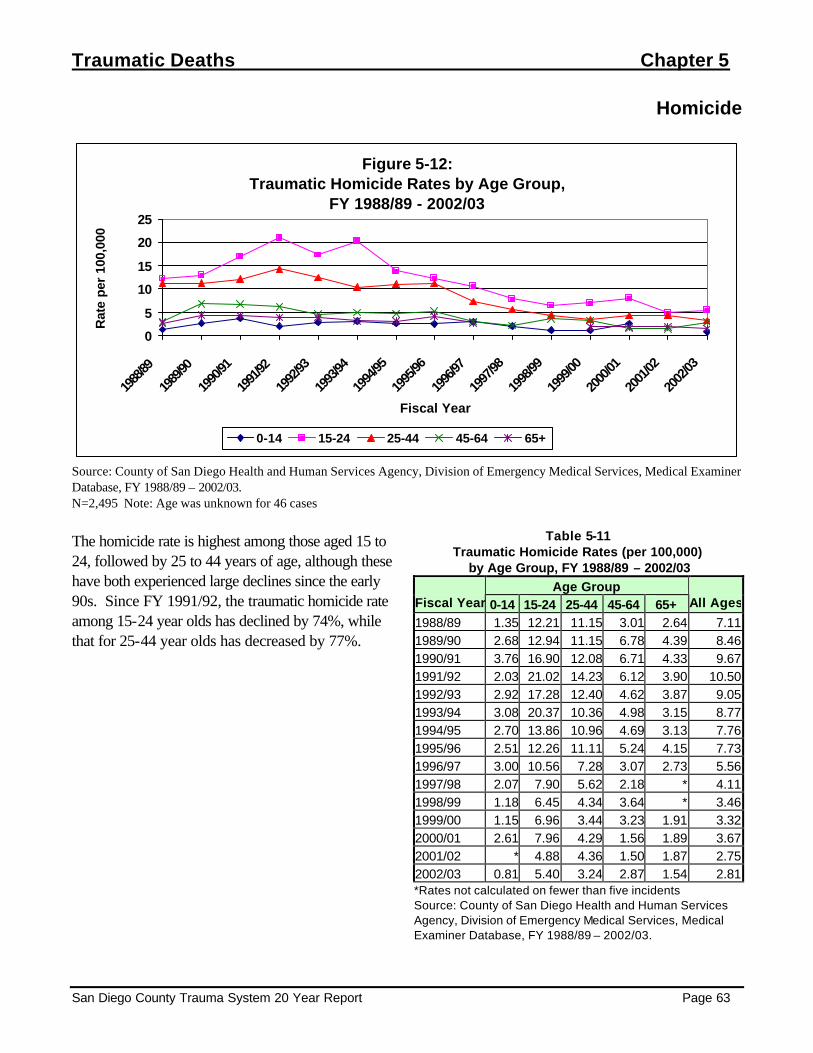
Traumatic Deaths Chapter 5
San Diego County Trauma System 20 Year Report Page 63
Homicide
Figure 5-12: Traumatic Homicide Rates by Age Group,
FY 1988/89 - 2002/03
0
5
10
15
20
25
1988
/89
1989
/90
1990
/91
1991
/92
1992
/93
1993
/94
1994
/95
1995
/96
1996
/97
1997
/98
1998
/99
1999
/00
2000
/01
2001
/02
2002
/03
Fiscal Year
Rat
e pe
r 10
0,00
0
0-14 15-24 25-44 45-64 65+
Source: County of San Diego Health and Human Services Agency, Division of Emergency Medical Services, Medical Examiner Database, FY 1988/89 – 2002/03. N=2,495 Note: Age was unknown for 46 cases The homicide rate is highest among those aged 15 to 24, followed by 25 to 44 years of age, although these have both experienced large declines since the early 90s. Since FY 1991/92, the traumatic homicide rate among 15-24 year olds has declined by 74%, while that for 25-44 year olds has decreased by 77%.
Table 5-11 Traumatic Homicide Rates (per 100,000)
by Age Group, FY 1988/89 – 2002/03 Age Group
Fiscal Year 0-14 15-24 25-44 45-64 65+ All Ages
1988/89 1.35 12.21 11.15 3.01 2.64 7.11 1989/90 2.68 12.94 11.15 6.78 4.39 8.46 1990/91 3.76 16.90 12.08 6.71 4.33 9.67 1991/92 2.03 21.02 14.23 6.12 3.90 10.50 1992/93 2.92 17.28 12.40 4.62 3.87 9.05 1993/94 3.08 20.37 10.36 4.98 3.15 8.77 1994/95 2.70 13.86 10.96 4.69 3.13 7.76 1995/96 2.51 12.26 11.11 5.24 4.15 7.73 1996/97 3.00 10.56 7.28 3.07 2.73 5.56 1997/98 2.07 7.90 5.62 2.18 * 4.11 1998/99 1.18 6.45 4.34 3.64 * 3.46 1999/00 1.15 6.96 3.44 3.23 1.91 3.32 2000/01 2.61 7.96 4.29 1.56 1.89 3.67 2001/02 * 4.88 4.36 1.50 1.87 2.75 2002/03 0.81 5.40 3.24 2.87 1.54 2.81 *Rates not calculated on fewer than five incidents Source: County of San Diego Health and Human Services Agency, Division of Emergency Medical Services, Medical Examiner Database, FY 1988/89 – 2002/03.

Chapter 5 Traumatic Deaths
Page 64 San Diego County Trauma System 20 Year Report
Figure 5-13: Traumatic Homicide Rates by Cause,
FY 1988/89 - 2002/03
012345678
1988
/89
1989
/90
1990
/91
1991
/92
1992
/93
1993
/94
1994
/95
1995
/96
1996
/97
1997
/98
1998
/99
1999
/00
2000
/01
2001
/02
2002
/03
Fiscal Year
Rat
e p
er 1
00,0
00
Assault by Gun Assault by Stab Assault Other
Source: County of San Diego Health and Human Services Agency, Division of Emergency Medical Services, Medical Examiner Database, FY 1988/89 – 2002/03. N=2,495 The firearm-related homicide rate dropped by 71% from FY 1991/92 to 2002/03. The rate of homicide by stabbing has also declined, by 81%.
Table 5-12 Traumatic Homicide Rates (per 100,000) by Cause of Injury, FY 1988/89 – 2002/03 Cause of Injury
Fiscal Year Assault by Gun
Assault by Stab
Assault Other Total
1988/89 4.51 1.82 0.79 7.111989/90 5.44 1.96 1.08 8.461990/91 5.65 2.37 1.74 9.671991/92 6.96 2.41 1.21 10.501992/93 6.24 1.54 1.27 9.051993/94 6.14 1.50 1.15 8.771994/95 5.17 1.15 1.45 7.761995/96 4.62 1.49 1.64 7.731996/97 3.35 0.72 1.55 5.561997/98 2.52 0.92 0.70 4.111998/99 2.00 0.58 0.91 3.461999/00 2.06 0.64 0.64 3.322000/01 2.28 0.77 0.67 3.672001/02 1.89 0.55 0.34 2.752002/03 1.62 0.44 0.78 2.81*Rates not calculated on fewer than five incidents Source: County of San Diego Health and Human Services Agency, Division of Emergency Medical Services, Medical Examiner Database, FY 1988/89 – 2002/03.