s&p paris-aligned & climate transition (pact) indices
TRANSCRIPT

March 2022 S&P Dow Jones Indices: Index Methodology
S&P Paris-Aligned & Climate Transition (PACT) Indices
Methodology

S&P Dow Jones Indices: S&P Paris-Aligned & Climate Transition (PACT) Indices Methodology 1
Table of Contents
Introduction 4
Index Objective 4
Highlights 4
Climate-Related Data 5
Trucost’s Transition Pathway Model 5
Trucost’s Physical Risk Data 6
Science Based Target Initiative (SBTI) 6
The S&P DJI ESG Score 7
Supporting Documents 7
Eligibility Criteria 8
Index Universe 8
Eligibility Factors 8
Index Exclusions 8
Exclusions Based on Business Activities 9
Exclusions Based on Sustainalytics’ Global Standards Screening 10
Exclusions Based on Revenue Thresholds in Fossil Fuel Operations and Power Generation 11
Controversies Monitoring: Media and Stakeholder Analysis Overlay 11
Multiple Classes of Stock 12
Index Construction 13
Constituent Selection 13
Constituent Weighting 13
Optimization Constraints 13
Table 1. Transition Risk Constraints 13
Table 2. Transition Pathway Constraint Alignment Value 14
Table 3. Physical Risk Constraints 14
Table 4. Climate Opportunities Constraint 15
Table 5. Index Construction Constraints 15
Table 6. Index Specific Liquidity Currency and Notional Portfolio Size Values 15
Constraint Relaxation Hierarchy 15
Constraint-Related Definitions 16
1.5ºC Climate Scenario Transition Pathway Budget Index Alignment 16
Weighted-Average Carbon Intensity (WACI) 16

S&P Dow Jones Indices: S&P Paris-Aligned & Climate Transition (PACT) Indices Methodology 2
Eligible Science Based Targets 17
High Climate Impact Sectors Revenue Proportion (HCISRP) 17
Non-Disclosing Carbon Companies 18
Fossil Fuel Reserves (FFR) 18
Green-to-Brown Revenue Share (GBR) 18
Index Calculations 19
Index Maintenance 20
Rebalancing 20
Ongoing Maintenance 20
Quarterly Updates 20
Additions and Deletions 20
Corporate Actions 20
Currency of Calculation and Additional Index Return Series 21
Base Dates and History Availability 21
Index Data 22
Calculation Return Types 22
Index Governance 23
Index Committee 23
Index Policy 24
Announcements 24
Pro-forma Files 24
Holiday Schedule 24
Rebalancing 24
Unexpected Exchange Closures 24
Recalculation Policy 24
Contact Information 24
Index Dissemination 25
Tickers 25
Index Data 26
S&P DJI ESG Scores Data 26
Website 26
Appendix I 27
Physical Risk Max Stock Weight Constraint 27
Appendix II 29
1.5ºC Climate Scenario Transition Pathway Budget Index Alignment Constraint 29
Table 7. Transition Pathway Budget Alignment Value Calculation Example 30
Appendix III 31

S&P Dow Jones Indices: S&P Paris-Aligned & Climate Transition (PACT) Indices Methodology 3
Trucost Methodology 31
Appendix IV 32
Methodology Changes 32
Appendix V 34
Index Anchor Date of Decarbonization Trajectory 34
Appendix VI 35
Indices in this Methodology Employing Backward Data Assumption 35
Backward Data Assumption 35
Designated Datasets Subject to Backward Data Assumption 35
Historical Coverage Assessment per Designated Dataset 36
Appendix VII 38
EU Required ESG Disclosures 38
Disclaimer 42
Performance Disclosure/Back-Tested Data 42
Intellectual Property Notices/Disclaimer 43

S&P Dow Jones Indices: S&P Paris-Aligned & Climate Transition (PACT) Indices Methodology 4
Introduction
Index Objective
The S&P Net Zero 2050 Climate Transition ESG Index Series and S&P Net Zero 2050 Paris-Aligned Climate ESG Index Series measure the performance of eligible equity securities from an underlying parent index selected and weighted to be collectively compatible with a 1.5ºC global warming climate scenario1 at the index level. The S&P Net Zero 2050 Paris-Aligned Climate ESG Index Series encompasses all the elements of the S&P Net Zero 2050 Climate Transition ESG Index Series, but are dif ferentiated by their additional restrictiveness and ambition, seen through their additional constraints and eligibility requirements. The indices apply exclusions based on companies’ involvement in specific business activities, performance against the principles of the United Nations’ Global Compact (UNGC), and involvement in relevant ESG controversies, all outlined in Eligibility Criteria.
Highlights
The indices aim to meet the minimum standards for EU Climate Transition Benchmarks (EU CTBs) and EU Paris-aligned Benchmarks (EU PABs) under Regulation (EU) 2019/2089 amending Regulation (EU) 2016/10112. The law proposes the definitions of minimum standards for the methodology of any ‘EU Climate Transition’ and ‘EU Paris-Aligned’ benchmark indices that would be aligned with the objectives of the Paris Agreement3, and addresses the risk of greenwashing. The indices also incorporate factors that seek to manage transition risk and climate change opportunities in a way that aligns them with the recommendations of the Financial Stability Board’s Task Force on Climate-related Financial Disclosures’ (TCFD) 2017 Final Report4, covering transition risk, climate change opportunities, and, for the S&P Net Zero 2050 Paris-Aligned Climate ESG Index Series, stranded asset and physical risk. Should a material change to the methodology be required as a consequence of any change made by the EU to the minimum standards for EU CTBs and/or EU PABs, S&P Dow Jones Indices will issue an announcement before the change is implemented (and in these circumstances, S&P Dow Jones Indices would not conduct a formal consultation). For clarity, any other methodology change will follow S&P Dow Jones Indices’ standard processes, which may include a consultation. Both index series’ weighting strategies aim to minimize the difference in constituent weights to the underlying parent index. In addition, the indices incorporate a variety of specified decarbonization targets and align with certain specified criteria through the use of optimization with multiple model constraints, including:
• alignment to a 1.5ºC climate scenario using Trucost’s Transition Pathway Model
• reduced overall greenhouse gas (GHG expressed in CO2 equivalents) emissions intensity compared to their respective underlying parent index by at least 30% and 50% for the S&P Net Zero 2050 Climate Transition ESG Index Series and S&P Net Zero 2050 Paris-Aligned Climate ESG Index Series respectively
1 A climate scenario of 1.5ºC above preindustrial levels has been deemed important by the IPCC: Masson -Delmotte, V., Zhai, P.,
Pörtner, H. O., Roberts, D., Skea, J., Shukla, P. R. Waterfield, T. (2018). Global warming of 1.5°C. An IPCC Special Report o n the impacts of global warming of 1.5°C. IPCC, available at https://www.ipcc.ch/sr15/.
2 Pursuant to Articles 19(a)(2) and 19(b)(1) of Regulation (EU) 2019/2089, Commission Delegated Regulation (EU) 2020/1818 lays down the minimum standards for EU CTBs and EU PABs https://eur-lex.europa.eu/legal-content/EN/TXT/?uri=CELEX:32020R1818.
3 UNFCCC. (2015). The Paris Agreement: https://unfccc.int/process-and-meetings/the-paris-agreement/the-paris-agreement.
4 Financial Stability Board’s Task Force on Climate-related Financial Disclosures’ (TCFD). (2017). Final Report: Recommendations
of the Task Force on Climate-related Financial Disclosures, available at https://www.fsb-tcfd.org/wp-content/uploads/2017/06/FINAL-2017-TCFD-Report-11052018.pdf.
S&P Dow Jones Indices: S&P Paris-Aligned & Climate Transition (PACT) Indices Methodology 5
• minimum self-decarbonization rate of GHG emissions intensity in accordance with the trajectory implied by Intergovernmental Panel on Climate Change’s (IPCC) most ambitious 1.5ºC scenario, equating to at least 7% GHG intensity reduction on average per annum
• increased exposure to companies with Science Based Targets from the Science Based Target Initiative (SBTI) that are credible and consistent with the above decarbonization trajectory
• improved S&P DJI ESG Score (further defined further below) compared to the parent index
• exposure to sectors with high impact on climate change at least equivalent to the parent index
• managed exposure to potential climate change opportunities through controlled green-to-brown revenue share in order to align with the recommendations of the TCFD
• capped exposure to non-disclosing carbon companies
• constituent-level weight capping to address liquidity and diversification
In addition to those listed above, the S&P Net Zero 2050 Paris-Aligned Climate ESG Index Series incorporates further constraints to target:
• reduced exposure to physical risks from climate change using Trucost’s Physical Risk dataset
• improved exposure to potential climate change opportunities through substantially higher green-to-brown revenue share compared to the parent index
• reduced exposure to fossil fuel reserves compared to the parent index All indices in the series feature the exclusion of companies from the underlying parent index with:
• involvement in controversial weapons, tobacco, small arms, military contracting, thermal coal, oil sands, shale energy, gambling, and alcohol business activities
• non-compliant United Nations Global Compact (UNGC) principle violations
• involvement in relevant ESG controversies In addition to those listed above, the S&P Net Zero 2050 Paris-Aligned Climate ESG Index Series incorporates the further exclusion of companies whose revenues from coal, oil, or natural gas exploration or processing activities exceed defined thresholds, and electricity generation companies that exceed a stated revenues threshold.
Climate-Related Data
Trucost’s Transition Pathway Model
The Trucost Transition Pathway approach is based on two models: the Sectoral Decarbonization Approach (“SDA”) (Krabbe, et al., 2015)5, and the Greenhouse Gas Emissions per unit of Value Added Approach (“GEVA”) (Randers, 2012)6, which are both recommended by the Science Based Targets Initiative (Science Based Targets Initiative, 2019).7 The approach allows for a forward-looking perspective on likely future greenhouse gas emissions, and uses a carbon budget allocation method to allocate each company a total amount of carbon emissions per year. These allocations allow companies, as a collective, to be 1.5°C aligned provided their emissions remain within the allocation budgets.
5 Krabbe, O., Linthorst, G., Blok, K., Crijns-Graus, W., van Vuuren, D., Höhne, N., Pineda, A. C. (2015). Aligning Corporate Greenhouse-Gas Emissions Targets with Climate Goals. Nature Climate Change.
6 Randers, J. (2012). Greenhouse gas emissions per unit of value added (“GEVA”) – A corporate guide to voluntary climate action. Journal Energy Policy.
7 Science Based Targets Initiative. (2019, April). Science-Based Target Setting Manual, available at https://sciencebasedtargets.org/wp-content/uploads/2017/04/SBTi-manual.pdf.

S&P Dow Jones Indices: S&P Paris-Aligned & Climate Transition (PACT) Indices Methodology 6
The SDA approach is sector specific and is used for high emitting sectors.8 The SDA uses carbon intensity based on sector specific measures of output. For example, the unit of output for iron and steel companies is “tCO2 per ton crude steel”. This allows an understanding of how carbon efficient companies are per unit of output. The SDA approach also sets carbon budgets for specific sectors as a whole, which allows some sectors to decarbonize more slowly where the opportunities for decarbonization are far lower. This is allowed by setting more aggressive targets for sectors with greater scope for decarbonization. GEVA is applied to lower emitting or heterogeneous business activities. For GEVA, the unit of output used is gross profit. Companies have diverse business activities, most of which do not have distinct transition pathways defined in climate scenarios. For these companies, the methodology applies a contraction in carbon intensity principle under which a company should make emissions reductions. This is consistent with rates required for the overall economy, but from each company’s unique base year emissions intensity.
Trucost’s Physical Risk Data
Trucost’s Physical Risk dataset9 allows users to understand the risk and sensitivity of company assets to the physical risks of climate change. Climate modelling datasets and hazard models are overlaid with the asset locations of companies. Sensitivity analysis is carried out for each asset, to assess whether the company’s operations would be affected by each specific physical risk, based on the asset type.10 These climate modelling datasets and hazard models have been created for each specific physical risk. Physical risk is judged by a score ranging between 1 and 100. The physical risks covered are; wildfire, cold wave, heatwave, water stress, sea level rise, flood and hurricanes. The index methodology uses a composite physical risk score that is an average of all 7 physical risk indicators, weighted for company specific sensitivity to each physical risk type. Other Trucost Data Used: GHG Emissions, Emissions Disclosure Status, Green-to-Brown Share, Fossil Fuel Reserves, and Sector Revenues. The indices are generated and published under agreements between S&P Dow Jones Indices and Trucost. Please refer to Appendix III for the Trucost Methodology, and http://www.trucost.com/ for more information on Trucost generally.
Science Based Target Initiative (SBTI)
The Science Based Targets initiative champions science-based target setting as a powerful way of boosting companies’ competitive advantage in the transition to a low-carbon economy. The initiative is a collaboration between CDP, World Resources Institute (WRI), the World Wide Fund for Nature (WWF), and the United Nations Global Compact (UNGC). Targets adopted by companies to reduce greenhouse gas (GHG) emissions are considered “science-based” if they are in line with what the latest climate science says is necessary to meet the goals of the Paris Agreement—to limit global warming to well-below 2°C above pre-industrial levels and pursue efforts to limit warming to 1.5°C. For more information on the initiative, please refer to https://sciencebasedtargets.org/.
8 As referenced in section 5.7.2. of The EU Technical Expert Group on Sustainable Finance. (2019). TEG Final Report on Climate Benchmarks and Benchmarks’ ESG Disclosures, available at https://ec.europa.eu/info/files/190930-sustainable-finance-teg-final-
report-climate-benchmarks-and-disclosures_en. 9 The 2050 High Climate Scenario is used.
10 Lord. R, Bullock, S. Birt, M. (2019). ‘Understanding Climate Risk at the Asset Level: The Interplay of Transition and Physical Risks’. https://www.spglobal.com/marketintelligence/en/documents/sp-trucost-interplay-of-transition-and-physical-risk-report-05a.pdf.

S&P Dow Jones Indices: S&P Paris-Aligned & Climate Transition (PACT) Indices Methodology 7
The S&P DJI ESG Score
The S&P DJI ESG Score is built from S&P Global’s ‘Corporate Sustainability Assessment’ (CSA). A company’s S&P DJI ESG score may either be calculated from data received directly by a company completing the comprehensive assessment (together with supporting documents), or – in the absence of this – by using publicly available information. S&P Global uses the CSA results to then calculate the S&P DJI ESG Scores. For more information on the CSA Process, please refer to https://www.spglobal.com/esg/csa/. For more information on S&P DJI ESG Scores, please refer to the S&P DJI ESG Score Methodology. For the purposes of ESG assessment, companies are assigned to industries defined by S&P Global, and the assessment is largely specific to each industry. S&P Global uses the Global Industry Classification Standard (GICS®) as its starting point for determining industry classification. At the industry group and sector levels, the S&P Global CSA Industries match the standard GICS classifications, but some non-standard aggregations are done at the industry level. For information on S&P Global CSA Industry-GICS Sub-Industry Mapping, please see here.
Supporting Documents
This methodology is meant to be read in conjunction with supporting documents providing greater detail with respect to the policies, procedures and calculations described herein. References throughout the methodology direct the reader to the relevant supporting document for further information on a specific topic. The list of the main supplemental documents for this methodology and the hyperlinks to those documents is as follows:
Supporting Document URL S&P Dow Jones Indices’ Equity Indices Policies & Practices Methodology
Equity Indices Policies & Practices
S&P Dow Jones Indices’ Index Mathematics Methodology
Index Mathematics Methodology
S&P Dow Jones Indices’ Float Adjustment Methodology
Float Adjustment Methodology
S&P Dow Jones Indices’ Global Industry Classif ication Standard (GICS) Methodology
GICS Methodology
S&P DJI ESG Score Methodology S&P DJI ESG Score Methodology The methodology is created by S&P Dow Jones Indices to achieve the aforementioned objective of measuring the underlying interest of each index governed by this methodology document. Any changes to or deviations from this methodology are made in the sole judgment and discretion of S&P Dow Jones Indices so that the index continues to achieve its objective. The Benchmark Administrator for the indices under this methodology is S&P DJI Netherlands B.V.

S&P Dow Jones Indices: S&P Paris-Aligned & Climate Transition (PACT) Indices Methodology 8
Eligibility Criteria
Index Universe
At each rebalancing reference date, the following indices are constructed from an Eligible Universe consisting of the constituents of an underlying index, as defined below:
S&P Net Zero 2050 Climate Transition ESG Index Series Underlying Index
S&P 500 Net Zero 2050 Climate Transition ESG Index S&P 500
S&P Developed Ex-Korea LargeMidCap Net Zero 2050 Climate Transition
ESG Index
S&P Developed ex-Korea
LargeMidCap
S&P Europe LargeMidCap Net Zero 2050 Climate Transition ESG Index S&P Europe LargeMidCap
S&P Eurozone LargeMidCap Net Zero 2050 Climate Transition ESG Index S&P Eurozone LargeMidCap
S&P UK Net Zero 2050 Climate Transition ESG Index S&P United Kingdom BMI
S&P Net Zero 2050 Paris-Aligned Climate ESG Index Series Underlying Index
S&P 500 Net Zero 2050 Paris-Aligned ESG Index S&P 500
S&P Developed Ex-Korea LargeMidCap Net Zero 2050 Paris-Aligned ESG
Index
S&P Developed ex-Korea
LargeMidCap
S&P Europe LargeMidCap Net Zero 2050 Paris-Aligned ESG Index S&P Europe LargeMidCap
S&P Eurozone LargeMidCap Net Zero 2050 Paris-Aligned ESG Index S&P Eurozone LargeMidCap
S&P UK Net Zero 2050 Paris-Aligned ESG Index S&P United Kingdom BMI
For information on an underlying index, please refer to the respective index methodology, available at www.spglobal.com/spdji.
Eligibility Factors
Listing. For the S&P Europe LargeMidCap Net Zero 2050 Climate Transition ESG Index, S&P Europe LargeMidCap Net Zero 2050 Paris-Aligned ESG Index, S&P Eurozone LargeMidCap Net Zero 2050 Climate Transition ESG Index, and S&P Eurozone LargeMidCap Net Zero 2050 Paris-Aligned ESG Index, constituents of the respective underlying index must be listed on an exchange in Europe or North America.
Index Exclusions
At each rebalancing reference date, companies are excluded from the eligible universe as described below:
Exclusion Type S&P Climate Transition S&P Paris-Aligned Climate
Exclusions Based on Business Activities11 Applicable Applicable
UNGC Principle Violation Applicable Applicable
Fossil Fuel Operations and Power Generation Not Applicable Applicable
Controversies: Media and Stakeholder Analysis Applicable Applicable
11
The specific exclusions will differ for each index family
S&P Dow Jones Indices: S&P Paris-Aligned & Climate Transition (PACT) Indices Methodology 9
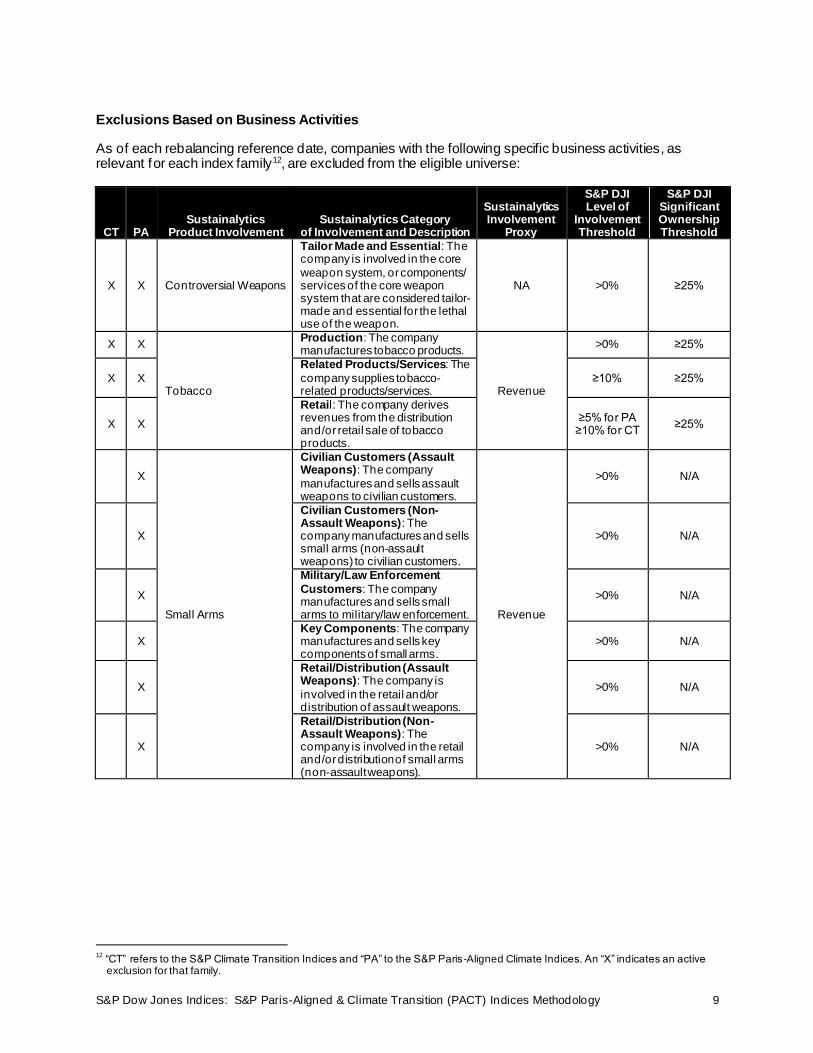
Exclusions Based on Business Activities
As of each rebalancing reference date, companies with the following specific business activities, as relevant for each index family12, are excluded from the eligible universe:
CT PA Sustainalytics
Product Involvement Sustainalytics Category
of Involvement and Description
Sustainalytics Involvement
Proxy
S&P DJI Level of
Involvement Threshold
S&P DJI Significant Ownership Threshold
X X Controversial Weapons
Tailor Made and Essential: The company is involved in the core
weapon system, or components/ services of the core weapon system that are considered tailor-made and essential for the lethal use of the weapon.
NA >0% ≥25%
X X
Tobacco
Production: The company manufactures tobacco products.
Revenue
>0% ≥25%
X X
Related Products/Services: The
company supplies tobacco-related products/services.
≥10% ≥25%
X X
Retail: The company derives revenues from the distribution and/or retail sale of tobacco products.
≥5% for PA ≥10% for CT
≥25%
X
Small Arms
Civilian Customers (Assault Weapons): The company
manufactures and sells assault weapons to civilian customers.
Revenue
>0% N/A
X
Civilian Customers (Non-Assault Weapons): The company manufactures and sells small arms (non-assault weapons) to civilian customers.
>0% N/A
X
Military/Law Enforcement
Customers: The company manufactures and sells small arms to military/law enforcement.
>0% N/A
X Key Components: The company manufactures and sells key components of small arms.
>0% N/A
X
Retail/Distribution (Assault Weapons): The company is
involved in the retail and/or distribution of assault weapons.
>0% N/A
X
Retail/Distribution (Non-Assault Weapons): The company is involved in the retail and/or distribution of small arms (non-assault weapons).
>0% N/A
12
“CT” refers to the S&P Climate Transition Indices and “PA” to the S&P Paris-Aligned Climate Indices. An “X” indicates an active exclusion for that family.

S&P Dow Jones Indices: S&P Paris-Aligned & Climate Transition (PACT) Indices Methodology 10
CT PA Sustainalytics
Product Involvement
Sustainalytics Category of Involvement and
Description
Sustainalytics Involvement
Proxy
S&P DJI Level of
Involvement Threshold
S&P DJI Significant Ownership Threshold
X
Military Contracting
Weapons: The company manufactures military weapon
systems and/or integral, tailor-made components or these weapons.
Revenue
>0% N/A
X
Weapon Related Products and/or services: The company provides tailor-made products and/or services that support
military weapons.
≥5% N/A
X Thermal Coal Power Generation: The company generates electricity from thermal coal.
Revenue ≥5% N/A
X Oil Sands Extraction: The company extracts oil sands.
Revenue ≥5% N/A
X Shale Energy Extraction: The company is involved in shale energy exploration and/or production.
Revenue ≥5% N/A
X Gambling Operations: The company owns and/or operates a
gambling establishment.
Revenue ≥10% N/A
X
Alcoholic Beverages
Production: The company
manufactures alcoholic beverages.
Revenue
≥5% N/A
X
Related Products/Services: The company is a supplier of alcohol-related products/ services to alcoholic beverage
manufacturers.
≥10% N/A
X
Retail: The company derives
revenues from the distribution and/or retail sale of alcoholic beverages.
≥10% N/A
Level of Involvement refers to the company’s direct exposure to such products, while Significant Ownership indicates where the company has indirect involvement via some specified level of ownership of a subsidiary company with involvement. These exclusions use business involvement datasets from Sustainalytics. Companies not covered by Sustainalytics are excluded from index inclusion. Please refer to http://www.sustainalytics.com/ for more information.
Exclusions Based on Sustainalytics’ Global Standards Screening
Sustainalytics’ Global Standards Screening (GSS) provides an assessment of a company’s impact on stakeholders and the extent to which a company causes, contributes, or is linked to violations of international norms and standards. The basis of the GSS assessments are the United Nations (UN) Global Compact Principles. Information regarding related standards is also provided in the screening, including the Organization for Economic Co-operation and Development (OECD) Guidelines for Multinational Enterprises and the UN Guiding Principles on Business and Human Rights, as well as their underlying conventions. Sustainalytics classifies companies into the following three statuses:
• Non-Compliant. Classification given to companies that do not act in accordance with the UNGC principles and its associated standards, conventions, and treaties.
• Watchlist. Classification given to companies that are at risk of violating one or more principles, for which all dimensions for Non-Compliant status could not be established or confirmed.
• Compliant. Classification given to companies that act in accordance with the UNGC principles and its associated standards, conventions, and treaties.
S&P Dow Jones Indices: S&P Paris-Aligned & Climate Transition (PACT) Indices Methodology 11
As of each rebalancing reference date, companies classified as Non-Compliant, according to Sustainalytics, are ineligible for index inclusion. Companies not covered by Sustainalytics are excluded f rom index inclusion. Please refer to http://www.sustainalytics.com/ for more information.
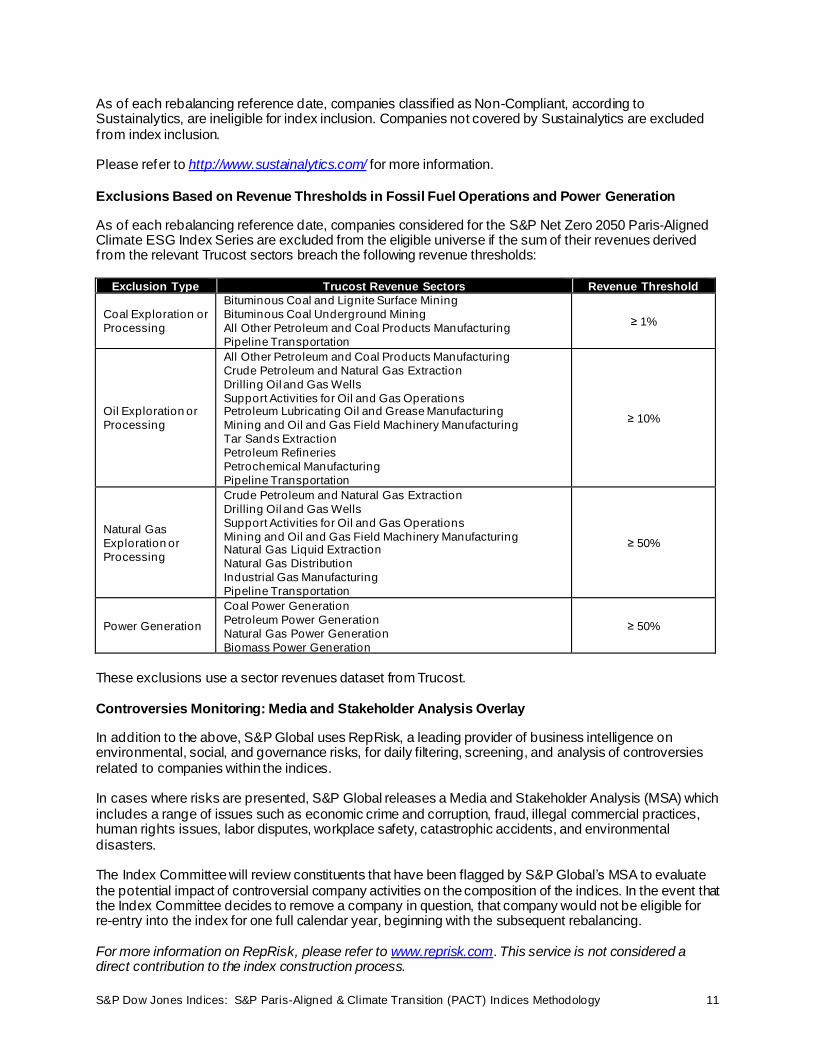
Exclusions Based on Revenue Thresholds in Fossil Fuel Operations and Power Generation
As of each rebalancing reference date, companies considered for the S&P Net Zero 2050 Paris-Aligned Climate ESG Index Series are excluded from the eligible universe if the sum of their revenues derived f rom the relevant Trucost sectors breach the following revenue thresholds:
Exclusion Type Trucost Revenue Sectors Revenue Threshold
Coal Exploration or
Processing
Bituminous Coal and Lignite Surface Mining
Bituminous Coal Underground Mining
All Other Petroleum and Coal Products Manufacturing
Pipeline Transportation
≥ 1%
Oil Exploration or
Processing
All Other Petroleum and Coal Products Manufacturing
Crude Petroleum and Natural Gas Extraction
Drilling Oil and Gas Wells
Support Activities for Oil and Gas Operations Petroleum Lubricating Oil and Grease Manufacturing
Mining and Oil and Gas Field Machinery Manufacturing
Tar Sands Extraction
Petroleum Refineries
Petrochemical Manufacturing
Pipeline Transportation
≥ 10%
Natural Gas
Exploration or
Processing
Crude Petroleum and Natural Gas Extraction
Drilling Oil and Gas Wells
Support Activities for Oil and Gas Operations
Mining and Oil and Gas Field Machinery Manufacturing Natural Gas Liquid Extraction
Natural Gas Distribution
Industrial Gas Manufacturing
Pipeline Transportation
≥ 50%
Power Generation
Coal Power Generation
Petroleum Power Generation
Natural Gas Power Generation
Biomass Power Generation
≥ 50%
These exclusions use a sector revenues dataset from Trucost.
Controversies Monitoring: Media and Stakeholder Analysis Overlay
In addition to the above, S&P Global uses RepRisk, a leading provider of business intelligence on environmental, social, and governance risks, for daily filtering, screening, and analysis of controversies related to companies within the indices. In cases where risks are presented, S&P Global releases a Media and Stakeholder Analysis (MSA) which includes a range of issues such as economic crime and corruption, fraud, illegal commercial practices, human rights issues, labor disputes, workplace safety, catastrophic accidents, and environmental disasters. The Index Committee will review constituents that have been flagged by S&P Global’s MSA to evaluate the potential impact of controversial company activities on the composition of the indices. In the event that the Index Committee decides to remove a company in question, that company would not be eligible for re-entry into the index for one full calendar year, beginning with the subsequent rebalancing. For more information on RepRisk, please refer to www.reprisk.com. This service is not considered a direct contribution to the index construction process.
S&P Dow Jones Indices: S&P Paris-Aligned & Climate Transition (PACT) Indices Methodology 12
Multiple Classes of Stock
All publicly listed multiple share class lines are eligible for index inclusion subject to meeting the eligibility criteria. For more information regarding the treatment of multiple share classes, please refer to Approach A within the Multiple Share Classes section of the S&P Dow Jones Indices’ Equity Indices Policies & Practices Methodology.

S&P Dow Jones Indices: S&P Paris-Aligned & Climate Transition (PACT) Indices Methodology 13
Index Construction
Constituent Selection
At each rebalancing, the eligible constituents of each underlying index are selected and form each index, subject to the optimization constraints below.
Constituent Weighting
At each rebalancing reference date, weights are determined to minimize the sum of the squared dif ference between the parent weight for each constituent (i) and its optimized weight, divided by its parent weight, subject to constraints. The objective function is as follows:
𝐌𝐢𝐧𝐢𝐦𝐢𝐳𝐞 (𝟏
𝒏∑ [
(𝑶𝒑𝒕𝒊𝒎𝒊𝒛𝒆𝒅 𝑾𝒆𝒊𝒈𝒉𝒕𝒊 − 𝑷𝒂𝒓𝒆𝒏𝒕 𝑾𝒆𝒊𝒈𝒉𝒕𝒊)𝟐
𝑷𝒂𝒓𝒆𝒏𝒕 𝑾𝒆𝒊𝒈𝒉𝒕𝒊]
+𝟏
𝒌∑ [
(𝑶𝒑𝒕𝒊𝒎𝒊𝒛𝒆𝒅 𝑺𝒆𝒄𝒕𝒐𝒓 𝑾𝒆𝒊𝒈𝒉𝒕𝒊 − 𝑷𝒂𝒓𝒆𝒏𝒕 𝑺𝒆𝒄𝒕𝒐𝒓 𝑾𝒆𝒊𝒈𝒉𝒕𝒊)𝟐
𝑷𝒂𝒓𝒆𝒏𝒕 𝑺𝒆𝒄𝒕𝒐𝒓 𝑾𝒆𝒊𝒈𝒉𝒕𝒊]
+𝟏
𝒎∑ [
(𝑶𝒑𝒕𝒊𝒎𝒊𝒛𝒆𝒅 𝑪𝒐𝒖𝒏𝒕𝒓𝒚 𝑾𝒆𝒊𝒈𝒉𝒕𝒊 − 𝑷𝒂𝒓𝒆𝒏𝒕 𝑪𝒐𝒖𝒏𝒕𝒓𝒚 𝑾𝒆𝒊𝒈𝒉𝒕𝒊)𝟐
𝑷𝒂𝒓𝒆𝒏𝒕 𝑪𝒐𝒖𝒏𝒕𝒓𝒚 𝑾𝒆𝒊𝒈𝒉𝒕𝒊
])
For the S&P Europe LargeMidCap Net Zero 2050 Climate Transition ESG Index, S&P Europe LargeMidCap Net Zero 2050 Paris-Aligned ESG Index, S&P Eurozone LargeMidCap Net Zero 2050 Climate Transition ESG Index, and S&P Eurozone LargeMidCap Net Zero 2050 Paris-Aligned ESG Index the underlying index used as a reference for the optimization process has the weight of stocks not listed on European or North American exchanges transferred to other eligible share class lines from the same company (if available).
Optimization Constraints
As of each rebalancing reference date, the optimizer will seek to minimize the above objective function for each index in the series while satisfying the criteria that index constituents will have an index weight of at least 0.01%, and all applicable combinations of the below transition risk, physical risk, climate opportunities, and index construction constraints.
Table 1. Transition Risk Constraints
Constraint*
S&P Climate Transition Index Series
S&P Paris-Aligned Climate Index Series
Data Source
1.5ºC Climate Scenario Transition
Pathway Budget Index Alignment See Table 2 for index specific constraint values. Trucost
Weighted-average Carbon
Intensity (WACI) Target ≤ underlying WACI × 70% × Buffer** ≤ underlying WACI × 50% × Buffer Trucost
7% Decarbonization Trajectory WACI Target
≤ AnchorWACI*** × (1−7%)^(𝑞/4)
1 +𝐼𝑛𝑓 × Buffer
where:
q = number of rebalances since index launch date Inf = Enterprise Value Including Cash (EVIC) growth of parent index
since index Anchor Date13
Trucost
Weight of Eligible Science Based Targets Companies
≥ 120% × weight of group in underlying index Trucost / Science
Based
13
The index ‘Anchor Date’ is the date of the reference index composition and base carbon intensity calculation used to determin e
the index’s decarbonization trajectory. It is the rebalancing reference date for the most recent index rebalancing prior to t he index's launch date. Please see Appendix V for more details.

S&P Dow Jones Indices: S&P Paris-Aligned & Climate Transition (PACT) Indices Methodology 14
Constraint*
S&P Climate Transition Index Series
S&P Paris-Aligned Climate Index Series
Data Source
Targets
Initiative
Weighted-average S&P DJI ESG
Score (waESG) ≥ of eligible index waESG****
≥ underlying index waESG after 20% of the lowest ESG scoring
stocks by count are removed and their weight redistributed*****
S&P Global
– S&P DJI
High Climate Impact Sectors
Revenue Proportion (HCISRP) ≥ HCISRP of underlying index Trucost
Weight of Non-Disclosing Carbon
Companies ≤ 110% × weight in underlying index Trucost
Fossil Fuel Reserves (FFR) ≤ FFR of underlying index ≤ 20% × FFR of underlying index Trucost
* Constraints are defined in Constraint-Related Definitions below.
** Where Buffer = 95% to represent a 5% margin to allow for drift between targeted and realized WACI. *** WACI of index on the index’s Anchor Date. Prior to launch date, the 7% Decarbonization Trajectory WACI Target was reset to
the index Anchor Date. Prior to launch, the 7% decarbonization Trajectory WACI Target was calculated based on the index Inception Date.
**** Stocks without an S&P DJI ESG Score are excluded from the waESG calculation. ***** If a company does not have an S&P DJI ESG Score, the company is assigned the underlying index’s waESG prior to ranking
stocks by ESG score. The calculation of the lowest 20% of stocks by ESG Score selects stocks with ESG scores less than the ESG score associated with the 20
th percentile of ESG scores among all stocks in the underlying index.
Table 2. Transition Pathway Constraint Alignment Value
Index
1.5ºC Climate Scenario
Transition Pathway Budget Index Alignment Constraint
S&P 500 Net Zero 2050 Climate Transition ESG Index
≤ 0
S&P 500 Net Zero 2050 Paris-Aligned ESG Index
S&P Developed Ex-Korea LargeMidCap Net Zero 2050 Climate Transition ESG Index
S&P Developed Ex-Korea LargeMidCap Net Zero 2050 Paris-Aligned ESG Index
S&P Europe LargeMidCap Net Zero 2050 Climate Transition ESG Index
S&P Europe LargeMidCap Net Zero 2050 Paris-Aligned ESG Index
S&P Eurozone LargeMidCap Net Zero 2050 Climate Transition ESG Index
S&P Eurozone LargeMidCap Net Zero 2050 Paris-Aligned ESG Index
S&P UK Net Zero 2050 Climate Transition ESG Index ≤ C
where:
0 ≤ C ≤ [50% × (weighted average of TPBA of underlying index)]
For more details see Appendix II.
S&P UK Net Zero 2050 Paris-Aligned ESG Index
Table 3. Physical Risk Constraints
Constraint
S&P Climate Transition
Index Series
S&P Paris-Aligned Climate
Index Series
Data
Source
Weighted-average Physical Risk Score (waPR)
≤ waPR of underlying index ≤ 90% × waPR of underlying index Trucost
Physical Risk Max Company Weight
≤ 𝐴𝑖 ∗ 𝑃𝑎𝑟𝑒𝑛𝑡 𝑊𝑒𝑖𝑔ℎ𝑡𝑖
where:
𝐴𝑖 = ρ ∗𝑃𝑅𝑖−100
𝑃𝑅𝑖−10
𝑃𝑅𝑖= is the Physical Risk score of the company 𝑖
ρ =𝑃ℎ𝑦𝑠𝑖𝑐𝑎𝑙 𝑅𝑖𝑠𝑘 𝑆𝑐𝑜𝑟𝑒 95𝑡ℎ 𝑝𝑒𝑟𝑐𝑒𝑛𝑡𝑖𝑙𝑒 − 10
𝑃ℎ𝑦𝑠𝑖𝑐𝑎𝑙 𝑅𝑖𝑠𝑘 𝑆𝑐𝑜𝑟𝑒 95𝑡ℎ 𝑝𝑒𝑟𝑐𝑒𝑛𝑡𝑖𝑙𝑒 − 100
See Appendix I for more details. (This constraint is only applied to
companies with a PR such that 𝐴𝑖 ≤ 4. And a Physical Risk Score higher than 10)
Trucost

S&P Dow Jones Indices: S&P Paris-Aligned & Climate Transition (PACT) Indices Methodology 15
Table 4. Climate Opportunities Constraint
Constraint
S&P Climate Transition
Index Series
S&P Paris-Aligned Climate
Index Series
Data
Source
Green-to-Brown Revenue Share (GBR) ≥ GBR of underlying index ≥ 4 × GBR of underlying index Trucost
Table 5. Index Construction Constraints
Constraint
S&P Net Zero 2050 Climate Transition ESG Index Series & S&P Net Zero 2050 Paris-Aligned Climate ESG Index Series
Diversification Relative Company
Weight ± 2% from underlying index company weight
Diversification Absolute Max Company Weight
≤ max(5%, underlying company weight)
Liquidity Max Stock Weight
≤ Hypothetical Days to Buy/Sell × Daily Participation× Liquidityi
Notional Portfolio Size
where:
Hypothetical Days to Buy/Sell = 5
Daily Participation = 10%
Liquidity = 3-month Median Daily Value Traded
For Liquidity Currency and Notional Portfolio Size for each index see Table 6.
Minimum Stock Weight Lower
Threshold
Existing constituents: ≥ 0.01%14
New constituents: ≥ max(0.01%, min(0.05,0.5 × underlying stock weight))
Table 6. Index Specific Liquidity Currency and Notional Portfolio Size Values
Index
Liquidity
Currency
Notional
Portfolio Size
S&P 500 Net Zero 2050 Climate Transition ESG Index
USD
1 billion
S&P 500 Net Zero 2050 Paris-Aligned ESG Index
S&P Developed Ex-Korea LargeMidCap Net Zero 2050 Climate Transition ESG Index
S&P Developed Ex-Korea LargeMidCap Net Zero 2050 Paris-Aligned ESG Index
S&P Europe LargeMidCap Net Zero 2050 Climate Transition ESG Index
EUR S&P Europe LargeMidCap Net Zero 2050 Paris-Aligned ESG Index
S&P Eurozone LargeMidCap Net Zero 2050 Climate Transition ESG Index
S&P Eurozone LargeMidCap Net Zero 2050 Paris-Aligned ESG Index
S&P UK Net Zero 2050 Climate Transition ESG Index GBP 500 million
S&P UK Net Zero 2050 Paris-Aligned ESG Index
Constraint Relaxation Hierarchy
In the case that the optimization does not solve for a certain period each constraint in the hierarchy will be partially relaxed in the order listed below and repeated, if necessary, until a solution is found.
• Weighted-average S&P DJI ESG Score
• Weighted-average Physical Risk Score
• Weight of Non-Disclosing Carbon Companies
• Diversification Absolute Max Stock Weight
• Diversification Relative Stock Weight
• Liquidity Max Stock Weight
• Fossil Fuel Reserves
• Physical Risk Max Stock Weight
14
Constraints relating to existing constituents do not apply to the historical rebalance on the index ‘Anchor Date’. Please see Appendix V for more details on the ‘Anchor Date’.
S&P Dow Jones Indices: S&P Paris-Aligned & Climate Transition (PACT) Indices Methodology 16
• Green-to-Brown Revenue Share
• 1.5ºC Climate Scenario Transition Pathway Budget Index Alignment The following constraints are considered hard constraints and will not be relaxed:
• Weighted-average Carbon Intensity (WACI) Target
• 7% Decarbonization Trajectory WACI Target
• High Climate Impact Sectors Revenue Proportion
• Weight of Eligible Science Based Targets Companies
Constraint-Related Definitions
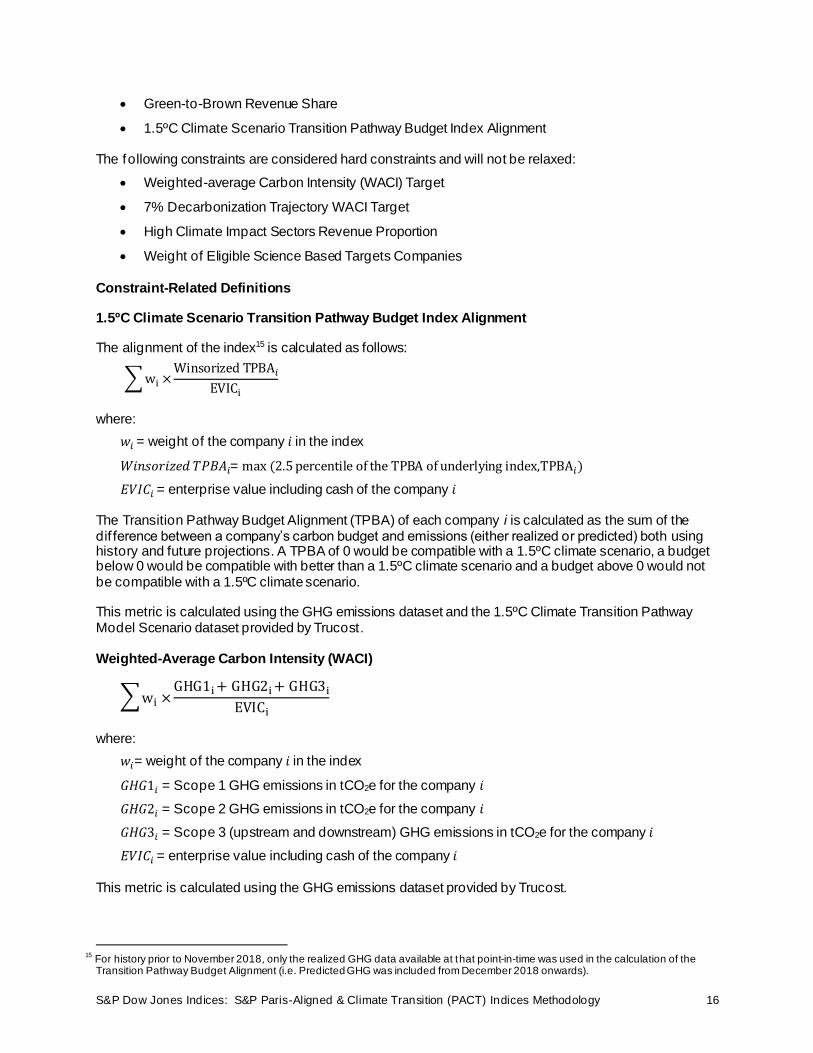
1.5ºC Climate Scenario Transition Pathway Budget Index Alignment
The alignment of the index15 is calculated as follows:
∑ wi ×Winsorized TPBA𝑖
EVICi
where:
𝑤𝑖 = weight of the company 𝑖 in the index
𝑊𝑖𝑛𝑠𝑜𝑟𝑖𝑧𝑒𝑑 𝑇𝑃𝐵𝐴𝑖= max (2.5 percentile of the TPBA of underlying index,TPBA𝑖)
𝐸𝑉𝐼𝐶𝑖 = enterprise value including cash of the company 𝑖 The Transition Pathway Budget Alignment (TPBA) of each company i is calculated as the sum of the dif ference between a company’s carbon budget and emissions (either realized or predicted) both using history and future projections. A TPBA of 0 would be compatible with a 1.5ºC climate scenario, a budget below 0 would be compatible with better than a 1.5ºC climate scenario and a budget above 0 would not be compatible with a 1.5ºC climate scenario. This metric is calculated using the GHG emissions dataset and the 1.5ºC Climate Transition Pathway Model Scenario dataset provided by Trucost.
Weighted-Average Carbon Intensity (WACI)
∑wi ×GHG1i + GHG2i + GHG3i
EVICi
where:
𝑤𝑖= weight of the company 𝑖 in the index
𝐺𝐻𝐺1𝑖 = Scope 1 GHG emissions in tCO2e for the company 𝑖
𝐺𝐻𝐺2𝑖 = Scope 2 GHG emissions in tCO2e for the company 𝑖
𝐺𝐻𝐺3𝑖 = Scope 3 (upstream and downstream) GHG emissions in tCO2e for the company 𝑖
𝐸𝑉𝐼𝐶𝑖 = enterprise value including cash of the company 𝑖 This metric is calculated using the GHG emissions dataset provided by Trucost.
15
For history prior to November 2018, only the realized GHG data available at that point-in-time was used in the calculation of the Transition Pathway Budget Alignment (i.e. Predicted GHG was included from December 2018 onwards).

S&P Dow Jones Indices: S&P Paris-Aligned & Climate Transition (PACT) Indices Methodology 17
Eligible Science Based Targets
Eligible Science Based Targets Companies are those companies with publicly disclosed targets from the Science Based Targets Initiative (SBTI), subject to the following conditions:
1. The target is publicly disclosed and is 1.5ºC aligned
2. The targets set include all scope 1, scope 2 and scope 3 (upstream and downstream) emissions
3. The company discloses their scope 1, scope 2 and scope 3 emissions sufficiently
4. Companies must show a 7% decarbonization year-on-year, for the past 3 years
5. Companies’ targets must represent an annualized decarbonization rate of 7% when accounting for scopes 1, 2 and 3 (upstream and downstream) targets assuming the companies’ current composition of emissions.
This metric is calculated using the GHG emissions dataset and the 1.5ºC Climate Transition Pathway Model Scenario dataset provided by Trucost, and the register of approved science-based company targets from the SBTI.
High Climate Impact Sectors Revenue Proportion (HCISRP)
∑ 𝑤𝑖 ×𝐻𝐶𝐼𝑆𝑅𝑖
𝐸𝑉𝐼𝐶𝑖
∑ 𝑤𝑖 ×𝑇𝑅𝑖
𝐸𝑉𝐼𝐶𝑖
where:
𝑤𝑖 = weight of the company 𝑖 in the index
𝐻𝐶𝐼𝑆𝑅𝑖 = revenue of the company 𝑖 derived from High Climate Impact Sectors
𝑇𝑅𝑖 = total revenue of the company 𝑖
𝐸𝑉𝐼𝐶𝑖 = enterprise value including cash of the company 𝑖 High Climate Impact Sectors are defined by the follow NACE sections:
• Agriculture, Forestry and Fishing
• Mining and Quarrying
• Manufacturing
• Electricity, Gas, Steam and Air Conditioning Supply
• Water Supply; Sewerage, Waste Management and Remediation Activities
• Construction
• Wholesale and Retail Trade, Repair of Motor Vehicles and Motorcycles
• Transportation and Storage
• Real Estate Activities NACE sections have been mapped to Trucost Sectors. This metric is calculated using the sector revenues dataset provided by Trucost. For more information on High Climate Impact Sectors, including the classification of Trucost revenue sectors as either ‘high’ or ‘low’ climate impact sectors , please refer to the Trucost Climate Impact Sectors Classification.

S&P Dow Jones Indices: S&P Paris-Aligned & Climate Transition (PACT) Indices Methodology 18
Non-Disclosing Carbon Companies
Non-disclosing carbon companies are those companies identified by Trucost as having insufficiently disclosed their GHG emissions (expressed in CO2 equivalents). A ‘Disclosed’ status is achieved when Trucost identifies companies as having full or partial disclosure in its largest GHG emissions scope in absolute emissions terms (between scope 1 and 2). This metric is calculated using the GHG emissions disclosure level dataset provided by Trucost.
Fossil Fuel Reserves (FFR)
∑wi ×Fossil Fuel Reservesi
EVICi
where:
𝑤𝑖 = weight of the company 𝑖 in the index
𝐹𝑜𝑠𝑠𝑖𝑙 𝐹𝑢𝑒𝑙 𝑅𝑒𝑠𝑒𝑟𝑣𝑒𝑠𝑖 = the embedded emissions (tCO2) within the fossil fuel reserves owned by company 𝑖
𝐸𝑉𝐼𝐶𝑖 = enterprise value including cash of the company 𝑖 This metric is calculated using the fossil fuel reserves dataset provided by Trucost.
Green-to-Brown Revenue Share (GBR)
∑ 𝑤𝑖 ×𝐺𝑅𝑖
𝐸𝑉𝐼𝐶𝑖
∑ 𝑤𝑖 ×𝐵𝑅𝑖
𝐸𝑉𝐼𝐶𝑖
where:
𝑤𝑖 = weight of the company 𝑖 in the index
𝐺𝑅𝑖 = revenue of the company 𝑖 derived from Green Sectors
𝐵𝑅𝑖 = revenue of the company 𝑖 derived from Brown Sectors
𝐸𝑉𝐼𝐶𝑖 = enterprise value including cash of the company 𝑖 S&P DJI defines Green Sectors as the following Trucost Sectors:
• Nuclear Electric Power Generation
• Biomass Power Generation
• Geothermal Power Generation
• Hydroelectric Power Generation
• Solar Power Generation
• Wave & Tidal Power Generation
• Wind Power Generation S&P DJI defines Brown Sectors as the following Trucost Sectors:
• Coal Power Generation
• Petroleum Power Generation
S&P Dow Jones Indices: S&P Paris-Aligned & Climate Transition (PACT) Indices Methodology 19
• Natural Gas Power Generation This metric is calculated using the sector revenues dataset provided by Trucost. Please refer to http://www.trucost.com/ for more information.
Index Calculations
The indices are calculated by means of the divisor methodology used in all S&P Dow Jones Indices’ equity indices. For more information on the index calculation methodology, please refer to the Non-Market Capitalization Weighted Indices and Capped Market Capitalization Weighted Indices sections, respectively, of S&P Dow Jones Indices’ Index Mathematics Methodology.
S&P Dow Jones Indices: S&P Paris-Aligned & Climate Transition (PACT) Indices Methodology 20
Index Maintenance Rebalancing
The indices rebalance quarterly, effective after the close of the last business day of March, June, September, and December. The rebalancing reference date for each rebalance is the last trading day of the prior month. As part of the rebalancing process, constituent stock weights are updated. Weights calculated as a result of the reference date data are implemented in the indices using closing prices seven business days prior to the rebalancing effective date.
Ongoing Maintenance
Index constituents are drawn from the underlying index or component indices. Specific changes to index constituents, such as share changes, Investable Weight Factor (IWF) changes, dividend distributions, and price adjustments, follow the policies of the underlying index. For more information on Share Updates, Float Adjustment, and IWFs, please refer to S&P Dow Jones Indices’ Equity Indices Policies & Practices Methodology and S&P Dow Jones Indices’ Float Adjustment Methodology. The indices are reviewed on an ongoing basis to account for corporate events such as mergers, takeovers, delistings, suspensions, spin-offs/demergers, or bankruptcies. Changes to index composition and related weight adjustments are made as soon as they are effective. These changes are typically announced prior to the implementation date.
Quarterly Updates
Changes to a constituent’s shares and IWF as a result of the quarterly updates are effective after the close on the third Friday in March, June, September, and December.
Additions and Deletions
Additions. Except for spin-offs, no stocks are added to the indices between rebalance dates. Spinoffs are added to all indices where the parent security is a constituent at a zero price at the market close of the day before the ex-date (with no divisor adjustment) and are removed after at least one day of regular way trading (with a divisor adjustment). Deletions. If a stock is dropped from an underlying index, it is also removed from the respective S&P Net Zero 2050 Climate Transition ESG Index Series and S&P Net Zero 2050 Paris-Aligned Climate ESG Index Series indices simultaneously. Between rebalancings, a stock can be deleted from an index due to corporate events such as mergers, takeovers, delistings, suspensions, spin-offs/demergers, or bankruptcies. In addition, at the discretion of the Index Committee, a deletion may occur if an MSA is raised.
Corporate Actions
For more information on Corporate Actions, please refer to the S&P Dow Jones Indices’ Equity Indices Policies & Practices Methodology.

S&P Dow Jones Indices: S&P Paris-Aligned & Climate Transition (PACT) Indices Methodology 21
Currency of Calculation and Additional Index Return Series
The indices calculate in euros and U.S. dollars. WM/Ref initiv foreign exchange rates are taken daily at 04:00 PM London Time and used in the end-of-day calculation of the indices. These mid-market fixings are calculated by The WM Company based on Ref initiv data and appear on Refinitiv pages WMRA. In addition to the indices detailed in this methodology, additional return series versions of the indices may be available, including, but not limited to: currency, currency hedged, decrement, fair value, inverse, leveraged, and risk control versions. For a list of available indices, please refer to the S&P DJI Methodology & Regulatory Status Database. For information on various index calculations, please refer to S&P Dow Jones Indices’ Index Mathematics Methodology. For the inputs necessary to calculate certain types of indices, including decrement, dynamic hedged, fair value, and risk control indices, please refer to the Parameters documents available at www.spglobal.com/spdji.
Base Dates and History Availability
Index history availability, base dates, and base values are shown in the table below.
Index
Launch
Date
First Value
Date
Base Date
Base
Value
S&P 500 Net Zero 2050 Climate Transition ESG Index 06/01/2020 12/31/2016 12/31/2016 1000
S&P 500 Net Zero 2050 Paris-Aligned ESG Index 06/01/2020 12/31/2016 12/31/2016 1000
S&P Developed Ex-Korea LargeMidCap Net Zero 2050 Climate Transition ESG Index
06/01/2020 12/31/2016 12/31/2016 1000
S&P Developed Ex-Korea LargeMidCap Net Zero 2050
Paris-Aligned ESG Index 06/01/2020 12/31/2016 12/31/2016 1000
S&P Europe LargeMidCap Net Zero 2050 Climate Transition ESG Index
05/04/2020 12/31/2016 12/31/2016 1000
S&P Europe LargeMidCap Net Zero 2050 Paris-Aligned
ESG Index 05/04/2020 12/31/2016 12/31/2016 1000
S&P Eurozone LargeMidCap Net Zero 2050 Climate Transition ESG Index
04/20/2020 12/31/2016 12/31/2016 1000
S&P Eurozone LargeMidCap Net Zero 2050 Paris-Aligned
ESG Index 04/20/2020 12/31/2016 12/31/2016 1000
S&P UK Net Zero 2050 Climate Transition ESG Index 10/25/2021 12/31/2016 12/31/2016 1000
S&P UK Net Zero 2050 Paris-Aligned ESG Index 10/25/2021 12/31/2016 12/31/2016 1000

S&P Dow Jones Indices: S&P Paris-Aligned & Climate Transition (PACT) Indices Methodology 22
Index Data
Calculation Return Types
S&P Dow Jones Indices calculates multiple return types which vary based on the treatment of regular cash dividends. The classification of regular cash dividends is determined by S&P Dow Jones Indices.
• Price Return (PR) versions are calculated without adjustments for regular cash dividends.
• Gross Total Return (TR) versions reinvest regular cash dividends at the close on the ex-date without consideration for withholding taxes.
• Net Total Return (NTR) versions, if available, reinvest regular cash dividends at the close on the ex-date af ter the deduction of applicable withholding taxes.
In the event there are no regular cash dividends on the ex-date, the daily performance of all three indices will be identical. For a complete list of indices available, please refer to the daily index levels file (“.SDL”). For more information on the classification of regular versus special cash dividends as well as the tax rates used in the calculation of net return, please refer to S&P Dow Jones Indices’ Equity Indices Policies & Practices Methodology.
For more information on the calculation of return types, please refer to S&P Dow Jones Indices’ Index Mathematics Methodology.

S&P Dow Jones Indices: S&P Paris-Aligned & Climate Transition (PACT) Indices Methodology 23
Index Governance
Index Committee
The indices are managed by an S&P Dow Jones Indices’ Index Committee. The Index Committee meets regularly. At each meeting, the Index Committee reviews pending corporate actions that may affect index constituents, statistics comparing the composition of the index to the market, companies that are being considered as candidates for addition to the index, and any significant market events. In addition, the Index Committee may revise index policy covering rules for selecting companies, treatment of dividends, share counts or other matters. S&P Dow Jones Indices considers information about changes to its indices and related matters to be potentially market moving and material. Therefore, all Index Committee discussions are confidential. S&P Dow Jones Indices’ Index Committees reserve the right to make exceptions when applying the methodology if the need arises. In any scenario where the treatment differs from the general rules stated in this document or supplemental documents, clients will receive sufficient notice, whenever possible. In addition to the daily governance of indices and maintenance of index methodologies, at least once within any 12-month period, the Index Committee reviews the methodology to ensure the indices continue to achieve the stated objectives, and that the data and methodology remain effective. In certain instances, S&P Dow Jones Indices may publish a consultation inviting comments from external parties. For information on Quality Assurance and Internal Reviews of Methodology, please refer to S&P Dow Jones Indices’ Equity Indices Policies & Practices Methodology.

S&P Dow Jones Indices: S&P Paris-Aligned & Climate Transition (PACT) Indices Methodology 24
Index Policy
Announcements
All index constituents are evaluated daily for data needed to calculate index levels and returns. All events af fecting the daily index calculation are typically announced in advance via the Index Corporate Events report (.SDE), delivered daily to all clients. Any unusual treatment of a corporate action or short notice of an event may be communicated via email to clients. Press releases are posted on our Web site, www.spglobal.com/spdji, and are released to major news services.
Pro-forma Files
In addition to the corporate events file (.SDE), S&P Dow Jones Indices provides constituent pro-forma f iles each time the indices rebalance. The pro-forma file is typically provided daily in advance of the rebalancing date and contains all constituents and their corresponding weights and index shares effective for the upcoming rebalancing. Please visit www.spglobal.com/spdji for a complete schedule of rebalancing timelines and pro-forma delivery times.
Holiday Schedule
The indices are calculated daily, throughout the calendar year. The only days an index is not calculated are on days when all exchanges where an index’s constituents are listed are officially closed or if WM/Reuters’ exchange rates services are not published. A complete holiday schedule for the year is available at www.spglobal.com/spdji.
Rebalancing
The Index Committee may change the date of a given rebalancing for reasons including market holidays occurring on or around the scheduled rebalancing date. Any such change will be announced with proper advance notice where possible.
Unexpected Exchange Closures
For information on Unexpected Exchange Closures, please refer to S&P Dow Jones Indices’ Equity Indices Policies & Practices Methodology.
Recalculation Policy
For information on the recalculation policy, please refer to S&P Dow Jones Indices’ Equity Indices Policies & Practices Methodology. For information on Calculations and Pricing Disruptions, Expert Judgment and Data Hierarchy, please refer to S&P Dow Jones Indices’ Equity Indices Policies & Practices Methodology.
Contact Information
For any questions regarding an index, please contact: [email protected].

S&P Dow Jones Indices: S&P Paris-Aligned & Climate Transition (PACT) Indices Methodology 25
Index Dissemination Index levels are available through S&P Dow Jones Indices’ Web site at www.spglobal.com/spdji, major quote vendors (see codes below), numerous investment-oriented Web sites, and various print and electronic media.
Tickers
The table below lists headline indices covered by this document. All versions of the below indices that may exist are also covered by this document. Please refer to the S&P DJI Methodology & Regulatory Status Database for a complete list of indices covered by this document.
Index Return Type Bloomberg
S&P 500 Net Zero 2050 Climate Transition ESG Index (EUR) Price Return SP50CTEP Total Return SP50CTET Net Total Return SP50CTEN
S&P 500 Net Zero 2050 Climate Transition ESG Index (USD) Price Return SP50CTUP Total Return SP50CTUT Net Total Return SP50CTUN
S&P 500 Net Zero 2050 Paris-Aligned ESG Index (EUR) Price Return SP50PAEP
Total Return SP50PAET Net Total Return SP50PAEN
S&P 500 Net Zero 2050 Paris-Aligned ESG Index (USD) Price Return SP50PAUP Total Return SP50PAUT
Net Total Return SP50PAUN S&P Developed Ex-Korea LargeMidCap Net Zero 2050 Climate Transition ESG Index (EUR)
Price Return SPDKCTEP Total Return SPDKCTET
Net Total Return SPDKCTEN S&P Developed Ex-Korea LargeMidCap Net Zero 2050 Climate Transition ESG Index (USD)
Price Return SPDKCTUP Total Return SPDKCTUT Net Total Return SPDKCTUN
S&P Developed Ex-Korea LargeMidCap Net Zero 2050 Paris-Aligned ESG Index (EUR)
Price Return SPDPACEP Total Return SPDPACET Net Total Return SPDPACEN
S&P Developed Ex-Korea LargeMidCap Net Zero 2050 Paris-Aligned ESG Index (USD)
Price Return SPDPACUP Total Return SPDPACUT Net Total Return SPDPACUN
S&P Europe LargeMidCap Net Zero 2050 Climate Transition ESG Index (EUR)
Price Return SPEUCTEP
Total Return SPEUCTET Net Total Return SPEUCTEN
S&P Europe LargeMidCap Net Zero 2050 Climate Transition ESG Index (USD)
Price Return SPEUCTUP
Total Return SPEUCTUT Net Total Return SPEUCTUN
S&P Europe LargeMidCap Net Zero 2050 Paris-Aligned ESG Index (EUR)
Price Return SPEUPAEP Total Return SPEUPAET
Net Total Return SPEUPAEN S&P Europe LargeMidCap Net Zero 2050 Paris-Aligned ESG Index (USD)
Price Return SPEUPAUP Total Return SPEUPAUT Net Total Return SPEUPAUN
S&P Eurozone LargeMidCap Net Zero 2050 Climate Transition ESG Index (EUR)
Price Return SPEUCTEP Total Return SPEUCTET Net Total Return SPEUCTEN

S&P Dow Jones Indices: S&P Paris-Aligned & Climate Transition (PACT) Indices Methodology 26
Index Return Type Bloomberg
S&P Eurozone LargeMidCap Net Zero 2050 Climate Transition ESG Index (USD)
Price Return SPEUCTUP Total Return SPEUCTUT Net Total Return SPEUCTUN
S&P Eurozone LargeMidCap Net Zero 2050 Paris-Aligned ESG Index (EUR)
Price Return SPEUPAEP
Total Return SPEUPAET Net Total Return SPEUPAEN
S&P Eurozone LargeMidCap Net Zero 2050 Paris-Aligned ESG Index (USD)
Price Return SPEUPAUP
Total Return SPEUPAUT Net Total Return SPEUPAUN
S&P UK Net Zero 2050 Climate Transition ESG Index (EUR) Price Return SPGBCTEP Total Return SPGBCTET
Net Total Return SPGBCTEN S&P UK Net Zero 2050 Climate Transition ESG Index (USD) Price Return SPGBCTUP
Total Return SPGBCTUT Net Total Return SPGBCTUN
S&P UK Net Zero 2050 Paris-Aligned ESG Index (EUR) Price Return SPGBPAEP Total Return SPGBPAET Net Total Return SPGBPAEN
S&P UK Net Zero 2050 Paris-Aligned ESG Index (USD) Price Return SPGBPAUP Total Return SPGBPAUT Net Total Return SPGBPAUN
Index Data
Daily constituent and index level data are available via subscription. For product information, please contact S&P Dow Jones Indices, www.spglobal/spdji.com/contact-us.
S&P DJI ESG Scores Data
Company-level S&P DJI ESG Scores data are available via subscription. For product information, please contact S&P Dow Jones Indices, www.spglobal/spdji.com/contact-us.
Website
For further information, please refer to S&P Dow Jones Indices’ Web site at www.spglobal.com/spdji.
S&P Dow Jones Indices: S&P Paris-Aligned & Climate Transition (PACT) Index Series Methodology 27
Appendix I
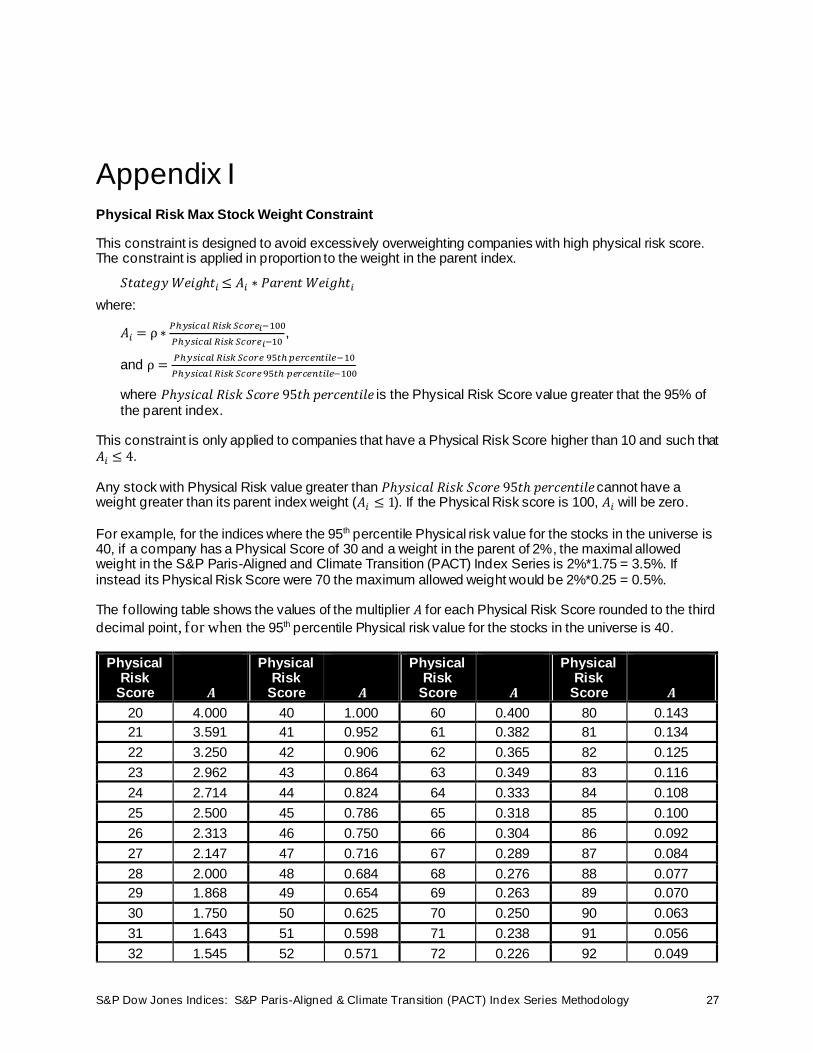
Physical Risk Max Stock Weight Constraint
This constraint is designed to avoid excessively overweighting companies with high physical risk score. The constraint is applied in proportion to the weight in the parent index.
𝑆𝑡𝑎𝑡𝑒𝑔𝑦 𝑊𝑒𝑖𝑔ℎ𝑡𝑖 ≤ 𝐴𝑖 ∗ 𝑃𝑎𝑟𝑒𝑛𝑡 𝑊𝑒𝑖𝑔ℎ𝑡𝑖
where:
𝐴𝑖 = ρ ∗𝑃ℎ𝑦𝑠𝑖𝑐𝑎𝑙 𝑅𝑖𝑠𝑘 𝑆𝑐𝑜𝑟𝑒𝑖−100
𝑃ℎ𝑦𝑠𝑖𝑐𝑎𝑙 𝑅𝑖𝑠𝑘 𝑆𝑐𝑜𝑟𝑒𝑖−10,
and ρ =𝑃ℎ𝑦𝑠𝑖𝑐𝑎𝑙 𝑅𝑖𝑠𝑘 𝑆𝑐𝑜𝑟𝑒 95𝑡ℎ 𝑝𝑒𝑟𝑐𝑒𝑛𝑡𝑖𝑙𝑒−10
𝑃ℎ𝑦𝑠𝑖𝑐𝑎𝑙 𝑅𝑖𝑠𝑘 𝑆𝑐𝑜𝑟𝑒 95𝑡ℎ 𝑝𝑒𝑟𝑐𝑒𝑛𝑡𝑖𝑙𝑒−100
where 𝑃ℎ𝑦𝑠𝑖𝑐𝑎𝑙 𝑅𝑖𝑠𝑘 𝑆𝑐𝑜𝑟𝑒 95𝑡ℎ 𝑝𝑒𝑟𝑐𝑒𝑛𝑡𝑖𝑙𝑒 is the Physical Risk Score value greater that the 95% of the parent index.
This constraint is only applied to companies that have a Physical Risk Score higher than 10 and such that 𝐴𝑖 ≤ 4. Any stock with Physical Risk value greater than 𝑃ℎ𝑦𝑠𝑖𝑐𝑎𝑙 𝑅𝑖𝑠𝑘 𝑆𝑐𝑜𝑟𝑒 95𝑡ℎ 𝑝𝑒𝑟𝑐𝑒𝑛𝑡𝑖𝑙𝑒 cannot have a weight greater than its parent index weight (𝐴𝑖 ≤ 1). If the Physical Risk score is 100, 𝐴𝑖 will be zero. For example, for the indices where the 95th percentile Physical risk value for the stocks in the universe is 40, if a company has a Physical Score of 30 and a weight in the parent of 2%, the maximal allowed weight in the S&P Paris-Aligned and Climate Transition (PACT) Index Series is 2%*1.75 = 3.5%. If instead its Physical Risk Score were 70 the maximum allowed weight would be 2%*0.25 = 0.5%. The following table shows the values of the multiplier 𝐴 for each Physical Risk Score rounded to the third
decimal point, for when the 95th percentile Physical risk value for the stocks in the universe is 40.
Physical Risk
Score
𝑨
Physical Risk
Score
𝑨
Physical Risk
Score
𝑨
Physical Risk
Score
𝑨
20 4.000 40 1.000 60 0.400 80 0.143
21 3.591 41 0.952 61 0.382 81 0.134
22 3.250 42 0.906 62 0.365 82 0.125
23 2.962 43 0.864 63 0.349 83 0.116
24 2.714 44 0.824 64 0.333 84 0.108
25 2.500 45 0.786 65 0.318 85 0.100
26 2.313 46 0.750 66 0.304 86 0.092
27 2.147 47 0.716 67 0.289 87 0.084
28 2.000 48 0.684 68 0.276 88 0.077
29 1.868 49 0.654 69 0.263 89 0.070
30 1.750 50 0.625 70 0.250 90 0.063
31 1.643 51 0.598 71 0.238 91 0.056
32 1.545 52 0.571 72 0.226 92 0.049

S&P Dow Jones Indices: S&P Paris-Aligned & Climate Transition (PACT) Index Series Methodology 28
Physical Risk
Score
𝑨
Physical Risk
Score
𝑨
Physical Risk
Score
𝑨
Physical Risk
Score
𝑨
33 1.457 53 0.547 73 0.214 93 0.042
34 1.375 54 0.523 74 0.203 94 0.036
35 1.300 55 0.500 75 0.192 95 0.029
36 1.231 56 0.478 76 0.182 96 0.023
37 1.167 57 0.457 77 0.172 97 0.017
38 1.107 58 0.438 78 0.162 98 0.011
39 1.052 59 0.418 79 0.152 99 0.006
100 0.000

S&P Dow Jones Indices: S&P Paris-Aligned & Climate Transition (PACT) Index Series Methodology 29
Appendix II
1.5ºC Climate Scenario Transition Pathway Budget Index Alignment Constraint
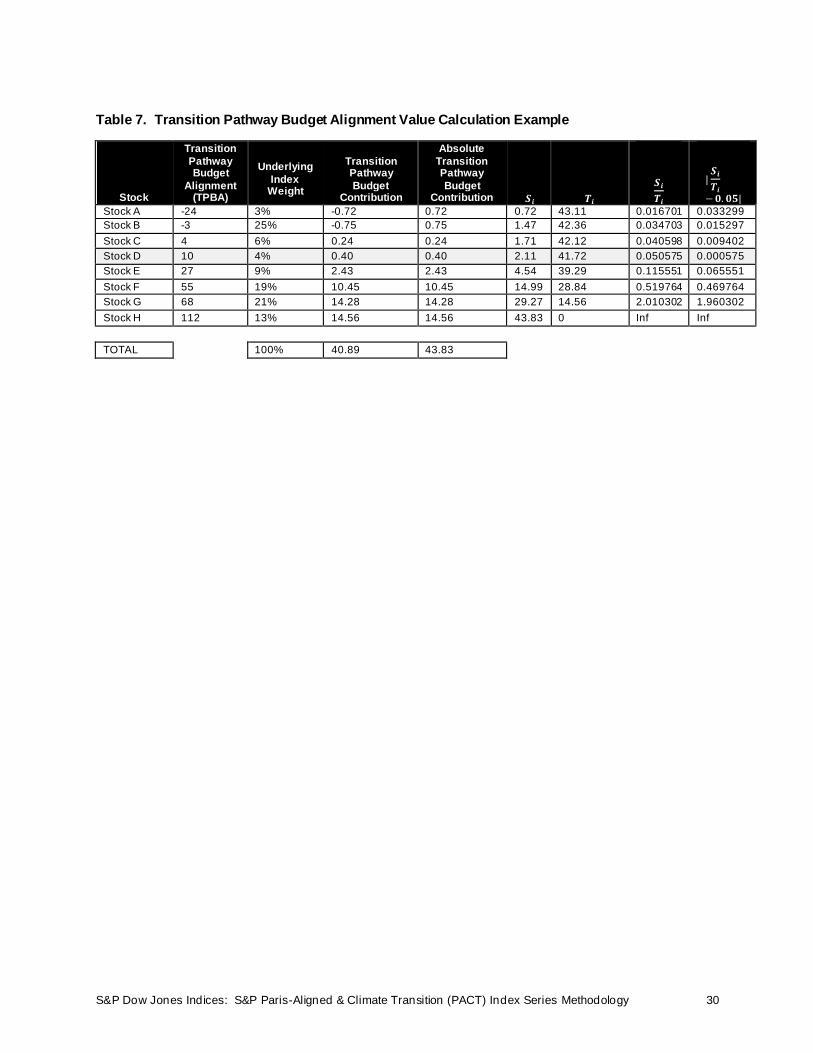
For the indices where the 1.5ºC Climate Scenario Transition Pathway Budget Index Alignment constraint is not zero, the value of C is used as the constraint. At each rebalancing reference date, C is defined as the Transition Pathway Budget Alignment (TPBA)16 of a specific underlying index stock that represents where the sum of Absolute Transition Pathway Budget Contributions for stocks with a TPBA below C is closest to 5% of the sum of Absolute Transition Pathway Budget Contributions for stocks with a TPBA above C. The following steps describe the calculation of C in more detail:
1. Sort stocks by their TPBA values in ascending order (see Table 7).
2. Calculate the ‘Transition Pathway Budget Contribution’ for all stocks in the universe, by multiplying their TPBA by their weight in the underlying index as at the rebalancing reference date.
3. For each stock 𝑖 calculate (𝑆𝑖) as the sum of Absolute Transition Pathway Budget Contributions for all the stocks with a TPBA that is lower or equal than that of stock 𝑖.
4. For each stock i calculate (Ti) as the sum of Absolute Transition Pathway Budget Contributions for all the stocks with a TPBA that is higher than that of stock i.
5. The value C is the 1.5ºC Climate Scenario Transition Pathway Budget Index Alignment constraint
for the index and is defined as the TPBA of the stock whose Si
Ti ratio is closest to 5%. This can
also be stated as the TPBA of the stock with the minimum absolute value of Si
Ti ratio minus 5%
(|Si
Ti− 0.05|).
• If C is less than zero, zero is used instead.
• If C ≥ [50% × (weighted average TPBA of underlying index)] then C is set to equal [50%
× (weighted average TPBA of underlying index)].
The following table illustrates an example of how to calculate the value C. The Si
Ti ratio value of 0.050575
(shown in bold in second-to-last column) is the closest Si
Ti ratio to 5%, just as the |
Si
Ti− 0.05| value in that
column is the lowest among all others. Therefore C will be taken to be equal to 10, as it is the Transition Pathway Budget Index Alignment constraint. It is also greater than 0 and less than half of the weighted average of the parent (40.89 × 50%).
16
The Transition Pathway Budget Alignment (TPBA) of each company i is calculated as the sum of the difference between a
company’s carbon budget and emissions (either realized or predicted) both using history and future projections. A TPBA of 0 would be compatible with a 1.5ºC climate scenario, a budget below 0 would be compatible with better than a 1.5ºC climate
scenario and a budget above 0 would not be compatible with a 1.5ºC climate scenario.
S&P Dow Jones Indices: S&P Paris-Aligned & Climate Transition (PACT) Index Series Methodology 30
Table 7. Transition Pathway Budget Alignment Value Calculation Example
Stock
Transition
Pathway Budget
Alignment (TPBA)
Underlying
Index Weight
Transition Pathway
Budget Contribution
Absolute
Transition Pathway
Budget Contribution
𝑺𝒊
𝑻𝒊
𝑺𝒊
𝑻𝒊
|𝑺𝒊
𝑻𝒊
− 𝟎. 𝟎𝟓| Stock A -24 3% -0.72 0.72 0.72 43.11 0.016701 0.033299
Stock B -3 25% -0.75 0.75 1.47 42.36 0.034703 0.015297
Stock C 4 6% 0.24 0.24 1.71 42.12 0.040598 0.009402
Stock D 10 4% 0.40 0.40 2.11 41.72 0.050575 0.000575
Stock E 27 9% 2.43 2.43 4.54 39.29 0.115551 0.065551
Stock F 55 19% 10.45 10.45 14.99 28.84 0.519764 0.469764
Stock G 68 21% 14.28 14.28 29.27 14.56 2.010302 1.960302
Stock H 112 13% 14.56 14.56 43.83 0 Inf Inf
TOTAL 100% 40.89 43.83
S&P Dow Jones Indices: S&P Paris-Aligned & Climate Transition (PACT) Index Series Methodology 31
Appendix III
Trucost Methodology
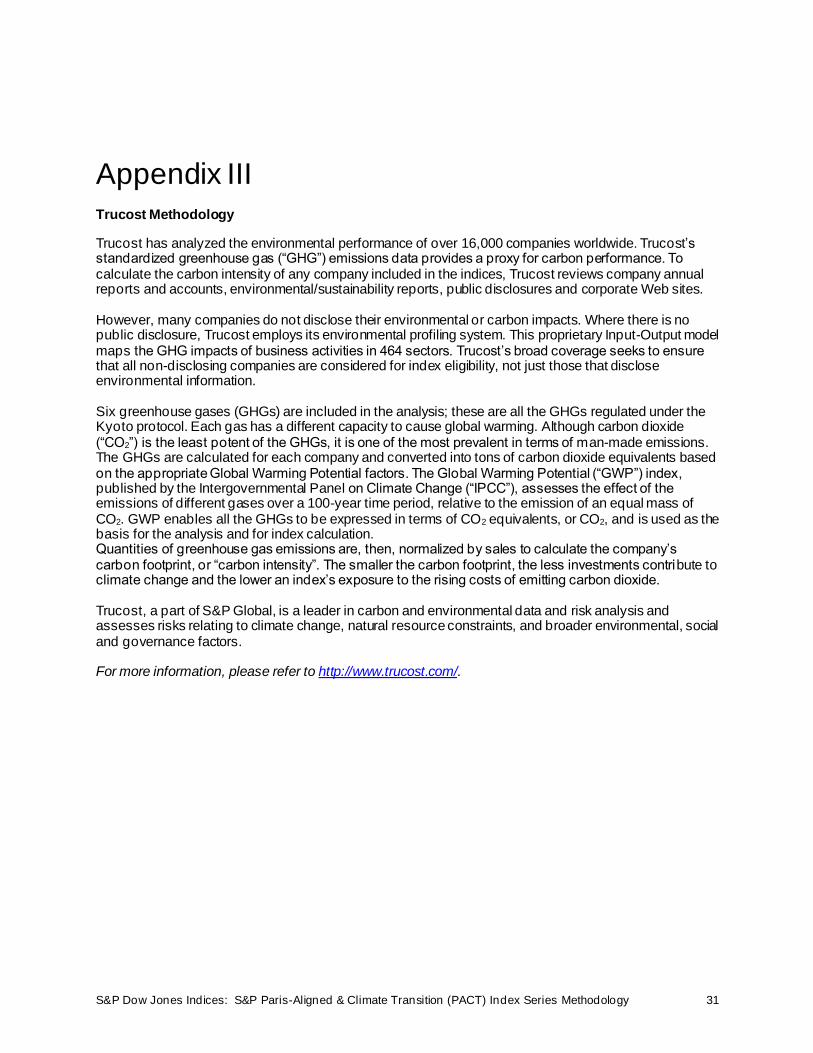
Trucost has analyzed the environmental performance of over 16,000 companies worldwide. Trucost’s standardized greenhouse gas (“GHG”) emissions data provides a proxy for carbon performance. To calculate the carbon intensity of any company included in the indices, Trucost reviews company annual reports and accounts, environmental/sustainability reports, public disclosures and corporate Web sites. However, many companies do not disclose their environmental or carbon impacts. Where there is no public disclosure, Trucost employs its environmental profiling system. This proprietary Input-Output model maps the GHG impacts of business activities in 464 sectors. Trucost’s broad coverage seeks to ensure that all non-disclosing companies are considered for index eligibility, not just those that disclose environmental information. Six greenhouse gases (GHGs) are included in the analysis; these are all the GHGs regulated under the Kyoto protocol. Each gas has a different capacity to cause global warming. Although carbon dioxide (“CO2”) is the least potent of the GHGs, it is one of the most prevalent in terms of man-made emissions. The GHGs are calculated for each company and converted into tons of carbon dioxide equivalents based on the appropriate Global Warming Potential factors. The Global Warming Potential (“GWP”) index, published by the Intergovernmental Panel on Climate Change (“IPCC”), assesses the effect of the emissions of different gases over a 100-year time period, relative to the emission of an equal mass of CO2. GWP enables all the GHGs to be expressed in terms of CO2 equivalents, or CO2, and is used as the basis for the analysis and for index calculation. Quantities of greenhouse gas emissions are, then, normalized by sales to calculate the company’s carbon footprint, or “carbon intensity”. The smaller the carbon footprint, the less investments contribute to climate change and the lower an index’s exposure to the rising costs of emitting carbon dioxide. Trucost, a part of S&P Global, is a leader in carbon and environmental data and risk analysis and assesses risks relating to climate change, natural resource constraints, and broader environmental, social and governance factors. For more information, please refer to http://www.trucost.com/.
S&P Dow Jones Indices: S&P Paris-Aligned & Climate Transition (PACT) Index Series Methodology 32
Appendix IV
Methodology Changes
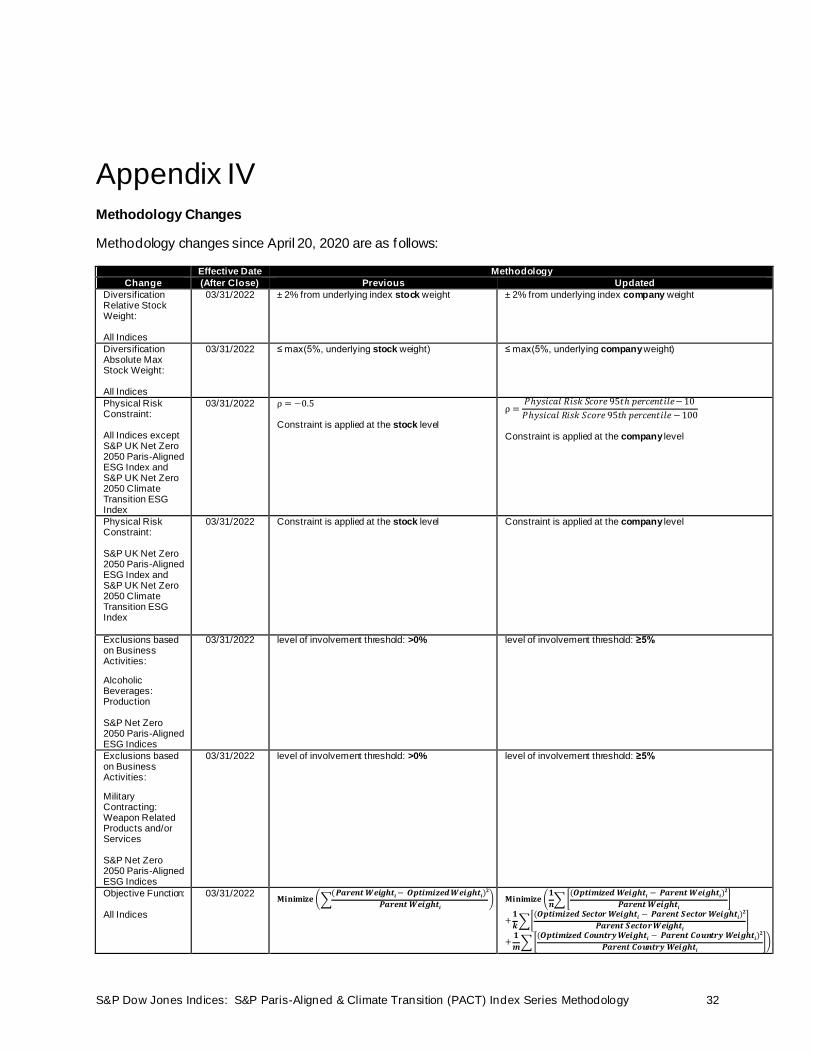
Methodology changes since April 20, 2020 are as follows:
Effective Date Methodology
Change (After Close) Previous Updated
Diversification Relative Stock Weight: All Indices
03/31/2022 ± 2% from underlying index stock weight ± 2% from underlying index company weight
Diversification Absolute Max Stock Weight: All Indices
03/31/2022 ≤ max(5%, underlying stock weight) ≤ max(5%, underlying company weight)
Physical Risk Constraint: All Indices except S&P UK Net Zero 2050 Paris-Aligned ESG Index and S&P UK Net Zero 2050 Climate Transition ESG Index
03/31/2022 ρ = −0.5 Constraint is applied at the stock level
ρ =𝑃ℎ𝑦𝑠𝑖𝑐𝑎𝑙 𝑅𝑖𝑠𝑘 𝑆𝑐𝑜𝑟𝑒 95𝑡ℎ 𝑝𝑒𝑟𝑐𝑒𝑛𝑡𝑖𝑙𝑒− 10
𝑃ℎ𝑦𝑠𝑖𝑐𝑎𝑙 𝑅𝑖𝑠𝑘 𝑆𝑐𝑜𝑟𝑒 95𝑡ℎ 𝑝𝑒𝑟𝑐𝑒𝑛𝑡𝑖𝑙𝑒 − 100
Constraint is applied at the company level
Physical Risk Constraint: S&P UK Net Zero 2050 Paris-Aligned ESG Index and S&P UK Net Zero 2050 Climate Transition ESG Index
03/31/2022 Constraint is applied at the stock level Constraint is applied at the company level
Exclusions based on Business Activities:
Alcoholic Beverages: Production S&P Net Zero 2050 Paris-Aligned ESG Indices
03/31/2022 level of involvement threshold: >0% level of involvement threshold: ≥5%
Exclusions based on Business Activities:
Military Contracting: Weapon Related Products and/or Services S&P Net Zero 2050 Paris-Aligned ESG Indices
03/31/2022 level of involvement threshold: >0% level of involvement threshold: ≥5%
Objective Function: All Indices
03/31/2022 𝐌𝐢𝐧𝐢𝐦𝐢𝐳𝐞 (∑
(𝑷𝒂𝒓𝒆𝒏𝒕 𝑾𝒆𝒊𝒈𝒉𝒕𝒊 − 𝑶𝒑𝒕𝒊𝒎𝒊𝒛𝒆𝒅 𝑾𝒆𝒊𝒈𝒉𝒕𝒊)𝟐
𝑷𝒂𝒓𝒆𝒏𝒕 𝑾𝒆𝒊𝒈𝒉𝒕𝒊
) 𝐌𝐢𝐧𝐢𝐦𝐢𝐳𝐞 (𝟏
𝒏∑ [
(𝑶𝒑𝒕𝒊𝒎𝒊𝒛𝒆𝒅 𝑾𝒆𝒊𝒈𝒉𝒕𝒊 − 𝑷𝒂𝒓𝒆𝒏𝒕 𝑾𝒆𝒊𝒈𝒉𝒕𝒊)𝟐
𝑷𝒂𝒓𝒆𝒏𝒕 𝑾𝒆𝒊𝒈𝒉𝒕𝒊
]
+𝟏
𝒌 ∑[(𝑶𝒑𝒕𝒊𝒎𝒊𝒛𝒆𝒅 𝑺𝒆𝒄𝒕𝒐𝒓 𝑾𝒆𝒊𝒈𝒉𝒕𝒊 − 𝑷𝒂𝒓𝒆𝒏𝒕 𝑺𝒆𝒄𝒕𝒐𝒓 𝑾𝒆𝒊𝒈𝒉𝒕𝒊)
𝟐
𝑷𝒂𝒓𝒆𝒏𝒕 𝑺𝒆𝒄𝒕𝒐𝒓 𝑾𝒆𝒊𝒈𝒉𝒕𝒊
]
+𝟏
𝒎∑ [(𝑶𝒑𝒕𝒊𝒎𝒊𝒛𝒆𝒅 𝑪𝒐𝒖𝒏𝒕𝒓𝒚 𝑾𝒆𝒊𝒈𝒉𝒕𝒊 − 𝑷𝒂𝒓𝒆𝒏𝒕 𝑪𝒐𝒖𝒏𝒕𝒓𝒚 𝑾𝒆𝒊𝒈𝒉𝒕𝒊)
𝟐
𝑷𝒂𝒓𝒆𝒏𝒕 𝑪𝒐𝒖𝒏𝒕𝒓𝒚 𝑾𝒆𝒊𝒈𝒉𝒕𝒊
])

S&P Dow Jones Indices: S&P Paris-Aligned & Climate Transition (PACT) Index Series Methodology 33
Effective Date Methodology Change (After Close) Previous Updated
Index Names: S&P Net Zero
2050 Climate Transition ESG Index Series and S&P Net Zero 2050 Paris-Aligned Climate ESG Index Series
06/26/2021 The index names are:
• S&P 500 Climate Transition ESG Index
• S&P 500 Paris-Aligned ESG Index
• S&P Developed Ex-Korea LargeMidCap
Climate Transition ESG Index
• S&P Developed Ex-Korea LargeMidCap Paris-Aligned ESG Index
• S&P Europe LargeMidCap Climate Transition
ESG Index
• S&P Europe LargeMidCap Paris-Aligned ESG Index
• S&P Eurozone LargeMidCap Climate Transition ESG Index
• S&P Eurozone LargeMidCap Paris-Aligned ESG Index
The index names are:
• S&P 500 Net Zero 2050 Climate Transition ESG Index
• S&P 500 Net Zero 2050 Paris-Aligned ESG Index
• S&P Developed Ex-Korea LargeMidCap Net Zero 2050
Climate Transition ESG Index
• S&P Developed Ex-Korea LargeMidCap Net Zero 2050 Paris-Aligned ESG Index
• S&P Europe LargeMidCap Net Zero 2050 Climate
Transition ESG Index
• S&P Europe LargeMidCap Net Zero 2050 Paris-Aligned ESG Index
• S&P Eurozone LargeMidCap Net Zero 2050 Climate Transition ESG Index
• S&P Eurozone LargeMidCap Net Zero 2050 Paris-Aligned ESG Index
Environmental Score Constraint to ESG Score Constraint: S&P Net Zero 2050 Climate Transition ESG Indices
06/30/2021 Weighted-average S&P DJI Environmental Score (waE) of the CT Index should be ≥ the waE of the eligible universe.
Weighted-average S&P DJI ESG Score (waESG) of the CT Index should be ≥ the eligible waESG of the eligible universe.
Environmental Score Constraint to ESG Score Constraint: S&P Net Zero 2050 Paris-Aligned ESG Indices
06/30/2021 Weighted-average S&P DJI Environmental Score (waE) of the PA Index should be ≥ the waE of the eligible universe + (20% × (max E score in eligible universe – eligible universe’s waE))
Weighted-average S&P DJI ESG Score (waESG) of the PA Index should be ≥ the waESG of the universe after 20% of the worst ESG score performing companies by count are removed and weight redistributed
Introduce buffer rule and revise stock cap: All Indices
06/30/2021 No buffer, minimum stock weight lower threshold of 0.01%, maximum weight of 5%.
Minimum stock weight threshold ≥1 bps for existing constituents and max(1bps, min(5bps, 0.5 x weight in underlying index) for new constituents. Max stock weight: max(5%,weight in underlying index)
UNGC Exclusion: All Indices
06/30/2021 All companies at or below the bottom 5% of the Arabesque GC score universe globally are ineligible.
Companies that are deemed by Sustainalytics to be non-compliant are ineligible.
Exclusions based on Business Activities: S&P Net Zero 2050 Paris-Aligned ESG Indices
06/30/2021 Stocks are excluded for involvement in Controversial Weapons and Tobacco only. Involvement Exclusion Threshold: ’Controversial Weapons: Tailor Made and Essential’: >0% (no proxy) ‘Controversial Weapons: Significant Ownership (Tailor Made and Essential)’: ≥25% Ownership of company ‘Tobacco: Production’: >0% Revenue ‘Tobacco: Related Products/Services’: ≥10% Revenue ‘Tobacco: Retail’: ≥10% Revenue ‘Tobacco: Significant ownership (production)’:
≥25% Revenue ‘Tobacco: Significant ownership (related products/services)’: ≥25% Revenue ‘Tobacco: Significant ownership (retail)’: ≥25% Revenue
Stocks are excluded for involvement in Controversial Weapons, Tobacco, Small Arms, Military Contracting, Thermal Coal, Oil Sands, Shale Energy, Gambling and Alcohol, as defined in the methodology. ‘Tobacco: Retail’ exclusion amended from ≥10% to ≥5%. All other pre-existing exclusions remain unchanged.

S&P Dow Jones Indices: S&P Paris-Aligned & Climate Transition (PACT) Index Series Methodology 34
Appendix V
Index Anchor Date of Decarbonization Trajectory
The index ‘Anchor Date’ is the date of the reference index composition and base carbon intensity calculation used to determine the index’s decarbonization trajectory. It is the rebalancing reference date for the most recent index rebalancing prior to the index's launch date. Prior to the index ‘Anchor Date’ the index ‘First Value Date’ is used to determine the index’s decarbonization trajectory.
Index
First Value
Date
Anchor
Date
Launch
Date
S&P 500 Net Zero 2050 Climate Transition ESG Index 12/31/2016 02/28/2020 06/01/2020
S&P 500 Net Zero 2050 Paris-Aligned ESG Index 12/31/2016 02/28/2020 06/01/2020
S&P Developed Ex-Korea LargeMidCap Net Zero 2050 Climate
Transition ESG Index 12/31/2016
02/28/2020 06/01/2020
S&P Developed Ex-Korea LargeMidCap Net Zero 2050 Paris-Aligned ESG Index
12/31/2016 02/28/2020
06/01/2020
S&P Europe LargeMidCap Net Zero 2050 Climate Transition ESG
Index 12/31/2016
02/28/2020 05/04/2020
S&P Europe LargeMidCap Net Zero 2050 Paris-Aligned ESG Index 12/31/2016 02/28/2020 05/04/2020
S&P Eurozone LargeMidCap Net Zero 2050 Climate Transition ESG
Index 12/31/2016
02/28/2020 04/20/2020
S&P Eurozone LargeMidCap Net Zero 2050 Paris-Aligned ESG Index 12/31/2016 02/28/2020 04/20/2020
S&P UK Net Zero 2050 Climate Transition ESG Index 12/31/2016 08/31/2021 10/25/2021
S&P UK Net Zero 2050 Paris-Aligned ESG Index 12/31/2016 08/31/2021 10/25/2021

S&P Dow Jones Indices: S&P Paris-Aligned & Climate Transition (PACT) Index Series Methodology 35
Appendix VI
Indices in this Methodology Employing Backward Data Assumption
S&P 500 Net Zero 2050 Paris-Aligned ESG Index S&P 500 Net Zero 2050 Climate Transition ESG Index S&P Europe LargeMidCap Net Zero 2050 Climate Transition ESG Index S&P Europe LargeMidCap Net Zero 2050 Paris-Aligned ESG Index S&P Developed Ex-Korea LargeMidCap Net Zero 2050 Paris-Aligned ESG Index S&P Developed Ex-Korea LargeMidCap Net Zero 2050 Climate Transition ESG Index S&P Eurozone LargeMidCap Net Zero 2050 Climate Transition ESG Index S&P Eurozone LargeMidCap Net Zero 2050 Paris-Aligned ESG Index
Backward Data Assumption
The index employs a “Backward Data Assumption” method for some datapoints used in the derivation of historical index membership prior to the Live Data Effective Date (defined below). The “Backward Data Assumption” method involves applying the earliest available actual live data point for an index constituent to all prior, historical instances of that constituent in the index universe. Backward Data Assumption affects only the historical, hypothetical constituents of any index back-test. Only actual live data is ever used in live index rebalancings and in the historical rebalancing calculation of an index af ter its Live Data Effective Date. For more information on S&P DJI’s principles and processes for using Backward Data Assumption, please refer to the FAQ.
Designated Datasets Subject to Backward Data Assumption
The Backward Data Assumption within the historical back-test, with respect to the indices identified above, applies only to designated datasets and associated time horizons as defined below. For each designated dataset, all historical rebalancing events prior to the Live Data Reference Date listed below are subject to use of the Backward Data Assumption.
Data Provider Designated Dataset Live Data Reference Date Live Data Effective Date Trucost Physical Risk 2/28/2020 3/31/2020 Trucost Scope 3 Emissions 2/28/2020 3/31/2020
The Live Data Reference Date refers to the first rebalancing reference date from which only actual live data is used. The Live Data Effective Date refers to the first date from which index constituents are determined solely on actual live data for each respective dataset.
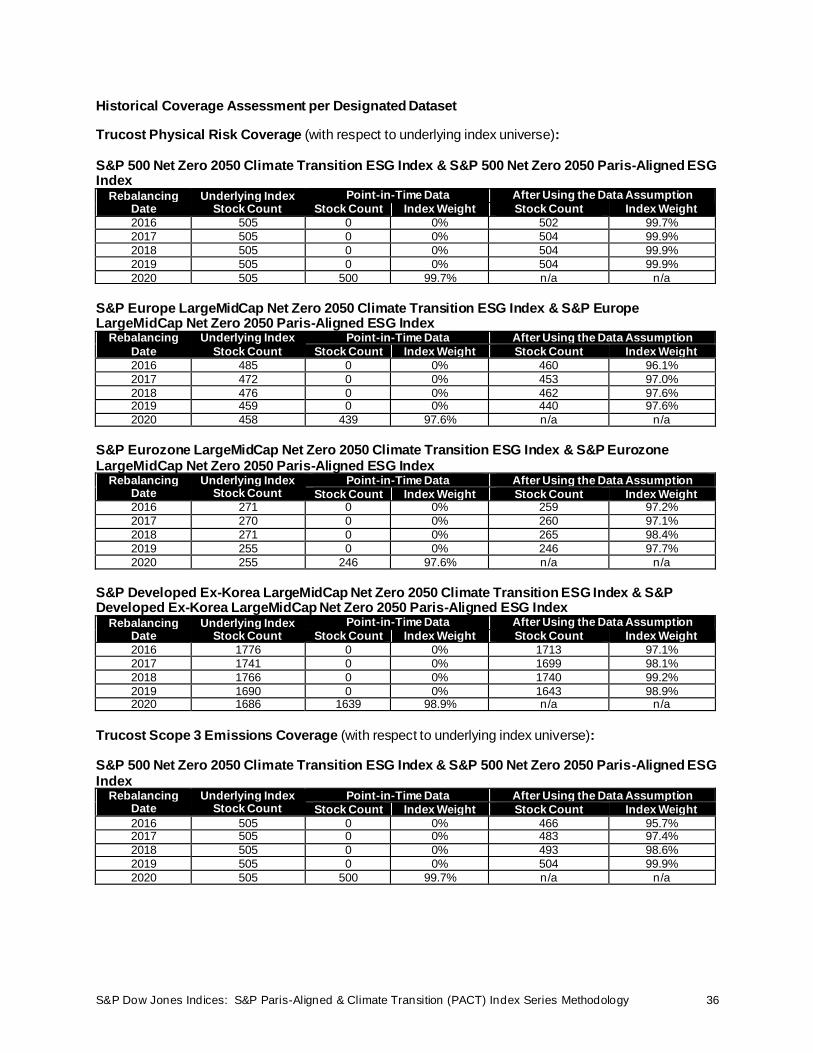
S&P Dow Jones Indices: S&P Paris-Aligned & Climate Transition (PACT) Index Series Methodology 36
Historical Coverage Assessment per Designated Dataset
Trucost Physical Risk Coverage (with respect to underlying index universe): S&P 500 Net Zero 2050 Climate Transition ESG Index & S&P 500 Net Zero 2050 Paris-Aligned ESG Index
Rebalancing Date
Underlying Index Stock Count
Point-in-Time Data After Using the Data Assumption
Stock Count Index Weight Stock Count Index Weight
2016 505 0 0% 502 99.7%
2017 505 0 0% 504 99.9%
2018 505 0 0% 504 99.9%
2019 505 0 0% 504 99.9%
2020 505 500 99.7% n/a n/a
S&P Europe LargeMidCap Net Zero 2050 Climate Transition ESG Index & S&P Europe LargeMidCap Net Zero 2050 Paris-Aligned ESG Index
Rebalancing
Date
Underlying Index
Stock Count
Point-in-Time Data After Using the Data Assumption
Stock Count Index Weight Stock Count Index Weight
2016 485 0 0% 460 96.1%
2017 472 0 0% 453 97.0%
2018 476 0 0% 462 97.6% 2019 459 0 0% 440 97.6%
2020 458 439 97.6% n/a n/a
S&P Eurozone LargeMidCap Net Zero 2050 Climate Transition ESG Index & S&P Eurozone LargeMidCap Net Zero 2050 Paris-Aligned ESG Index
Rebalancing Date
Underlying Index Stock Count
Point-in-Time Data After Using the Data Assumption
Stock Count Index Weight Stock Count Index Weight 2016 271 0 0% 259 97.2%
2017 270 0 0% 260 97.1%
2018 271 0 0% 265 98.4%
2019 255 0 0% 246 97.7%
2020 255 246 97.6% n/a n/a
S&P Developed Ex-Korea LargeMidCap Net Zero 2050 Climate Transition ESG Index & S&P Developed Ex-Korea LargeMidCap Net Zero 2050 Paris-Aligned ESG Index
Rebalancing Date
Underlying Index Stock Count
Point-in-Time Data After Using the Data Assumption
Stock Count Index Weight Stock Count Index Weight
2016 1776 0 0% 1713 97.1%
2017 1741 0 0% 1699 98.1%
2018 1766 0 0% 1740 99.2%
2019 1690 0 0% 1643 98.9% 2020 1686 1639 98.9% n/a n/a
Trucost Scope 3 Emissions Coverage (with respect to underlying index universe): S&P 500 Net Zero 2050 Climate Transition ESG Index & S&P 500 Net Zero 2050 Paris-Aligned ESG Index
Rebalancing Date
Underlying Index Stock Count
Point-in-Time Data After Using the Data Assumption
Stock Count Index Weight Stock Count Index Weight
2016 505 0 0% 466 95.7% 2017 505 0 0% 483 97.4%
2018 505 0 0% 493 98.6%
2019 505 0 0% 504 99.9%
2020 505 500 99.7% n/a n/a

S&P Dow Jones Indices: S&P Paris-Aligned & Climate Transition (PACT) Index Series Methodology 37
S&P Europe LargeMidCap Net Zero 2050 Climate Transition ESG Index & S&P Europe LargeMidCap Net Zero 2050 Paris-Aligned ESG Index
Rebalancing Date
Underlying Index Stock Count
Point-in-Time Data After Using the Data Assumption
Stock Count Index Weight Stock Count Index Weight
2016 485 0 0% 469 96.9%
2017 472 0 0% 461 97.3%
2018 476 0 0% 471 97.9%
2019 459 0 0% 448 97.8% 2020 458 447 97.7% n/a n/a
S&P Eurozone LargeMidCap Net Zero 2050 Climate Transition ESG Index & S&P Eurozone LargeMidCap Net Zero 2050 Paris-Aligned ESG Index
Rebalancing
Date
Underlying Index
Stock Count
Point-in-Time Data After Using the Data Assumption
Stock Count Index Weight Stock Count Index Weight
2016 271 0 0% 265 98.8%
2017 270 0 0% 266 98.8% 2018 271 0 0% 271 100.0%
2019 255 0 0% 252 99.2%
2020 255 252 99.2% n/a n/a
S&P Developed Ex-Korea LargeMidCap Net Zero 2050 Climate Transition ESG Index & S&P Developed Ex-Korea LargeMidCap Net Zero 2050 Paris-Aligned ESG Index
Rebalancing Date
Underlying Index Stock Count
Point-in-Time Data After Using the Data Assumption
Stock Count Index Weight Stock Count Index Weight 2016 1776 0 0% 1725 97.4%
2017 1741 0 0% 1712 98.3%
2018 1766 0 0% 1754 99.4%
2019 1690 0 0% 1658 99.1%
2020 1686 1654 99.1% n/a n/a

S&P Dow Jones Indices: S&P Paris-Aligned & Climate Transition (PACT) Index Series Methodology 38
Appendix VII
EU Required ESG Disclosures
EXPLANATION OF HOW ENVIRONMENTAL, SOCIAL & GOVERNANCE (ESG) FACTORS ARE REFLECTED IN THE KEY ELEMENTS OF THE BENCHMARK METHODOLOGY17
1.
Name of the
benchmark
administrator.
S&P DJI Netherlands B.V.
2.
Underlying asset
class of the ESG
benchmark.18
Equity
3.
Name of the S&P
Dow Jones
Indices
benchmark or
family of
benchmarks.
S&P Paris-Aligned & Climate Transition (PACT) Index Family Benchmark Statement
4.
Do any of the
indices
maintained by
this methodology
take into account
ESG factors?
Yes
5.
If the response to
(4) is “Yes” the
indices stated
here take into
account ESG
factors.
For a list of the benchmarks within this family that take in account ESG fac tors, please refer
to the S&P DJI Methodology & Regulatory Database.
6.
Where the response to (4) is ‘Yes’, the section below lists those ESG factors that are taken into account
by the ESG indices governed by the methodology, including those ESG factors listed in Annex II to
Delegated Regulation (EU) 2020/1816.
6.a
List of environmental
factors considered
ESG Factor19 S&P DJI ESG Factor Comment
Exposure of the benchmark
portfolio to climate-related
physical risks, measuring the effects of extreme weather
events on companies’
operations and production or
on the different stages of the
supply chain (based on
issuer exposure) (voluntary).
Physical Risk Constraint:
Weighted-average Physical
Risk Score; Physical Risk Max Stock Weight
Weighting. For more
information, please refer to
the ‘Index Construction’ section of the methodology.
Weighted average ESG
rating of the benchmark
(voluntary).
Weighted-average S&P DJI
ESG Score
Weighting. For more
information, please refer to
the ‘Index Construction’
section of the methodology.
17
The information contained in this Appendix is intended to meet the requirements of the European Union Commission Delegated
Regulation (EU) 2020/1817 supplementing Regulation (EU) 2016/1011 of the European Parliament and of the Council as regards the minimum content of the explanation of how environmental, social and governance factors are reflected in the benchmark
methodology. 18
The ‘underlying assets’ are defined in European Union Commission Delegated Regulation (EU) 2020/1816 supplementing
Regulation (EU) 2016/1011 of the European Parliament and of the Council as regards the explanation in the benchmark statement of how environmental, social and governance factors are reflected in each benchmark provided and published.
19 ‘ESG factors’ are defined in Annex II of European Union Commission Delegated Regulation (EU) 2020/1816 supplementing Regulation (EU) 2016/1011 of the European Parliament and of the Council as regards the explanation in the benchmark
statement of how environmental, social and governance factors are reflected in each benchmark provided and published.
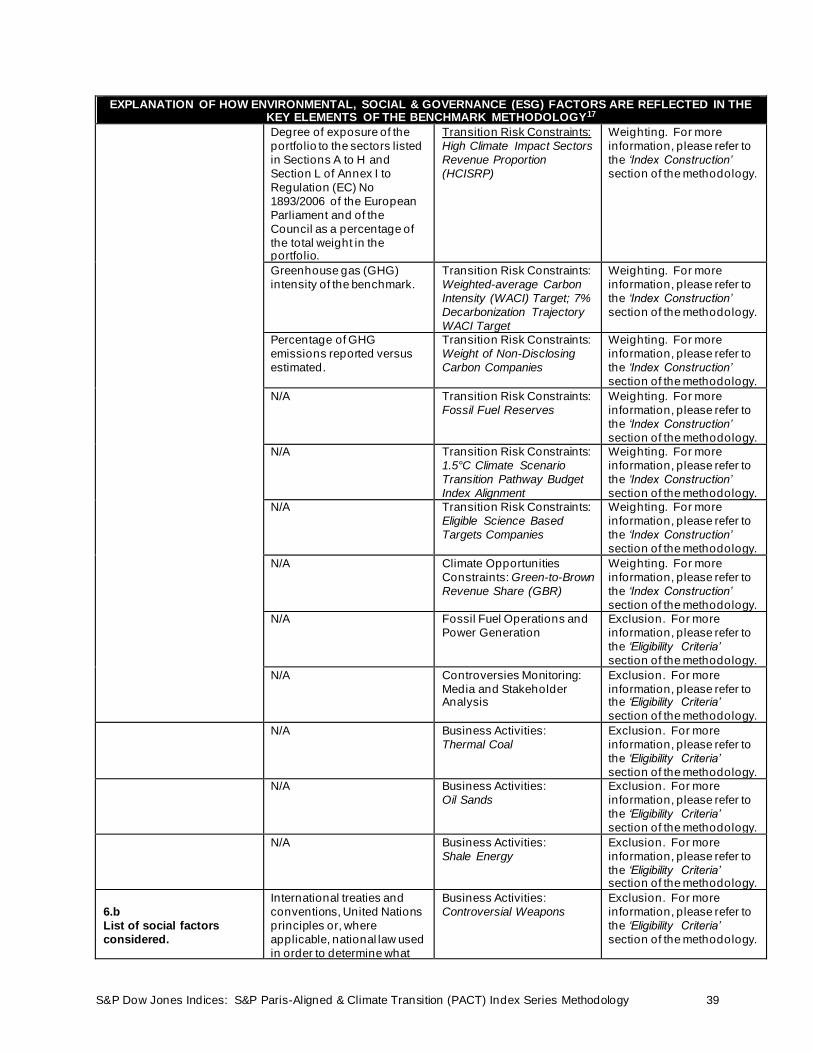
S&P Dow Jones Indices: S&P Paris-Aligned & Climate Transition (PACT) Index Series Methodology 39
EXPLANATION OF HOW ENVIRONMENTAL, SOCIAL & GOVERNANCE (ESG) FACTORS ARE REFLECTED IN THE KEY ELEMENTS OF THE BENCHMARK METHODOLOGY17
Degree of exposure of the
portfolio to the sectors listed
in Sections A to H and
Section L of Annex I to
Regulation (EC) No
1893/2006 of the European
Parliament and of the
Council as a percentage of
the total weight in the portfolio.
Transition Risk Constraints:
High Climate Impact Sectors
Revenue Proportion
(HCISRP)
Weighting. For more
information, please refer to
the ‘Index Construction’
section of the methodology.
Greenhouse gas (GHG)
intensity of the benchmark.
Transition Risk Constraints:
Weighted-average Carbon
Intensity (WACI) Target; 7%
Decarbonization Trajectory
WACI Target
Weighting. For more
information, please refer to
the ‘Index Construction’
section of the methodology.
Percentage of GHG
emissions reported versus
estimated.
Transition Risk Constraints:
Weight of Non-Disclosing
Carbon Companies
Weighting. For more
information, please refer to
the ‘Index Construction’
section of the methodology.
N/A Transition Risk Constraints:
Fossil Fuel Reserves
Weighting. For more
information, please refer to
the ‘Index Construction’
section of the methodology.
N/A Transition Risk Constraints:
1.5°C Climate Scenario
Transition Pathway Budget
Index Alignment
Weighting. For more
information, please refer to
the ‘Index Construction’
section of the methodology.
N/A Transition Risk Constraints:
Eligible Science Based
Targets Companies
Weighting. For more
information, please refer to
the ‘Index Construction’
section of the methodology.
N/A Climate Opportunities
Constraints: Green-to-Brown
Revenue Share (GBR)
Weighting. For more
information, please refer to
the ‘Index Construction’
section of the methodology.
N/A Fossil Fuel Operations and
Power Generation
Exclusion. For more
information, please refer to
the ‘Eligibility Criteria’
section of the methodology.
N/A Controversies Monitoring:
Media and Stakeholder Analysis
Exclusion. For more
information, please refer to the ‘Eligibility Criteria’
section of the methodology.
N/A Business Activities:
Thermal Coal
Exclusion. For more
information, please refer to
the ‘Eligibility Criteria’
section of the methodology.
N/A Business Activities:
Oil Sands
Exclusion. For more
information, please refer to
the ‘Eligibility Criteria’
section of the methodology.
N/A Business Activities:
Shale Energy
Exclusion. For more
information, please refer to
the ‘Eligibility Criteria’ section of the methodology.
6.b
List of social factors
considered.
International treaties and
conventions, United Nations
principles or, where
applicable, national law used
in order to determine what
Business Activities:
Controversial Weapons
Exclusion. For more
information, please refer to
the ‘Eligibility Criteria’
section of the methodology.
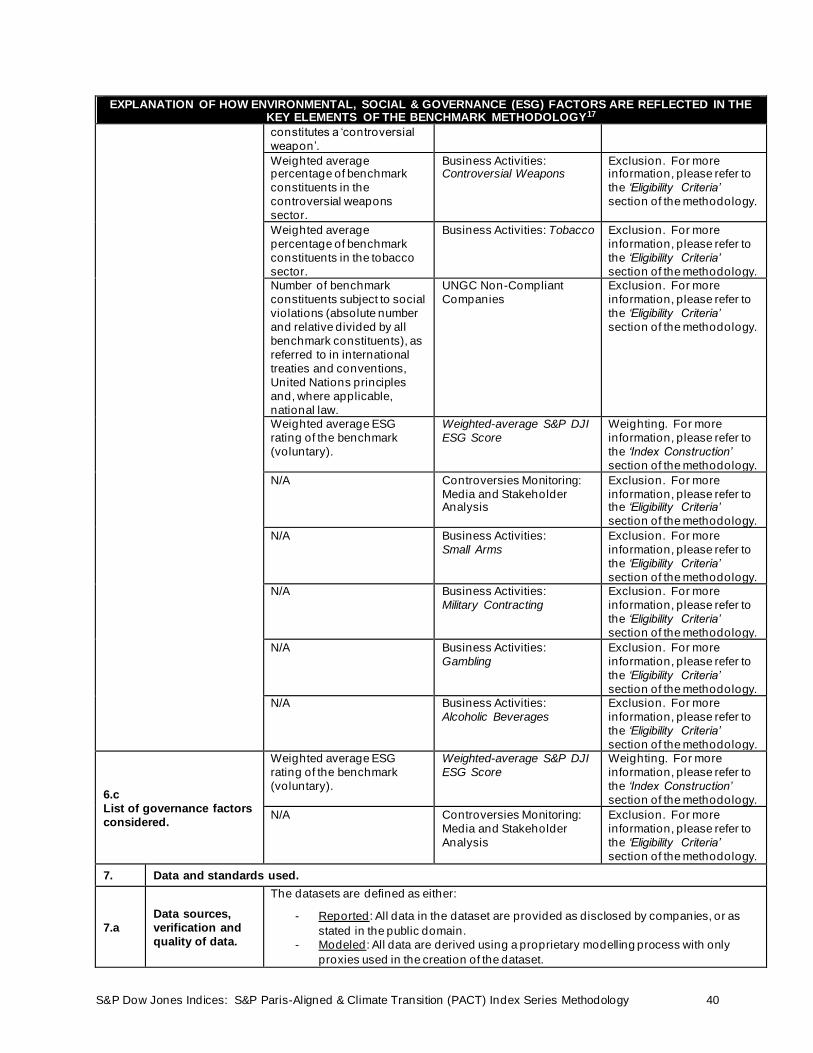
S&P Dow Jones Indices: S&P Paris-Aligned & Climate Transition (PACT) Index Series Methodology 40
EXPLANATION OF HOW ENVIRONMENTAL, SOCIAL & GOVERNANCE (ESG) FACTORS ARE REFLECTED IN THE KEY ELEMENTS OF THE BENCHMARK METHODOLOGY17
constitutes a ‘controversial
weapon’.
Weighted average percentage of benchmark
constituents in the
controversial weapons
sector.
Business Activities: Controversial Weapons
Exclusion. For more information, please refer to
the ‘Eligibility Criteria’
section of the methodology.
Weighted average
percentage of benchmark
constituents in the tobacco
sector.
Business Activities: Tobacco Exclusion. For more
information, please refer to
the ‘Eligibility Criteria’
section of the methodology.
Number of benchmark
constituents subject to social
violations (absolute number
and relative divided by all
benchmark constituents), as
referred to in international
treaties and conventions,
United Nations principles
and, where applicable,
national law.
UNGC Non-Compliant
Companies
Exclusion. For more
information, please refer to
the ‘Eligibility Criteria’
section of the methodology.
Weighted average ESG
rating of the benchmark
(voluntary).
Weighted-average S&P DJI
ESG Score
Weighting. For more
information, please refer to
the ‘Index Construction’
section of the methodology.
N/A Controversies Monitoring:
Media and Stakeholder Analysis
Exclusion. For more
information, please refer to the ‘Eligibility Criteria’
section of the methodology.
N/A Business Activities:
Small Arms
Exclusion. For more
information, please refer to
the ‘Eligibility Criteria’
section of the methodology.
N/A Business Activities:
Military Contracting
Exclusion. For more
information, please refer to
the ‘Eligibility Criteria’
section of the methodology.
N/A Business Activities:
Gambling
Exclusion. For more
information, please refer to
the ‘Eligibility Criteria’
section of the methodology.
N/A Business Activities:
Alcoholic Beverages
Exclusion. For more
information, please refer to
the ‘Eligibility Criteria’
section of the methodology.
6.c
List of governance factors
considered.
Weighted average ESG
rating of the benchmark
(voluntary).
Weighted-average S&P DJI
ESG Score
Weighting. For more
information, please refer to
the ‘Index Construction’
section of the methodology.
N/A Controversies Monitoring:
Media and Stakeholder
Analysis
Exclusion. For more
information, please refer to
the ‘Eligibility Criteria’
section of the methodology.
7. Data and standards used.
7.a
Data sources,
verification and
quality of data.
The datasets are defined as either:
- Reported: All data in the dataset are provided as disclosed by companies, or as
stated in the public domain.
- Modeled: All data are derived using a proprietary modelling process with only
proxies used in the creation of the dataset.

S&P Dow Jones Indices: S&P Paris-Aligned & Climate Transition (PACT) Index Series Methodology 41
EXPLANATION OF HOW ENVIRONMENTAL, SOCIAL & GOVERNANCE (ESG) FACTORS ARE REFLECTED IN THE KEY ELEMENTS OF THE BENCHMARK METHODOLOGY17
- Reported and Modeled: The dataset is either a mix of reported and Modeled data,
or is derived by the vendor using reported data/information in a proprietary scoring
or determination process.
The index methodology uses the following ESG datasets.
Data Source. Dataset.
S&P Trucost
Limited (a part of
S&P Global)
(external data
source)
This methodology uses several datasets provided by S&P Trucost Limited:
• Transition pathway model (Reported and Modeled)
• Physical risk scores dataset (Reported and Modeled)
• Greenhouse gas emissions and emissions disclosure dataset (Reported and Modeled)
• Green-to-brown share dataset (Reported and Modeled)
• Fossil fuel reserves (Reported and Modeled)
• Trucost sector revenues dataset (Reported and Modeled)
For more information on Trucost, please refer to Appendix III and http://www.trucost.com/.
S&P Global
(external data
source)
Media & Stakeholder Analysis (Reported and Modeled) – S&P Global uses RepRisk, a
leading provider of business intelligence on environmental, social, and governance risks, for
daily filtering, screening, and analysis of controversies related to companies within the
indices. In cases where risks are presented, S&P Global releases a Media and Stakeholder
Analysis (MSA) which includes a range of issues such as economic crime and corruption,
fraud, illegal commercial practices, human rights issues, labor disputes, workplace safety,
catastrophic accidents, and environmental disasters. The Index Committee will review
constituents that have been flagged by S&P Global’s MSA to evaluate the potential impact
of controversial company activities on the composition of the indices. If a company is
removed due to an MSA, that company is not eligible for re-entry into the index for one full
calendar year, beginning with the subsequent rebalancing.
For more information about S&P Global’s Media and Stakeholder Analysis, please refer to
the MSA Methodology Guidebook, available via https://www.spglobal.com/esg/csa/csa-
resources/csa-methodology.
S&P Dow Jones
Indices (internal
data source)
ESG score (Reported and Modeled) – The S&P DJI ESG Score is built from the S&P Global
‘Corporate Sustainability Assessment’ (CSA). A company’s S&P DJI ESG score may either
be calculated from data received directly by a company completing the comprehensive
assessment (together with supporting documents), or – in the absence of this – by using
publicly available information. S&P Global uses the CSA results to then calculate the S&P
DJI ESG Scores used in the index methodology.
For more information about the S&P DJI ESG scores please refer to the S&P DJI ESG
Score Methodology and https://www.spglobal.com/spdji/en/landing/investment-themes/esg-
scores/.
Sustainalytics
(external data
source)
This methodology uses the following datasets provided by Sustainalytics, a global leader in
sustainability research and analytics:
• Business Activities (Reported and Modeled) – Product involvement data
• Global Standards Screening (Reported and Modeled)
For more information, please refer to www.sustainalytics.com.
7.b
Reference
standards and
index
methodology.
Whilst there are no specific reference standards that apply to the data, where possible, S&P
DJI uses international sustainability disclosure frameworks such as, SASB, GRI, UN Global
Compact and the recommendations of the Financial Stability Board’s Task Force for
Climate-related Financial Disclosures as published in the 2017 Final Report.
Appendix latest update: June 2021
Appendix first publication: December 2020
S&P Dow Jones Indices: S&P Paris-Aligned & Climate Transition (PACT) Index Series Methodology 42
Disclaimer Performance Disclosure/Back-Tested Data
S&P Dow Jones Indices defines various dates to assist our clients in providing transparency. The First Value Date is the first day for which there is a calculated value (either live or back-tested) for a given index. The Base Date is the date at which the index is set to a f ixed value for calculation purposes. The Launch Date designates the date when the values of an index are f irst considered live: index values provided for any date or time period prior to the index’s Launch Date are considered back -tested. S&P Dow Jones Indices def ines the Launch Date as the date by which the values of an index are known to have been released to the public, for example via the company’s public website or its data feed to external parties. For Dow Jones-branded indices introduced prior to May 31, 2013, the Launch Date (which prior to May 31, 2013, was termed “Date of introduction”) is set at a date upon which no further changes were permitted to be made to the index methodology, but that may have been prior to the Index’s public release date.
Please refer to the methodology for the Index for more details about the index, including the manner in which it is rebalanced, the timing of such rebalancing, criteria for additions and deletions, as well as all index calculations.
Information presented prior to an index’s launch date is hypothetical back-tested performance, not actual performance, and is based on the index methodology in effect on the launch date. However, when creating back-tested history for periods of market anomalies or other periods that do not reflect the general current market environment, index methodology rules may be relaxed to capture a large enough universe of securities to simulate the target market the index is designed to measure or strategy the index is designed to capture. For example, market capitalization and liquidity thresholds may be reduced. Backtested performance ref lects application of an index methodology and selection of index constituents with the benef it of hindsight and knowledge of factors that may have positively affected its performance, cannot account for all f inancial risk that may affect results and may be considered to ref lect survivor/look ahead bias. Actual returns may differ significantly from, and be lower than, back-tested returns. Past performance is not an indication or guarantee of future results.
Typically, when S&P DJI creates back-tested index data, S&P DJI uses actual historical constituent-level data (e.g., historical price, market capitalization, and corporate action data) in its calculations. As ESG investing is still in early stages of development, certain datapoints used to calculate S&P DJI’s ESG indices may not be available for the entire desired period of back-tested history. The same data availability issue could be true for other indices as well. In cases when actual data is not available for all relevant historical periods, S&P DJI may employ a process of using “Backward Data Assumption” (or pulling back) of ESG data for the calculation of back-tested historical performance. “Backward Data Assumption” is a process that applies the earliest actual live data point available for an index constituent company to all prior historical instances in the index performance. For example, Backward Data Assumption inherently assumes that companies currently not involved in a specific business activity (also known as “product involvement”) were never involved historically and similarly also assumes that companies currently involved in a specific business activity were involved historically too. The Backward Data Assumption allows the hypothetical back-test to be extended over more historical years than would be feasible using only actual data. For more information on “Backward Data Assumption” please refer to the FAQ. The methodology and factsheets of any index that employs backward assumption in the backtested history will explicitly state so. The methodology will include an Appendix with a table setting forth the specific data points and relevant time period for which backward projected data was used.
Index returns shown do not represent the results of actual trading of investable assets/securities. S&P Dow Jones Indices maintains the index and calculates the index levels and performance shown or discussed but does not manage actual assets. Index returns do not ref lect payment of any sales charges or fees an investor may pay to purchase the securities underlying the Index or investment funds that are intended to

S&P Dow Jones Indices: S&P Paris-Aligned & Climate Transition (PACT) Index Series Methodology 43
track the performance of the Index. The imposition of these fees and charges would cause actual and back-tested performance of the securities/fund to be lower than the Index performance shown. As a simple example, if an index returned 10% on a US $100,000 investment for a 12-month period (or US $10,000) and an actual asset-based fee of 1.5% was imposed at the end of the period on the investment plus accrued interest (or US $1,650), the net return would be 8.35% (or US $8,350) for the year. Over a three-year period, an annual 1.5% fee taken at year end with an assumed 10% return per year would result in a cumulative gross return of 33.10%, a total fee of US $5,375, and a cumulative net return of 27.2% (or US $27,200).
Intellectual Property Notices/Disclaimer
© 2022 S&P Dow Jones Indices. All rights reserved. S&P, S&P 500, S&P 500 LOW VOLATILITY INDEX, S&P 100, S&P COMPOSITE 1500, S&P 400, S&P MIDCAP 400, S&P 600, S&P SMALLCAP 600, S&P GIVI, GLOBAL TITANS, DIVIDEND ARISTOCRATS, S&P TARGET DATE INDICES, S&P PRISM, S&P STRIDE, GICS, SPIVA, SPDR and INDEXOLOGY are registered trademarks of S&P Global, Inc. (“S&P Global”) or its affiliates. DOW JONES, DJ, DJIA, THE DOW and DOW JONES INDUSTRIAL AVERAGE are registered trademarks of Dow Jones Trademark Holdings LLC (“Dow Jones”). These trademarks together with others have been licensed to S&P Dow Jones Indices LLC. Redistribution or reproduction in whole or in part are prohibited without written permission of S&P Dow Jones Indices LLC. This document does not constitute an offer of services in jurisdictions where S&P Dow Jones Indices LLC, S&P Global, Dow Jones or their respective affiliates (collectively “S&P Dow Jones Indices”) do not have the necessary licenses. Except for certain custom index calculation services, all information provided by S&P Dow Jones Indices is impersonal and not tailored to the needs of any person, entity or group of persons. S&P Dow Jones Indices receives compensation in connection with licensing its indices to third parties and providing custom calculation services. Past performance of an index is not an indication or guarantee of future results. The indices to which this methodology relates are either EU Paris-aligned benchmarks or EU Climate Transition benchmarks. As such they are administered in accordance with specific obligations in order to meet the classification criteria of an EU Paris-aligned benchmark or an EU Climate Transition benchmark, as applicable. These obligations include the setting of a decarbonization trajectory for each EU Paris-aligned benchmark or EU Climate Transition benchmark. However, there is no guarantee that this trajectory will be met and where it is not disclosure will be made where required, in accordance with applicable law. It is not possible to invest directly in an index. Exposure to an asset class represented by an index may be available through investable instruments based on that index. S&P Dow Jones Indices does not sponsor, endorse, sell, promote or manage any investment fund or other investment vehicle that is of fered by third parties and that seeks to provide an investment return based on the performance of any index. S&P Dow Jones Indices makes no assurance that investment products based on the index will accurately track index performance or provide positive investment returns. S&P Dow Jones Indices makes no assurance that investment products based on an index will contribute to decarbonization or other climate change objectives. S&P Dow Jones Indices LLC is not an investment advisor, and S&P Dow Jones Indices makes no representation regarding the advisability of investing in any such investment fund or other investment vehicle. A decision to invest in any such investment fund or other investment vehicle should not be made in reliance on any of the statements set forth in this document. Prospective investors are advised to make an investment in any such fund or other vehicle only after carefully considering the risks associated with investing in such funds, as detailed in an offering memorandum or similar document that is prepared by or on behalf of the issuer of the investment fund or other investment product or vehicle. S&P Dow Jones Indices LLC is not a tax advisor. A tax advisor should be consulted to evaluate the impact of any tax-exempt securities on portfolios and the tax consequences of making any particular investment decision. Inclusion of a security within an index is not a recommendation by S&P Dow Jones Indices to buy, sell, or hold such security, nor is it considered to be investment advice. These materials have been prepared solely for informational purposes based upon information generally available to the public and from sources believed to be reliable. No content contained in these materials (including index data, ratings, credit-related analyses and data, research, valuations, model, software or

S&P Dow Jones Indices: S&P Paris-Aligned & Climate Transition (PACT) Index Series Methodology 44
other application or output therefrom) or any part thereof (“Content”) may be modified, reverse-engineered, reproduced or distributed in any form or by any means, or stored in a database or retrieval system, without the prior written permission of S&P Dow Jones Indices. The Content shall not be used for any unlawful or unauthorized purposes. S&P Dow Jones Indices and its third-party data providers and licensors (collectively “S&P Dow Jones Indices Parties”) do not guarantee the accuracy, completeness, timeliness or availability of the Content. S&P Dow Jones Indices Parties are not responsible for any errors or omissions, regardless of the cause, for the results obtained from the use of the Content. THE CONTENT IS PROVIDED ON AN “AS IS” BASIS. S&P DOW JONES INDICES PARTIES DISCLAIM ANY AND ALL EXPRESS OR IMPLIED WARRANTIES, INCLUDING, BUT NOT LIMITED TO, ANY WARRANTIES OF MERCHANTABILITY OR FITNESS FOR A PARTICULAR PURPOSE OR USE, FREEDOM FROM BUGS, SOFTWARE ERRORS OR DEFECTS, THAT THE CONTENT’S FUNCTIONING WILL BE UNINTERRUPTED OR THAT THE CONTENT WILL OPERATE WITH ANY SOFTWARE OR HARDWARE CONFIGURATION. In no event shall S&P Dow Jones Indices Parties be liable to any party for any direct, indirect, incidental, exemplary, compensatory, punitive, special or consequential damages, costs, expenses, legal fees, or losses (including, without limitation, lost income or lost profits and opportunity costs) in connection with any use of the Content even if advised of the possibility of such damages. S&P Global keeps certain activities of its various divisions and business units separate from each other in order to preserve the independence and objectivity of their respective activities. As a result, certain divisions and business units of S&P Global may have information that is not available to other business units. S&P Global has established policies and procedures to maintain the confidentiality of certain non-public information received in connection with each analytical process. In addition, S&P Dow Jones Indices provides a wide range of services to, or relating to, many organizations, including issuers of securities, investment advisers, broker-dealers, investment banks, other f inancial institutions and financial intermediaries, and accordingly may receive fees or other economic benefits from those organizations, including organizations whose securities or services they may recommend, rate, include in model portfolios, evaluate or otherwise address. The Global Industry Classification Standard (GICS®) was developed by and is the exclusive property and a trademark of S&P and MSCI. Neither MSCI, S&P nor any other party involved in making or compiling any GICS classifications makes any express or implied warranties or representations with respect to such standard or classification (or the results to be obtained by the use thereof), and all such parties hereby expressly disclaim all warranties of originality, accuracy, completeness, merchantability or fitness for a particular purpose with respect to any of such standard or classification. Without limiting any of the foregoing, in no event shall MSCI, S&P, any of their affiliates or any third party involved in making or compiling any GICS classifications have any liability for any direct, indirect, special, punitive, consequential or any other damages (including lost profits) even if notified of the possibility of such damages.