sampling variance in the correlation coefficient under ... score z are selected. then, as part of a...
TRANSCRIPT

Journal of Applied Psychology1997, Vol. 82, No. 4, 528-538
Copyright 1997 by the American Psychological Association, Inc.0021-9010/97/$3.00
Sampling Variance in the Correlation Coefficient Under Indirect RangeRestriction: Implications for Validity Generalization
Herman Aguinis and Roger WhiteheadUniversity of Colorado at Denver
The authors conducted Monte Carlo simulations to investigate whether indirect range
restriction (IRR) on 2 variables X and Y increases the sampling error variability in the
correlation coefficient between them. The manipulated parameters were (a) IRR on X
and Y (i.e., direct restriction on a third variable Z), (b) population correlations pxv,
Pxz, and pvz, and (c) sample size. IRR increased the sampling error variance in r^y to
values as high as 8.50% larger than the analytically derived expected values. Thus, in
the presence of IRR, validity generalization users need to make theory-based decisions
to ascertain whether the effects of IRR are artifactual or caused by situational-specific
moderating effects.
Meta-analysis constitutes a set of procedures used to
quantitatively integrate a body of literature. Validity gener-
alization (VG) is one of the most commonly used meta-
analytic techniques in industrial and organizational (I&O)
psychology, management, and numerous other disciplines
(e.g., Hunter & Schmidt, 1990; Hunter, Schmidt, & Jack-
son, 1982; Mendoza & Reinhardt, 1991; Schmidt, 1992).
For example, Hunter and Schmidt estimated that VGmethods have been used in over 500 studies to investigate
the relationships between preemployment tests and job
performance measures. Because of its frequent implemen-
tation, VG has recently been characterized as one of the
three major meta-analytic approaches (Johnson, Mul-
len, & Salas, 1995).VG extends arguments from psychometric theory to
assert that a substantial portion of the variability observed
Herman Aguinis, College of Business and Administration,
University of Colorado at Denver; Roger Whitehead, Depart-
ment of Psychology, University of Colorado at Denver. Both
authors contributed equally to this study.
A preliminary version of this article was presented at the
meeting of the Society for Industrial and Organizational Psy-
chology, Orlando, Florida, in May 1995. We are grateful to
Charles A. Pierce (Montana State University), Chockalingam
Viswesvaran (Florida International University), and the mem-
bers of the Behavioral Science Research Group for their helpful
feedback on earlier drafts.
Correspondence concerning this article should be addressed
to Herman Aguinis, College of Business and Administration,
University of Colorado at Denver, Campus Box 165, P.O. Box
173364, Denver, Colorado 80217-3364. Electronic mail may
be sent via Internet to [email protected]. Herman
Aguinis's World Wide Web address is http://www.cudenver.
edu/~haguinis.
in an X- Y relationship across individual studies is the
result of sources of variance not explicitly considered in
a study design. Consequently, to better estimate an X-
Y relationship in the population, researchers should (a)
attempt to control the impact of these extraneous sources
of variance by implementing sound research designs and
(b) correct for the extraneous across-study variability by
subtracting it from the total observed variance in study-level effect size estimates (Aguinis & Pierce, in press).
There is consensus that these extraneous sources of vari-
ance are typically not explicitly considered in a study's
design. However, there is an ongoing debate regarding
which sources of variance are artifactual in nature and
which are theoretically meaningful (James, Demaree, &
Mulaik, 1986; James, Demaree, Mulaik, & Mumford,
1988).The sources known to increase across-study variability
in effect size estimates are (a) sampling error, (b) errorof measurement in the dependent variable, (c) dichotomi-
zation of a continuous dependent variable, (d) dichotomi-
zation of a continuous independent variable, (e) range
variation in the independent variable, ( f ) range variation
in the dependent variable due to attrition artifacts, (g)
deviation from perfect construct validity in the indepen-
dent variable, (h) deviation from perfect construct validityin the dependent variable, (i) reporting or transcriptionalerror, and (j) variance due to extraneous factors (Hunter &
Schmidt, 1990; Hunter et al., 1982; Schmidt et al., 1993).However, despite that these factors have been identified,their contribution to overall variability of rs across studiesusually accounts for not more than approximately 80.00%to 90.00% of the total variance (e.g., Pearlman,Schmidt, & Hunter, 1980; Schmidt, Hunter, Pearlman, &Shane, 1979). In consequence, in recent investigations ofVG methodology, researchers have hypothesized that (a)
528

INDIRECT RANGE RESTRICTION AND VG 529
already identified sources of extraneous variance maycause more variability than is recognized (Law,
Schmidt, & Hunter, 1994b); and (b) there may be addi-tional factors, not yet identified, which are possibly caus-ing effect size estimates (e.g., rs) to erratically fluctuateacross studies (Schmidt et al., 1993). As an example ofthe former, a recent Monte Carlo (MC) study conductedby Millsap (1989) demonstrated that the sampling errorvariance of rs across studies is typically much larger thanis suspected. More specifically, the results of Millsap'ssimulation revealed that the sampling error variance of rsaffected by direct range restriction is larger than is esti-mated by the traditional sampling error variance formula
(i.e., S'r = [1 - r2]2/[N - 1]). Consequently, the sam-pling error variance is underestimated when rs are af-fected by direct range restriction. Therefore, if directrange restriction is caused by artifacts and not by theoreti-cally meaningful moderator variables, a conclusion maybe reached erroneously regarding the existence of vari-ability above and beyond sampling error, whereas in actu-ality, across-study variability of rs is caused by (arti-factual) predictor variable range restriction. Stated differ-ently, the unexpected increase in r variability acrossstudies may artificially inflate Type I error rates regardingthe null hypothesis of a no-moderating effect. Moreover,researchers may incorrectly conclude that validities varyacross various specific contexts and situations and, thus,are not generalizable.
More recently, Schmidt et al. (1993) identified addi-tional artifacts hypothesized to inflate the across-studyvariability of rs. One of the factors identified by Schmidt
et al. is indirect range restriction (IRR). IRR is a commonphenomenon in I&O psychological research. In personnel
selection research, for example, applicants for a job areinitially selected on the basis of a cognitive abilities test(predictor Z), such that only those with a score abovecutoff score z are selected. Then, as part of a criterion-related validity study, the validity of a new Test X is evalu-ated as a predictor of job performance (Y) and X is admin-istered to a sample of current employees (i.e., incum-bents) . Note that incumbents constitute a range-restrictedsample because they have already been selected on the
basis of Z scores. Thus, to the extent that Z scores arecorrelated with the new predictor (X) and with job perfor-mance (Y), direct selection on Zleads to IRR (also calledimplicit, induced, or incidental range restriction) on bothX and Y. It deserves noting that direct range restriction(e.g., on Z) and, consequently, IRR (e.g., on X and Y)
occur very frequently in contexts in which samples areselected from larger pools of applicants (e.g., educationaland business organizations; Ghiselli, Campbell, & Zed-eck, 1981, p. 295; Hunter & Schmidt, 1990, p. 209; Linn,1983a, 1983b). Accordingly, Thorndike (1949) stated thatrange restriction, "imposed by indirect selection on the
basis of some variable other than the ones being com-pared, appears by far the most common and most im-
portant one for any personnel selection research pro-gram" (p. 175).
Despite that IRR occurs frequently in I&O psychologi-cal research, especially in such research areas as person-nel selection and validation, there is no empirical evidenceto support Schmidt et al.'s (1993) contention that thevariability of effect sizes is larger than is estimated usingthe traditional sampling error formula when rs are af-fected by IRR. In addition, if such an increase exists, thereis a need to know its magnitude and practical significanceregarding the implementation of VG procedures. Accord-ingly, the purpose of our study was to use an MC strategy(Hartley & Harris, 1963; Noreen, 1989; Rubinstein,1981) to examine (a) whether IRR increases the samplingerror variance in the correlation coefficient above its ana-lytically expected value and (b) the extent to which thesampling error variance estimator used in VG studies un-derestimates sampling error variance in the presence ofIRR.
The MC strategy was used because it allows researchersto overcome difficulties and complexities imposed by theconcurrent manipulation of several parameters, which of-ten make the investigation of sampling distributions math-ematically difficult or even intractable.
Method
Overview
MC simulations were conducted following a method similar
to that implemented by Millsap (1989). In the simulation, we
generated trivariate (X, Y, Z) arrays from multivariate normal
populations and assessed the impact of (a) severity of IRR on
X and Y (i.e., SR, the selection ratio on Z), (b) size of sample
(i.e., n), and (c) size of population correlations (pXY, pxz, and
PYZ), on the observed variance of empirically derived sampling
distributions of rXYs (i.e., Sl,a). Then, we computed the differ-
ence between the empirically derived or observed sampling error
variance S^ and the analytically derived or expected sampling
error variance 5jriv.
Manipulated Parameters
The following parameters were manipulated in the simulation.
IRR. We conducted an IRR on X and Y by restricting the
range on Z using a top-down procedure (see Simulation proce-
dure below). Range restriction on variable Z (i.e., SR) can be
easily converted to v, the restricted to unrestricted population
standard deviations (SDs) ratio (this mathematical equivalence
is possible because Z is normally distributed; see Table 1).
Because Z is correlated with X and Y, direct restriction on Z
causes IRR on X and Y. In the simulation, SR (see Table 1) took
on values ranging from 0.10 to 10.00, in increments of 0.10, to
represent conditions ranging from very severe range restriction
(i.e., SR = .1, sample scores represent the top 10.00% of the

530 AGU1N1S AND WHITEHEAD
Table 1
Sample Sizes Corresponding to Selection Ratios for Each of
the Truncation Values n and Restricted to Unrestricted
Standard Deviations Ratios v
= (r2r3) +/- Vl - r i - (1)
SR 25 60 100
0.10.20.30.40.50.60.70.80.91.0
0.4080.4670.5180.5580.6030.6490.6970.7650.8441.000
250125
8363504236312825
600300200150
1201008675
6760
1,000500300250200167143125111100
Note, v = 1 + [(z)(//SS)] - (//SR)1, where z is the standard normaldeviate corresponding to the selection ratio (SR) and/is the ordinate ofthe standard normal density function at z (Schmidt, Hunter, & Urry,1976).
population distribution of Z scores; v = .408, sample SD is
40.80% as large as the SD of the population distribution of Z
scores) to no range restriction (i.e., SR = 1.0, v = 1.000; sample
scores represent the full population range).
Note that all the study-level correlation coefficients are af-
fected by the same degree of IRR in each cell of the design.
This is not typical in VG studies in which the severity of IRR
is likely to vary from correlation coefficient to correlation coef-
ficient. However, our study is not intended to mirror the typical
VG study. To assess the estimation accuracy of sampling error
variance in the presence of IRR, we needed to hold the popula-
tion validity constant. Otherwise, error would be introduced in
the final results because the correction for the real variance in
true validities would not be perfectly accurate.
Sample size. Sample size n was set at values of 60, 100,
and 140. These values cover a fairly typical range in several
I&O psychology specialities, especially in personnel selection
research. For example, Lent, Aurbach, and Levin (1971) found
that the median sample size in 1,500 validation studies was 68.
More recently, Russell et al. (1994) conducted a meta-analysis
that included the 138 validation studies of personnel selection
systems published in the Journal of Applied Psychology and
Personnel Psychology between 1964 and 1992; he ascertained
that the median sample size was 103 (C. J. Russell, personal
communication, February 21, 1996).
Population intercorrelations. The correlations pxy, Pxz, and
ptz were set at values between 0.10 and 0.90, in increments of
0.10, to represent varying degrees of effect size.
Summary. The manipulation of the independent variables
led to a full factorial design with a total of 21,870 cells or
conditions, that is, 10 (SR) X 3 (n) X 9 (pxy) X 9 (pxz) X 9
(pvz). Note, however, that it is not possible to generate all
possible combinations of correlations ranging from 0.10 to 0.90
among three variables. After two correlations are specified, the
value of the third correlation has a limited range, as indicated
by the following equation (McNemar, 1962, p. 167):
For example, when the correlation between X and Z is 0.80
(e.g., r2) and the correlation between Y and Z is also 0.80 (e.g.,
r3), the correlation between X and Y (i.e., rO can only take on
values between 0.28 and 1 .00. Because of this design consider-
ation, the resulting number of combinations of parameter values
(i.e., cells) in our study was 19,422 (88.81% of the cells in the
hypothetical full factorial design).
Procedure and Dependent Variable
Computer programs. The simulation was performed using
FORTRAN programs incorporating the International Mathemat-
ical and Statistical Libraries (1989) subroutine RNMVN that
generates random normal scores under a user-supplied covari-
ance matrix (cf. Aguinis, 1994).'
Simulation procedure. Five thousand samples were gener-
ated for each of the 19,422 cells (i.e., combination of parameter
values) of the design. The simulation involved the following
three steps.
1. Trivariate (X, Y, Z) arrays of size N were generated from
multivariate normal populations with a mean of zero (i.e., /jx
= /uz = 0.00), unit variance (i.e., CT| = a\ <??. =1.00), and correlations pxy, Pxz, and pYz.
2. The If generated trivariate arrays were sorted in descending
order on Z and truncated at the n th value. The ratio n/N provides
the SR. Identical to Millsap's (1989) procedure, the value of N
was systematically manipulated to give desired values of SR for
fixed values of n. Table 1, equivalent to Millsap's Table 1 (p.
457), shows arrays of size N corresponding to SRs for each
truncation value N, together with corresponding values of v (i.e.,
ratio of restricted to unrestricted SDs).
3. Correlations r^,, r*z, and /-yz were calculated from each
of the 5,000 samples generated for each cell in the design.
Dependent variable. To assess whether IRR on X and Y
spuriously inflates the analytically derived expected variance in
the sampling distribution of rXY s, we followed Millsap's ( 1989)
procedure and computed (a) the observed variance Slr^ from
observed (i.e., generated) sampling distributions of rxy s for
each cell in the design and (b) Fisher's (1921, 1954) expected
estimator S^rm (shown in Equation 2) based on the average of
5,000 estimators. The 5,000 estimators were computed based
on each of 5,000 rxy s generated for each cell in the design:
n - \(2)
Subsequently, the difference between the observed and the ex-
pected variances (d) was computed for each of the 19,422 pa-
rameter value combinations:
L- O)
Key Accuracy Checks
To assess the key accuracy (i.e., validity) of the computer
programs, we first replicated Millsap's (1989) simulation and
1 Source code versions of the programs can be obtained from
Herman Aguinis.

INDIRECT RANGE RESTRICTION AND VG 531
compared S ,̂ s and S\Tn s reported in his study with those gener-
ated using our newly developed computer programs. Values were
generated for each cell of his 9 (pxv) x 10 (SR) x 3 (n) full
factorial design. Note that Millsap used n values of 25, 60, and
100, which differ from the values of 60, 100, and 140 used in
our study. Thus, we also generated values for n = 25 to be able
to fully compare our results with Millsap's. Subsequently, we
computed the mean observed and expected variance for each
sample size condition. Then, we formally compared our results
with those reported by Millsap by conducting six independent-
samples t tests. Observed and expected variance means, discrep-
ancies, and t statistics are reported in Table 2. Values for the (
statistics were very small and in no case approached the .05
statistical significance level. Thus, we concluded that our com-
puter programs were valid, and we proceeded to the IRR-triva-
riate investigation.
Results and Discussion
In our simulation, we examined the effects of IRR onthe difference between observed and expected error vari-ances (i.e., d) in the sampling distribution of rs undervarious conditions of sample size and variable intercorre-
lations. Tables 3-5 show d values for factorial combina-tions of pXY and SR collapsing across values of pxz andPYZ, together with the percentage by which IRR increasesthe sampling error variance in r above its analytically
derived expected value.Table 3 shows the differences between observed and
expected variances ( d s ) for a sample size of 60. An exam-ination of this table shows that (a) rfs are positive for all
conditions, (b) values of d increase as pXY decreases, and(c) values of d increase as SR changes from no restriction(SR = 1.0) to any level of restriction (SR * 1.0). Table4, listing ds for n = 100, shows a similar pattern ofresults. However, the impact of IRR is not as strong aswhen n = 60. The same pattern of results is observed inTable 5 (n = 140), with an even further overall decreasein the values of d. Taken together, the findings presented inthese tables indicate that (a) the sampling error varianceestimator used in VG studies underestimates the true vari-ance in r, even in the absence of IRR (i.e., SR = 1.0
conditions; Hunter & Schmidt, 1994); and (b) IRR accen-
tuates this underestimation even further, especially in situ-ations of small sample and effect size.
Comparison of Effects of IRR and Direct RangeRestriction
Next, we compared the amount of sampling error vari-ance underestimation in r under IRR with that under directrange restriction. Note that IRR and direct range restric-tion are independent processes. Direct range restrictionon X or Y can be present in the absence or presence ofIRR (i.e., direct range restriction on Z). Thus, both IRRand direct range restriction may have an impact on thevariances of X and Y and, consequently, their correlation.However, they can operate in isolation or concurrently.
To compare the relative effects of these two types ofrange restriction, we contrasted our results with thosereported by Millsap (1989). Table 6 presents means ford when SR < 1.0 (mean obtained from all levels of SR
* 1.0) and SR = 1.0 (no range restriction), collapsedacross the other manipulated parameter values for IRRand direct range restriction situations.
Results reported in Table 6 show that our findings re-
garding the impact of IRR on the sampling variance in r
are virtually as strong as those reported by Millsap (1989)regarding the effect of direct range restriction. Similarly,both Millsap's simulation and ours demonstrate that (a)the analytically derived expected sampling variance givenin Equation 2 is negatively biased and (b) this bias islarger in restricted than unrestricted data. Likewise, wealso found that this bias increases as sample size de-creases. Finally, note that we also generated data for n =
25 to compare our results with Millsap's. However, itshould be noted that such an unusually small sample sizedeviates substantially from the typical sample size in to-day's validation studies (i.e., n « 100).
Table 6 indicates that, for SR = 1.0(i.e.,no restriction),
our ds are slightly smaller than those reported by Millsap(1989). This downward trend in our results is due to the
Table 2
Variance Means, Discrepancies, and t Statistics
Variance M Millsap Replication Discrepancy
25
256060100100
ObservedEstimatedObservedEstimatedObservedEstimated
.0299363
.0272177
.0121137
.0114042
.0072179
.0068450
.0304002
.0273014
.0120363
.0114131
.0071974
.0068506
.0004638
.0000838-.0000773
.0000089-.0000200.0000056
.2690
.0524-.0109.0127
-.0478
.0131
Note. Millsap = results from Millsap (1989); Replication = values obtained using our study's computer
programs; Discrepancy = replication variance — Millsap variance.
"p > .05, for all t statistics.

532 AGUINIS AND WHITEHEAD
Table 3
Values ofd (&„ - S2,rjfor n = 60
ftv
0.10
0.20
0.30
0.40
0.50
0.60
0.70
0.80
0.90
M
O.I
.00101(7.71).00107
(7.95).00096
(6.75).00088
(6.25).00080
(6.57).00053
(5.60).00039
(4.93).00017
(4.55).00004
(5.07).00065
(6.25)
0.2
.00077(5.67).00083
(5.91).00072
(4.97).00066
(4.67).00061
(4.97).00039
(4.09).00028
(3.44).00012
(2.79).00003
(2.76).00049
(4.36)
0.3
.00117(7.88).00123
(8.19).00111
(7.38).00097
(6.94).00083
(6.84).00054
(5.81).00035
(4.98).00014
(4.04).00003
(3.70).00071
(6.19)
0.4
.00107(7.16).00109
(7.11).00093
(6.03).00078
(5.29).00065
(4.94).00039
(3.75).00024
(2.82).00009
(2.04).00002
(1.60).00058
(4.52)
0.5
.00073(4.87).00076
(4.87).00063
(4.03).00055
(3.71).00049
(3.76).00032
(3.15).00022
(2.99).00010
(2.71).00003
(3.20).00042
(3.69)
SR
0.6
.00048(3.08).00048
(3.08).00039
(2.51).00034
(2.36).00032
(2.55).00021
(2.33).00015
(2.35).00007
(2.11).00002
(1.91).00027
(2.49)
0.7
.00110(6.83).00108
(6.78).00095
(6.23).00079
(5.77).00063
(5.35).00041
(4.55).00025
(3.93).00010
(3.04).00002
(2.30).00059
(4.97)
0.8
.00080(4.97).00080
(5.05).00072
(4.85).00061
(4.67).00049
(4.46).00033
(3.94).00020
(3.38).00008
(2.47).00001
(1.38).00045
(3.91)
0.9
.00027(1.64).00026
(1.60).00020
(1.34).00017
(1.30).00016
(1.45).00010
(1.29).00006
(1.15).00002
(0.93).00000
(0.65).00014
(1.26)
1.0
.00041(2.52).00033
(2.16).00023
(1.70).00016
(1.32).00010
(1.00).00005
(0.68).00002
(0.44).00001
(0.31).00000
(0.26).00014
(1.15)
M
.00078(5.23).00079
(5.27).00068
(4.58).00059
(4.23).00051
(4.19).00033
(3.52).00022
(3.03).00009
(2.51).00002
(2.28).00045
(4.01)
Note. S1 ,̂ = observed sampling error variance in rxv; Slfxt = expected sampling error variance in rxv; SR = selection ratio on Z; n = samplesize. Values in parentheses show the percentage by which sfr-r is larger than i'J,m.
fact that our simulation design consisted of trivariate (as
compared to Millsap's bivariate) arrays and, thus, was
not a full factorial. Because, after two correlation values
are specified, values for the third correlation are limited,
our design was slightly unbalanced in that it included
more higher (i.e., closer to 0.90) than lower (closer to
0.10) values for pXY (cf. Equation I ) . Consequently, be-
cause d decreases as r increases, our values for d in the
Table 4
Values ofd (&„ - S2e,J for n = 100
Px,
0.10
0.20
0.30
0.40
0.50
0.60
0.70
0.80
0.90
M
0.1
,00065(8.38).00068
(8.55).00061
(7.09).00056
(6.38).00051
(6.63).00034
(5.42).00025
(4.59).00011
(4.05).00002
(4.90).00041
(6.22)
0.2
.00050(6.18).00053
(6.35).00046
(5.07).00040
(4.40).00036
(4.37).00021
(3.17).00014
(2.26).00005
(1.79).00001
(0.92).00029
(3.83)
0.3
.00034(4.23).00035
(4.07).00028
(2.93).00024
(2.43).00022
(2.52).00013
(1.83).00009
(1.48).00004
(1.65).00001
(2.82).00019
(2.66)
0.4
.00031(3.58).00031
(3.43).00022
(2.31).00017
(1.60).00014
(1.33).00005
(0.41).00003
(-0.14).00000
(-0.31).00000
(0.74).00013
(1.44)
0.5
.00068(7.27).00066
(7.05).00055
(5.98).00044
(5.22).00034
(4.71).00020
(3.59).00011
(2.73).00004
(1.87).00001
(1.88).00034
(4.48)
SR
0.6
.00064(6.70).00064
(6.70).00055
(6.05).00046
(5.61).00037
(5.41).00024
(4.70).00015
(4.40).00006
(3.93).00002
(3.99).00035
(5.28)
0.7
.00063(6.56).00060
(6.20).00048
(5.22).00037
(4.49).00027
(3.84).00015
(2.84).00008
(2.14).00003
(1.51).00001
(1.94).00029
(3.86)
0.8
.00018(1.89).00018
(1.83).00014
(1.48).00011
(1.40).00010
(1.54).00006
(1.46).00004
(1.55).00002
(1.66).00001
(2.05).00009
(1.65)
0.9
.00041(4.16).00040
(4.23).00036
(4.12).00030
(3.94).00023
(3.64).00015
(3.08).00008
(2.50).00003
(1.73).00001
(1.13).00022
(3.17)
1.0
.00001(0.09).00002
(0.27).00004
(0.54).00005
(0.76).00005
(0.94).00004
(0.99).00002
(0.91).00001
(0.55).00000
(0.45).00003
(0.61)
M
.00043(4.90).00044
(4.87).00037
(4.08).00031
(3.62).00026
(3.49).00016
(2.75).00010
(2.24).00004
(1.84).00001
(2.08).00024
(3.32)
Note. Slr^ = observed sampling error variance in rXY; 5 ,̂ = expected sampling error variance in rxv; SR = selection ratio on Z; n = samplesize. Values in parentheses show the percentage by which 5^yv is larger than S%fxi.

INDIRECT RANGE RESTRICTION AND VG 533
Table 5
Values ofd (&„ - Sljfor n = 140
p™
0.10
0.20
0.30
0.40
0.50
0.60
0.70
0.80
0.90
M
0.1
.00019(3.92).00022
(4.34).00020
(3.43).00020
(3.34).00021
(4.27).00015
(3.99).00012
(3.93).00006
(4.42).00001
(4.79).00015
(4.05)
0.2
.00028(4.95).00030
(5.17).00026
(4.10).00023
(3.64).00022
(3.83).00013
(2.83).00009
(2.00).00003
(1.46).00001
(1.10).00017
(3.23)
0.3
.00033(5.43).00034
(5.39).00027
(4.13).00022
(3.49).00020
(3.42).00011
(2.40).00007
(1.75).00003
(1.55).00001
(2.80).00017
(3.37)
0.4
.00027
(4.29).00030
(4.62).00026
(3.94).00024
(3.82).00022
(4.10).00012
(3.65).00010
(3.55).00005
(3.63).00001
(4.07).00018
(3.96)
0.5
.00024(3.78).00024
(3.50).00018
(2.51).00014
(1.97).00012
(1.85).00006
(1.15).00004
(0.85).00002
(0.83).00001
(1.32).00012
(1.97)
SR
0.6
.00022(3.26).00022
(3.17).00018
(2.59).00016
(2.42).00015
(2.66).00010
(2.42).00007
(2.50).00003
(2.56).00001
(3.04).00013
(2.74)
0.7
.00042(6.10).00038
(5.57).00030
(4.51).00022
(3.59).00015
(2.83).00007
(1.73).00003
(0.95).00001
(0.39).00000
(0.99).00018
(2.96)
0.8
.00021(2.93).00019
(2.65).00013
(1.92).00008
(1.34).00005
(0.96).00001
(0.34).00000
(0.08)-.00000
(-0.19)-.00000
(-0.02).00007
(1.11)
0.9
.00027
(3.89).00026
(3.83).00023
(3.57).00018
(3.31).00014
(3.14).00009
(2.65).00005
(2.26).00002
(1.81).00000
(1.40).00014
(2.87)
1.0
.00018(2.59).00016
(2.45).00014
(2.29).00010
(1.95).00006
(1.56).00003
(1.04).00001
(0.42).00000
(0.05)-.00000
(-1.54).00007
(1.20)
M
.00026(4.11).00026
(4.07).00021
(3.30).00018
(2.89).00015
(2.86).00009
(2.22).00006
(1.83).00002
(1.65).00001
(1.80).00014
(2.75)
Note. Sl,a = observed sampling error variance in rm; S], = expected sampling error variance in r^,; SRsize. Values in parentheses show the percentage by which 5^ is larger than S2
er^.selection ratio on Z; « - sample
absence of restriction suffer a slight negative bias as com-pared with Millsap's results. This design considerationstrengthens the relevance of our study's results becauseour estimates regarding the degree of negative bias inthe sampling error variance estimate in r obtained usingEquation 2 should be considered somewhat conservative.
Effects of Variable Intercorrelations
We also investigated the degree to which d values wereaffected by the level of shared variance between the vari-
Table 6Values ofd (£;;,„ - S2,,J Under Direct and IndirectRange Restriction
Range restrictionand n
Direct (Mfflsap, 1989)2560100140"
Indirect (our study)2560100140"
Selection ratio
<1.0
.00283
.00075
.00040
—
.00224
.00048
.00027
.00015
1.0
.00174
.00035
.00016
—
.00146
.00014
.00003
.00007
able pairs Z-X and Z-K This shared variance can beprecisely expressed as S|XY, namely, the proportion of
variance in Z accounted for by variables X and Y (Pedha-zur, 1982, p. 107):
(4)
" Millsap' s investigation of the effects of direct range restriction includedsample size of only 25, 60, and 100.
Under the condition of direct range restriction on Z,
IRR on X and Y increases to the extent that R | .XY increasesand, consequently, values of d should increase. To examinethis prediction, we plotted representative values of SR
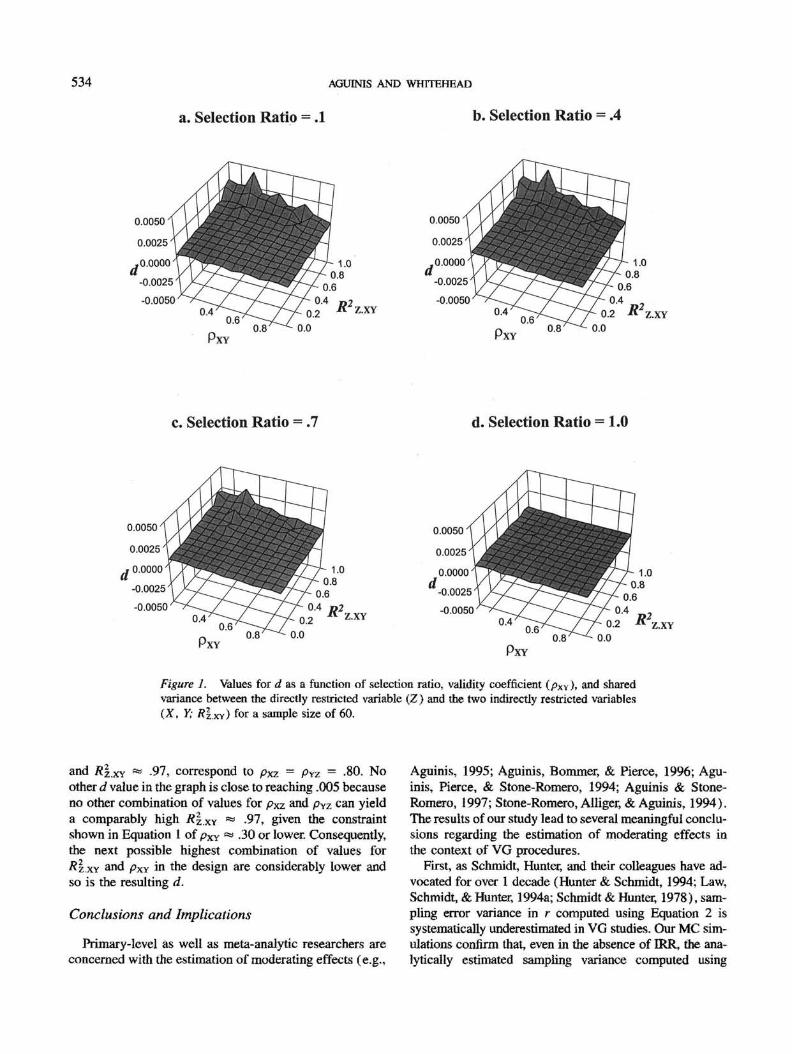
(i.e., 0.1, 0.4, 0.7, and 1.0) with values of RZ.XY, Pxv, n,and d in Figures 1-3.
A perusal of Figures 1-3 indicates that d values in-
crease as (a) RZXY (i>e., shared variance) increases, (b)PXY decreases, and (c) SR shifts from 1.0 to any othervalue (i.e., from no IRR to any level of IRR). Theseeffects are strongest in Figure 1 (n = 60) and smaller inmagnitude, yet still noticeable, as sample size increasesto 100 (Figure 2) and to 140 (Figure 3).
It should be noted that the three peaks for d valuesshown in Figures 1—3, and more noticeable for n = 60,are due to the facts that (a) larger values of /?|.XY werefound to increase d, (b) small values for pXY were foundto increase d, and (c) our design did not include allpossible combinations of correlations between variablesX, Y, and Z (cf. Equation 1). For example, Figure lashows a value for d virtually reaching .005 for PXY = -30,
534 AGUINIS AND WHITEHEAD
a. Selection Ratio = .1 b. Selection Ratio = .4
Z.XY
c. Selection Ratio = .7 d. Selection Ratio = 1.0
Z.XYZ.XY
Figure 1. Values for d as a function of selection ratio, validity coefficient (pxv), and sharedvariance between the directly restricted variable (Z) and the two indirectly restricted variables( X , Y; /?!.XY) for a sample size of 60.
and KZ.XY ** -97, correspond to pxz - PYZ = -80. Noother d value in the graph is close to reaching .005 becauseno other combination of values for pxz arid pYz can yielda comparably high RZ.XY № -97, given the constraintshown in Equation 1 of pxy « .30 or lower. Consequently,the next possible highest combination of values for/?!.XY and pXY in the design are considerably lower andso is the resulting d.
Conclusions and Implications
Primary-level as well as meta-analytic researchers areconcerned with the estimation of moderating effects (e.g.,
Aguinis, 1995; Aguinis, Bommer, & Pierce, 1996; Agu-inis, Pierce, & Stone-Romero, 1994; Aguinis & Stone-Romero, 1997; Stone-Romero, Ailiger, & Aguinis, 1994).The results of our study lead to several meaningful conclu-sions regarding the estimation of moderating effects inthe context of VG procedures.
First, as Schmidt, Hunter, and their colleagues have ad-vocated for over 1 decade (Hunter & Schmidt, 1994; Law,Schmidt, & Hunter, 1994a; Schmidt & Hunter, 1978), sam-pling error variance in r computed using Equation 2 issystematically underestimated in VG studies. Our MC sim-ulations confirm that, even in the absence of IRR, the ana-lytically estimated sampling variance computed using

INDIRECT RANGE RESTRICTION AND VG
a. Selection Ratio = .1 b. Selection Ratio = .4
535
d
Z.XY 0.6 Z.XV
PXY0.8'
c. Selection Ratio = .7 d. Selection Ratio = 1.0
Z.XY
Figure 2. Values for if as a function of selection ratio, validity coefficient (PXY). and sharedvariance between the directly restricted variable (Z) and the two indirectly restricted variables(X, Y; KZ.XY) for a sample size of 100.
Equation 2 has a systematic negative bias as comparedwith the empirically computed sampling variance based onthe actual generated data. This underestimation may bequite large under some conditions, especially as samplesizes approach smaller values (e.g., 60) and effect sizesare small (i.e., .50 or smaller, which can be considered tobe the typical range for validity coefficients in personnelselection research). For instance, when n - 60, in theabsence of IRR, and when collapsing across all levels ofvariable intercorrelations, the observed sampling error vari-ance is 1.15% larger than the analytically derived (i.e.,expected) variance. When /TXY = -20, in the absence ofERR, and when collapsing across all sample sizes (i.e., 60,100, and 140), the observed sampling error variance is1.63% larger than the expected value computed in VGstudies.
Second, a new finding and unique contribution of ourstudy is the conclusion that IRR worsens the underestima-tion of the VG sampling error variance estimator signifi-cantly. In situations of IRR, the actual variance in r acrossstudies is underestimated even more radically when a (a)sample size is smaller than 100 and approaches 60 (seeFigures 1-3), (b) true validity is .60 or smaller (seeTables 3 - 5), and ( c) shared variance between the directlyrestricted variable and the two IRR variables (i.e.,RZ.XT) is approximately .75 (e.g., pxy = .60, pxz = -20,and pyz = .80; see Figure 1). Also, the effects of IRR werefound to be comparable in magnitude with the effects ofdirect range restriction. Finally, it should be noted that theseverity of IRR is not as important as the mere presence ofany degree of IRR.
To use a meaningful example, the concurrent presence

536 AGU1NIS AND WHITEHEAD
a. Selection Ratio = .1 b. Selection Ratio = .4
Z.XY0.4
0.6 Z.XY
PXY0.8'
c. Selection Ratio = .7 d. Selection Ratio = 1.0
Z.XY0.6
PXY0.8'
Figure 3. Values far d as a function of selection ratio, validity coefficient (PXY). and sharedvariance between the directly restricted variable (Z) and the two indirectly restricted variables(X, Y; RZXY) for a sample size of 140.
of IRR (SR < 1.0), sample size of 60, true validity OXY)of .60, pxz — .60, and pn — -60 yields an observedsampling error variance in r 3.16% larger than the valuecomputed using Fisher's (1921, 1954) estimator. For thesame parameters and a sample size of 100, this differencedecreases to 2.34%; for a sample size of 140, it is furtherreduced to 1.85%. Thus, the proportion of variance in rdue to FRR is always above zero, and this proportionincreases substantially as sample size approaches 60. Asa consequence of the increased sampling error variancein the correlation coefficient caused by IRR and in theabsence of theory-based hypotheses regarding the impactof IRR, researchers may incorrectly assume that this arti-factual variance is due to potential moderator variables,and, hence, false moderators may be "discovered."
In summary, Tables 3-5 show that when collapsingacross values of PXY, Pxz, and pTC, IRR artificially inflatesthe variance in r up to a high percentage (» 8.50%).Also, Tables 3-5 indicate that, even though the proportionof variance increase is quite sizable for some conditions(e.g., small sample size and moderate or smail effectsize), it is modest for others (e.g., large sample size andlarge effect size). Thus, that the median sample size inthe validation research literature is larger now than 20years ago (i.e., 103 vs. 68) is encouraging. Nevertheless,because IRR-caused variability may be incorrectly attrib-uted to nonsubstantive moderating effects and the situa-tional specificity hypothesis may be incorrectly assumedto be valid, the presence of IRR should not be ignored infuture VG endeavors. Moreover, researchers should con-

INDIRECT RANGE RESTRICTION AND VG 537
sider a priori hypotheses regarding the presence of sub-
stantive moderator variables that may cause IRR.
Limitations and Research Needs
Our MC study used a rnultivariate random normal gen-erator. Thus, even though complying with the (rnultivari-
ate) normality assumption is common practice in MCinvestigations of VG and meta-analytic methods in general(e.g., Callender & Osburn, 1981; Millsap, 1989), we ac-knowledge that our study's results may not be generaliz-able to situations in which this assumption is not tenable.
Second, our study ascertained the effects of IRR on thesampling error variance in the correlation coefficient. Thisis a new finding and unique contribution to the VG litera-
ture. However, the conclusions of this research leave VGresearchers in a perhaps uncomfortable situation. Unlessinformation is gathered regarding possible IRR in the pri-mary-level studies used in a VG investigation, VG re-searchers cannot establish whether unexplained variancedue to IRR is artifactual or caused by potential modera-tors. To remedy this difficulty, at present, we can onlyextend Hunter and Schmidt's (1990) recommendation thatprimary-level researchers report as much information aspossible regarding their studies, so eventual quantitativereviews can be as accurate as possible. This would includenot only the reporting of statistics to be used in a meta-analysis but also the reporting of detailed procedures usedto collect the data, including information regarding IRRand direct range restriction processes (e.g., Hattrup &Schmitt, 1990).
We foresee at least two avenues for future research.First, given our study's results regarding the impact ofIRR on the sampling variance in the correlation coeffi-cient, it would be desirable that future researchers addresspossible statistical corrections to prevent the negative biasin S\,^ in IRR situations. Because direct restriction (prior
to IRR) can occur on more than one variable (i.e., acognitive abilities test, Z,, and a personality test, Zj),future researchers should address the question of whetherthese corrections should be (a) performed individually byassessing the impact of each restricted Z variable or (b)computed only once on the basis of the compound effectof all Z variables. Research on range restriction correc-tions by Ree, Carretta, Earles, and Albert (1994) demon-strated that a rnultivariate correction does not yield thesame results as a series of univariate corrections. Morespecifically, Lawley's (1943) rnultivariate correction re-sults in corrected correlations that are closer to the speci-fied population parameters as compared with correctinga matrix one correlation at a time. Thus, Ree et al.'sconclusion suggests that a rnultivariate correction is pre-ferred. However, this recommendation relies on the fairlyrestrictive assumption that a researcher has all the infor-
mation needed to implement it (e.g., restricted and un-restricted SDs for all variables involved).
Second, if feasible, in the future researchers shouldexamine the extent to which IRR may have increased theacross-study variance in already published VG investiga-tions that accounted for less than 100.00% of this variabil-ity. Our study's results suggest that the presence of IRRmay have led researchers who did not have substantive apriori moderating effect hypotheses regarding the effectof IRR to the erroneous conclusion of the possible pres-ence of unexplained moderating effects.
A Closing Comment
In closing, we urge researchers to consider the implica-tions of IRR for the conduct of quantitative summaries ofresearch literatures. In the presence of IRR, variabilityacross study-level rs can be underestimated by as muchas 8.50%. In such IRR situations, researchers need tomake theory-based decisions to ascertain whether the ef-fects of IRR are artifactual or caused by situational-spe-cific moderating effects.
References
Aguinis, H. (1994). A QuickBASIC program for generating
correlated multivariate random normal scores. Educational
and Psychological Measurement, 54, 687-689.
Aguinis, H. (1995). Statistical power problems with moderated
multiple regression in management research. Journal of Man-
agement, 21, 1141-1158.
Aguinis, H., Bommer, W. H., & Pierce, C. A. (1996). Improving
the estimation of moderating effects by using computer-ad-
ministered questionnaires. Educational and Psychological
Measurement, 56, 1043-1047.
Aguinis, H., & Pierce, C. A. (in press). Testing moderator vari-
able hypotheses meta-analytically. Journal of Management.
Aguinis, H., Pierce, C. A., & Stone-Romero, E. F. (1994). Esti-
mating the power to detect dichotomous moderators with
moderated multiple regression. Educational and Psychologi-
cal Measurement, 54, 690-692.
Aguinis, H., & Stone-Romero, E. F. (1997). Methodological
artifacts in moderated multiple regression and then: effects on
statistical power Journal of Applied Psychology, 82, 192-
206.
Callender, J. C., & Osburn, H. G. (1988). Unbiased estimation
of sampling variance of correlations. Journal of Applied Psy-
chology, 73, 312-315.
Fisher, R. A. (1921). On the "probable error" of a coefficient
of correlation deduced from a small sample. Metron, 1, 1 -
32.
Fisher, R. A. (1954). Statistical methods for research workers.
Edinburgh, Scotland: Oliver & Boyd.
Ghiselli, E. E., Campbell, J. P., & Zedeck, S. (1981). Measure-
ment theory for the behavioral sciences. San Francisco:
Freeman.
Hartley, H. Q, & Harris, D. L. (1963). Monte Carlo computa-

538 AGUINIS AND WfflTEHEAD
tions in normal correlation problems. Journal of the Associa-
tion for Computing Machinery, 10, 302-306.
Hattrup, K., & Schmitt, N. (1990). Prediction of trades appren-
tices' performance on job sample criteria. Personnel Psychol-
ogy, 43, 453-466.
Hunter, J. E., & Schmidt, F. L. (1990). Methods of meta-analy-
sis: Correcting error and bias in research findings. Newbury
Park, CA: Sage.
Hunter, J. E., & Schmidt, F. L. (1994). Estimation of sampling
error variance in the meta-analysis of correlations: Use of
average correlation in the homogeneous case. Journal of Ap-
plied Psychology, 79, 171-177.
Hunter, J. E., Schmidt, F. L., & Jackson, G. B. (1982). Meta-
analysis: Cumulating research findings across studies. Bev-
erly Hills, CA: Sage.
International Mathematical and Statistical Libraries. (1989).
IMSL library reference manual (10th ed.). Houston, XX:
Author.
James, L. R., Demaree, R. G., & Mulaik, S. A. (1986). A note
on validity generalization procedures. Journal of Applied Psy-
chology, 71, 440-450.
James, L. R., Demaree, R. G., Mulaik, S. A., & Mumford, M. D.
(1988). Validity generalization: Rejoinder to Schmidt, Hunter,
and Raju (1988). Journal of Applied Psychology, 73, 673-
678.
Johnson, B. T, Mullen, B., & Salas, E. (1995). Comparison
of three major meta-analytic approaches. Journal of Applied
Psychology, 80, 94-106.
Law, K. S., Schmidt, F. L., & Hunter, J. E. (1994a). Nonlinear-
ity of range corrections in meta-analysis: Test of an improved
procedure. Journal of Applied Psychology, 79, 425-438.
Law, K. S., Schmidt, F. L., & Hunter, J. E. (1994b). A test of
two refinements in procedures for meta-analysis. Journal of
Applied Psychology, 79, 978-986.
Lawley, D. N. (1943). A note on Karl Pearson's selection for-
mulae. Proceedings of the Royal Society of Edinburgh,
52(SectionA, Pt. 1), 28-30.
Lent, R. H., Aurbach, H. A., & Levin, L. S. (1971). Research
design and validity assessment. Personnel Psychology, 24,
247-274.
Linn, R. L. (1983a). Pearson selection formulas: Implications
for studies of predictive bias and estimates of educational
effects in selected samples. Journal of Educational Measure-
ment, 20, 1-15.
Linn, R. L. (1983b). Predictive bias as an artifact of selection
procedures. In H. Wainer & S. Messick (Eds.), Principals of
modem psychological measurement: A festschrift for Fred-
eric M. Lord (pp. 27-40). Hillsdale, NJ: Erlbaum.
McNemar, Q. (1962). Psychological statistics (3rd ed.). New
York: Wiley.
Mendoza, J. G., & Reinhardt, R. N. (1991). Validity generaliza-
tion procedures using sample-based estimates: A comparison
of six procedures. Psychological Bulletin, 110, 596-610.
MilJsap. R. E. (1989). Sampling variance in the correlation
coefficient under range restriction: A Monte Carlo study.
Journal of Applied Psychology, 74, 456-461.
Noreen, E. W. (1989). Computer intensive methods for testing
hypotheses. New %rk: Wiley-Interscience.
Pearlman, K., Schmidt, F. L., & Hunter, J. E. (1980). Validity
generalization results for tests used to predict job proficiency
and training success in clerical occupations. Journal of Ap-
plied Psychology, 65, 373-406.
Pedhazur, E. J. (1982). Multiple regression in behavioral re-
search (2nd ed.). New %rk: Holt Reinhart Winston.
Ree, M. J., Carretta, T. R., Earles, J. A., & Albert, W. (1994).
Sign changes when correcting for range restriction: A note
on Pearson's and Lawley's selection formulas. Journal of
Applied Psychology, 79, 298-301.
Rubinstein, R. Y. (1981). Simulation and the Monte Carlo
method. New Tfork: Wiley.
Russell, C. J., Settoon, R. P., McGrath, R. N., Blanton, A. E.,
Kidwell, R. E., Lohrke, F. T., Scifres, E. L., & Danforth,
G. W. (1994). Investigator characteristics as moderators of
personnel selection research: A meta-analysis. Journal of Ap-
plied Psychology, 79, 163-170.
Schmidt, F. L. (1992). What do data really mean? Research
findings, meta-analysis, and cumulative knowledge in psy-
chology. American Psychologist, 47, 1173-1181.
Schmidt, F. L., & Hunter, J. E. (1978). Moderator research and
the law of small numbers. Personnel Psychology, 31, 215—
232.
Schmidt, F. L., Hunter, J. E., Pearlman, K., & Shane, G. S.
(1979). Further tests of the Schmidt-Hunter Bayesian valid-
ity generalization procedure. Personnel Psychology, 32, 257-
381.
Schmidt, F. L., Hunter, J. E., & Urry, V. W. (1976). Statistical
power in criterion-related validation studies. Journal of Ap-
plied Psychology, 61, 473-485.
Schmidt, F. L., Law, K., Hunter, J. E., Rothstein, H. R.,
Pearlman, K., & McDaniel, M. (1993). Refinements in valid-
ity generalization methods: Implications for the situational
specificity hypothesis. Journal of Applied Psychology, 78, 3-
12.
Stone-Romero, E. F., Alliger, G. M., & Aguinis, H. (1994). Type
II error problems in the use of moderated multiple regression
for the detection of moderating effects of dichotomous vari-
ables. Journal of Management, 20, 167-178.
Thorndike, R. L. (1949). Personnel selection. New York: Wiley.
Received March 6, 1996
Revision received February 21, 1997
Accepted February 24, 1997 •