sampling for web surveys non-response in the context of a panel selected using probability sampling....
TRANSCRIPT
SAMPLING FOR WEB SURVEYS
DOUGLAS RIVERSSTANFORD UNIVERSITY AND POLIMETRIX, INC.
ABSTRACT. Web surveys are frequently based on samples drawn from panels with large amountsof nonresponse or haphazard selection. The availability of large-scale consumer and voter databasesprovides large amounts of auxilliary information for both panelists and population members. Samplematching, where a conventional random sample is selected from a population frame and the clos-est matching respondent from the panel is selected for interviewing, is proposed. It is shown thatunder suitable assumptions (primarily ignorability of panel membership conditional upon the match-ing variables), the resulting survey estimates are consistent with an asymptotic normal distribution.Simulation results show that the matched sample estimators are superior to weighting a random sub-sample from the panel and have a similar sampling distribution to simple random sampling from thepopulation. In an example involving the 2006 U.S. Congressional elections, estimates using samplematching from an opt-in Web panel outperformed estimates based on phone interviews with RDDsamples.
1. INTRODUCTION
Prior to the 1970’s, nearly all survey interviewing was conducted in person or by mail. Highquality surveys were conducted in person using area probability samples, while much market re-search was performed on mail access panels using quota sampling. With the advent of randomdigit dialing (RDD), an intermediate possibility arose: it was possible to construct a respectableprobability sample from phone numbers and save substantial amounts by conducting interviewsover the phone (as well as by using some clever sampling designs such as that proposed by Mitof-sky and Waksberg). Nearly all media polling and most academic surveys, except a few large andgenerously funded projects such as the National Election Studies and the General Social Survey,quickly moved to the phone. Most households had telephones and, initially, response rates werequite high. However, over time response rates have deteriorated so that most media polls now haveresponse rates around 20 percent. With enough time and effort, it is possible to achieve responserates of approximately 40 percent with RDD (largely by reducing non-contact), but there is littleevidence that the additional time and expense is worth the effort (Holbrook et al., 2005).
The advent of the World Wide Web in 1991 created yet another possibility for interviewing. Anumber of large opt-in Web access panels were created in the 1990’s and now dominate surveydata collection for market research. However, unlike phone numbers, there was no obvious wayto sample email addresses, so that most Web surveys were conducted using convenience samples(often involving quota sampling). Naturally, most surveys conducted on mail panels, which hadlong ago abandoned probability sampling, were among the first to migrate to the Web and thetraditional mail panel vendors now operate some of the largest Web panels. Few in the academic
Prepared for the 2007 Joint Statistical Meetings, Salt Lake City, UT, August 1, 2007. I am grateful for the adviceand assistance of James Lo and Samantha Luks.
1

2 DOUGLAS RIVERS STANFORD UNIVERSITY AND POLIMETRIX, INC.
or media world (at least in the U.S.) were willing to sacrifice probability sampling (in the form ofRDD) for the economies of Web interviewing if it required a switch to quota sampling.
Norman Nie and I founded Knowledge Networks (originally InterSurvey) in 1998 with the ideaof bringing probability sampling to the Web. The approach used by Knowledge Networks ad-dresses the fundamental problems of sampling for Web surveys. The panel was recruited usingRDD, so the sampling methodology was not particularly controversial. Coverage of householdswithout Internet access was accomplished by providing respondents with an inexpensive device toconnect to the Internet. For many items, the panel produces estimates that appear quite similar toconventional RDD surveys conducted using telephone interviewing.
There are, however, several drawbacks to this approach. First, it is quite expensive, so the feasi-ble panel size is fairly small (currently about 35,000 households). Second, like most RDD surveys,it suffers from falling response rates, leading to significant underrepresentation of certain groups(minorities, low education, students). Further, panel attrition further compromises the sample, sothat the overall response rate is disappointingly low. In a report of a 2001 survey, for example, thereported response rate for panel recruitment was 41%, of whom 64% had attrited. The within-panelresponse rate for the survey was 73%, for a cumulative response rate of 0.41×0.36×0.73 = 11%.(Schlenger et al., 2003, p. 582)1 For the most part, panel biases could be adequately dealt with bypost-stratification on some demographic variables, but this means that inferences rest as much onthe effectiveness of the weighting adjustment as upon sample selection.
Over time, I’ve come to the belief that non-probability samples are a reasonable approach forcertain types of problems. There is little argument that convenience samples are adequate for exper-imental studies, even when the conclusions are intended to apply to some larger population. Theseare essentially model-based inferences that come from assuming that the experimental effects arehomogeneous within the relevant population. Similarly, substantial levels of nonresponse (as ex-perienced, for example, by most surveys conducted for media organizations) require model-basedadjustments. Any inferences from such samples depends as much upon the validity of unverifiableassumptions as on random selection. There is no logical difference between the type of modelingassumptions needed for nonresponse adjustments and those needed for self-selected samples.
In the case of Web survey panels, all methods of recruitment (including those that start withsome form of probability sampling) will inevitably involve some degree of self-selection. Withoutadjustment, survey estimates based upon such samples will be biased. Conventional methods ofadjustment, such as quota sampling or post-stratification based upon a few demographic variables,are inadequate to address these biases. (See, for example, Couper et al., 2007.)
The purpose of this paper is to discuss methods of selecting subsamples from an opt-in Webpanel that simultaneously reduce bias and improve efficiency. The availability of large amounts ofauxiliary information from consumer and voter databases make it feasible to select a sample that isapproximately balanced on a large set of variables. Sample matching is proposed as a cost-effectivemethod for constructing samples with minimal bias. With sample matching, a population framethat includes large amounts of auxilliary information is used to select a target sample using knownprobabilities of selection. For each element of the target sample, the closest matching elementfrom the panel is selected for interviewing. Because of imperfect matching, the resulting sample
1This calculation does not take into account non-coverage of households without English speakers or toll-freeInternet access. It is unclear whether the reported response rate includes within-household selection.
SAMPLING FOR WEB SURVEYS 3
still needs to be weighted, but the weights are much smaller than would be required for either arandom subsample or a quota sample.
The plan of the paper is as follows. Section 2 establishes the notation and some basic definitions,such as ignorable selection, that are used in the rest of the paper. Section 3 discusses the problemsof non-response in the context of a panel selected using probability sampling. Section 4 describesquota sampling and its equivalence to post-stratification for non-response. Section 5 describes the“closest neighbor” sample matching technique and some of its theoretical properties. Section 6presents some Monte Carlo simulations showing that, if ignorability holds, the performance ofsample matching from a large panel is close to that of simple random sampling. Section 7 providesan application of sample matching, as it was employed in the 2006 Cooperative CongressionalElection Study (CCES).
2. NOTATION AND DEFINITIONS
2.1. Notation. We are concerned with the estimation of characteristics of a large populationwhose units shall be indexed by i. For simplicity, assume that the population size is infinite orthat we are sampling with replacement so that finite population corrections can be ignored. Weshall adopt the model-based or prediction approach where the observations are generated by anunknown probability distribution P .
Let Yi denote the measurement of interest on the ith unit. A survey will be conducted to collectthese measurements. Let Xi denote a set of covariates. We shall assume that measurements onthe covariates are available for either the entire population or a probability sample (with knownselection probabilities) from that population or, in some cases, just the marginal distribution of Xi
in the population. For example, Xi could include party registration and vote history (e.g., whetherperson i voted in the previous election) and demographics (e.g., age, gender and race) from a voterregistration list. We might conduct a survey to measure vote intention in the coming election (e.g.,intend to vote for Bush or Kerry or not vote).
The data are collected from members of a pre-recruited panel. Let Zi be an indicator of whetherperson i belongs to the panel or not. The selected sample is drawn from the set of panel members.To avoid unnecessary detail, all selected panelists are assumed to complete the survey so the within-panel response rate is 100 percent. In fact, within-panel response rates vary from very low (a fewpercent) to quite high (panels that are frequently purged of non-cooperators can have responserates in excess of 70 percent). However, a non-response model is formally identical to a panelmembership model, so these complications could be dealt with by redefining Zi to be an indicatorof responding to the survey, rather than belonging to the panel, with no loss of generality.
To simplify the notation, we will let X1, . . . , XN denote the values of the covariates for the Nmembers of the panel. Similarly Y1, . . . , YN will denote the corresponding values of the measure-ments for the panel members. Let P denote the distribution of the panel, i.e.
P{X ∈ A, Y ∈ B|Z = 1} =P{X ∈ A, Y ∈ B,Z = 1}
P{Z = 1}
for any Borel sets A and B. To avoid trivialities, assume that 0 < P (Z = 1) < 1, so that P isuniquely defined.

4 DOUGLAS RIVERS STANFORD UNIVERSITY AND POLIMETRIX, INC.
In general, because of either non-response or self-selection, the two distributions P and P willdiffer. The parameters of the panel distribution P are generally not the ones we are interested in.However, we do not sample from P , but from the panel, which is governed by the conditionaldistribution P .
We will make minimal assumptions about the population data generating process. As is conven-tional in model-based inferences, the observations are assumed to be independent and identicallydistributed. This can generally be justified by an appeal to de Finetti’s Theorem.
Assumption 1 (IID Data Generating Process). The observations (Xi, Yi, Zi) are independentlyand identically distributed with unknown probability measure P .
The parameter of interest for most purposes will be the mean of Y ,
θ0 = EY =
∫Y dP =
∫yfY (y) dy
where fy is the density of Y .2
2.2. Selection Mechanisms. Two alternative assumptions are often made about the panel selec-tion method. In conventional longitudinal panels (selected using area probability sampling) orRDD panels it is assumed that the selection process is “representative,” so that Z is independentof both X and Y . This corresponds to missing completely at random (MCAR) in Little and Rubin(2002, p. 11).
Assumption 2 (Random Selection). Z is independent of (X, Y ).
This is an extremely strong assumption. A weaker assumption is that the panel selection mecha-nism is conditionally independent of the measurements Y given the covariatesX . This correspondsto missing at random (MAR) or ignorable non-response.3
Assumption 3 (Ignorable Selection). Z is independent of Y given X .
The plausibility of the ignorability assumption depends, of course, on what variables are in-cluded among the covariates.
We restate these conditions in terms of the density functions for X and Y in the populationand the panel. In the population, the joint density of X and Y will be denoted by fXY and thecorresponding joint density in the panel by fXY , so
P (X ∈ A, Y ∈ B) =
∫A
∫B
fXY (x, y) dy dx
P (X ∈ A, Y ∈ B) = P (X ∈ A, Y ∈ B|Z = 1) =
∫A
∫B
fXY (x, y) dy dx
2Y may be either continuous (in which case dy is Lebesgue measure) or discrete (in which case dy is countingmeasure) or some mixture. The densities are not uniquely defined, but two versions will be equal to one anotherexcept for a set of measure zero. I have tried to eliminate discussion of measure theoretic issues from the text.
3“Ignorable” non-response is an unfortunate choice of terminology, since it certainly can’t be ignored by the analyst.But the terminology seems to have stuck.

SAMPLING FOR WEB SURVEYS 5
The marginal distribution of X is obtained by integrating out Y ,
fX(x) =
∫fXY (x, y) dy
fX(x) =
∫fXY (x, y) dy
and similarly for the the marginal distribution of Y in each case. The conditional density of Ygiven X is given by
fY |X(y|x) = fXY (x, y)/fX(x)
fY |X(y|x) = fXY (x, y)/fX(x)
The random selection assumption is that
fXY (x, y) = fXY (x, y)
for almost all x and y. The ignorable selection assumption is that
fY |X(y|x) = fY |X(y|x)for almost all x and y.
2.3. The Propensity Score. Rosenbaum and Rubin (1983) define the propensity score to be
e(X) = P{Z = 1|X}.Under ignorable selection, Z is independent of X and the propensity score is constant.
The critical property of the propensity score is that it may be used to balance a sample for a largenumber of covariates. Both post-stratification and matching run into problems when the number ofcovariates is large. With post-stratification, small (or, worse yet, empty) cells lead to estimates withlarge variance. As discussed later, there is a “curse of dimensionality” problem when matching ona large number of characteristics. Thus, it is useful to have a one-dimensional measure that can beused for either post-stratification or matching.
The following elementary result from Rosenbaum and Rubin (1983, Theorem 1) shows thatthe propensity score incorporates all information necessary to balance a sample. Rosenbaum andRubin prove the result for discrete X , but it is easy to extend to arbitrary X , though, as shownbelow, the result only holds with probability one.
Theorem 1. X and Z are conditionally independent given e(X).
Proof. By the argument in Dawid (1979), X and Z are conditionally independent given e(X) ifand only if
P{Z = 1|X, e(X)} = P{Z = 1|e(X)} a.s.First, note that since Z is Bernoulli and e(X) is a (measurable) function of X ,
P{Z = 1|X, e(X)} = E[Z|X, e(X)] = E(Z|X) = e(X) a.s.
Second, by iterated expectations,
P{Z = 1|e(X)} = E[Z|e(X)] = E[E(Z|X)|e(X)]
= E[e(X)|e(X)] = e(X) a.s.
Combing these two results proves the theorem. �

6 DOUGLAS RIVERS STANFORD UNIVERSITY AND POLIMETRIX, INC.
In practice, the propensity score must be estimated. If the distribution of X in both the paneland non-panel populations belong to a common exponential family (possibly with different param-eters), then the propensity score can be estimated by a logit model.
Theorem 2. Suppose that the distribution of X conditional on Z belongs to an exponential familywith canonical sufficient statistic t(X), i.e.,
fX(x|Z = z) = exp{βTz t(x)− αz − ψ(x)} (z = 0, 1).
Then
log
(e(x)
1− e(x)
)= α + βT t(X),
where
α = log
(P{Z = 1}P{Z = 0}
)+ α0 − α1
β = β1 − β0.
Proof. By Bayes’ Theorem,
e(x) = P{Z = 1|X = x} =P{Z = 1}fX(x|Z = 1)
fX(x).
Similarly,
1− e(x) = P{Z = 0|X = x} =P{Z = 0}fX(x|Z = 0)
fX(x).
Taking logs and subsituting for the densities proves the result. �
When the panel is small, there is little difference between the population density fX(x) and thenon-panel density fX(x|Z = 0), so, aside from the intercept, the propensity score can be estimatedby pooling the panel with a sample from the population and estimating a logistic regression formembership in the population sample. The quantity estimated is not the propensity score (since theintercept is wrong), but the panel can be weighted by subclassification on the propensity score. Themethod has been used by Harris Interactive for weighting samples from its Web panels. Recently,semi-parametric alternatives have been developed which do not require parametric assumptionsabout the distribution of X .
3. RDD RECRUITMENT OF A WEB PANEL AND NON-RESPONSE
3.1. Practical Issues. There are fundamentally two problems with sampling for Web surveys:lack of coverage for persons without Internet access and non-random selection. The undercover-age problem, while not insignificant, is much less serious today, with roughly 70 percent Internetpenetration, than in 1998 when fewer than a quarter of U.S. households had Internet access. Even-tually the undercoverage problem is likely to disappear, much as it did for telephones in the 1950’sand 1960’s. However, nonrandom selection continues to be a problem as there is no ready analogof either area probability sampling or random digit dialing for Internet users.
One approach is to use conventional sampling techniques, such as RDD, to recruit panelists.If the target population consists only of Internet users (as, for example, it does for Web mea-surement), then one just excludes anyone selected without Internet access. Nielsen//NetRatings
SAMPLING FOR WEB SURVEYS 7
recruited its original panel using this technique. Alternatively, one can supply selected householdswith hardware to connect them to the Internet, as was done by Knowledge Networks (then calledInterSurvey) starting in 1999 (using Microsoft’s WebTV product, later renamed MSN TV). A sim-ilar panel was subsequently recruited in Germany and the NSF is currently funding two devicepanels in the U.S. (one using RDD, the other area probability sampling). Gallup has also recruitedan Internet-only panel from, I believe, persons who have participated in their phone surveys.
The use of conventional sampling methods is simple and relatively uncontroversial. However,there are a number of practical difficulties:
• It’s expensive. It’s difficult to recruit respondents to join a panel and the cost of hardwareand ongoing maintenance is high.• Response rates for non-Internet users are quite low. The primary reason that persons in the
U.S. do not have Internet access today is that they don’t want it, not that it is too expensiveor unavailable.• Compliance is poor. About a third of the households that were provided with hardware did
not install it. Few were interested in receiving help from professional installers.• Attrition is high. Although few respondents explicitly unsubscribe, many stop responding
to survey invitations. The effective attrition rate for commercial panels appears to be aboutfour percent per month.• Even active panelists do not respond to all surveys. The within-panel response rate is
largely dependent on how aggressively inactive panelists are removed from the panel, buteven the best managed panels rarely achieve response rates above 70 percent for singlesurveys.
Some of these problems (such as Internet access) have diminished and others are not as severe asthey might first appear (attrition is low among some groups that are difficult to recruit, such as theelderly), so that the performance of this type of panel has generally been good. The KnowledgeNetworks panel, for example, appears to give quite similar results to a good quality RDD sample.However, both the KN and conventional RDD telephone samples require substantial amounts ofweighting.
The actual response rate, correctly calculated, for this type of panel is quite low. There are manystages at which nonresponse can occur. First, it is impractical to enroll some households. Forexample, flat rate Internet access is not available in some rural areas. Households with no Englishspeakers require a non-English operating system and instructions. If the recruitment is done byphone, anyone outside of the RDD sampling frame (such as cellphone-only households) is lost.Together, these factors eliminate over ten percent of the target population. Second, even with a longfield period (to reduce non-contact), recruitment response rates are in the range of about 30 percent.This, it should be noted, is a household response rate. Not everyone in the household agreesto participate (and cooperation is very low except for the person who completes the recruitmentinterview). A good rate of participation within a household would be 75 percent. Once a personis enrolled in the panel, one faces the challenge of getting their hardware installed (if hardware issupplied to them) or to respond to an email invitation (if they already have email access). Roughlya third of new recruits never complete a survey beyond the recruitment interview. Of those whodo complete a survey, one can count on about four percent a month becoming inactive. Finally,among active panelists, a good response rate for a single survey is about 70 percent. Overall, this

8 DOUGLAS RIVERS STANFORD UNIVERSITY AND POLIMETRIX, INC.
implies a cumulative response rate around 11 percent for a new panelist and falling to about halfthat level after a year.
3.2. Equivalence of Non-response and Self-selection. There is no important difference betweennon-response and self-selection: in both cases, the data are generated by an unknown distributionwhich may be different from the population distribution. In a panel recruited using probabilitysampling, there are actually two distinct components of selection. First, there is the probabilisticselection of respondents by the surveyor using RDD or some other form of random selection.Let Z∗i be an indicator for whether person i was selected at random from the population usingthis mechanism. Once selected, there are still several ways that the respondent may end up beingunavailable, including non-contact, non-cooperation, and attrition from the panel. LetRi denote anindicator of whether the selected respondent participates in the panel, so actual panel participation(as opposed to panel selection, represented by Z∗i ), is given by
Zi = Z∗i Ri.
If simple random sampling is used to select the panel, then P{Zi = 1} is constant and Zi isindependent of Ri. However, the distribution of Ri is unknown and may be dependent upon thecovariates, so the joint distribution of Ri and Xi is unknown. This implies that the conditionaldistribution of Xi given Zi = 1 can be written as fX(x) and is proportional to the unknownconditional density of Xi given Ri = 1.
If the amount of non-response is small, it is possible to put bounds on the size of the bias, assuggested by Cochran, Mosteller and Tukey (1953).4 Unfortunately, as Cochran (1973, p. 362)comments, “The limits are distressingly wide unless [the non-response rate] is very small.” The“sad story,” as Cochran calls it, is that non-response rates higher than about ten percent make itvirtually impossible to “attain a highly guaranteed precision” within conventional sampling theory.This does not imply that inferences from samples with moderate or large amounts of non-responseor self-selection are necessarily wrong, but that such inferences depend upon some modeling as-sumptions that may be difficult or impossible to check.
4. QUOTA SAMPLING IN WEB PANELS
4.1. Practical Issues. At the other extreme are pure opt-in panels and “river samples.” For opt-inpanels, banner ads, email lists, co-registration sites, and other methods are used to recruit panelists.For river samples, a large Web site (such as AOL) funnels persons with known characteristics whoare surfing the Web to take the survey. No one pretends that this yields a random sample of thepopulation, but samples can be selected using quotas to match the population distribution of somevariables. Quotas for age, race, and gender are common.
Quota sampling has a poor reputation among those schooled in sampling theory. However, quotasampling on the Internet is rather different from that used for in-person interviewing (where theinterviewer is given discretion on whom to select so long as the requisite number of interviews is
4I first learned of this result from Chuck Manski when we were Fellows at the Center for Advanced Study inthe Behavioral Sciences during 1992-93. During that year I was involved in a consulting project involving somesampling and, by chance, found (from a reference in Cochran’s textbook on sampling) that this simple bound had beendiscovered much earlier, though neither of us were aware of it. It is also not cited in texts on survey methodology (e.g.,Groves et al., 2004) and appears unknown to most practitioners.

SAMPLING FOR WEB SURVEYS 9
obtained in each quota cell). Quota sampling on the Internet generally amounts to drawing randomsamples from the panelists in each cell. This is equivalent to post-stratifying on the quota cells.Under an assumption of ignorability (discussed later), this estimator is a maximum likelihoodestimator and has some desirable properties.
The composition of most Web panels is skewed, though not entirely in the ways one wouldexpect. Panelists tend to be too white, male, and educated (as is the Internet population moregenerally), but also too old. Young people, especially males, do not sign up for Internet panelsvery often. The groups that are hard to reach on the phone are difficult to reach on the Internetand, while the skews are somewhat larger on the Internet, the difference is not huge. A typicalphone sample might be 7 or 8 percent black, compared to 5 or 6 percent in an opt-in Internet panel(versus 11 percent in the population).
There are several drawbacks of the quota sampling approach.
• Filling quotas is difficult if the number of cells is large and “sampling” can degenerate intodesperate attempts to find anyone with the desired characteristics.• There is no guarantee that the persons in each cell are at all typical of the population mem-
bers in the same category. This is the problem of nonignorable selection, but, as discussedlater, it is particularly serious when cells are defined by a small number of variables.• To make it easier to fill quotas, often “parallel” or marginal quotas are employed (so that
only the marginal distributions, rather than the joint distribution, of the quota variables arerequired to match the population distribution). This has both practical problems (the “easy”cells get filled quickly) and theoretical problems (the conditional distributions can be quitefar off).
Despite these difficulties, the performance of quota samples is quite a bit better than their repu-tation. A few appropriately chosen quotas can remove a large amount of bias from self-selectioninto a panel. No weighting is needed, so the analysis is simplified substantially.5 The most seriousobjection, I think, is that it is impossible to rule out hidden biases that will eventually lead to badlymistaken inferences. Routine use of quotas for age, race, and gender will frequently “work,” butnot always and there is no way to tell which situation you are in.
Of course, the same is true of nonresponse corrections for probability samples. Sometimes theywork and sometimes they don’t. What is remarkable is that fairly crude techniques, such as cellweighting and quotas, work as well as they do. In view of the evident unrepresentativeness ofpanels recruited using probability sampling (with low response rates) or haphazardly, I concludedthat the payoff from better modelling of nonresponse and selection mechanisms would be higherthan raising response rates a few points.
4.2. Theoretical Issues. Little serious has been written about quota sampling and most of that isquite critical (e.g., Kish (1965) or King (1983)). It is, however, fairly simple to state some simpleconditions that ensure the theoretical validity (even optimality) of quota sampling. Of course, thefact that such conditions can be stated does not mean that they are applicable or reasonable, but Iwould argue that the theoretical argument against quota sampling is not so strong as is commonlybelieved by most survey methodologists. Smith (1976) pointed out that ignorability is necessaryfor both quota sampling and probability sampling with nonresponse. Jagers (1986) proved some
5Standard errors assuming simple random sampling will be incorrect, but these are easy to fix.

10 DOUGLAS RIVERS STANFORD UNIVERSITY AND POLIMETRIX, INC.
optimality properties for post-stratification that can be applied to quota sampling. Results on max-imum likelihood under non-standard conditions (e.g., Huber, 1965) can be used for standard errorcalculations.
When the covariates are discrete, the “sample” (however obtained) can be divided into a set ofpoststratification cells. Let σ(X) denote the cross-classification of the covariates6 The marginaldistribution of X is assumed to be known, so for each A ∈ σ(X),
P (X ∈ A) =
∫A
fX(x) dx = pA
is given. The corresponding sample frequency,
pA = n−1∑i∈S
1A(Xi)
where S denotes a sample of size n drawn at random from the panel, estimates
P (X ∈ A) =
∫A
fX(x) dx = pA.
The post-stratified estimate of the population mean is
θPS = n−1∑i∈S
wiyi
where
wi =pA
pA
if Xi ∈ A.
It is shown in Jagers (1986) that θPS is the nonparametric maximum likelihood estimator of θ if Yi
is dichotomous and nothing is known about the panel distribution of X .
Regardless of whether ignorability holds or not, it is feasible to calculate standard errors for θPS.Since
limn→∞
pA = pA a.s.
we have
θPS = n−1∑i∈S
w∗i yi + oP (n−1/2)
where w∗i = pA/pA when Xi ∈ A, so ∑i∈S w
2i (yi − θPS)
2
(∑
i∈S wi)2
is a robust standard error for θPS.
6Technically, the sigma field generated by the covariates. If the covariates are each categorical, the elements of Xare simple random variables and σ(X) contains a finite set of members.

SAMPLING FOR WEB SURVEYS 11
5. SAMPLE MATCHING
5.1. Introduction. The existence of a sampling frame that contains extensive data about all in-dividuals can be used to improve survey estimates. Model-assisted survey sampling utilizes theauxilliary information for ratio or regression estimation in the context of probability sampling.This type of data can also be used in a similar way for non-response calibration. (Sarndal andLundstrom, 2005)
Sample matching is a purposive method for creating a sample when a large, but possibly un-representative, pool of respondents is available for interviewing that can be matched to units inthe sampling frame according to some auxiliary variables. The fundamental idea is that one firstselects a target sample from the sampling frame using some form of random sampling. However,instead of interviewing those in the target sample, one finds the closest match in the pool of avail-able respondents to each unit in the target sample. Collectively, the matched units are called thematched sample and they will resemble the target random sample in terms of the variables usedfor matching. The matching need not be exact—matching is usually performed using a distancefunction that measures the similarity between a pair of respondents—but if the pool of availablerespondents is sufficiently large and diverse, the matched sample is guaranteed to have approxi-mately the same joint distribution of the matching variables as the target sample.
The idea of sample matching is familiar from observational studies where randomization is toocostly or impossible. Instead of randomizing treatments, one creates a “control group” by selectingobservations out of a reservoir7 of untreated cases. The observations are selected to match those inthe treatment group as closely as possible. The reservoir is not intended to be representative of thepopulation. So long as selection is ignorable, it is more important that it be sufficiently large anddiverse to find good matches.
The use of matching in survey sampling is somewhat different than in observational studies. If arandom sample is available from the population of interest, a matched sample is created in the sameway a control group is for an observational study. The measurements of interest are then collectedfor the matched sample. The purpose is not to estimate differences between the two groups (sincethe measurements of interest are not available for the random sample from the population), but toestimate the population characteristics using the matched sample alone.
The panel acts as the reservoir from which the cases are drawn. However, unlike in observationalstudies where data on the entire reservoir has already been collected, the selected panel membersmust be surveyed and not all will respond. Consequently, the usual method of computing propen-sity scores (as described in Section 2.3) is ineffective, since these cannot be calculated until it isknown who will respond.
There are also some precursors in the sampling literature. Hot deck imputation is a form ofmatching within a single survey used for item nonresponse. Substitution, where unavailable re-spondents are replaced by persons with similar characteristics, is another type of matching thatshould be employed more frequently. (Any survey with nonresponse implicitly uses substitution.If no adjustment is made, available respondents have been substituted for unavailable respondents.If the sample is post-stratified, then responding panelists in the post-stratificaiton cells have beensubstituted for non-responding ones.)
7This terminology is due to Cochran (1977), a delightful little volume that is full of sage advice.
12 DOUGLAS RIVERS STANFORD UNIVERSITY AND POLIMETRIX, INC.
Quota sampling can also be considered a form of matching, where respondents are matchedexactly on whatever characteristics define the quota cells. However, considering quota samplingfrom this perspective clearly identifies its primary limitations. For exact matching to be feasible,the cells must be defined fairly crudely (or else one will encounter empty cells). As a consequence,it is only possible to match on a limited number of characteristics. Approximate matching on alarger set of characteristics is much more effective in bias reduction.
What is not generally appreciated is that the development of large scale consumer and voterdatabases vastly improve our ability to do effective matching. The combination of voter filesand consumer databases provide detailed information about nearly the entire population and areparticularly relevant for political polling. Almost all registration records contain a name, physicaladdress, birth date, gender, and vote history (turnout in recent elections). In about half the states,persons register with a party or choose a party primary to vote in, which is highly predictive of howthey are likely to vote. In a few states covered by Section V of the Voting Rights Act, the registrant’srace is recorded. From the address, information can be obtained about the registrant’s Censusblock and tract, including the average income, education, and racial composition of the registrant’sneighborhood. From consumer databases, it is possible to obtain additional information, such asthe value of the registrant’s home, types of magazines the household subscribes to, and other typesof information of interest to marketers (but also increasingly of relevance to political campaignsfor “micro-targeting”).
At Polimetrix, we have developed a method (known internally as “turbo sampling”) which dy-namically matches responding panelists to a set of “target samples.” A target sample is createdfor each study and, based upon the set of outstanding invitations and their expected probability ofresponding before the end of the field period, invitations are added to the pool of outstanding invi-tations. When a respondent actually clicks on a link in an email invitation, they are then matchedto the most similar unit in the set of open target samples. This reduces the number of invitationsthat must be sent and permits tighter matching.
I will show that under suitable conditions, the matched sample can be used as if it were a randomsample. That is, the observations in the matched sample are nearly independent and have nearlythe same distribution as a random sample from the target population. However, the needed panelsize grows rapidly as the number of characteristics used for matching increases.
5.2. Regularity Conditions for Sample Matching. Asymptotic results for matching estimatorshave been obtained by Abadie and Imbens (2006). Their paper is fairly technical and the setup is forestimating treatment differences using multiple matches in the control group. Some simplificationsoccur in the survey matching application and the ideas emerge clearly (and the proofs are greatlysimplified) for one dimensional matching. The Abadie and Imbens results for higher dimensionalmatching are intuitively clear and rely upon the device of transforming to spherical coordinatesthat are unnecessary in the one dimensional situation.
We have available a panel of size N drawn from the population using an unknown selectionmechanism. Let P denote the probability law governing the panel. Any discrete covariates will,with a sufficiently large panel, eventually be matched exactly or can be stratified upon. To simplify,we assume that all the covariates have a continuous distribution with bounded support.
Assumption 4 (Continuous Covariates with Overlap). The distribution of X in both the panel andthe population is absolutely continuous with respect to Lebesgue measure with compact and convexsupport SX ⊂ Rk, i.e., P (SX) = P (SX) = 1.

SAMPLING FOR WEB SURVEYS 13
This assumption of common support is the “overlap” condition in observational studies. It isnecessary for the panel to cover all relevant portions of the population. This condition would failif one of the covariates used for matching was, for example, Internet access and the populationincluded people without Internet access. However, Internet access isn’t necessarily one of thecovariates in the ignorability condition and is only a problem if Internet access is correlated with theresponse variable after controlling for the covariatesX . The continuity condition is also convenientbecause it means that the closest match is unique with probability one.
The next condition ensures that with a sufficiently large panel, we will always be able to find aclose match.
Assumption 5 (Bounded Densities). There exists δ > 0 such that
infx∈S(X)
fX(x) ≥ δ and infx∈S(X)
fX(x) ≥ δ
Next, we need some continuity assumptions on the densities and conditional expectations.
Assumption 6 (Smoothness). There exist versions of the density fX and the conditional expecta-tion µ(x) = E(Y |X = x) is almost surely Lipschitz continuous on SX .
The condition on the density is technical and can be eliminated. Since SX is compact, theconditional expectation will be uniformly continuous. However, we need a stronger smoothnesscondition to ensure that close matches on the covariates have, on average, about the same value ofthe measurement Y . Lipschitz continuity implies the existence of a Lipschitz constant c <∞ suchthat
|µ(x)− µ(z)| ≤ c|x− z|where | · | is a norm on Rk. This means that if the covariates are matched closely, the expectedvalue of the response variable will also be close.
In most cases, the measurements Y will be discrete, so boundedness is not an issue, but we shallassume that the conditional variance of Y is uniformly bounded.
Assumption 7 (Bounded Variance). There exists c <∞ such that V (Y |X) ≤ c a.s.
This condition is needed for central limit theorems.
5.3. Estimation Using Matched Sampling. With conventional probability sampling, we mightdraw a simple random sample of size n, Y1, . . . , Yn, and estimate θ0 using
θ = n−1
n∑i=1
Yi.
This estimate has an asymptotic normal distribution,
n1/2(θ − θ0) =⇒ N(0, σ2)
where =⇒ indicates weak convergence and
σ20 = V (Y ) = E(Y − θ0)
2.
However, if true probability sampling is infeasible or too costly, but it is easy to draw a sampleof the matching variables X , an attractive alternative is matched sampling. Let X1, . . . , Xn denote

14 DOUGLAS RIVERS STANFORD UNIVERSITY AND POLIMETRIX, INC.
the target sample, a simple random sample from the population P . For each element of the targetsample, we find the closest matching element of the panel. If Xi = x, the closest matchingobservation in the panel will be denoted by
M(x) = j iff |Xj − x| ≤ |X` − x| for ` = 1, . . . , N
LetX∗i = XM(Xi)
denote the closest match to Xi in the panel. Since the distribution of X is continuous, the closestmatch is unique with probability one and we may ignore ties. Similarly,
Y ∗i = YM(Xi)
is the corresponding value of the measurement on the matched observation from the panel. Y ∗i(unlike Yi) is observable.
We define the matching estimator θ to be the mean of the matched sample,
θ = n−1
n∑i=1
Y ∗i .
We can observe how closely X∗i matches Xi. One would hope, if the matching is tight, that thedistribution of Y ∗i would be close to that of Yi. We do not necessarily expect Yi and Y ∗i to be highlycorrelated, since the conditional variance of Y given X may be large, but the distributions shouldbe similar.
5.4. Theoretical Results for Scalar Matching Variable. For expository purposes, we derivesome simple results when X is scalar. This case is of some importance (as, for example, whenX is the propensity score for selection into the panel) and is simpler than the case of vector Xwhich will be treated subsequently. Then we study the bias and variance of the matched estimator.
First, we derive the conditional distribution of X∗i given Xi = x.
Theorem 3. Under Assumptions 1 and 4, the conditional density of X∗i given Xi = x is
f ∗X(x) = NfX(x)[1− FX(x+ |x− x|) + FX(x− |x− x|)]N−1
where FX is the distribution function of X in the panel, i.e.
FX(x) = P{X ≤ x} =
∫ x
−∞fX(u) du.
Proof. The density of X∗i conditional upon Xi = x is the same as the conditional distribution ofXj given M(x) = j. By symmetry,
P{M(x) = j} = 1/N.
The marginal density of Xj is fX(x) and the conditional probability that M(x) = j given Xj = xis
P{M(x) = j|Xj = x} = P{|X` − x| > |x− x| for j 6= `}= P{|X − x| > |x− x|}N−1,

SAMPLING FOR WEB SURVEYS 15
using the fact that the X’s are i.i.d. in the population and, hence, also in the panel. Combining theseresults and applying Bayes’ Theorem shows that the conditional density of Xj given M(x) = j is
fX(x)P{M(x) = j|Xj = x}P{M(x) = j}
= NfX(x)[1− FX(x+ |x− x|) + FX(x− |x− x|)]N−1
since
P{|X − x| > |x− x|‖} = P{X > x+ |x− x|}+ P{X < x− |x− x|}= 1− FX(x+ |x− x|) + FX(x− |x− x|).
�
The last term in the density tends to zero at an exponential rate. This means that the distributionof the matched value is collapsing on the value it is matched too as the panel size N gets large.In fact, the distribution of the matched value is approximately a Laplace (two-sided exponential)distribution with variance proportional to the reciprocal of the N times panel density at the targetvalue. If the panel is large or the target value is one that is a point of high density in the panel, thenwe will tend to get a close match. This is made precise by the following result.
Theorem 4. Under Assumptions 1, 4, and 5, conditional upon Xi, the limiting distribution of
UNi = N (X∗i −Xi)
is Laplace with mean zero and variance 1/2fX(Xi)2.
Remark 1. The Lemma shows that the matching discrepancy Xi − Xi is OP (1/N) for scalarmatching. Thus, if the panel is sufficiently large, then the matched value is distributed approxi-mately symmetrically around the value it is matched to, regardless of the distribution of the variablewithin the panel. In particular, the approximate distribution of the matched value Xi conditionalupon Xi = x is Laplace with location parameter x and scale parameter 1/2NfX(x).
Proof. The preceding theorem gave the conditional distribuiton of Xi given Xi. Now consider thetransformation UNi = N(Xi − x) with Jacobian ∂Xi/∂UNi = 1/N so the conditional density ofUNi given M(x) = i is
fUNi|M(x)=i(u) = fX|M(x)=i(x+ u/N)
∣∣∣∣ 1
N
∣∣∣∣ = fX(x+ u/N)P{|X − x| > |u|/N}N−1
SinceP{|X − x| > |u|/N} = 1− FX(x+ |u|/N) + FX(x− |u|/N)
we have
fUNi|M(x)=i =fX|M(x)=i(x+ u/N)
1− F(x+ |u|/N) + FX(x− |u|/N)[1− FX(x+ |u|/N) + FX(x− |u|/N)]N .
It follows that
limN→∞
fUN |M(x)=i(u) = limN→∞
fX|M(x)=i(x+ u/N)
1− F(x+ |u|/N) + FX(x− |u|/N)
× limN→∞
[1− FX(x+ |u|/N) + FX(x− |u|/N)]N
= fX(x) limN→∞
[1− FX(x+ |u|/N) + FX(x− |u|/N)]N .

16 DOUGLAS RIVERS STANFORD UNIVERSITY AND POLIMETRIX, INC.
To complete the proof, we evaluate the last limit on the right. Let
ϕ(N) = log[1− FX(x+ |u|/N) + FX(x− |u|/N)]N
=log[1− FX(x+ |u|/N) + FX(x− |u|/N)]
1/N.
Since both numerator and denominator converge to zero, by L’Hospital’s rule it is equivalent toevaluate the limit of
fX(x+ |u|/N) + fX(x− |u|/N)
1− FX(x+ |u|/N) + FX(x− |u|/N)
|u|N2
−1/N2= − |u|[fX(x+ |u|/N) + fX(x− |u|/N)]
1− FX(x+ |u|/N) + FX(x− |u|/N)
so
limN→∞
ϕ(N) = − limN→∞
|u|[fX(x+ |u|/N) + fX(x− |u|/N)]
1− FX(x+ |u|/N) + FX(x− |u|/N)= −2|u|fX(x).
This proves the result. �
With these results, we can now derive the limiting distribution of the matched estimator θ and aconsistent estimator for its standard error. For the case of scalar matching, this is the same as if wetreat the matched sample X∗1 , . . . , X
∗n as a simple random sample from the population.
Theorem 5. Under Assumptions 1 and 3–7, if n→∞, N →∞, and n/N → 0, then
n1/2(θ − θ0) =⇒ N(0, σ20).
Further, a consistent estimator of σ20 is
σ2 = n−1∑i∈S
(Y ∗i − θ)2.
Proof. To be added. �
5.5. Vector Matching. The results for vector matching are, from a theoretical standpoint, muchless satisfying. Summary of results:
• Distribution of Xi∗ conditional on Xi is the same as in Theorem 3, except that cdfs arereplaced by quadrant probabilities.• Limiting distribution ofN1/k(X∗i −x) conditional uponXi = x is proportional to a rv with
density fX(x) exp{−ckN |Xi − x|fX(x)} where ck = O(1/k).• Limiting distribution is radially symmetrix around x.• However, bias tends to zero at rate nk/2/N and variance has an extra term.• Curse of dimensionality: panel needs to grow at the rate nk.

SAMPLING FOR WEB SURVEYS 17
6. SIMULATION RESULTS
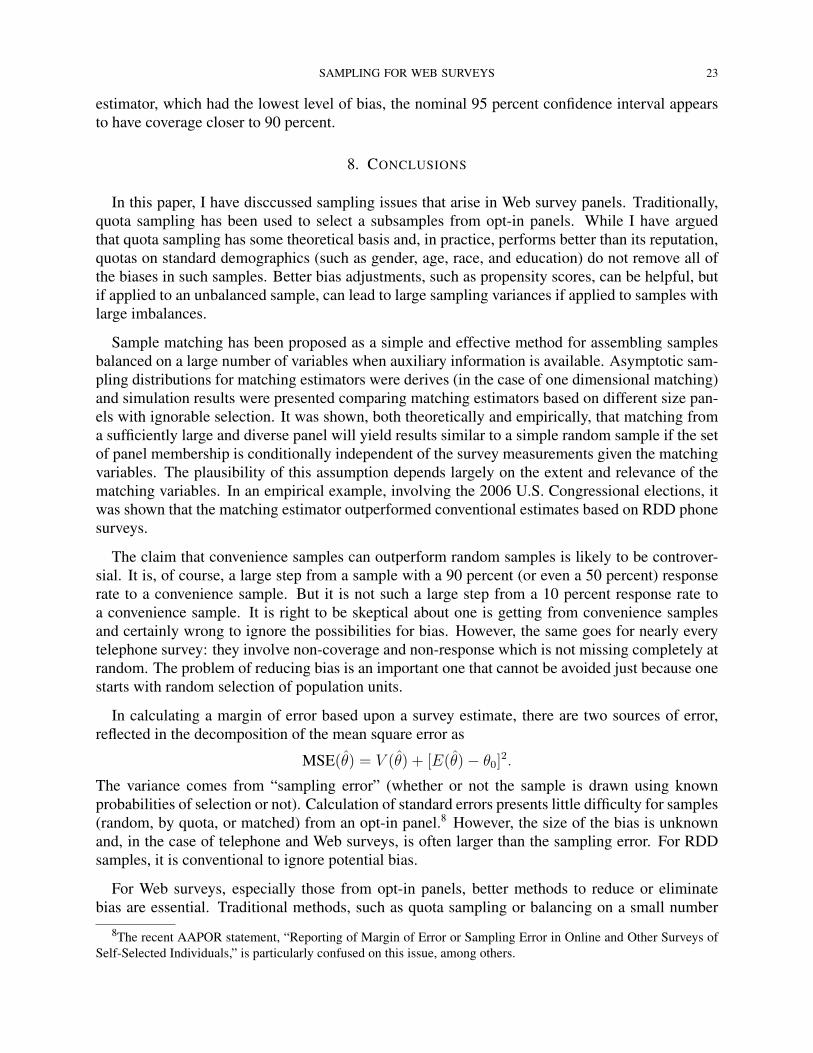
The theoretical results in the previous section are asymptotic and may be misleading with thesample and panel sizes that occur in practice. In this section, I describe a set of Monte Carlo simu-lations which, although limited to some specific cases, provide some guidance about the likely per-formance of sample matching. The simulations involve very different distributions of the matchingvariables, both in terms of their location and covariance structure, between the panel and the targetpopulation, though panel membership is ignorable conditional upon the matching variables for themeasurement of interest. For this example, I show that the conventionally reported standard errorsare quite accurate for all estimators. A simple random sample from the panel exhibits substantialbias, though about 80 percent of the bias can be removed by post-stratification using a small num-ber of cells. Sample matching, in contrast, is nearly unbiased if the panel is five times the size ofthe target sample and yields a sampling distribution almost identical to that obtained from simplerandom sampling from the population. Post-stratification of the matched sample is useful whenthe panel size is small and can be helpful in removing the bias due to imperfect matching.
The simulations are based upon draws of the covariates from a bivariate normal distributiontruncated on the rectangle [−1, 1]×[−1, 1]. The support of the covariates overlaps entirely betweenthe population and the panel, but the locations and covariance structure of the distributions werechosen to be quite different. The population mean (before truncation) is located at the origin, witheach covariate having unit variance, and correlation −0.6. In the panel, by contrast, the mean(before truncation) is 0.8 for the first covariate (X1) and 0.7 for the second covariate (X2), withstandard deviations 0.4 and 0.35, respectively, and covariance 0.3. Thus, the covariates have quitedifferent distributions between the panel and the population and a random sample from the panelwill give quite different results than a random sample from the population.
Panel membership is ignorable with respect to the measurements which have a conditional nor-mal distribution with mean X1 +X2/2 and variance one in both the panel and the population. Thisis the essential link needed to make accurate inferences possible.
In the simulations, the target sample is always a simple random sample of size n = 1000 fromthe population. Since EX1 = EX2 = 0, θ0 = EY = 0 is the true value of the parameter. ASRS from the population gives an unbiased estimate of θ0. We consider draws from panels of sizeN = 1, 500, 2, 000, 3, 000, 5, 000 and 10, 000, representing between 1.5x and 10x coverage of the, respectively. We conducted 1000 Monte Carol repetitions. The results are reported in Table 1below.
A SRS of size 1, 000 from the population is unbiased with a standard error of approximately0.37. Post-stratification has no effect on the mean, but the standard error is reduced slightly (to0.341). The post-stratification was performed using a four-cell scheme, with each covariate split atits mean (zero).
As was expected, a SRS from the panel is severely biased. The standard errors of the twosamples are about the same (0.366 and 0.364, respectively), the difference in the means is approx-imately fifteen times the standard error. Post-stratification using cell weights eliminates about 80percent of the bias, but increases the standard error by about 50 percent. Poststratifying based uponpropensity score quintiles removes 90 percent of the bias and is somewhat more efficient than cellweighting (though the standard errors is still about one third larger than a simple random sample).

18 DOUGLAS RIVERS STANFORD UNIVERSITY AND POLIMETRIX, INC.
FIGURE 1. Simulated Bias of Estimators
Ratio of reservoir size to sample size
Bia
s
1.5 2 3 5 10
0.0
0.1
0.2
0.3
SRS from targetMatched sampleCell−weighted matched samplePropensity score weighted matched sample
FIGURE 2. Simulated RMSE of Estimators
Ratio of reservoir size to sample size
RM
SE
1.5 2 3 5 10
0.0
0.1
0.2
0.3
SRS from targetMatched sampleCell−weighted matched samplePropensity score weighted matched sample

SAMPLING FOR WEB SURVEYS 19
TABLE 1. Simulations of Sampling Distributions from Matched and Unmatched Samples
Mean SD RMSESRS from Population
Unweighted -0.0007 0.0366 0.0366Post-stratified (cell weights) -0.0003 0.0341 0.0341
SRS from PanelUnweighted 0.5511 0.0364 0.5523Post-stratified (cell weights) 0.1114 0.0530 0.1233Post-stratified (propensity scores) 0.0470 0.0478 0.0670
Matched SampleUnweightedN = 1, 500 0.2815 0.0354 0.2837N = 2, 000 0.1555 0.0354 0.1594N = 3, 000 0.0644 0.0333 0.0725N = 5, 000 0.0427 0.0347 0.0550N = 10, 000 0.0257 0.0358 0.0441
Post-stratified (cell weights)N = 1, 500 0.0609 0.0441 0.0752N = 2, 000 0.0466 0.0375 0.0599N = 3, 000 0.0564 0.0333 0.0655N = 5, 000 0.0520 0.0325 0.0614N = 10, 000 0.0366 0.0332 0.0494
Post-stratified (propensity scores)N = 1, 500 0.0016 0.0403 0.0403N = 2, 000 -0.0020 0.0376 0.0377N = 3, 000 -0.0056 0.0372 0.0376N = 5, 000 -0.0031 0.0376 0.0377N = 10, 000 -0.0033 0.0376 0.0378
In terms of RMSE, cell-weighting is about four times worse than taking a SRS from the populationand propensity score weighting gives a margin of error roughly twice as large.
The performance of matching depends upon the size of the reservoir or panel. Simple closestneighbor matching with a panel ten times the desired sample size eliminates 95 percent of the biaswith no increase in the standard error. As shown in Figure 1 below, there is a sharp reduction inbias as the panel size increases from 1.5 times the sample size to three times the sample size andthen the decrease in bias is roughly linear in the log of the ratio of the panel size to the sample size.Because the matched sample requires smaller weights than a random sample from the population,cell-weighting does increase the standard error much (at least if the panel is at least twice as largeas the sample). Post-stratifying on propensity scores is more effective and gives both standarderrors and a margin of error indistinguishable from SRS from the population (unless the panel isvery small).
In summary, the simulations show that for the range of parameters considered and under anassumption of ignorability, sample matching gives results similar to taking a simple random samplefrom the population and much better than either cell-weighting or weighting by propensity scorequintiles.

20 DOUGLAS RIVERS STANFORD UNIVERSITY AND POLIMETRIX, INC.
TABLE 2. CCES Senate Election Preditions
State N Predicted Vote Actual Vote
Arizona 798 47.9% 45.3%California 1,015 67.8% 63.1%Connecticut 401 47.8% 44.4%Florida 1,005 63.8% 61.3%Massachusetts 799 71.3% 69.5%Maryland 802 53.1% 55.5%Michigan 800 57.9% 58.0%Minnesota 501 59.4% 60.5%Missouri 802 50.0% 51.1%New Jersey 500 53.0% 52.8%Nevada 402 44.2% 42.5%New York 1,011 72.9% 68.0%Ohio 1,003 59.2% 55.9%Pennsylvania 1,005 58.3% 58.6%Tennessee 502 47.4% 48.6%Texas 1,004 30.9% 36.9%Utah 402 34.0% 33.0%Virginia 802 50.0% 50.1%Washington 804 57.0% 59.7%Wisconsin 502 74.2% 69.5%West Virginia 301 67.0% 65.7%
7. EMPIRICAL EXAMPLE: 2006 COOPERATIVE CONGRESSIONAL ELECTION STUDY
During the 2006 election, Polimetrix conducted the Cooperative Congressional Election Study(CCES) for a consortium of research universities. Results from the pre-election wave of CCESwere released on November 6, 2006, based upon interviews conducted between October 27 andNovember 5, 2006.
Tables 2 and 3 present the percentage of likely voters in each state (with a sample of at least 300likely voters) intending to vote Democratic for either Senator or Governor, along with the actualvote outcome (undecideds and minor party voters deleted, except in Connecticut). The sampleswere constructed by matching on demographics and party, and then post-stratified on demograph-ics. Confidence intervals were computed assuming ignorable selection and the approximationgiven in Section 5 and are shown in the accompanying figures.
As can be seen from the tables and figures, the estimates appear to be approximately unbiased.However, the coverage of the 95 percent confidence intervals is somewhat below the nominal level.
In comparison, Blumenthal and Franklin (2007) compared the CCES estimates with the resultsof conventional RDD telephone surveys (with live interviewers) and IVR interviews. The resultsare shown in Table 4 below. In this election, sample matching out-performed RDD samples (pre-sumably using conventional weighting by either cells or raking), whether a live interviewer wasused or IVR. Another Web survey (Zogby Interactive) using a different methodology was sub-stantially worse than either the RDD samples or the matched Web sample. The sample sizes in

SAMPLING FOR WEB SURVEYS 21
FIGURE 3. CCES Senate Estimates and 95% Confidence Intervals
FIGURE 4. CCES Governor Estimates and 95% Confidence Intervals
●
●
●
●
●
●
●
●
● ●
●
●
●
●
●
●
●
●
●
●
●
●
●
20 30 40 50 60 70 80
2030
4050
6070
80
Vote Percentage
Pol
l Per
cent
age

22 DOUGLAS RIVERS STANFORD UNIVERSITY AND POLIMETRIX, INC.
TABLE 3. CCES Gubernatorial Election Preditions
State N Predicted Vote Actual Vote
Alabama 505 42.0% 42.0%Arizona 798 58.2% 64.0%California 1015 44.7% 41.2%Colorado 500 60.0% 58.0%Connecticut 401 33.3% 35.9%Florida 1005 43.8% 46.4%Georgia 804 41.6% 39.9%Iowa 301 54.0% 54.8%Illinois 800 61.0% 55.6%Kansas 501 61.0% 58.8%Massachusetts 799 65.6% 61.2%Maryland 802 51.0% 53.8%Michigan 800 56.1% 57.1%Minnesota 501 52.1% 49.5%Nevada 402 46.3% 47.8%New York 1011 74.2% 70.3%Ohio 1003 63.9% 62.1%Oregon 502 54.0% 54.2%Pennsylvania 1005 62.2% 60.3%South Carolina 399 44.0% 44.8%Tennessee 502 67.0% 69.8%Texas 1004 39.4% 43.3%Wisconsin 502 55.2% 53.8%
TABLE 4. Comparison of RDD and Matched Samples
Source n Bias RMSEPhone 255 2.76 8.34Rasmussen (IVR) 83 3.82 8.47SurveyUSA (IVR) 63 3.4 7.25Zogby (Internet) 72 4.86 9.36Polimetrix (Internet) 40 -0.47 5.21
the phone samples tended to be somewhat larger (typically between 600 and 1, 000 interviews perstate), so their standard errors before weighting would be smaller than the matched sample fromPolimetrix. It is unclear whether the standard errors are larger or smaller after weighting. However,all of the other surveys have substantial amounts of bias compared to the matched sample.
What is perhaps most striking from Tables 2 and 3 is that the actual RMSEs are for most ofthe samples are roughly three to four times the reported sampling error. This is because all of themethods are subject to some bias which is not taken into account in the calculation of a margin oferror. The reported standard errors appear to give an accurate measure of sampling variability, butignoring bias means that reported confidence intervals are much too narrow. Even for the matched
SAMPLING FOR WEB SURVEYS 23
estimator, which had the lowest level of bias, the nominal 95 percent confidence interval appearsto have coverage closer to 90 percent.
8. CONCLUSIONS
In this paper, I have disccussed sampling issues that arise in Web survey panels. Traditionally,quota sampling has been used to select a subsamples from opt-in panels. While I have arguedthat quota sampling has some theoretical basis and, in practice, performs better than its reputation,quotas on standard demographics (such as gender, age, race, and education) do not remove all ofthe biases in such samples. Better bias adjustments, such as propensity scores, can be helpful, butif applied to an unbalanced sample, can lead to large sampling variances if applied to samples withlarge imbalances.
Sample matching has been proposed as a simple and effective method for assembling samplesbalanced on a large number of variables when auxiliary information is available. Asymptotic sam-pling distributions for matching estimators were derives (in the case of one dimensional matching)and simulation results were presented comparing matching estimators based on different size pan-els with ignorable selection. It was shown, both theoretically and empirically, that matching froma sufficiently large and diverse panel will yield results similar to a simple random sample if the setof panel membership is conditionally independent of the survey measurements given the matchingvariables. The plausibility of this assumption depends largely on the extent and relevance of thematching variables. In an empirical example, involving the 2006 U.S. Congressional elections, itwas shown that the matching estimator outperformed conventional estimates based on RDD phonesurveys.
The claim that convenience samples can outperform random samples is likely to be controver-sial. It is, of course, a large step from a sample with a 90 percent (or even a 50 percent) responserate to a convenience sample. But it is not such a large step from a 10 percent response rate toa convenience sample. It is right to be skeptical about one is getting from convenience samplesand certainly wrong to ignore the possibilities for bias. However, the same goes for nearly everytelephone survey: they involve non-coverage and non-response which is not missing completely atrandom. The problem of reducing bias is an important one that cannot be avoided just because onestarts with random selection of population units.
In calculating a margin of error based upon a survey estimate, there are two sources of error,reflected in the decomposition of the mean square error as
MSE(θ) = V (θ) + [E(θ)− θ0]2.
The variance comes from “sampling error” (whether or not the sample is drawn using knownprobabilities of selection or not). Calculation of standard errors presents little difficulty for samples(random, by quota, or matched) from an opt-in panel.8 However, the size of the bias is unknownand, in the case of telephone and Web surveys, is often larger than the sampling error. For RDDsamples, it is conventional to ignore potential bias.
For Web surveys, especially those from opt-in panels, better methods to reduce or eliminatebias are essential. Traditional methods, such as quota sampling or balancing on a small number
8The recent AAPOR statement, “Reporting of Margin of Error or Sampling Error in Online and Other Surveys ofSelf-Selected Individuals,” is particularly confused on this issue, among others.

24 DOUGLAS RIVERS STANFORD UNIVERSITY AND POLIMETRIX, INC.
of demographics, are frequently inadequate. The combination of large scale consumer and voterdatabases with sample matching appears to be much more effective at bias reduction than tradi-tional methods. The advantage of being able to match approximately on a larger set of variablestends to eliminate imbalances beyond a few demographic categories. The plausibility of the ignor-ability assumption is much higher when a larger set of variables has been controlled for.
There are some that argue that non-probability samples are not usable for scientific inference.However, large portions of statistics are devoted to situations where the data generating process isunknown and must be modeled. Every observational study is of this type. If we were to declineto make probability statements about anything but random samples, we could not make weatherforecasts (for example, “the probability of rain tomorrow is 30 percent”). Most medical research,which involve randomization of treatment, but not random selection of participants, would be re-stricted to saying that the estimated treatment effect applies only to the small set of persons whoparticipated in the experiment. In the case of Web surveys, it is unlikely that even in-person re-cruitment will provide a sample without substantial amounts of self-selection. For many purposes,especially in the social sciences and marketing research, opt-in panels represent a cost-effectivealternative when one has some confidence that the matching variables are sufficient to eliminatemost of the potential bias.

SAMPLING FOR WEB SURVEYS 25
REFERENCES
Abadie, Alberto, and Guido W. Imbens, “Large Sample Properties of Matching Estimators forAverage Treatment Effects,” Econometrica, vol. 74 (2006), pp. 235-267.
Blumenthal, Mark, and Charles H. Franklin, “Methods and Horse Races: How Internet, IVRand Phone Polls Performed in the 2006 Elections,” presented at the 2007 Annual Meeting of theAmerican Association for Public Opinion Research, Anaheim, CA (May 18, 2007).
Chapman, Donald W., “The Impct of Substitution on Survey Estimates,” in William G. Madow,Ingram Olkin, and Donald B. Rubin, eds., Incomplete Data in Sample Surveys, vol. 2. New York:Academic Press, 1983.
Cochran, William G., Frederick Mosteller, and John W. Tukey, “Statistical Problems of theKinsey Report,” Journal of the American Statistical Association, vol. 48 (1953), pp. 673-716.
Couper, Mick P., “Web Surveys: A Review of Issues and Approaches,” Public Opinion Quar-terly (2000).
Couper, Mick P., Arie Kapetyn, Matthias Schonlau, and Joachim Winter, “Noncoverage andNonresponse in an Internet Survey,” Social Science Research, vol. 36 (2007), pp. 131–148.
Holbrook, Allyson L., Jon A. Krosnick and Alison Pfent, “Response Rates in Surveys by theNews Media and Government Contractor Survey Research Firms,” in J. Lepkowski, B. Harris-Kojetin, P. J. Lavrakas, C. Tucker, E. de Leeuw, M. Link, M. Brick, L. Japec, and R. Sangster, eds.,Telephone Survey Methodology. New York: Wiley, forthcoming.
Jagers, Peter, “Post-stratification against Bias in Sampling,” International Statistical Review,vol. 54 (1986), pp. 159-167.
King, Benjamin F., “Quota Sampling,” in William G. Madow, Ingram Olkin, and Donald B.Rubin, eds., Incomplete Data in Sample Surveys, vol. 2. New York: Academic Press, 1983.
Lee, Sunghee, “Propensity Score Adjustment as a Weighting Scheme for Volunteer Panel WebSurveys,” Journal of Official Statistics, vol. 22 (2006), pp. 329-349.
Little, Roderick J.A., and Donald B. Rubin, Statistical Analysis with Missing Data, 2nd ed. NewYork: Wiley, 2002.
Maholtra, Neil, and Jon. A. Krosnick, “The Effect of Survey Mode and Sampling on Inferencesabout Political Attitudes and Behavior: Comparing the 2000 and 2004 ANES to Internet Surveyswith Nonprobability Samples,” Political Anlaysis, 2007.
Rosenbaum, Paul R., and Rubin, Donald B., “The Central Role of the Propensity Score in Ob-servational Studies for Causal Effects,” Biometrika, vol. 70 (1983), pp. 41-55.
Rubin, Donald B. Matched Sampling for Causal Effects. New York: Cambridge UniversityPress, 2006.
Rubin, Donald B., and Elaine Zanutto, “Using Matched Substitutes to Adjust for Nonignor-able Nonresponse through Multiple Imputations,” in Robert M. Groves, Don A. Dillman, John L.Eltinge, and Roderick J.A. Little, eds., Survey Nonresponse. New York: Wiley, 2002.

26 DOUGLAS RIVERS STANFORD UNIVERSITY AND POLIMETRIX, INC.
Saris, Willem E., “Ten Years of Interviewing Without Interviewers: The Telepanel,” in Mick P.Couper, Reginald P. Baker, Jelke Bethlehem, Cynthia Z.F. Clark, Jean Martin, William L. NicholsII, and James M. O’Reilly, eds., Computer Assisted Survey Information Collection. New York:Wiley, 1998.
Sarndal, Carl-Erik, and Sixten Lundstrom, Estimation in Surveys with Nonresponse. New York:Wiley, 2005.
Sarndal, Carl-Erik, Bengt Swensson, and Jan Wretman, Model Assisted Survey Sampling. NewYork: Springer-Verlag, 1992.
Schlenger, William E., Juesta M. Caddell, Lori Ebert, B. Kathleen Jordan, Kathryn M. Rourke,David Wilson, Lisa Thalji, J. Michael Dennis, John A. Fairbank, and Richard A. Kulka, “Psycho-logical Reactions to Terrorist Attacks: Findings From the National Study of Americans’ Reactionsto September 11,” JAMA, vol. 288 (August 7, 2002), pp. 581–588.
Smith, T.M.F., “On the Validity of Inferences from Non-Random Samples,” Journal of the RoyalStatistical Society, Series A, vol. 139 (1976), pp. 183-204.