sampling and analysis plan phase iv for toxic
TRANSCRIPT

SAMPLING AND ANALYSIS PLAN – PHASE IV FOR TOXIC CYANOBACTERIA IN
LAKE WASHINGTON, LAKE SAMMAMISH, AND LAKE UNION
_____________________________________________________________
SUBMITTED TO: King County Water and Land Resources Division Department of Natural Resources and Parks 201 South Jackson Street, Suite 600 Seattle, Washington 98104 SUBMITTED BY: Debra Bouchard, Water Quality Planner III King County Freshwater Assessment King County Water and Land Resources Division Department of Natural Resources and Parks
June 2008 _____________________________________________________________
07/07/08 Final PhaseIV_CyanotoxicitySAP_2008 (3).doc
2
NAME OF PROJECT: Sampling and Analysis Plan for Toxic Cyanobacteria in Lake Washington, Lake Sammamish, and Lake Union.
PROJECT NUMBER: 421235 – ROUTINE MAJOR LAKES SAMPLING AND ANALYSIS 421395 – SWIMMING BEACHES SAMPLING AND ANALYSIS PREPARED BY: Debra Bouchard, King County DNRP Water Quality Planner III
Water and Land Resources Division Fran Sweeney, Aquatic Toxicology Supervisor, King County Environmental Lab Gabriela Hannach, Environmental Lab Scientist II, Aquatic Toxicology, King County Environmental Lab Jim, Buckley, Environmental Lab Scientist III, Aquatic Toxicology, King County Environmental Lab Jean Jacoby, Chair of Department of Civil and Environmental Engineering, Seattle University (Phase I SAP)
APPROVED BY: Project Manager, Debra Bouchard Freshwater Assessment, King County DNRP
__________________________Date________ Program Manager, Jonathan Frodge: Freshwater Assessment, King County DNRP __________________________Date________ Lab Project Manager, Katherine Bourbonais King County Environmental Laboratory __________________________Date________ Aquatic Toxicology Supervisor, Fran Sweeney King County Environmental Laboratory: __________________________Date________ Laboratory QA Officer, Colin Elliott King County Environmental Laboratory __________________________Date________ Microbiology Supervisor, Eric Thompson King County Environmental Laboratory __________________________Date________

07/07/08 Final PhaseIV_CyanotoxicitySAP_2008 (3).doc
3
TABLE OF CONTENTS 1 INTRODUCTION ................................................................................................................................ 5
1.1 PROJECT BACKGROUND .................................................................................................................. 6 1.2 SUMMARY OF STUDIES PRIOR TO 2002............................................................................................ 7 1.3 KING COUNTY MICROCYSTIN MONITORING RESULTS 2002-2007 .................................................. 7 1.4 REGULATORY STATUS OF CYANOTOXIN CRITERIA AND GUIDELINES ........................................... 14 1.5 STUDY AREA DESCRIPTION........................................................................................................... 15 1.6 PROJECT OBJECTIVES .................................................................................................................... 18
2 STUDY DESIGN ................................................................................................................................ 18 2.1 APPROACH .................................................................................................................................... 18 2.2 TIMELINE ...................................................................................................................................... 22 2.3 SAMPLING PROCEDURES ............................................................................................................... 22
2.3.1 Water sample collection and storage procedure to test for toxins: ...................................... 23 2.3.2 Water sample collection and storage procedure for quantitative identification of cyanobacteria. ...................................................................................................................................... 23
3 LABORATORY ANALYSIS ............................................................................................................ 24 3.1 MICROCYSTIN TOXIN STRUCTURE AND CROSS-REACTIVITY ANALYSIS SUMMARY...................... 24
3.1.1 Sample Preparation for Microcystin Toxin Assay ................................................................ 24 3.1.2 Microcystins– ELISA ............................................................................................................ 25 3.1.3 Microcystins –PPIA.............................................................................................................. 26 3.1.4 Microcystins - HPLC............................................................... Error! Bookmark not defined.
3.2 ANATOXIN-A TOXIN STRUCTURE AND CROSS-REACTIVITY ANALYSIS SUMMARY ....................... 26 3.2.1 Sample Preparation for Anatoxin-a Toxin Assay ................................................................. 26
3.3 ANALYTICAL PROCEDURES ........................................................................................................... 27 4 DATA QUALITY OBJECTIVES..................................................................................................... 28
4.1.1 Laboratory Precision............................................................................................................ 28 4.1.2 Field Precision ..................................................................................................................... 28 4.1.3 Bias....................................................................................................................................... 28 4.1.4 Representativeness................................................................................................................ 28 4.1.5 Comparability....................................................................................................................... 29 4.1.6 Completeness ........................................................................................................................ 29
5 DATA REDUCTION, REVIEW, AND REPORTING ................................................................... 29
6 PROJECT ORGANIZATION .......................................................................................................... 30
7 QUALITY CONTROL PROCEDURES.......................................................................................... 31 7.1 FIELD QUALITY CONTROL PROCEDURES....................................................................................... 31
7.1.1 QC Practices for Field Measurements ................................................................................. 31 7.2 LABORATORY QUALITY CONTROL PROCEDURES .......................................................................... 31
7.2.1 Frequency of quality control samples................................................................................... 32 7.3 CORRECTIVE ACTION .................................................................................................................... 33
8 REFERENCES ................................................................................................................................... 34
9 ATTACHMENT –THE INFLUENCE OF PIGMENTS ON RESULTS IN THE PROTEIN PHOSPHATASE INHIBITION ASSAY.................................................................................................. 36
07/07/08 Final PhaseIV_CyanotoxicitySAP_2008 (3).doc
4
LIST OF TABLES
TABLE 1. GENERAL FEATURES OF CYANOTOXINS. (MODIFIED FROM CHORUS AND BARTRAM 1999). ........................................................................................................................................ 5
TABLE 2. SUMMARY OF KING COUNTY TOXIC CYANOBACTERIA MONITORING RESULTS THROUGH OCTOBER 2007. ............................................................................................... 10
TABLE 3. STATIONS AND SAMPLING PARAMETERS AT EACH LOCATION. ....................... 15
TABLE 4. SUMMARY OF CYANOTOXIN AND PHYTOPLANKTON WEEKLY SAMPLE COLLECTION SCHEDULE BY MAJOR LAKES MONITORING AND SWIMMING BEACH PROGRAMS............................................................................................................................................... 21
TABLE 5. SAMPLE CONTAINER & PRESERVATION REQUIREMENTS .................................. 22
TABLE 6. LABORATORY ANALYSIS SUMMARY........................................................................... 27
TABLE 7. PROJECT TEAM MEMBERS ............................................................................................. 30
TABLE 8. FIELD QUALITY CONTROL SAMPLES.......................................................................... 31
TABLE 9. LABORATORY QUALITY CONTROL SAMPLES.......................................................... 32
TABLE 10. ADDITIONAL LABORATORY QUALITY CONTROL SAMPLES............................. 33
TABLE 11. LABORATORY QC REQUIREMENTS ........................................................................... 33
TABLE A. 2008 SAMPLING SCHEDULE FOR CYANOBACTERIA TOXICITY AND QUANTITATIVE PHYTOPLANKTON IN BOTH THE ROUTINE MAJOR LAKES PROGRAM AND SWIMMING BEACH PROGRAMS. ............................................................................................. 38
LIST OF FIGURES
FIGURE 1A TO 1F. RESULTS OF THE 2003 – 2007 CYANOBACTERIA TOXICITY TESTING IN SAMPLES COLLECTED FROM LAKES WASHINGTON, SAMMAMISH, AND UNION USING BOTH PPIA AND ELISA. ................................................................................................... 13
FIGURE 2. 2006 – 2007 MAJOR LAKES CYANOBACTERIA TOXICITY MONITORING PROGRAM SAMPLING LOCATIONS.......................................................................................... 16
FIGURE 3. 2008 SWIMMING BEACH MONITORING PROGRAM SAMPLING LOCATIONS. 17

07/07/08 Final PhaseIV_CyanotoxicitySAP_2008 (3).doc
5
1 Introduction Toxic cyanobacteria have been increasingly detected in western Washington lakes since the first documented toxic episode in American Lake in 1989 (Jacoby et al. 1994, Jacoby and Kann 2007). State health officials are concerned that the rate of occurrence appears to be increasing over time leading to the possibility of increased human and animal exposure to cyanotoxins. Toxic cyanobacteria blooms are emerging as a national and international issue (Ecology 2007).
Mass accumulations or “blooms” of cyanobacteria in freshwater ecosystems are primarily caused by nutrient, particularly phosphorus (P), enrichment. Cyanobacteria blooms can cause surface scums, decreased water column transparency, dissolved oxygen depletion and unpalatable drinking water due to taste and odors. Some cyanobacteria also produce toxic compounds (“cyanotoxins”) that have caused livestock, wildlife and pet fatalities worldwide (reviewed by Carmichael 1994; Chorus 2001). Although many cyanobacteria blooms are not toxic, a bloom that is not toxic one day may become toxic during the same growing season.
Table 1. General features of cyanotoxins. (Modified from Chorus and Bartram 1999).
Toxin Group Primary Target organ in mammals Cyanobacterial genera
Microcystins Liver Microcystis, Anabaena, Planktothrix (Oscillatoria), Nostoc, Hapalosiphon, Anabaenopsis
Nodularian Liver Nodularia
Anatoxin-a Nerve Synapse Anabaena, Planktothrix (Oscillatoria), Aphanizomenon
Anatoxin-a (S) Nerve Synapse Anabaena
Aplysiatoxins Skin Lyngbya, Schizothrix, Planktothrix (Oscillatoria)
Cylindrospermopsins Liver Cylindrospermopsis, Aphanizomenon
Lyngbyatoxin-a Skin, G.I. Tract Lyngbya
Saxitoxins Nerve Axons Anabaena, Aphanizomenon, Lyngbya, Cylindrospermopsis
(LPS) Potential irritant; affects any exposed tissue ALL
1. Many structural variants may be known for each toxin group.
2. Not produced by all species of a particular genus
3. Whole cells of toxic species elicit widespread tissue damage to kidney and lymphoid tissue.

07/07/08 Final PhaseIV_CyanotoxicitySAP_2008 (3).doc
6
Cyanotoxins include a broad, diverse range of chemicals and mechanisms of toxicity (Carmichael 1994; Sivonen and Jones 1999). Major classes of cyanotoxins include the cyclic peptides, which are primarily hepatotoxins (microcystins and nodularins); alkaloids and an organophosphate, which are strong neurotoxins (anatoxin-a, anatoxin-a (S), and saxitoxins); a cyclic guanide alkaloid, which inhibits protein synthesis (cylindrospermopsin); lipopolysaccharides, which have pyrogenic properties; and dermatoxic alkaloids (aplysiatoxins and lyngbyatoxins) (Chorus 2001). Toxin groups and the cyanobacteria genera known to produce them are listed in Table 1. This Phase IV SAP will focus on the two toxins; microcystin and anatoxin-a.
Microcystins are the most commonly tested and detected cyanotoxins in Washington and have been found at water concentrations from <1 to 4,810 μg/L (Jacoby and Kann 2007). These hepatotoxins are of concern due to their prevalence and potential to harm animals and humans. Hepatotoxins damage liver tissues, and at high doses can cause liver failure and death (Carmichael 1994). Hepatotoxins with seven amino acids are called microcystins (produced by species of Microcystis, Planktothrix, and Anabaena) and those with five amino acids are nodularins (produced by Nodularin spumigena). The mechanism of toxicity involves the inhibition of the specific protein phosphatase enzymes possessed by all eukaryotic cells. In addition, microcystins are suspected tumor-promoters and teratogens (Falconer 1998). These toxins have been associated with elevated rates of primary liver cancer in people drinking waters with high densities of cyanobacteria (Yu 1989).
While microcystins appear to be more common than neurotoxins, neurotoxins are notoriously potent and rapid acting poisons that have caused severe animal poisonings in North America, Europe and Australia (WHO 2003, Botana 2007). The neurotoxin anatoxin-a is an alkaloid with high toxicity. It acts as a post-synaptic, depolarizing, neuromuscular blocking agent. Depending upon the size of the animal and amount of the toxin present, illness or death may occur within a minutes to a few hours after exposure. Signs of anatoxin-a poisoning are staggering, paralysis, muscle twitching, gasping, and convulsions – all potentially leading to death. Anatoxin-a can be produced by some species of cyanobacteria including Anabaena, Aphanizomenon, Cylindrospermum, Planktothrix (Oscillatoria), and Microcystis spp.. Determination of anatoxin-a in natural waters has been challenging due to its typically low concentration and/or rapid degradation to nontoxic degradation products (Botana 2007).
1.1 Project Background
The toxic bloom of Microcystis aeruginosa in Lake Sammamish during 1997 and subsequent detection of microcystins by Johnston and Jacoby (Johnston and Jacoby 2003) in 1999 prompted King County to develop a sampling and analysis plan for the measurement of microcystins in the major King County lakes in 2002. King County began routinely collecting samples for the analysis of microcystin, during summer and fall of 2002 and has continued to date with modifications documented in the Phase II SAP in 2005, Addendum to Phase II SAP in 2006, and the Phase III SAP in 2007. This Phase IV of the Cyanotoxicity SAP is based upon results of the County’s 2003-2007 monitoring efforts (as discussed below) with modifications to increase efficiency and to better meet project objectives.
07/07/08 Final PhaseIV_CyanotoxicitySAP_2008 (3).doc
7
The assessment of cyanotoxins throughout Washington State has primarily focused on microcystins due to their widespread occurrence and potential for chronic toxicity. However, blooms that test negative for microcystins may have other cyanotoxins present. For example, a 2007 bloom in Anderson Lake in Jefferson County tested negative for microcystins but was highly toxic with anatoxin-a (Ecology 2007). The increasing detection of anatoxin-a in western Washington lakes (e.g., American Lake, Pierce County, December 1989 and 2007; Kitsap Lake, Kitsap County, October 2001; and Jefferson County 2006) in association with animal deaths has prompted King County to expand cyanotoxicity testing to include this neurotoxin. In 2007 the King County Environmental Laboratory (KCEL) purchased the highly sensitive equipment necessary to test for anatoxin-a. The method adapted at KCEL uses fluorimetric derivatization with HPLC (High Pressure Liquid Chromatography). Regular testing for anatoxin-a will begin with the method development in 2008. The inclusion of anatoxin-a as part of the cyanotoxicity monitoring program will allow the County to further define the potential threat of this neurotoxin in lakes Washington, Sammamish, and Union.
1.1.1 Summary of Lake Sammamish 1997 & 1999 Cyanotoxin Study
Cyanobacterial activity and environmental conditions that may promote toxic cyanobacteria were investigated in Lake Sammamish during summer and fall 1999 (Johnston and Jacoby 2003). Microcystins were detected using enzyme linked immunosorbent assay (ELISA) during late August and early September 1999 despite low cyanobacterial abundance. In contrast to other studies in which concentrations varied substantially throughout a lake (Carmichael & Gorham 1981; Jacoby et.al. 1994) similar microcystin concentrations were detected throughout Lake Sammamish at all depths, ranging between 0.19 to 3.8 µg L-1, with the exception of the boat launch where a surface concentration reached 43 µg L-1.
During the toxic episodes in 1997 and 1999, Microcystis was associated with a stable water column, increased surface total phosphorus concentrations (> 10 µg L-1), surface temperatures greater than 22oC, high total nitrogen to phosphorus ratios (> 30) and increased water column transparency (up to ~5.5 m). Microcystin:chlorophyll-a (chl-a) ratios varied from 0.4 to 6.4, with higher ratios in the hypolimnion during the toxic episode in 1999. Migration of Microcystis and Anabaena occurred in both the deep and shallow portions of the lake. Migration rates were more than 2 times higher at the shallow station, and the migrating cyanobacteria were dominated by Microcystis (89 to 99% of the total biovolume) at both stations. External loading of nutrients due to the large storm event that preceded the 1997 toxic episode may have provided the nutrients needed to fuel that bloom. Despite the lack of rain and subsequent external runoff, toxic Microcystis occurred in 1999. The migration of Microcystis from the nutrient-rich sediments may have contributed to the toxic population detected in 1999.
1.1.2 King County Microcystin Monitoring Results 2002-2007
King County had two parallel microcystin monitoring efforts in 2002. The first County monitoring effort included samples collected at all 25 routinely monitored Major Lake stations beginning in spring 2002. These samples were processed using a 0.45 μm syringe-filter and analysis with the ELISA method. No microcystins were detected using these protocols.

07/07/08 Final PhaseIV_CyanotoxicitySAP_2008 (3).doc
8
The second effort, as described in the 2002 SAP, was focused on determination of environmental conditions that may trigger toxin production and the evaluation of microcystin extraction methods. This effort involved the monitoring of six stations in lakes Union, Washington, and Sammamish. Samples from this effort were either refrigerated or treated with one of two extraction processes (freezing and sonication) prior to analysis by protein phosphatase inhibition assay (PPIA) and ELISA. Cell lysing is assumed to be representative of a recreational exposure in which a swimmer ingests ambient water and cells as a combined dose. Based on the results of initial effort, it was determined that the best method for cell lysing was a combination of freezing and sonication.
In 2005, the program was modified to include sites in the Swimming Beach Monitoring Program. Coordination of both the Major Lakes Monitoring and the Swimming Beach Monitoring programs provided weekly sample collection throughout most of the algae productive growing season and to better track cyantoxins in areas of high recreational use.
The results of the microcystin monitoring efforts are summarized below, in Table 2, and illustrated in Figures 1a-f.
Toxins
• Microcystins were detected in all three lakes in 2003 – 2006. Lake Sammamish had only one detectable sample in 2006.
• Concentrations in all but two of the 806 samples were < 1.0 µg/L, the threshold for drinking water recommended by the World Health Organization (WHO 1988).
• The highest microcystin concentrations were measured on May 30, 2006 during a bloom in the Matthews Beach area of Lake Washington.
• swimming area = 1.15 µg/L (PPIA) and 1.35 µg/L (ELISA) microcystin LR equivalents
• cyanobacteria scum = 52.6 µg/L (PPIA) and 47.1 g/L (ELISA) microcystin LR equivalents
• In general, the PPIA test found more detectable levels of microcystin than the ELISA test in 2003, 2004, and 2005. This was reversed in 2006 in Lake Washington and Lake Union. Since the two methods measure different forms of microcystin, this may indicate that the form of the toxin varies from year to year.
Phytoplankton
• Anabaena flos-aquae and Anacystis sp. were the dominant cyanobacteria present in Lake Washington and Lake Union samples with detectable microcystin concentrations.
• Anabaena flos-aquae, Anacystis sp., and Aphanizomenon flos-aquae were the most consistently detected cyanobacteria in Lake Sammamish samples with detectable microcystin concentrations.
07/07/08 Final PhaseIV_CyanotoxicitySAP_2008 (3).doc
9
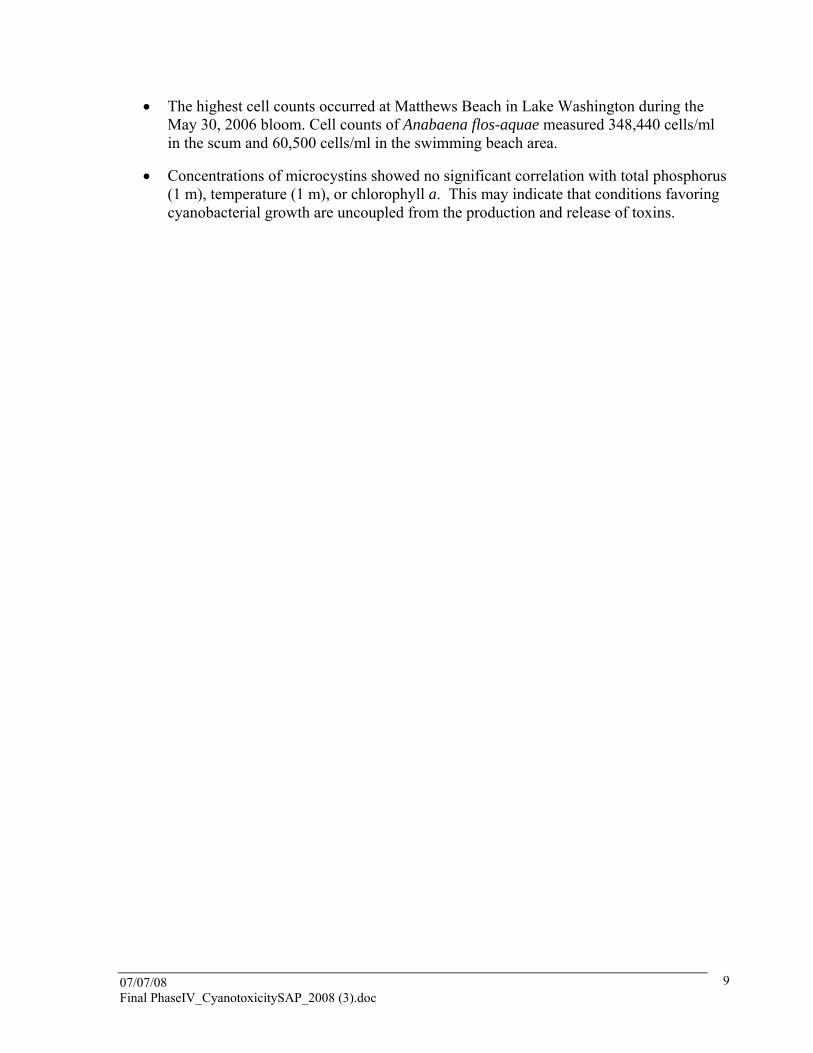
• The highest cell counts occurred at Matthews Beach in Lake Washington during the May 30, 2006 bloom. Cell counts of Anabaena flos-aquae measured 348,440 cells/ml in the scum and 60,500 cells/ml in the swimming beach area.
• Concentrations of microcystins showed no significant correlation with total phosphorus (1 m), temperature (1 m), or chlorophyll a. This may indicate that conditions favoring cyanobacterial growth are uncoupled from the production and release of toxins.
07/07/08 Final PhaseIV_CyanotoxicitySAP_2008 (3).doc
10
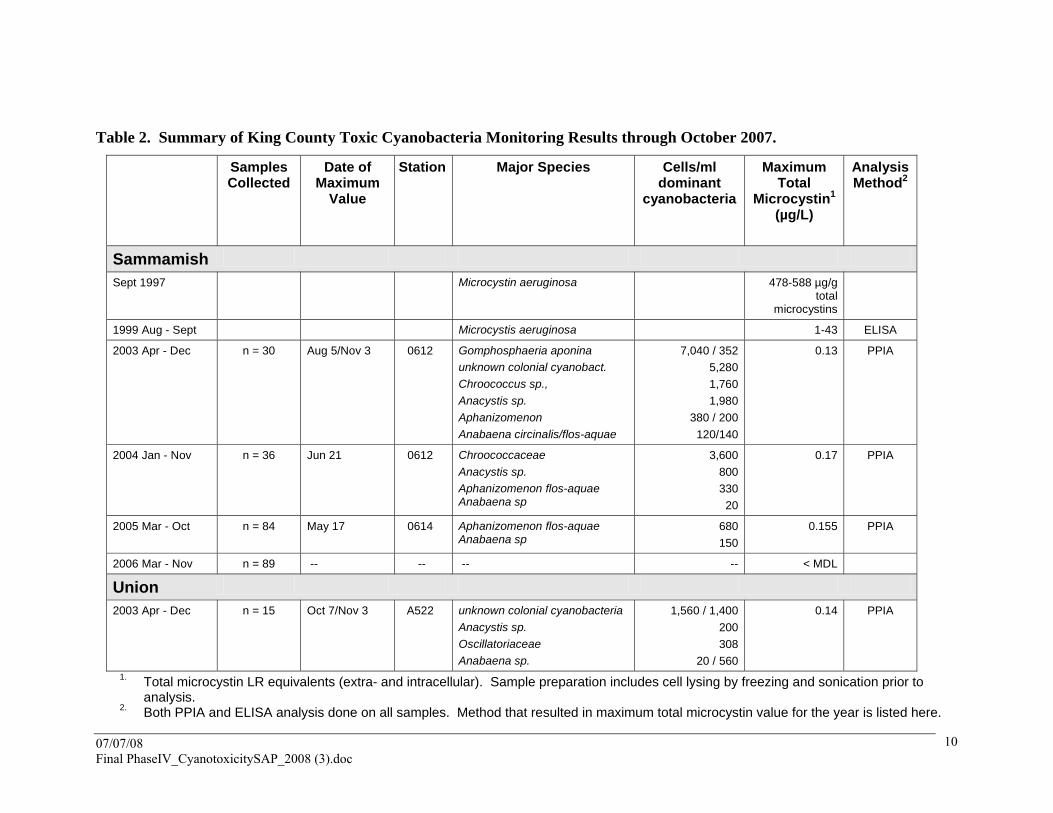
Table 2. Summary of King County Toxic Cyanobacteria Monitoring Results through October 2007.
1. Total microcystin LR equivalents (extra- and intracellular). Sample preparation includes cell lysing by freezing and sonication prior to analysis.
2. Both PPIA and ELISA analysis done on all samples. Method that resulted in maximum total microcystin value for the year is listed here.
Samples Collected
Date of Maximum
Value
Station Major Species Cells/ml dominant
cyanobacteria
Maximum Total
Microcystin1 (µg/L)
Analysis Method2
Sammamish
Sept 1997 Microcystin aeruginosa 478-588 µg/g total
microcystins
1999 Aug - Sept Microcystis aeruginosa 1-43 ELISA
2003 Apr - Dec n = 30
Aug 5/Nov 3 0612 Gomphosphaeria aponina unknown colonial cyanobact. Chroococcus sp., Anacystis sp. Aphanizomenon Anabaena circinalis/flos-aquae
7,040 / 3525,2801,7601,980
380 / 200120/140
0.13 PPIA
2004 Jan - Nov n = 36 Jun 21 0612 Chroococcaceae Anacystis sp. Aphanizomenon flos-aquae Anabaena sp
3,60080033020
0.17 PPIA
2005 Mar - Oct n = 84 May 17 0614 Aphanizomenon flos-aquae Anabaena sp
680150
0.155 PPIA
2006 Mar - Nov n = 89 -- -- -- -- < MDL
Union
2003 Apr - Dec n = 15 Oct 7/Nov 3 A522 unknown colonial cyanobacteria Anacystis sp. Oscillatoriaceae Anabaena sp.
1,560 / 1,400200308
20 / 560
0.14 PPIA

07/07/08 Final PhaseIV_CyanotoxicitySAP_2008 (3).doc
11

07/07/08 Final PhaseIV_CyanotoxicitySAP_2008 (3).doc
12
PPIA Lake Washington 2003 - 2007
0.0
0.2
0.4
0.6
0.8
1.0
1.2
1.4
Feb-03
Aug-03
Feb-04
Aug-04
Feb-05
Aug-05
Feb-06
Aug-06
Feb-07
Aug-07
Mic
rocy
stin
LR
Equ
ivale
nts
(µ
g/L)
807
814
817
826
831
832
834
852
4903
0806SB
0818SB
0825SB
0826SB
0828SB
0834SB
083930SB
0852SB
0860SB
4903SB
M DL
May 30, 2006 bloom 52 µg/L
@ 0818NSB
ELISALake Washington 2003 - 2006
0.0
0.2
0.4
0.6
0.8
1.0
1.2
1.4
Feb-03
Aug-03
Feb-04
Aug-04
Feb-05
Aug-05
Feb-06
Aug-06
Feb-07
Aug-07
Mic
rocysti
n L
R E
qu
iva
len
t (µ
g/
L)
807
814
817
826
831
832
834
852
4903
0806SB
0818SB
0825SB
0826SB
0828SB
0834SB
083930SB
0852SB
0860SB
4903SB
M DL
May 30, 2006 bloom
47.1 µg/L @ 0818NSB

07/07/08 Final PhaseIV_CyanotoxicitySAP_2008 (3).doc
13
Figure 1a to 1f. Results of the 2003 – 2007 Cyanobacteria Toxicity testing in samples collected from lakes Washington, Sammamish, and Union using both PPIA and ELISA.
ELISALake Sammamish 2003 - 2006
0.0
0.2
0.4
0.6
0.8
1.0
1.2
1.4
Feb-03
Aug-03
Feb-04
Aug-04
Feb-05
Aug-05
Feb-06
Aug-06
Feb-07
Aug-07
Mic
rocy
stin
LR
Equ
ivale
nts
(µ
g/L)
6116126146250602SB0615SBMDL
PPIALake Samammish 2003 - 2006
0.0
0.2
0.4
0.6
0.8
1.0
1.2
1.4
Feb-03
Aug-03
Feb-04
Aug-04
Feb-05
Aug-05
Feb-06
Aug-06
Feb-07
Aug-07
Mic
rocysti
n L
R E
qu
ivale
nts
(µ
g/
L)
6116126146250602SB0615SBMDL
PPIALake Union 2003 - 2006
0.0
0.2
0.4
0.6
0.8
1.0
1.2
1.4
Feb-03
Aug-03
Feb-04
Aug-04
Feb-05
Aug-05
Feb-06
Aug-06
Feb-07
Aug-07
Mic
rocysti
n L
R E
qu
ivale
nts
(µ
g/
L)
A522
MDL
ELISALake Union 2003 - 2006
0.0
0.2
0.4
0.6
0.8
1.0
1.2
1.4
Feb-03
Aug-03
Feb-04
Aug-04
Feb-05
Aug-05
Feb-06
Aug-06
Feb-07
Aug-07
Mic
rocy
stin
LR
Equ
ival
ents
(µg/
L)
A522
MDL

07/07/08 Final PhaseIV_CyanotoxicitySAP_2008 (3).doc
14
1.2 Regulatory Status of Cyanotoxin Criteria and Guidelines
In 2005, the Washington State Legislature established funding for a Freshwater Algae Control Program (RCW 43.21A.667) through the Department of Ecology (Ecology) to assist local governments in the management of freshwater algae problems. As part of this program Ecology partnered with the Washington Department of Health (WaDOH) to develop recreational guidelines values for cyanotoxins. WaDOH has recommended a three-tiered approach using the recreational guidance values of 6.0 µg/L microcystins and 1 µg/L anatoxin-a for managing Washington Lakes (WaDOH, May 2008). More information about this three-tiered management approach can be found at the Washington State Department of Health webpage: http://www.doh.wa.gov/ehp/algae/guidelines.htm.
07/07/08 Final PhaseIV_CyanotoxicitySAP_2008 (3).doc
15
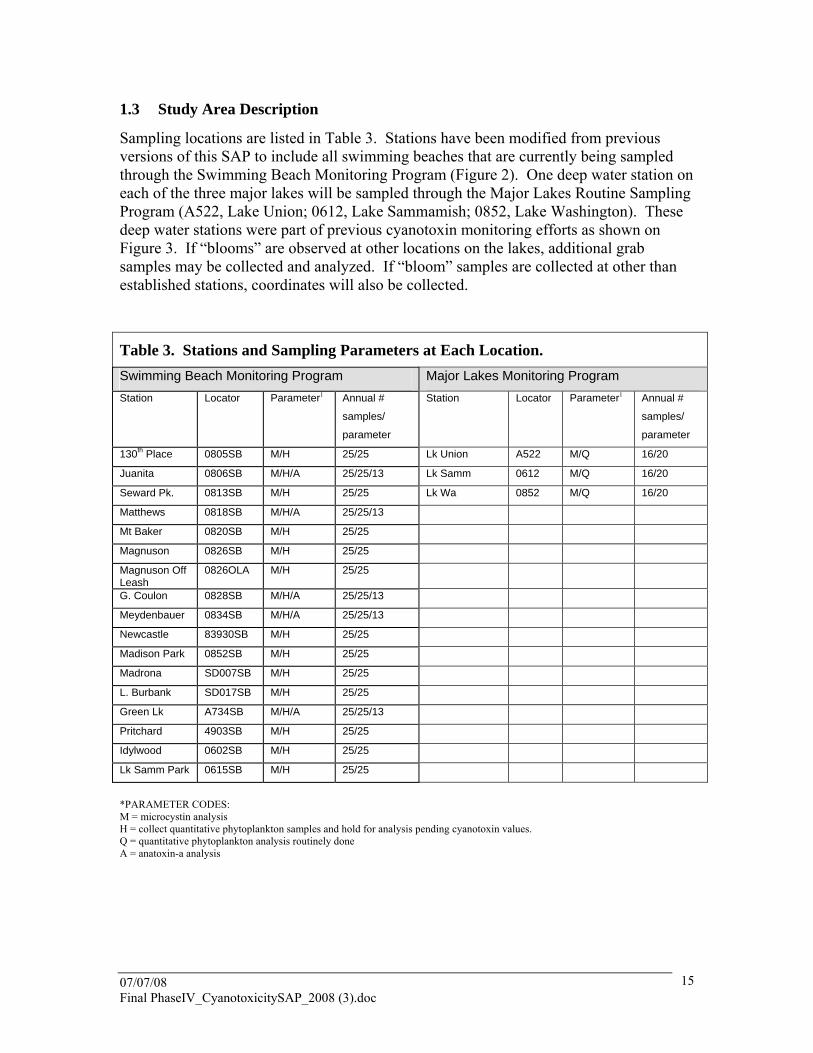
1.3 Study Area Description
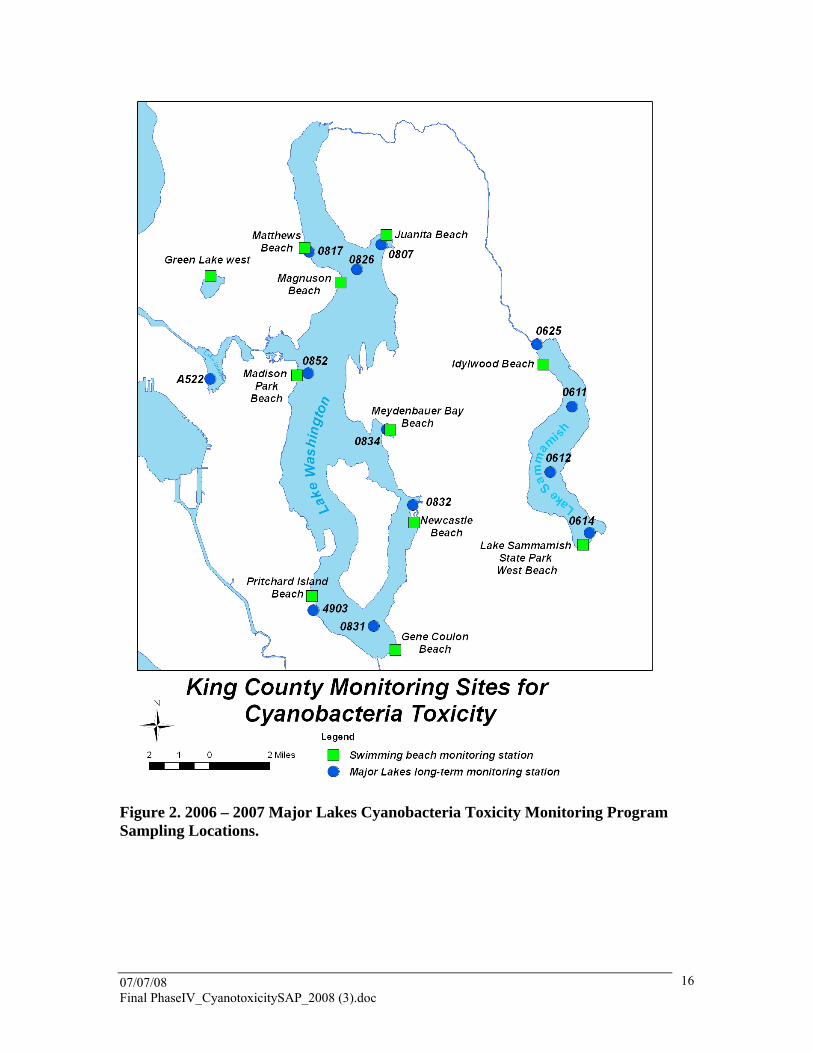
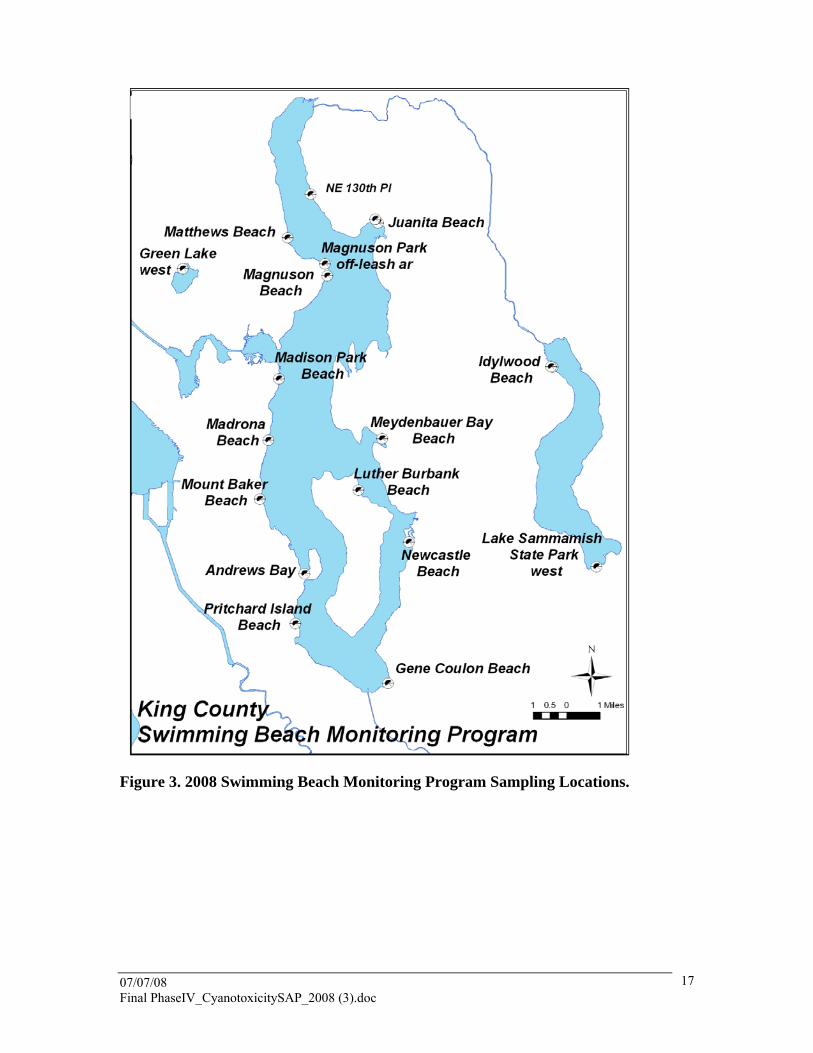
Sampling locations are listed in Table 3. Stations have been modified from previous versions of this SAP to include all swimming beaches that are currently being sampled through the Swimming Beach Monitoring Program (Figure 2). One deep water station on each of the three major lakes will be sampled through the Major Lakes Routine Sampling Program (A522, Lake Union; 0612, Lake Sammamish; 0852, Lake Washington). These deep water stations were part of previous cyanotoxin monitoring efforts as shown on Figure 3. If “blooms” are observed at other locations on the lakes, additional grab samples may be collected and analyzed. If “bloom” samples are collected at other than established stations, coordinates will also be collected.
Table 3. Stations and Sampling Parameters at Each Location. Swimming Beach Monitoring Program Major Lakes Monitoring Program Station Locator Parameter1 Annual #
samples/
parameter
Station Locator Parameter1 Annual #
samples/
parameter
130th Place 0805SB M/H 25/25 Lk Union A522 M/Q 16/20
Juanita 0806SB M/H/A 25/25/13 Lk Samm 0612 M/Q 16/20
Seward Pk. 0813SB M/H 25/25 Lk Wa 0852 M/Q 16/20
Matthews 0818SB M/H/A 25/25/13
Mt Baker 0820SB M/H 25/25
Magnuson 0826SB M/H 25/25
Magnuson Off Leash
0826OLA M/H 25/25
G. Coulon 0828SB M/H/A 25/25/13
Meydenbauer 0834SB M/H/A 25/25/13
Newcastle 83930SB M/H 25/25
Madison Park 0852SB M/H 25/25
Madrona SD007SB M/H 25/25
L. Burbank SD017SB M/H 25/25
Green Lk A734SB M/H/A 25/25/13
Pritchard 4903SB M/H 25/25
Idylwood 0602SB M/H 25/25
Lk Samm Park 0615SB M/H 25/25
*PARAMETER CODES: M = microcystin analysis H = collect quantitative phytoplankton samples and hold for analysis pending cyanotoxin values. Q = quantitative phytoplankton analysis routinely done A = anatoxin-a analysis
07/07/08 Final PhaseIV_CyanotoxicitySAP_2008 (3).doc
16
Figure 2. 2006 – 2007 Major Lakes Cyanobacteria Toxicity Monitoring Program Sampling Locations.
07/07/08 Final PhaseIV_CyanotoxicitySAP_2008 (3).doc
17
Figure 3. 2008 Swimming Beach Monitoring Program Sampling Locations.

07/07/08 Final PhaseIV_CyanotoxicitySAP_2008 (3).doc
18
1.4 Project Objectives
The objectives of the Phase IV Cyanobacteria Toxicity Program in Lake Washington, Lake Sammamish and Lake Union Study are to:
• Evaluate the presence of microcystins, a hepatoxin, and anatoxin-a, a neurotoxin, to protect human health
• Estimate concentrations and geographic extent of the toxicity, should it be present
• Establish relationships between microcystin and cyanobacteria species/abundance.
• Evaluate environmental conditions leading to toxin production in cyanobacteria.
The study will provide decision-makers with information and recommendations regarding recreational water use during cyanobacterial blooms and will lead to improved management of King County lakes for the protection of human health.
2 Study Design
2.1 Approach
This Phase IV survey is primarily designed to evaluate the presence/absence of the cyanobacterial toxins microcystins and anatoxin-a, and secondarily to estimate concentrations and geographic extent of the toxicity, should it be present. The monitoring efforts described in this Phase IV SAP began in 2008.
Sample collection will utilize the combined efforts of the Routine Major Lakes Sampling Program and the Swimming Beach Monitoring Program. Table 3 lists the sampling sites included in this cyanotoxicity monitoring effort. Table A (attached) lists all Major Lake sampling sites and swimming beach sites and illustrates how microcystin and quantitative phytoplankton sample collection is coordinated with these programs. The Major Lakes Routine Monitoring Program collects samples once per month from November through February, and twice per month from March through October. Swimming Beach Monitoring occurs weekly from mid-May through mid-September. Because high cyanotoxin concentrations have often been detected in Washington State in early autumn, additional sampling at the swimming beach sites will take place in October by WLRD staff. Table 4 lists the sampling schedule for these combined efforts. In addition to swimming beaches, one sample will be collected from a mid-lake station in all three water bodies in King County’s Major Lakes Program (Sammamish, Washington and Union) to estimate open water distribution of any toxicity measured.
Quantitative phytoplankton samples will be collected at each site listed in Table 3. Phytoplankton samples collected as part of the Major Lakes Routine Monitoring will be analyzed regularly. Phytoplankton samples collected as part of the Swimming Beach Monitoring Program will be held for analysis pending measured concentrations of cyanotoxins.
07/07/08 Final PhaseIV_CyanotoxicitySAP_2008 (3).doc
19
The following three types of sampling scenarios are included in this study:
1. Routine Major Lakes Sampling. Three deep water sampling sites were selected at Routine Major Lake monitoring locations in order to estimate geographical extent of toxicity, if detected, to relate cell volumes of cyanobacteria to other environmental parameters measured as part of the routine monitoring efforts, and to continue to provide quantitative phytoplankton data for lake modeling efforts.
An aliquot of the sample collected as part of the routine sampling effort will be used for this study. Sample collection in the Routine Major Lakes program has been modified to incorporate use of an integrated composite sample at the deep water sites. Section 2.3.1 describes the sample collection methods.
Microcystin will be measured by PPIA and ELISA using freezing and sonication as the extraction methods (described in the Phase II SAP). Chl-a/pheo-a (pheophytin a) analysis will be conducted on these Major Lake samples as part of this Routine Major Lakes Monitoring effort. See Major Lakes Monitoring Program SAP for further discussion.
NOTE that quantitative phytoplankton enumeration and identification will be performed for the three samples collected from these Major Lake stations as part of this Phase IV Cyanobacteria Study effort (Table 3 and Table A). Data from the quantitative phytoplankton analyses is stored in LIMS and will be stored in a database being established by WLRD’s Science Section.
2. Swimming Beach Monitoring. The major component of this sampling scenario will be conducted by the laboratory’s Environmental Services Section (ESS) staff as part of the Swimming Beaches Monitoring Program. The seventeen swimming beaches that are part of the seasonal monitoring for fecal coliform bacteria are included in this Phase IV of the Toxic Cyanobacteria Study (Table 3).
Microcystin will be measured by PPIA and ELISA using the freezing and sonication extraction method (described in the Phase II SAP). In addition, five of the swimming beaches (0806SB, 0818SB, 0828SB, 0834SB, A734WSB) will be sampled for anatoxin-a analysis in 2008 as KCEL works on anatoxin-a method development. KCEL is adapting a highly sensitive method for anatoxin-a which uses fluorimetric derivatization with HPLC. The expectation is that in subsequent years all samples collected as part of the cyanotoxicity program will have both microcystin and anatoxin-a analysis.
Sufficient sample volume will be collected for microcystin testing, quantitative phytoplankton identification and enumeration, and anatoxin-a where indicated. Quantitative phytoplankton identification and enumeration samples collected from swimming beaches will be archived and analyzed if determined necessary by high cyanotoxin concentrations. If toxins are present, quantitative phytoplankton identification and enumeration will be determined using the same methodology as for the Routine Major Lakes sampling effort. Sample collection will be a surface dip.
07/07/08 Final PhaseIV_CyanotoxicitySAP_2008 (3).doc
20
In addition, ESS will routinely visually inspect the waters at other swimming beach stations for cyanobacteria blooms while conducting the Swimming Beaches program. Up to 10 samples may be collected per bloom event, followed by Project Manager evaluation, and subsequent decisions regarding appropriate next steps.
3. Bloom Sampling. Focused sampling efforts will be made to collect blooms or accumulations of cyanobacteria if they are present within the visual distance of routine lakes sampling sites or as part of the Small Lakes Monitoring Program. A bloom will be defined by a visually observable accumulation of phytoplankton in the water column or as a surface accumulation. Coordinates will be obtained for these grab samples and a LIMS locator created. New locator names will be consistent with the naming convention system established for the Major Lakes and/or Small Lakes Programs. Up to 10 samples may be collected during a bloom event, at which time the Toxic Cyanobacteria Study Project Manager will evaluate such data as is available and discuss with the laboratory available options for proceeding with the bloom investigation.
Sufficient volume will be collected for toxicity testing, as well as phytoplankton quantitative enumeration and identification. Microcystin will be measured by ELISA and PPIA on these discrete samples using extraction methods described in the Phase II SAP. Anatoxin-a will be measured by HPLC. If toxins are present, quantitative phytoplankton identification and enumeration may be determined.
07/07/08 Final PhaseIV_CyanotoxicitySAP_2008 (3).doc
21
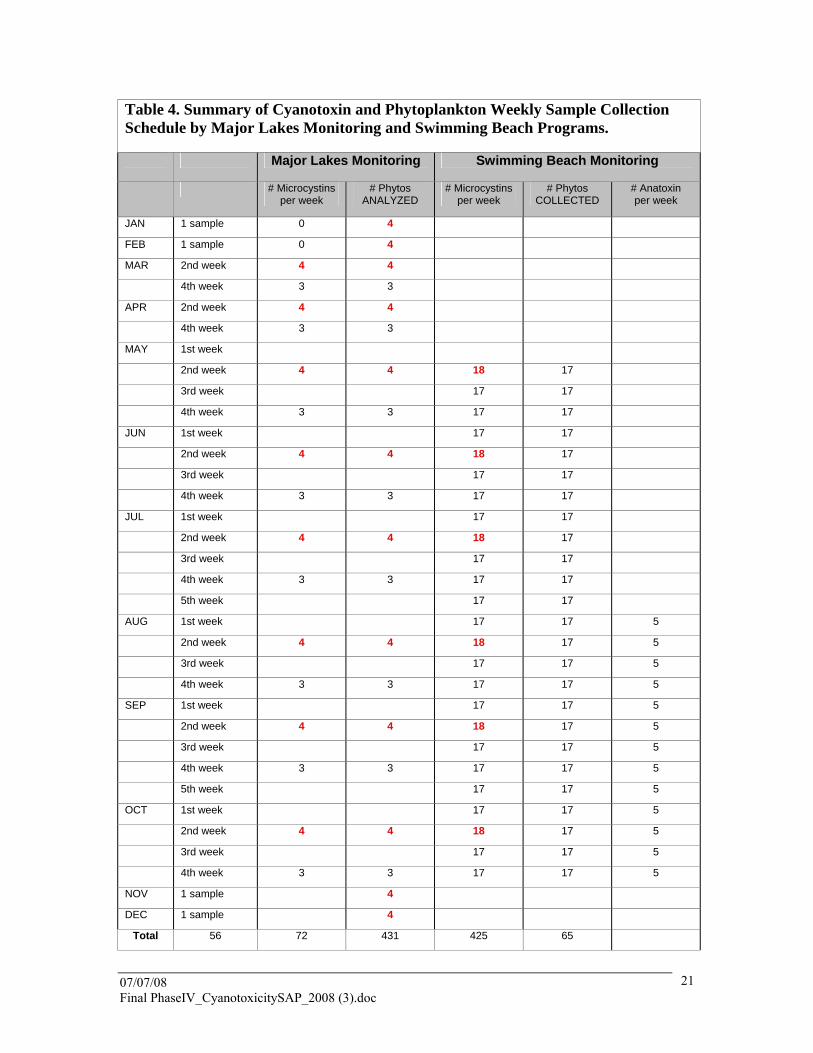
Table 4. Summary of Cyanotoxin and Phytoplankton Weekly Sample Collection Schedule by Major Lakes Monitoring and Swimming Beach Programs.
Major Lakes Monitoring Swimming Beach Monitoring
# Microcystins per week
# Phytos ANALYZED
# Microcystins per week
# Phytos COLLECTED
# Anatoxin per week
JAN 1 sample 0 4
FEB 1 sample 0 4
MAR 2nd week 4 4
4th week 3 3
APR 2nd week 4 4
4th week 3 3
MAY 1st week
2nd week 4 4 18 17
3rd week 17 17
4th week 3 3 17 17
JUN 1st week 17 17
2nd week 4 4 18 17
3rd week 17 17
4th week 3 3 17 17
JUL 1st week 17 17
2nd week 4 4 18 17
3rd week 17 17
4th week 3 3 17 17
5th week 17 17
AUG 1st week 17 17 5
2nd week 4 4 18 17 5
3rd week 17 17 5
4th week 3 3 17 17 5
SEP 1st week 17 17 5
2nd week 4 4 18 17 5
3rd week 17 17 5
4th week 3 3 17 17 5
5th week 17 17 5
OCT 1st week 17 17 5
2nd week 4 4 18 17 5
3rd week 17 17 5
4th week 3 3 17 17 5
NOV 1 sample 4
DEC 1 sample 4
Total 56 72 431 425 65
07/07/08 Final PhaseIV_CyanotoxicitySAP_2008 (3).doc
22
2.2 Timeline
This Phase IV SAP will be implemented from March 2008 and continue through December 2010. It is expected that anatoxin-a will become regular part of cyanotoxin monitoring for all stations in the program in 2009. In 2010, the program will be reevaluated and modifications made as necessary. Previous sampling programs will be discontinued.
2.3 Sampling Procedures
Protocols for the sampling and analysis of microcystins do not currently exist. However, a working group of the International Organization for Standardization is currently developing such protocols (Chorus, personal communication, April 24, 2002). The following sampling procedures are based on methods of Carmichael (2001), Chorus (2001), Johnston and Jacoby (2002).
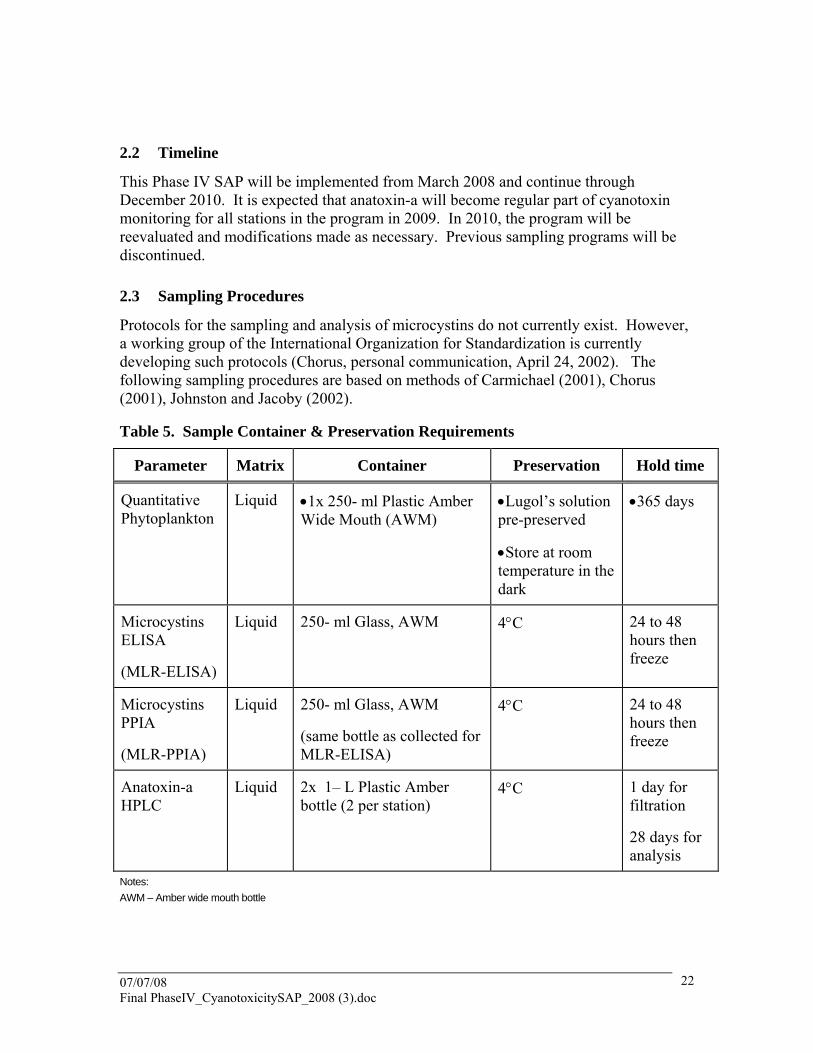
Table 5. Sample Container & Preservation Requirements
Parameter Matrix Container Preservation Hold time
Quantitative Phytoplankton
Liquid •1x 250- ml Plastic Amber Wide Mouth (AWM)
•Lugol’s solution pre-preserved
•Store at room temperature in the dark
•365 days
Microcystins ELISA
(MLR-ELISA)
Liquid 250- ml Glass, AWM 4°C 24 to 48 hours then freeze
Microcystins PPIA
(MLR-PPIA)
Liquid 250- ml Glass, AWM
(same bottle as collected for MLR-ELISA)
4°C 24 to 48 hours then freeze
Anatoxin-a HPLC
Liquid 2x 1– L Plastic Amber bottle (2 per station)
4°C 1 day for filtration
28 days for analysis
Notes: AWM – Amber wide mouth bottle

07/07/08 Final PhaseIV_CyanotoxicitySAP_2008 (3).doc
23
2.3.1 Water sample collection and storage procedure to test for toxins:
Samples will be collected using the site-specific collection method identified above in Section 2.1 (e.g., integrated composite or surface grab).
Integrated Composite technique: Vertically integrated composite samples are collected using a weighted length of ¾-inch tygon tubing let down vertically through the water column as done for the Routine Major Lakes sampling program. This tube is marked so that when fully extended, the distance from the mark at the water surface to the end of the tube is 10 m. The tube is plugged at the submerged end by a check valve and retrieved. The tube contains a vertically integrated sample of the lake from surface to 10 meters. The sample is decanted into a stainless steel bowl and homogenized before sub-sampling for microcystin, chl-a, pheo-a and phytoplankton enumeration. If more than one tube is collected, combine the water in the steel bowl prior to filling sample containers. Aliquots for microcystin analysis will be poured into a 250 mL glass AWM bottle, leaving some headspace for freezing. The sample bottle should not be pre-rinsed with sample.
Swimming Beach surface grabs: For surface grabs, fill the 250 mL glass, AWM bottle by dipping the bottle mouth-down into the water. With a sweeping arch, collect water from approximately (my arm is not 2 meter long – let’s say about 1 ½ feet below the surface, leaving some headspace to allow for freezing.
Other sampling protocol notes:
• Label the bottles if not pre-labeled.
• Place the sample bottles in a cooler with ice packs (no preservative required).
• Sub-samples will be removed from the 250 mL glass bottle and frozen within 24 to 48 hours of arrival at the KCEL. Bottles and vials should be slanted to prevent breakage during freezing. Samples must be stored frozen for a minimum of 12 hours to insure complete freezing of the sample.
2.3.2 Water sample collection and storage procedure for quantitative identification of cyanobacteria.
Quantitative cyanobacteria identification and enumeration will be conducted at the three Major Lake stations as part of this Phase IV SAP for Toxic Cyanobacteria (Table 3 and Table A). Quantitative phytoplankton identification and enumeration will be conducted by KCEL.
In addition, samples for quantitative identification and enumeration will be collected and preserved at the designated Swimming Beach sites in the event that high microcystin and/or anatoxin-a concentrations warrant further investigation. A 250 mL aliquot will be collected and placed in properly labeled opaque bottles (typically 250 mL plastic amber wide mouth) and preserved with a sufficient amount of concentrated Lugol’s solution to turn the sample light red; typically 1.75ml Lugol’s is the preferred amount for 250 mL bottle. Care should be taken that samples are covered tightly and stored in the dark until analyzed.
07/07/08 Final PhaseIV_CyanotoxicitySAP_2008 (3).doc
24
In the event that algal blooms are sampled (as per #3 in section 2.1), samples will be collected and preserved as described above.
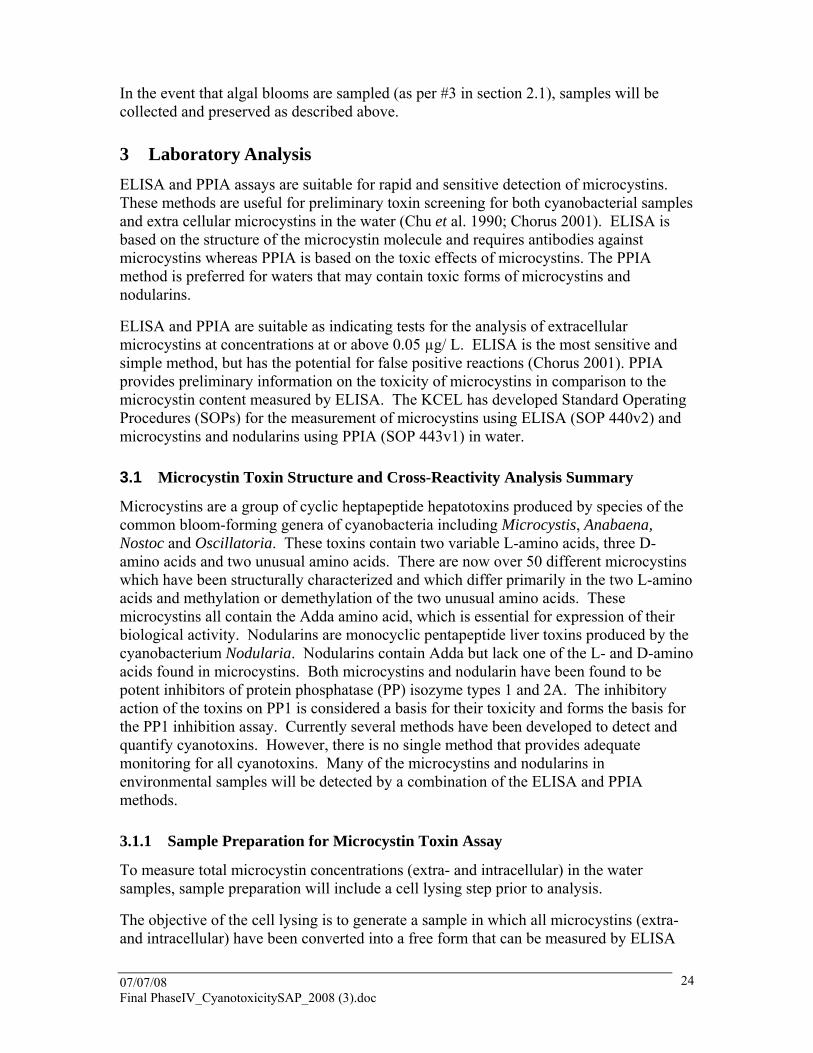
3 Laboratory Analysis ELISA and PPIA assays are suitable for rapid and sensitive detection of microcystins. These methods are useful for preliminary toxin screening for both cyanobacterial samples and extra cellular microcystins in the water (Chu et al. 1990; Chorus 2001). ELISA is based on the structure of the microcystin molecule and requires antibodies against microcystins whereas PPIA is based on the toxic effects of microcystins. The PPIA method is preferred for waters that may contain toxic forms of microcystins and nodularins.
ELISA and PPIA are suitable as indicating tests for the analysis of extracellular microcystins at concentrations at or above 0.05 µg/ L. ELISA is the most sensitive and simple method, but has the potential for false positive reactions (Chorus 2001). PPIA provides preliminary information on the toxicity of microcystins in comparison to the microcystin content measured by ELISA. The KCEL has developed Standard Operating Procedures (SOPs) for the measurement of microcystins using ELISA (SOP 440v2) and microcystins and nodularins using PPIA (SOP 443v1) in water.
3.1 Microcystin Toxin Structure and Cross-Reactivity Analysis Summary
Microcystins are a group of cyclic heptapeptide hepatotoxins produced by species of the common bloom-forming genera of cyanobacteria including Microcystis, Anabaena, Nostoc and Oscillatoria. These toxins contain two variable L-amino acids, three D-amino acids and two unusual amino acids. There are now over 50 different microcystins which have been structurally characterized and which differ primarily in the two L-amino acids and methylation or demethylation of the two unusual amino acids. These microcystins all contain the Adda amino acid, which is essential for expression of their biological activity. Nodularins are monocyclic pentapeptide liver toxins produced by the cyanobacterium Nodularia. Nodularins contain Adda but lack one of the L- and D-amino acids found in microcystins. Both microcystins and nodularin have been found to be potent inhibitors of protein phosphatase (PP) isozyme types 1 and 2A. The inhibitory action of the toxins on PP1 is considered a basis for their toxicity and forms the basis for the PP1 inhibition assay. Currently several methods have been developed to detect and quantify cyanotoxins. However, there is no single method that provides adequate monitoring for all cyanotoxins. Many of the microcystins and nodularins in environmental samples will be detected by a combination of the ELISA and PPIA methods.
3.1.1 Sample Preparation for Microcystin Toxin Assay
To measure total microcystin concentrations (extra- and intracellular) in the water samples, sample preparation will include a cell lysing step prior to analysis.
The objective of the cell lysing is to generate a sample in which all microcystins (extra- and intracellular) have been converted into a free form that can be measured by ELISA

07/07/08 Final PhaseIV_CyanotoxicitySAP_2008 (3).doc
25
and PPIA, thus providing a close approximation of the total concentration in the ambient sample (extra- and intracellular). The resulting concentration should be representative of a recreational exposure in which a swimmer ingests ambient water and cells as a combined dose. If samples were analyzed without lysing, results would be reported as Extracellular Microcystins. Since all samples collected for this study will be analyzed following lysing, results will be reported as Total Microcystins. Note ELISA measures only free microcystin, not the amount chemically bound to the cell or molecular components such as protein phosphatase enzymes.
Based on previous cyanobacteria toxin work done, laboratory staff recommended combining extraction methods. Therefore, each sample will be prepared for analysis by the following lysing process:
• 10-ml aliquots will be frozen for a minimum of 12 hours and then
• Thawed at room temperature and then immediately sonicated (ultrasonic disruption) using the Vibra Cell Sonicator.
• Samples will be filtered through a 0.45 μm filter prior to analysis.
NOTE: Green pigments and associated substances in 0.45 μm filtrate can mask the presence of microcystins. Additional filtration to 5000 nominal molecular weight limit (NMWL) will be performed when the filtrate appears colored to remove pigments and associated substances that may interfere with the assay. Since the ELISA requires 50 μL per replicate, a scaled up version of the ultra filtration system, perhaps including centrifugation, may be most efficient (see attachment for further discussion). The method detection limit (MDL) is 0.05 µg/L as microcystin-LR equivalents. MDL for the PPIA is 0.1 μg/L as microcystin-LR equivalents.
Holding times for microcystin analysis in frozen samples have not been established to date. Other studies have shown that microcystins do not readily degrade in frozen samples (Chorus, personal communication, April 24, 2002). Deep-freezing samples that have been freeze-dried will ensure sample preservation; however, even wet-frozen samples demonstrate no substantial loss in microcystin concentration over months or years. Storage of dried samples at air temperature should be avoided because absorbed moisture from the air may activate the bacteria (Chorus, personal communication, April 24, 2002). Based on KCEL SOP(s) 440v2 and 443v1, a conservative holding time for frozen samples of 7 days will be employed. Holding times for the filtrate at 4 ºC are being determined.
3.1.2 Microcystins– ELISA
The ELISA test kit uses polyclonal antibodies that bind either microcystins or a microcystin-enzyme conjugate. Microcystins in the sample compete with the microcystin-enzyme conjugate for a limited number of antibody binding sites. Since the same number of antibody binding sites are available on every test well, and each test well receives the same number of microcystin-enzyme conjugate molecules, a sample that contains a low concentration of microcystins allows the antibody to bind many microcystin-enzyme conjugate molecules. The result is a dark blue solution. Conversely,

07/07/08 Final PhaseIV_CyanotoxicitySAP_2008 (3).doc
26
a high concentration of microcystins allows fewer microcystin-enzyme conjugate molecules to be bound by the antibodies, resulting in a lighter blue solution. The plate kit does not differentiate between microcystin-LR and other microcystin variants but detects their presence to differing degrees. At 50% inhibition the concentrations are: MC-LR 0.31 μg/L, MC-RR 0.32 μg/L, MC-YR 0.38 μg/L and NODLN 0.47 μg/L.
3.1.3 Microcystins –PPIA
The enzyme protein phosphatase is inhibited in a concentration-dependent manner by microcystins. Subsequent exposure of the enzyme to a substrate that forms a colored product reveals the degree of enzyme inhibition. Comparison of sample results with those of known standards quantifies the level of microcystins in the sample.
3.2 Anatoxin-a Toxin Structure and Cross-Reactivity Analysis Summary
The neurotoxin anatoxin-a is an alkaloid with high toxicity (LD50 i.p. mouse 200 μg/kg). It acts as a post-synaptic, depolarizing, neuromuscular blocking agent. There is evidence that anatoxin-a can be produced by some species of Anabaena, Aphanizomenon, Cylindrospermum and Oscillatoria.
The determination of anatoxin-a in natural waters has been challenging due to its typically low concentration. The highly sensitive method adapted at KCEL uses fluorimetric derivatization with HPLC. Anatoxin-a is converted into a fluorescent derivative using 4-fluoro-7-nitro-2,1,3-benzoxadiazole and the fluorescent compound is then separated and detected by HPLC. Further increase in sensitivity is accomplished by concentrating the algal cells on a filter. This method will thus only measure intracellular toxin. Since anatoxin-a is easily degraded once outside the cell, we can assume that the filtration step will retain most or all of the active toxin present in the sample.
3.2.1 Sample Preparation for Anatoxin-a Toxin Assay
Anatoxin-a degrades readily, especially in sunlight and at high pH. At KCEL the bottles are immediately transferred to a 4 °C chamber. The samples are filtered onto glass fiber filters (45 mm Whatman 934-AH) within 24 hours of arrival and the filters stored in cryovials at -20 °C (2 filters per station). The filtrate is discarded.
KCEL is in the process of developing a SOP for the measurement of anatoxin-a in water samples using isocratic HPLC with fluorescence detection. The method will be under development during the 2008 season. The reference method is James et al. (1998).
Extraction: Anatoxin-a is extracted from cells by treating the filter with 100% methanol (freezing and sonication). The extract may or may not be dried prior to derivatization. Alternatively, a whole water sample is extracted, cleaned and concentrated using a weak cation exchange solid phase extraction column. The resulting extract is evaporated under nitrogen and stored at -20 °C.
Derivatization: Dried samples or standards are derivatized with 4-Fluoro-7-nitro-2,1,3-benzoxadiazole (NBD-F) following the method of James et al. (1998). The reaction is
07/07/08 Final PhaseIV_CyanotoxicitySAP_2008 (3).doc
27
terminated at 60 minutes, when samples are centrifuged or filtered and transferred to autosampler vials.
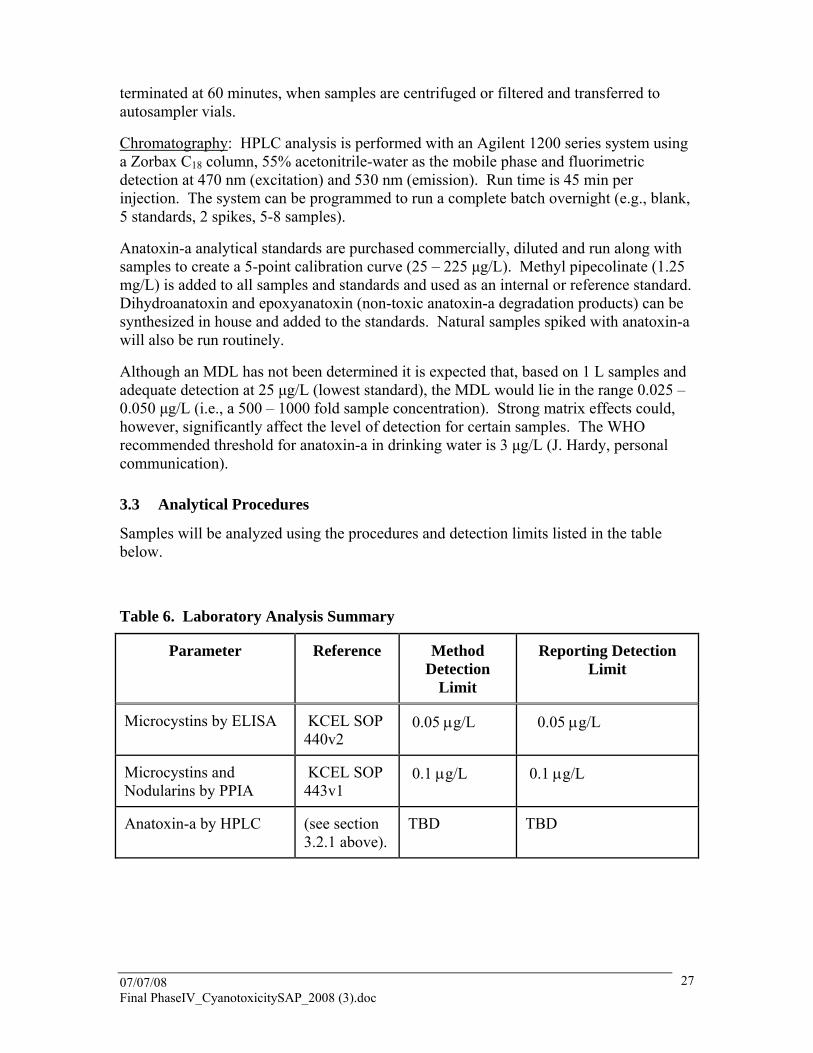
Chromatography: HPLC analysis is performed with an Agilent 1200 series system using a Zorbax C18 column, 55% acetonitrile-water as the mobile phase and fluorimetric detection at 470 nm (excitation) and 530 nm (emission). Run time is 45 min per injection. The system can be programmed to run a complete batch overnight (e.g., blank, 5 standards, 2 spikes, 5-8 samples).
Anatoxin-a analytical standards are purchased commercially, diluted and run along with samples to create a 5-point calibration curve (25 – 225 μg/L). Methyl pipecolinate (1.25 mg/L) is added to all samples and standards and used as an internal or reference standard. Dihydroanatoxin and epoxyanatoxin (non-toxic anatoxin-a degradation products) can be synthesized in house and added to the standards. Natural samples spiked with anatoxin-a will also be run routinely.
Although an MDL has not been determined it is expected that, based on 1 L samples and adequate detection at 25 μg/L (lowest standard), the MDL would lie in the range 0.025 – 0.050 μg/L (i.e., a 500 – 1000 fold sample concentration). Strong matrix effects could, however, significantly affect the level of detection for certain samples. The WHO recommended threshold for anatoxin-a in drinking water is 3 μg/L (J. Hardy, personal communication).
3.3 Analytical Procedures
Samples will be analyzed using the procedures and detection limits listed in the table below.
Table 6. Laboratory Analysis Summary
Parameter Reference Method Detection
Limit
Reporting Detection Limit
Microcystins by ELISA KCEL SOP 440v2
0.05 μg/L 0.05 μg/L
Microcystins and Nodularins by PPIA
KCEL SOP 443v1
0.1 μg/L 0.1 μg/L
Anatoxin-a by HPLC (see section 3.2.1 above).
TBD TBD

07/07/08 Final PhaseIV_CyanotoxicitySAP_2008 (3).doc
28
4 Data Quality Objectives The procedures and practices described in this studyspecific SAP are designed to generate data of sufficient quality to support decision making as discussed above and in the Major Lakes Monitoring Program SAP; King County, 2005. Critical elements of laboratory data quality objectives are discussed in this section. Procedures to attain these data quality objectives are discussed throughout this document. In particular, Section 7.0, Quality Control Procedures, addresses many of the procedures necessary to obtain data that meet these data quality objectives.
4.1.1 Laboratory Precision
Laboratory precision will be assessed using laboratory duplicate QC samples. When both sample results are at or exceed the MDL the RPD (relative percent difference) should be less than 25 %. An RPD cannot be determined unless both values are at or above the MDL since no values are reported if <MDL. Note that the MDL and the Reporting Detection Limit (RDL) are the same for both the ELISA and PPIA.
If one value is >MDL and the other <MDL, a RPD is still calculated using zero for the less <MDL value.
4.1.2 Field Precision
Information regarding the precision of sampling procedures will be obtained by collecting field replicates. The data user should take the information obtained by collecting field replicates into account when making decisions based on data generated under this SAP.
4.1.3 Bias
Bias is an indicator of the accuracy of analytical data. For this project, laboratory control samples or blank spikes, whichever are available, will be used to assess bias. Results should be within 20% of the true value or within the criteria provided with the purchase of the control sample.
Bias will also be assessed by the evaluation of field blank and method blank data. Analytical results for method blanks should be less than the MDL.
The use of matrix spike recovery data will provide additional information regarding method performance on actual samples. The laboratory will use professional judgment regarding assessment of data quality and any subsequent action taken as a result of matrix spike recoveries.
4.1.4 Representativeness
This survey is primarily designed to evaluate the presence/absence of cyanobacterial toxicity, and secondarily to estimate concentrations and geographic extent of the toxin distribution, should it be present. Representative samples will be obtained through the following practices:
07/07/08 Final PhaseIV_CyanotoxicitySAP_2008 (3).doc
29
• The use of generally accepted sampling procedures will allow for the collection of representative samples.
• Subsampling within the KCEL will be conducted according to lab standard operating procedures. These procedures are designed to obtain representative subsamples.
Note that additional practices to be used to obtain representative data are described in the site specific SAP; Major Lakes Monitoring Program SAP, King County, released in 2005.
4.1.5 Comparability
Data comparability will be obtained through the use of standard sampling procedures and analytical methods. Additionally, adherence to the procedures and QC approach contained in this SAP will provide for comparable data throughout the duration of this project. Before making changes to sample collection, storage or analysis procedures, each must be evaluated to verify that comparability will not be compromised.
4.1.6 Completeness
Completeness will be evaluated by the following criteria:
• The number of usable data points compared to the projected data points as detailed in this SAP.
• Compliance with the data quality criteria as presented in this section.
• Compliance with specified holding times.
The goal for the above criteria is to obtain 100% data completeness. However, where data are not complete, decisions regarding re-sampling and/or re-analysis will be made by a collaborative process involving both data users and data generators. These decisions will take into account the project data quality objectives as presented above.
5 Data Reduction, Review, and Reporting Data reduction, review and reporting will be performed under the KCEL’s standard operating procedures. Laboratory data will be provided to data recipients within 30 days of sample receipt or within 30 days of the decision to analyze archived samples. Data reports will include sufficient information to conduct the data assessment. Field measurements will also undergo standard review and reporting procedures. Data will be reported in the standard laboratory-reporting format. This includes an analytical result, MDL and RDL, if available. Protocols will be worked out with the KCEL for the rapid turn around of selected samples in the event of a bloom episode that could have potential public health implications. Preliminary project data, required in the event of a bloom episode that

07/07/08 Final PhaseIV_CyanotoxicitySAP_2008 (3).doc
30
could have potential public health implications, will be reported using KCEL Preliminary Data Reporting Form followed by final data as soon as practical. Final project data will be presented to the project and program managers in a format that may include the following:
• KCEL Comprehensive Reports consisting of spreadsheets of analytical and field parameters;
• Case narratives for ELISA and PPIA results prepared by the Aquatic Toxicology Unit;
• Unit narratives of chemistry and microbiology data including supporting QC documentation (provided by the KCEL) in the event of analytical or data anomalies.
• Cyanobacteria identification and biovolume determinations conducted by KCEL, as KCEL SOP 544v0.
6 Project Organization Project team members and their responsibilities are summarized below. All team members are staff of the King County Department of Natural Resources and Parks, Water and Land Resources Division.
Table 7. Project Team Members
Name/Telephone Title Affiliation Responsibility
Katherine Bourbonais (206) 684-2382
Laboratory Project Manager
Environmental Laboratory
Coordination of analytical activities, lab QA/QC and data reporting.
David Robinson (206) 684-2329
Environmental Scientist
Environmental Laboratory
Coordination of sampling activities, field QA/QC, and field analyses for the Major Lakes Program
Judy Ochs (206) 684-2347
Environmental Scientist
Environmental Laboratory
Coordination of sampling activities, field QA/QC, and field analysis for the Swimming Beach Program
Debra Bouchard (206) 263-6343
Water Quality Planner
Water & Land Resources
Project manager for the Toxic Cyanobacteria

07/07/08 Final PhaseIV_CyanotoxicitySAP_2008 (3).doc
31
Study, coordination between various groups at the lab
Colin Elliott (206) 684-2343
Quality Assurance Officer
Environmental Laboratory
Overall laboratory QA/QC.
Gabriela Hannach (206) 684-2301
Aquatic Toxicologist
Environmental Laboratory
Coordination of toxicity analysis; Anatoxin-a method development
Jim Buckley (206) 684-2314
Aquatic Toxicologist
Environmental Laboratory
PPIA, Anatoxin-a method development
7 Quality Control Procedures
7.1 Field Quality Control Procedures
Over the course of this project, field QC samples will be collected at the frequency listed below. It is recommended that a set of field QC samples be collected during the first sampling effort to provide an initial indication of field sampling precision and bias.
Table 8. Field Quality Control Samples
Type of Quality Control Sample
Description Frequency
Field Replicate
A second sample generated from the same sampling location as the initial sample, but from a second sampler deployment. Used as an indicator of field sampling precision.
Over the course of the project, 1 per sampling event, done at a random site. If more than 20 sites are done in a day, 2 field replicates should be collected.
7.1.1 QC Practices for Field Measurements
Sampling for this Toxic Cyanobacteria Study is conducted concurrently with the Routine/Ambient Major Lakes Monitoring program and the Swimming Beach Monitoring Program. Therefore QA practices are covered under those SAPs/SOPs.
7.2 Laboratory Quality Control Procedures
The KCEL is accredited by the Washington State Department of Ecology. As a requirement of this accreditation, the lab is audited by the Washington State Department

07/07/08 Final PhaseIV_CyanotoxicitySAP_2008 (3).doc
32
of Ecology. Additionally, the KCEL participates regularly in US EPA inter-laboratory performance evaluation studies.
7.2.1 Frequency of quality control samples
All samples will be analyzed at the KCEL. The frequency of quality control samples to be performed for this project is shown in the following table. QC samples shown below may not be available for all lab analyses.
Table 9. Laboratory Quality Control Samples (microcystins and anatoxins only)
Type of Quality Control Sample
Description Frequency
Method Blank An aliquot of clean reference matrix carried through the analytical process and used as an indicator of contamination.
1 per sample batch. Maximum sample batch size equals 20 samples.
Laboratory Control Sample
Solution of known analyte concentration, processed through the entire analytical procedure and used as an indicator of method accuracy and precision.
1 per sample batch, as available. Maximum sample batch size equals 20 samples.
Spike Blank Known concentration of target analyte(s) introduced to clean reference matrix, processed through the entire analytical procedure and used as an indicator of method performance.
Used if a laboratory control sample is not available.
1 per sample batch. Maximum sample batch size equals 20 samples.
Matrix Spike Known concentration of target analyte(s) introduced to a separate portion of sample, processed through the entire analytical procedure and used as an indicator of method performance.
1 per sample batch. Maximum sample batch size equals 20 samples.
07/07/08 Final PhaseIV_CyanotoxicitySAP_2008 (3).doc
33
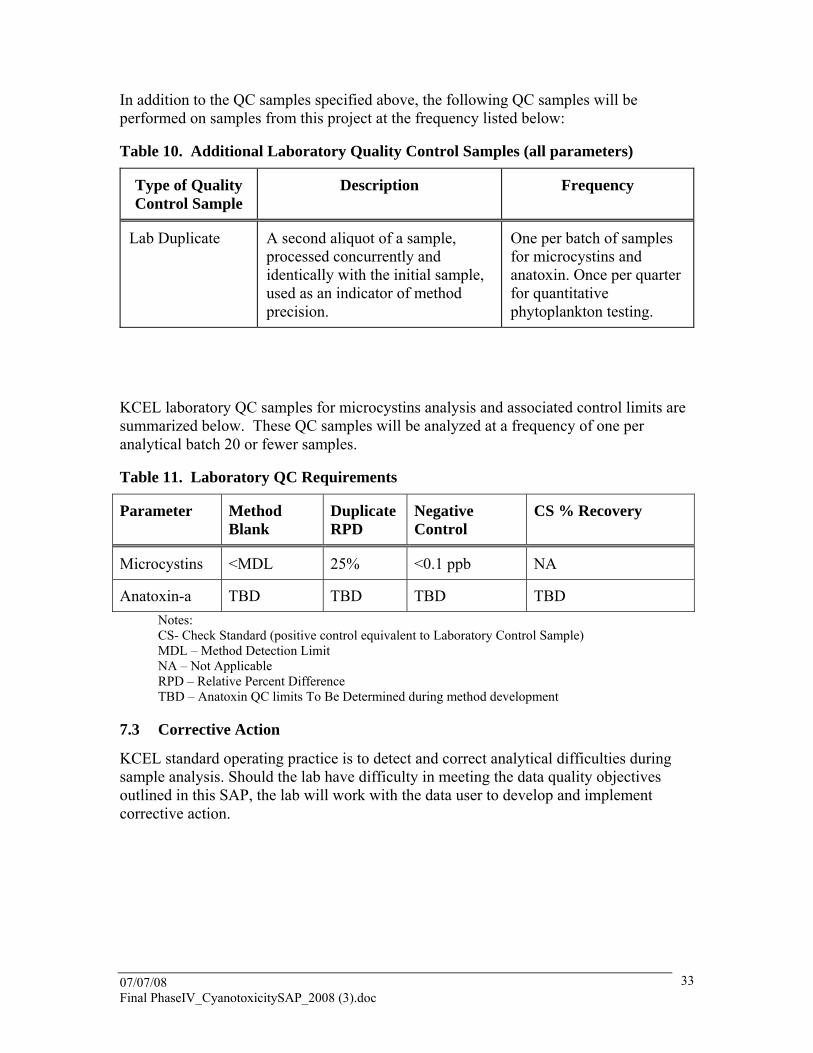
In addition to the QC samples specified above, the following QC samples will be performed on samples from this project at the frequency listed below:
Table 10. Additional Laboratory Quality Control Samples (all parameters)
Type of Quality Control Sample
Description Frequency
Lab Duplicate A second aliquot of a sample, processed concurrently and identically with the initial sample, used as an indicator of method precision.
One per batch of samples for microcystins and anatoxin. Once per quarter for quantitative phytoplankton testing.
KCEL laboratory QC samples for microcystins analysis and associated control limits are summarized below. These QC samples will be analyzed at a frequency of one per analytical batch 20 or fewer samples.
Table 11. Laboratory QC Requirements
Parameter Method Blank
Duplicate RPD
Negative Control
CS % Recovery
Microcystins <MDL 25% <0.1 ppb NA
Anatoxin-a TBD TBD TBD TBD Notes: CS- Check Standard (positive control equivalent to Laboratory Control Sample) MDL – Method Detection Limit NA – Not Applicable RPD – Relative Percent Difference TBD – Anatoxin QC limits To Be Determined during method development
7.3 Corrective Action
KCEL standard operating practice is to detect and correct analytical difficulties during sample analysis. Should the lab have difficulty in meeting the data quality objectives outlined in this SAP, the lab will work with the data user to develop and implement corrective action.
07/07/08 Final PhaseIV_CyanotoxicitySAP_2008 (3).doc
34
8 References
Botana, L. 2007. Phycotoxins. Chemistry and Biochemistry. Blackwell Publishing. ISBN-13: 978-0-8138-2700-1. 345 pp.
Carmichael, W.W. & P.R. Gorham. 1981. The mosaic nature of toxic blooms of cyanobacteria. In Carmichael, W.W. (e.), The Water Environment: Algal Toxins and Health. Plenum Press, New York (NY): 161-172.
Carmichael, W. W. 1994. The toxins of cyanobacteria. Sci. Am. 270:78-86.
Carmichael, W.W. 2001. Assessment of Blue-green Algal Toxins in Raw and Finished Drinking Water. American Water Works Association Research Foundation. 179 pp.
Chorus, I. (ed.). 2001. Cyanotoxins. Springer-Verlag, Berlin, Germany, 357 pp.
Chorus, I. 24 April 2002. Personal Communication (e-mail to Jean Jacoby, Seattle University). Federal Environmental Agency, Berlin, Germany.
Chorus, I., & J. Bartram (eds). 1999. Toxic Cyanobacteria in Water: A Guide to Their Public Health Consequences, Monitoring and Management. Published on behalf of WHO by E & FN Spon, London, UK, 416 pp.
Chorus, I., I.R. Falconer, H.J. Salas & J. Bartram. 2000. Health risks caused by freshwater cyanobacteria in recreational waters. J. Toxicol. Environ. Health. B. Crit. Rev. 4:323-347.
Chu, F. S., X. Huang & R. D. Wei. 1990. Enzyme-linked immunosorbent assay for microcystins in blue-green algal blooms. J. Assoc. Off. Anal. Chem. 73:451-456.
Ecology 2007. Freshwater Algae Control Program – Report to the Washington State Legislature (2006 – 2007). Washington State Department of Ecology publication 07-10-093 December 1, 2007
Falconer, I.R.. 1998. Algal toxins and human health. In: J. Hrubec (ed) Quality and Treatment of Drinking Water II. The Handbook of Environmental Chemistry, Vol. 5, Part C, p.53-82. Springer-Verlag, Berlin, Germany
Fastner, J., U. Neumann, B. Wirsing, J. Weckesser, C. Wiedner, B. Nixdorf & I. Chorus, 1999. Microcystins (hepatotoxic heptapeptides) in German fresh water bodies. Environ. Toxicol. 14:13-22.
Jacoby, J. M., H. L. Gibbons, R. Hanowell & D. D. Bouchard. 1994. Wintertime blue-green algal toxicity in a mesotrophic lake. Freshwat. Ecol. 9:241-251.
Jacoby, J. M., D. C. Collier, E. B. Welch, F. J. Hardy & M. Crayton. 2000. Environmental factors associated with a toxic bloom of Microcystis aeruginosa. Can. J. Fish. Aquat. Sci. 57:231-240.

07/07/08 Final PhaseIV_CyanotoxicitySAP_2008 (3).doc
35
James KJ, A Furey, IR Sherlock, MA Stack, M Twohig, FB Caudwell, OM Skulberg, 1998. Sensitive determination of anatoxin-a, homoanatoxin-a and their degradation products by liquid chromatography with fluorimetric detection. J. Chromatogr. A 798:147-157.
Johnston, B. R. & J.M. Jacoby. 2003 Cyanobacterial toxicity and migration in a mesotrophic lake in western Washington, USA. Hydrobiologia495:79-91.
Jacoby, J.M., J. Kahn. 2007. The occurrence and response to toxic cyanobacteria in the Pacific Northwest, North America. Lake and Reservoir Management 23:123-143, 2007.
King County DNRP. 2003. Major Lakes Phytoplankton Sampling and Analysis Project Plan. Prepared by Curtis DeGasperi, King County Waste Water Treatment Division for SWAMP.
King County DNRP. 2003. Sampling and Analysis Plan for Toxic Cyanobacteria in Lake Washington, Lake Sammamish, and Lake Union. Prepared by Debra Bouchard, King County Water and Land Resources Division for SWAMP.
King County DNRP. February 2005. Phase II Sampling and Analysis Plan for Toxic Cyanobacteria in Lake Washington, Lake Sammamish, and Lake Union. Prepared by Debra Bouchard, King County Water and Land Resources Division.
King County DNRP. March 2006. Addendum Phase II Sampling and Analysis Plan for Toxic Cyanobacteria in Lake Washington, Lake Sammamish, and Lake Union. Prepared by Debra Bouchard, King County Water and Land Resources Division.
King County DNRP. March 2007. Sampling and Analysis Plan -Phase III for Toxic Cyanobacteria in Lake Washington, Lake Sammamish, and Lake Union. Prepared by Debra Bouchard, King County Water and Land Resources Division.
WaDOH. 2008. DRAFT Washington State Recreational Guidance for Microcystins (Provisional) and Anatoxin-a (Intermediate). May 2008. Report prepared by Joan Hardy, Washington State Dpartment of Health.
Sivonen, K. & J. Jones. 1999. Cyanobacterial toxins. In: I. Chorus and J. Batram (eds) Toxic Cyanobacteria in Water: A Guide to their Public Health Consequences, Monitoring and Management. p. 41-111. Published on behalf of WHO by E & FN Spon, London, UK, 416 pp.
World Health Organization (WHO). 1998. Guidelines for Drinking-Water Quality. 2nd ed. Addendum to Vol 2, Health Criteria and other Supporting Information. WHO, Geneva.
Yu, S. -H. 1989. Drinking water and primary liver cancer. In Tang, Z. Y., M. C. Wu & S. S. Xia (eds), Primary Liver Cancer. China Academic Publishers/Springer, New York (NY):30-37.
07/07/08 Final PhaseIV_CyanotoxicitySAP_2008 (3).doc
36
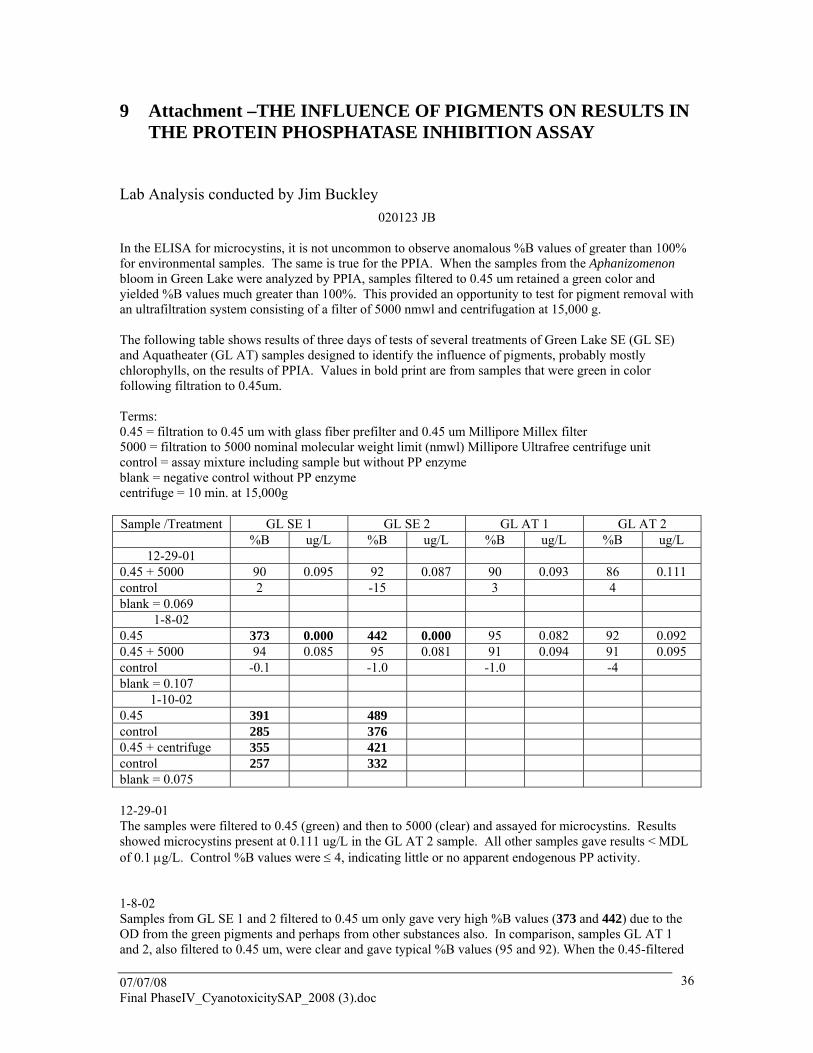
9 Attachment –THE INFLUENCE OF PIGMENTS ON RESULTS IN THE PROTEIN PHOSPHATASE INHIBITION ASSAY
Lab Analysis conducted by Jim Buckley 020123 JB
In the ELISA for microcystins, it is not uncommon to observe anomalous %B values of greater than 100% for environmental samples. The same is true for the PPIA. When the samples from the Aphanizomenon bloom in Green Lake were analyzed by PPIA, samples filtered to 0.45 um retained a green color and yielded %B values much greater than 100%. This provided an opportunity to test for pigment removal with an ultrafiltration system consisting of a filter of 5000 nmwl and centrifugation at 15,000 g. The following table shows results of three days of tests of several treatments of Green Lake SE (GL SE) and Aquatheater (GL AT) samples designed to identify the influence of pigments, probably mostly chlorophylls, on the results of PPIA. Values in bold print are from samples that were green in color following filtration to 0.45um. Terms: 0.45 = filtration to 0.45 um with glass fiber prefilter and 0.45 um Millipore Millex filter 5000 = filtration to 5000 nominal molecular weight limit (nmwl) Millipore Ultrafree centrifuge unit control = assay mixture including sample but without PP enzyme blank = negative control without PP enzyme centrifuge = 10 min. at 15,000g Sample /Treatment GL SE 1 GL SE 2 GL AT 1 GL AT 2 %B ug/L %B ug/L %B ug/L %B ug/L
12-29-01 0.45 + 5000 90 0.095 92 0.087 90 0.093 86 0.111 control 2 -15 3 4 blank = 0.069
1-8-02 0.45 373 0.000 442 0.000 95 0.082 92 0.092 0.45 + 5000 94 0.085 95 0.081 91 0.094 91 0.095 control -0.1 -1.0 -1.0 -4 blank = 0.107
1-10-02 0.45 391 489 control 285 376 0.45 + centrifuge 355 421 control 257 332 blank = 0.075 12-29-01 The samples were filtered to 0.45 (green) and then to 5000 (clear) and assayed for microcystins. Results showed microcystins present at 0.111 ug/L in the GL AT 2 sample. All other samples gave results < MDL of 0.1 μg/L. Control %B values were ≤ 4, indicating little or no apparent endogenous PP activity. 1-8-02 Samples from GL SE 1 and 2 filtered to 0.45 um only gave very high %B values (373 and 442) due to the OD from the green pigments and perhaps from other substances also. In comparison, samples GL AT 1 and 2, also filtered to 0.45 um, were clear and gave typical %B values (95 and 92). When the 0.45-filtered

07/07/08 Final PhaseIV_CyanotoxicitySAP_2008 (3).doc
37
GL SE 1 and 2 samples were further treated by filtration to 5000 nmwl thereby removing the green color and putative other substances, the %B values were reduced from 373 to 94 and 442 to 95. This indicates that the 5000 nmwl filtration step is effective in removal of pigments and other substances that can confound results of the PPIA. Filtration of GL AT 1 and 2 to 5000 nmwl only slightly changed the % B values (95 to 91 and 92 to 91) and resulting levels of microcystins. Control values for these samples were all very low (-0.1 to -1.0). 1-10-02 Samples were green following filtration to 0.45 um only. Subtraction of the control (without PP) from the assay (with PP) yields values (mean = 102) that are close to the negative control (with PP) indicating little or no endogenous PP activity in these samples. GL SE 1: 391 – 285 = 106 A % B value of ≈ 100 indicates a sample reading ≈ negative control 355 – 257 = 98 GL SE 2: 489 – 376 = 113 421 – 332 = 89 Centrifugation alone yielded a small white button for both samples. However, the high %B values were only reduced by 9 to 14 %, indicating that only a small amount of the high OD is due to particulates. GL SE 1: 391 – 355 = 36 or 9% of %B is removable by centrifugation GL SE 2: 489 – 421 = 68 or 14% of %B is removable by centrifugation Conclusions 1. Green pigments and associated substances in 0.45 um filtrate give artificially high %B values that can mask the presence of microcystins. 2. Filtration to 0.45 um and then to 5000 nmwl removed these pigments and associated substances that, in this case, gave high %B values that could mask otherwise detectable levels of microcystins. 3. It is useful to run Controls to check for apparent endogenous protein phosphatase activity in samples. In the present samples, there was no apparent protein phosphatase activity. 4. Centrifugation only of samples previously filtered to 0.45 um showed that 9 to 14 % of the high %B values was due to particulates amenable to removable by filtration. 5. For the Green Lake SE samples, the yield from the ultrafiltration system was 120 uL each which was adequate for the PPIA which requires 20 uL per replicate. To be useful for the ELISA which requires 100 uL per replicate, a scaled up version of the ultrafiltration system, perhaps including centrifuge, would be most efficient.
07/07/08 Final PhaseIV_CyanotoxicitySAP_2008 (3).doc
38
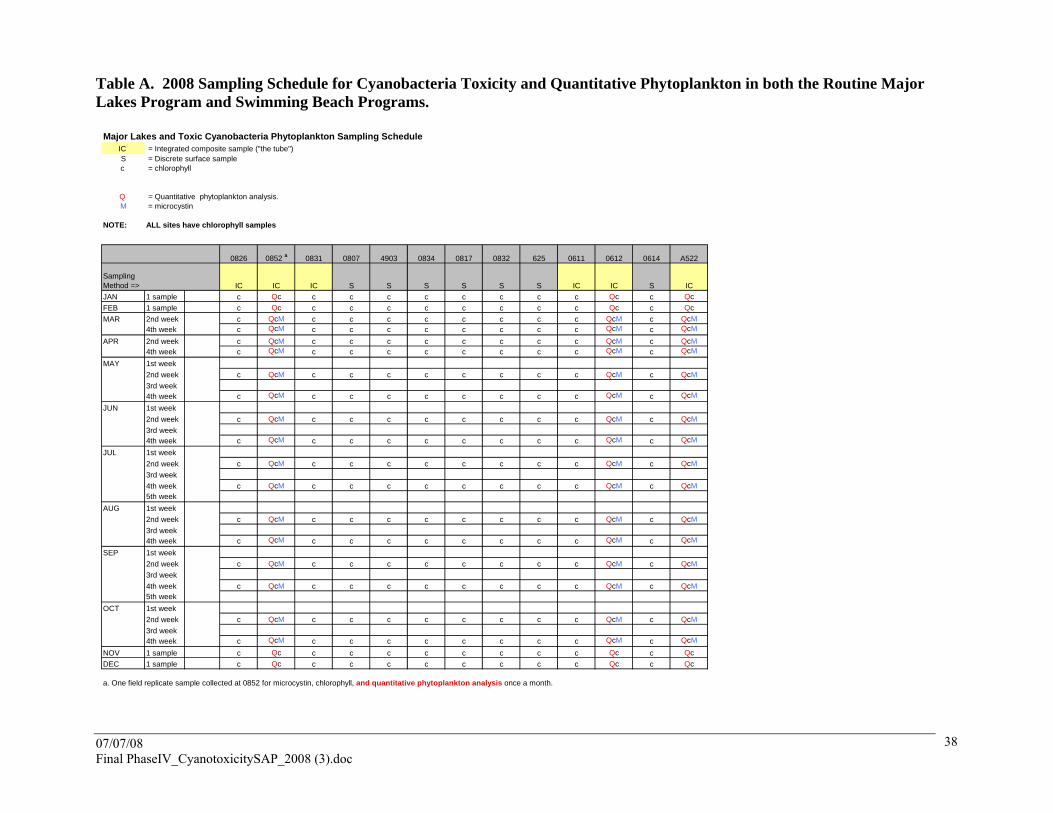
Table A. 2008 Sampling Schedule for Cyanobacteria Toxicity and Quantitative Phytoplankton in both the Routine Major Lakes Program and Swimming Beach Programs.
Major Lakes and Toxic Cyanobacteria Phytoplankton Sampling ScheduleIC = Integrated composite sample ("the tube")S = Discrete surface samplec = chlorophyll
Q = Quantitative phytoplankton analysis. M = microcystin
NOTE: ALL sites have chlorophyll samples
0826 0852 a 0831 0807 4903 0834 0817 0832 625 0611 0612 0614 A522
Sampling Method => IC IC IC S S S S S S IC IC S ICJAN 1 sample c Qc c c c c c c c c Qc c QcFEB 1 sample c Qc c c c c c c c c Qc c QcMAR 2nd week c QcM c c c c c c c c QcM c QcM
4th week c QcM c c c c c c c c QcM c QcM
APR 2nd week c QcM c c c c c c c c QcM c QcM4th week c QcM c c c c c c c c QcM c QcM
MAY 1st week2nd week c QcM c c c c c c c c QcM c QcM3rd week4th week c QcM c c c c c c c c QcM c QcM
JUN 1st week2nd week c QcM c c c c c c c c QcM c QcM3rd week4th week c QcM c c c c c c c c QcM c QcM
JUL 1st week2nd week c QcM c c c c c c c c QcM c QcM3rd week4th week c QcM c c c c c c c c QcM c QcM5th week
AUG 1st week2nd week c QcM c c c c c c c c QcM c QcM3rd week4th week c QcM c c c c c c c c QcM c QcM
SEP 1st week2nd week c QcM c c c c c c c c QcM c QcM3rd week4th week c QcM c c c c c c c c QcM c QcM5th week
OCT 1st week2nd week c QcM c c c c c c c c QcM c QcM3rd week4th week c QcM c c c c c c c c QcM c QcM
NOV 1 sample c Qc c c c c c c c c Qc c QcDEC 1 sample c Qc c c c c c c c c Qc c Qc
a. One field replicate sample collected at 0852 for microcystin, chlorophyll, and quantitative phytoplankton analysis once a month.

07/07/08 Final PhaseIV_CyanotoxicitySAP_2008 (3).doc
39
Swimming Beach Toxic Cyanobacteria Phytoplankton Sampling Schedule** samples will be collected on alternate weeks from Major Lakes sampling
S = Discrete surface sampleH = Collect quantitative phytoplankton samples and hold pending microcystin values.a = anatoxin
M = microcystin
NOTE: phytoplankton analysis will be done only if necessary due to high microcystin concentrationsQuantitative phytoplankton samples will be analyzed by King County staff.
0805ASB 806SB* 0813SB 0818SB 0820SB 826SB 828SB 826OLA 834SB 83930SB 852SB A734WSB SD007SB SD017SB 4903SB 602SB 615SB
Sampling Method => S S S S S S S S S S S S S S S S SJAN 1 sampleFEB 1 sampleMAR 2nd week
4th weekAPR 2nd week
4th weekMAY 1st week
2nd week 13-May MH MH MH MH MH MH MH MH MH MH MH MH MH MH MH MH MH3rd week 20-May MH MH MH MH MH MH MH MH MH MH MH MH MH MH MH MH MH4th week 27-May MH MH MH MH MH MH MH MH MH MH MH MH MH MH MH MH MH
JUN 1st week 3-Jun MH MH MH MH MH MH MH MH MH MH MH MH MH MH MH MH MH2nd week 10-Jun MH MH MH MH MH MH MH MH MH MH MH MH MH MH MH MH MH3rd week 17-Jun MH MH MH MH MH MH MH MH MH MH MH MH MH MH MH MH MH4th week 24-Jun MH MH MH MH MH MH MH MH MH MH MH MH MH MH MH MH MH
JUL 1st week 1-Jul MH MH MH MH MH MH MH MH MH MH MH MH MH MH MH MH MH2nd week 8-Jul MH MH MH MH MH MH MH MH MH MH MH MH MH MH MH MH MH3rd week 15-Jul MH MH MH MH MH MH MH MH MH MH MH MH MH MH MH MH MH4th week 22-Jul MH MH MH MH MH MH MH MH MH MH MH MH MH MH MH MH MH5th week 29-Jul MH MH MH MH MH MH MH MH MH MH MH MH MH MH MH MH MH
AUG 1st week 5-Aug MH MHa MH MHa MH MH MHa MH MHa MH MH MHa MH MH MH MH MH2nd week 12-Aug MH MHa MH MHa MH MH MHa MH MHa MH MH MHa MH MH MH MH MH3rd week 19-Aug MH MHa MH MHa MH MH MHa MH MHa MH MH MHa MH MH MH MH MH4th week 26-Aug MH MHa MH MHa MH MH MHa MH MHa MH MH MHa MH MH MH MH MH
SEP 1st week 2-Sep MH MHa MH MHa MH MH MHa MH MHa MH MH MHa MH MH MH MH MH2nd week 9-Sep MH MHa MH MHa MH MH MHa MH MHa MH MH MHa MH MH MH MH MH3rd week 16-Sep MH MHa MH MHa MH MH MHa MH MHa MH MH MHa MH MH MH MH MH4th week 23-Sep MH MHa MH MHa MH MH MHa MH MHa MH MH MHa MH MH MH MH MH5th week 30-Sep MH MHa MH MHa MH MH MHa MH MHa MH MH MHa MH MH MH MH MH
OCT ** 1st week 7-Oct MH MHa MH MHa MH MH MHa MH MHa MH MH MHa MH MH MH MH MH2nd week 14-Oct MH MHa MH MHa MH MH MHa MH MHa MH MH MHa MH MH MH MH MH3rd week 21-Oct MH MHa MH MHa MH MH MHa MH MHa MH MH MHa MH MH MH MH MH4th week 28-Oct MH MHa MH MHa MH MH MHa MH MHa MH MH MHa MH MH MH MH MH
NOV 1 sampleDEC 1 sample
* One field replicate sample collected at 0806SB for microcystin analysis once a month.** Samples collected beyond swim beach program (Bob Brenner)

07/07/08 Final PhaseIV_CyanotoxicitySAP_2008 (3).doc
40
Major Lakes and Swimming Beach Toxic Cyanobacteria & Phytoplankton Sampling
Total Samples Collected per Sampling Week
# Microcystins# Phytos
ANALYZED # Microcystins# Phytos
COLLECTED#
Anatoxin
per sampling week
per sampling week
per sampling week
per sampling week
per sampling
weekJAN 1 sample 0 4FEB 1 sample 0 4MAR 2nd week 4 4
4th week 3 3APR 2nd week 4 4
4th week 3 3MAY 1st week
2nd week 4 4 18 173rd week 17 174th week 3 3 17 17
JUN 1st week 17 172nd week 4 4 18 173rd week 17 174th week 3 3 17 17
JUL 1st week 17 172nd week 4 4 18 173rd week 17 174th week 3 3 17 175th week 17 17
AUG 1st week 17 17 52nd week 4 4 18 17 53rd week 17 17 54th week 3 3 17 17 5
SEP 1st week 17 17 52nd week 4 4 18 17 53rd week 17 17 54th week 3 3 17 17 55th week 17 17 5
OCT 1st week 17 17 52nd week 4 4 18 17 53rd week 17 17 54th week 3 3 17 17 5
NOV 1 sample 4DEC 1 sample 4
nnual Total 56 72 431 425 65
Major Lakes Swim Beach