sampling
TRANSCRIPT

UNIT-II
Sample &
Sample Design
Some basic terms
• Population • Census • Sample• Sampling Unit• Sampling Frame
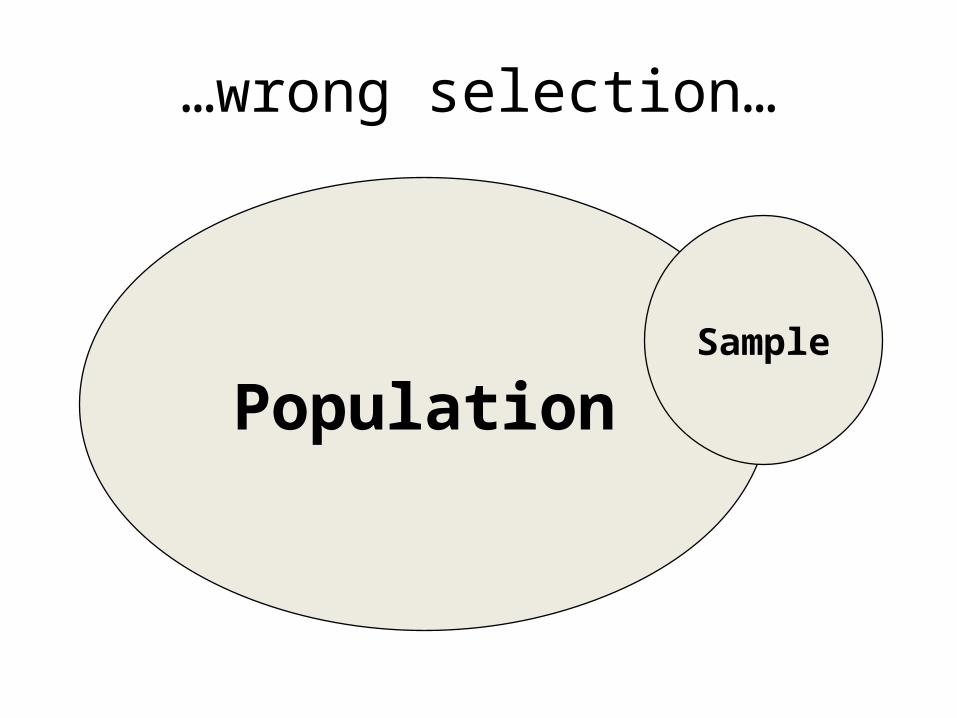
…wrong selection…
PopulationSample
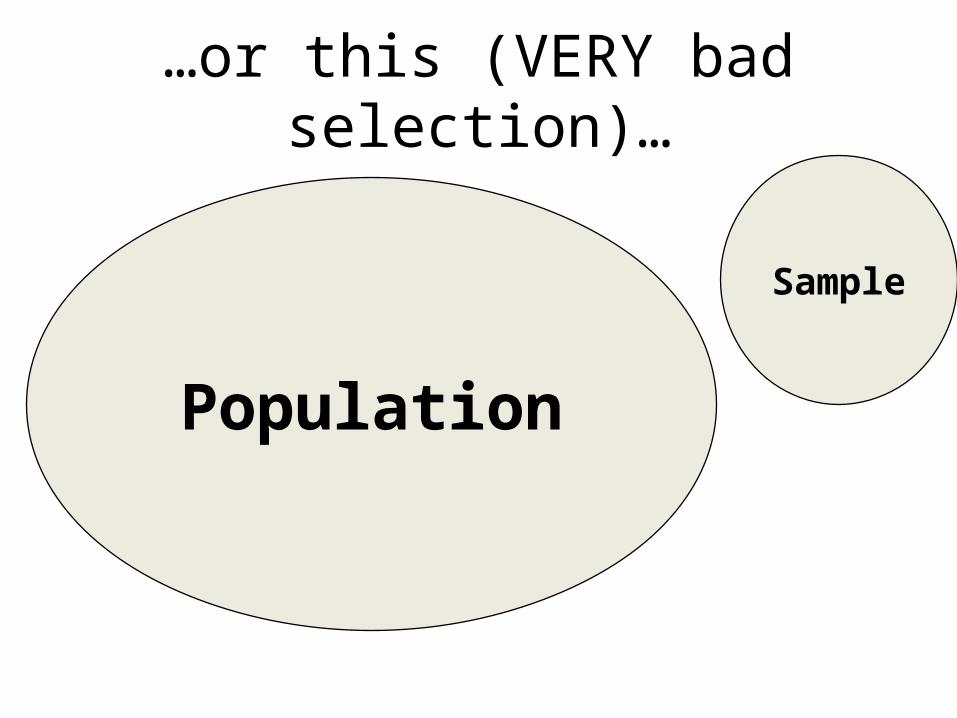
…or this (VERY bad selection)…
Population
Sample

Population Vs. SamplePopulation Vs. SamplePopulation of Interest
Sample
We measure the sample using statistics in order to drawinferences about the population and its parameters.

The process of obtaining information from a subset (sample) of a larger group (population)
The results for the sample are then used to make estimates of the larger group
Faster and cheaper than asking the entire population…..
Sampling

Advantages of Sampling • Economy• Speed• Accuracy• Reliability• Detailed Study• Scientific Base• Greater Suitability in most Situations
In cases, when the universe is very large, then the sampling method is the only practical method for collecting the data.

Limitations of Sampling
• Less Accuracy• Changeability of Units• Misleading Conclusion• Need for specialized knowledge• When sampling is not possible

The Sampling Design Process
Define the Population
Determine the Sampling Frame
Select Sampling Technique(s)
Determine the Sample Size
Execute the Sampling Process
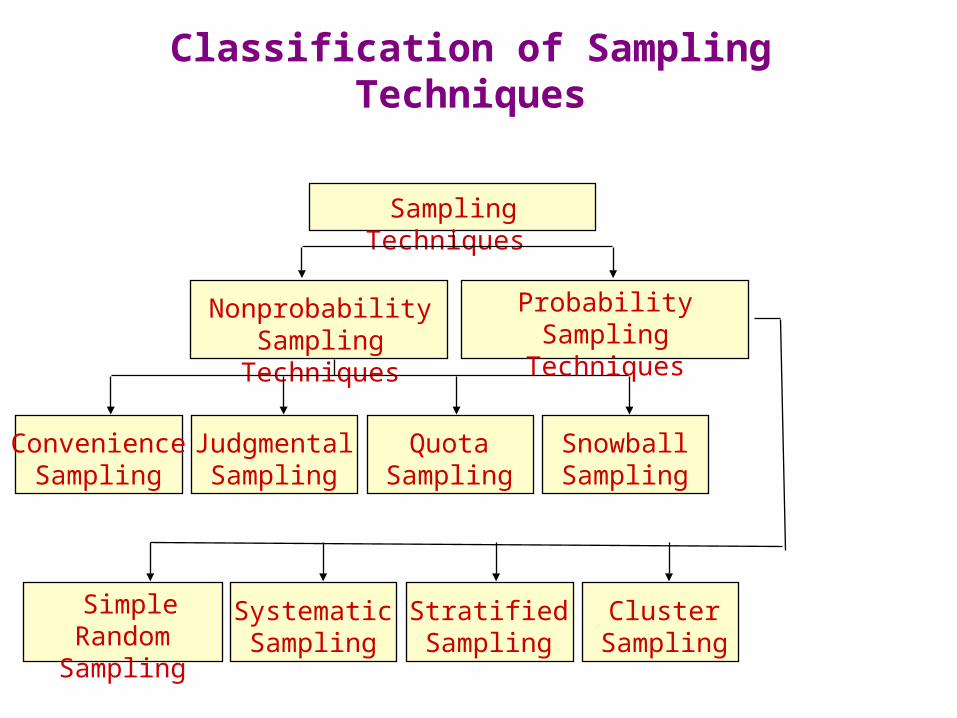
Classification of Sampling Techniques
Sampling Techniques
NonprobabilitySampling Techniques
ProbabilitySampling Techniques
ConvenienceSampling
JudgmentalSampling
QuotaSampling
SnowballSampling
SystematicSampling
StratifiedSampling
ClusterSampling
Simple RandomSampling

Convenience Sampling
Convenience sampling attempts to obtain a sample of convenient elements. Often, respondents are selected because they happen to be in the right place at the right time.

A Graphical Illustration of Convenience Sampling
A B C D E
1 6 11 16 21
2 7 12 17 22
3 8 13 18 23
4 9 14 19 24
5 10 15 20 25
Group D happens to assemble at a
convenient time and place. So all the elements in this
Group are selected. The resulting sample consists of elements 16, 17, 18, 19 and 20. Note, no elements are selected from group
A, B, C and E.

Judgmental Sampling
Judgmental sampling is a form of convenience sampling in which the population elements are selected based on the judgment of the researcher.

Graphical Illustration of Judgmental Sampling
A B C D E
1 6 11 16 21
2 7 12 17 22
3 8 13 18 23
4 9 14 19 24
5 10 15 20 25
The researcher considers groups B, C and E to be typical and
convenient. Within each of these groups one or
two elements are selected based on
typicality and convenience. The resulting sample
consists of elements 8, 10, 11, 13, and 24. Note, no elements are selected
from groups A and D.

Quota Sampling
Quota sampling may be viewed as two-stage restricted judgmental sampling.
– The first stage consists of developing control categories, or quotas, of population elements.
– In the second stage, sample elements are selected based on convenience or judgment.
Population Samplecomposition composition
ControlCharacteristic Percentage Percentage NumberSex Male 48 48 480 Female 52 52 520
____ ____ ____100 100 1000

A Graphical Illustration of Quota Sampling
A B C D E
1 6 11 16 21
2 7 12 17 22
3 8 13 18 23
4 9 14 19 24
5 10 15 20 25
A quota of one element from each group, A to E, is
imposed. Within each group, one element is
selected based on judgment or
convenience. The resulting sample
consists of elements 3, 6, 13, 20 and 22.
Note, one element is selected from each column or group.

Snowball Sampling
In snowball sampling, an initial group of respondents is selected, usually at random.
– After being interviewed, these respondents are asked to identify others who belong to the target population of interest.
– Subsequent respondents are selected based on the
referrals.

A Graphical Illustration of Snowball Sampling
A B C D E
1 6 11 16 21
2 7 12 17 22
3 8 13 18 23
4 9 14 19 24
5 10 15 20 25
Elements 2 and 9 are selected randomly from groups A and B. Element 2 refers elements 12 and 13. Element 9 refers
element 18. The resulting sample consists of elements
2, 9, 12, 13, and 18. Note, there are no element from
group E.
Random SelectionReferrals

Simple Random Sampling
• Each element in the population has a known and equal probability of selection.
• Each possible sample of a given size (n) has a known and equal probability of being the sample actually selected.
• This implies that every element is selected independently of every other element.
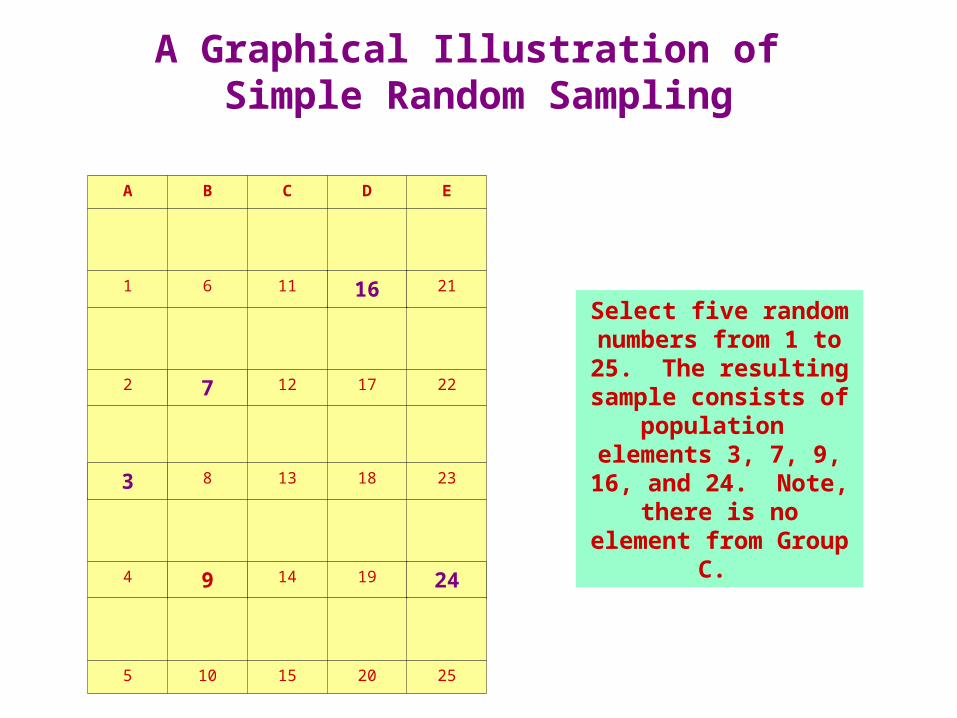
A Graphical Illustration of Simple Random Sampling
A B C D E
1 6 11 16 21
2 7 12 17 22
3 8 13 18 23
4 9 14 19 24
5 10 15 20 25
Select five random numbers from 1 to 25. The resulting sample
consists of population elements 3, 7, 9, 16,
and 24. Note, there is no element from Group
C.

Systematic Sampling
• The sample is chosen by selecting a random starting point and then picking every ith element in succession from the sampling frame.
• The sampling interval, i, is determined by dividing the population size N by the sample size n and rounding to the nearest integer.
• When the ordering of the elements is related to the characteristic of interest, systematic sampling increases the representativeness of the sample.
Systematic Sampling
• If the ordering of the elements produces a cyclical pattern, systematic sampling may decrease the representativeness of the sample.
For example, there are 100,000 elements in the population and a sample of 1,000 is desired. In this case the sampling interval, i, is 100. A random number between 1 and 100 is selected. If, for example, this number is 23, the sample consists of elements 23, 123, 223, 323, 423, 523, and so on.

A Graphical Illustration of Systematic Sampling
A B C D E
1 6 11 16 21
2 7 12 17 22
3 8 13 18 23
4 9 14 19 24
5 10 15 20 25
Select a random number between 1 to 5, say 2.The resulting sample
consists of population 2, (2+5=) 7, (2+5x2=) 12,
(2+5x3=)17, and (2+5x4=) 22. Note, all the elements are
selected from a single row.

Stratified Sampling
• A two-step process in which the population is partitioned into subpopulations, or strata.
• The strata should be mutually exclusive and collectively exhaustive in that every population element should be assigned to one and only one stratum and no population elements should be omitted.
• Next, elements are selected from each stratum by a random procedure, usually SRS.
• A major objective of stratified sampling is to increase precision without increasing cost.

Stratified Sampling
• The elements within a stratum should be as homogeneous as possible, but the elements in different strata should be as heterogeneous as possible.
• The stratification variables should also be closely related to the characteristic of interest.
• Finally, the variables should decrease the cost of the stratification process by being easy to measure and apply.

Stratified Sampling
• In proportionate stratified sampling, the size of the sample drawn from each stratum is proportionate to the relative size of that stratum in the total population.
• In disproportionate stratified sampling, the size of the sample from each stratum is proportionate to the relative size of that stratum and to the standard deviation of the distribution of the characteristic of interest among all the elements in that stratum.

A Graphical Illustration of Stratified Sampling
A B C D E
1 6 11 16 21
2 7 12 17 22
3 8 13 18 23
4 9 14 19 24
5 10 15 20 25
Randomly select a number from 1 to 5
for each stratum, A to E. The resulting
sample consists of population elements
4, 7, 13, 19 and 21. Note, one element
is selected from each column.

Cluster Sampling
• The target population is first divided into mutually exclusive and collectively exhaustive subpopulations, or clusters.
• Then a random sample of clusters is selected, based on a probability sampling technique such as SRS.
• For each selected cluster, either all the elements are included in the sample (one-stage) or a sample of elements is drawn probabilistically (two-stage).

Cluster Sampling
• Elements within a cluster should be as heterogeneous as possible, but clusters themselves should be as homogeneous as possible. Ideally, each cluster should be a small-scale representation of the population.
• In probability proportionate to size sampling, the clusters are sampled with probability proportional to size. In the second stage, the probability of selecting a sampling unit in a selected cluster varies inversely with the size of the cluster.

A Graphical Illustration of Cluster Sampling (2-Stage)
A B C D E
1 6 11 16 21
2 7 12 17 22
3 8 13 18 23
4 9 14 19 24
5 10 15 20 25
Randomly select 3 clusters, B, D and E.
Within each cluster, randomly select one or two elements. The
resulting sample consists of population
elements 7, 18, 20, 21, and 23. Note, no elements are
selected from clusters A and C.

Types of Cluster Sampling
Cluster Sampling
One-StageSampling
MultistageSampling
Two-StageSampling
Simple ClusterSampling
ProbabilityProportionate
to Size Sampling

Technique Strengths WeaknessesNonprobability Sampling Convenience sampling
Least expensive, leasttime-consuming, mostconvenient
Selection bias, sample notrepresentative, not recommended fordescriptive or causal research
Judgmental sampling Low cost, convenient,not time-consuming
Does not allow generalization,subjective
Quota sampling Sample can be controlledfor certain characteristics
Selection bias, no assurance ofrepresentativeness
Snowball sampling Can estimate rarecharacteristics
Time-consuming
Probability sampling Simple random sampling(SRS)
Easily understood,results projectable
Difficult to construct samplingframe, expensive, lower precision,no assurance of representativeness.
Systematic sampling Can increaserepresentativeness,easier to implement thanSRS, sampling frame notnecessary
Can decrease representativeness
Stratified sampling Include all importantsubpopulations,precision
Difficult to select relevantstratification variables, not feasible tostratify on many variables, expensive
Cluster sampling Easy to implement, costeffective
Imprecise, difficult to compute andinterpret results
Strengths and Weaknesses of Basic Sampling Techniques