sample spend analysis - source one summary 2 source one analyzed the spend report provided by client...
TRANSCRIPT

Sample Spend Analysis
COLLABORATION · EXPERIENCE · OBJECTIVITY · CREATIVITY · PRECISION
Executive Summary
2
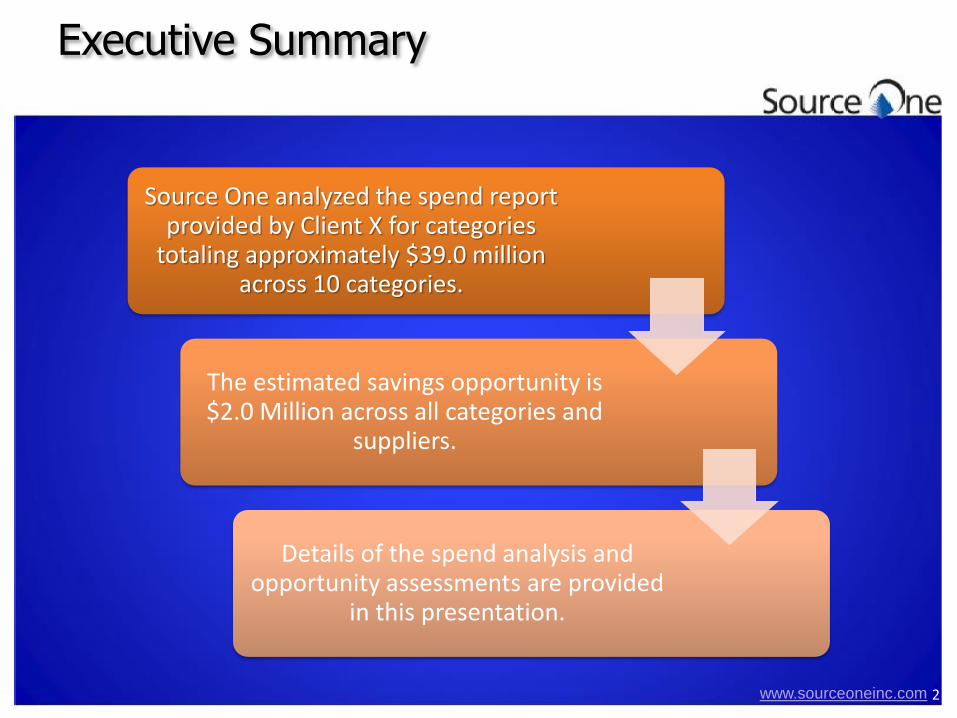
Source One analyzed the spend report provided by Client X for categories
totaling approximately $39.0 million across 10 categories.
The estimated savings opportunity is $2.0 Million across all categories and
suppliers.
Details of the spend analysis and opportunity assessments are provided
in this presentation.
www.sourceoneinc.com


Professional Services - Consulting
4
Supplier Name Annual Spend Potential Savings %
Potential Savings Amount
Supplier A $4,758,333 3% $ 142,750
Supplier B $2,533,311 5% $ 126,666
Supplier C $542,889 5% $ 27,144
Supplier D $488,527 7% $ 34,197
Supplier E $418,494 5% $ 20,925
Supplier F $361,636 5% $ 18,082
Supplier G $339,225 7% $ 23,746
Supplier H $333,064 5% $ 16,653
Top Suppliers Total Annual Spend:
$13.4 Million
Potential Savings Opportunity: 4%, $563K*
Opportunity for Savings: MEDIUM
Primary Savings Levers: • Sourcing & Negotiation • Service Rationalization/
Scope Review • Consolidation of like
services
* The majority of this spend is for a specific scope of work – potential savings opportunities exist in modifying the rate card(s) for future endeavors.
www.sourceoneinc.com

IT Services - Maintenance
5
Supplier Name Annual Spend Potential Savings %
Potential Savings Amount
Supplier A $5,437,976 7% $ 380,658
Supplier B $898,990 5% $ 44,950
Supplier C $247,485 7% $ 17,324
Supplier D $155,814 10% $ 15,581
Supplier E $121,625 7% $ 8,514
Supplier F $111,453 5% $ 5,573
Supplier G $101,541 10% $ 10,154
Top Suppliers Total Annual Spend:
$8.1 Million
Potential Savings Opportunity:
7%, $556K
Opportunity for Savings: MEDIUM-HIGH
Primary Savings Levers: • Sourcing & Negotiation • Service Rationalization/
Scope Review • Consolidation of like
services
www.sourceoneinc.com

Travel – General and Fleet Services
6
Supplier Name Annual Spend Potential Savings %
Potential Savings Amount
Supplier A $1,845,201 10% $184,520
Supplier B $1,456,449 10% $145,645
Supplier C $221,940 10% $22,194
Supplier D $144,113 10% $14,411
Supplier E $101,991 10% $10,199
Supplier F $76,134 5% $3,807
Supplier G $70,963 5% $3,548
Supplier H $70,889 5% $3,544
Top Suppliers
Total Annual Spend: $8.1 Million*
Opportunity for Savings: MEDIUM-HIGH
Primary Savings Levers: • Sourcing & Negotiation • Account Service Review • Rate Benchmarking
* Total spend includes individual travel charges, additional detail required to assess full scope of spend.
www.sourceoneinc.com

Marketing - General
7
Top Suppliers Total Annual Spend:
$4.4 Million
Potential Savings Opportunity: 5%, $206K*
Opportunity for Savings: MEDIUM
Primary Savings Levers: • Sourcing & Negotiation • Service Rationalization/
Scope Review • Consolidation of like
services
Supplier Name Annual Spend Potential Savings %
Potential Savings Amount
Supplier A $938,464 4% $37,539
Supplier B $183,585 5% $9,179
Supplier C $174,130 5% $8,707
Supplier D $172,162 8% $13,773
Supplier E $171,066 5% $8,553
Supplier F $146,939 5% $7,347
Supplier G $144,196 4% $5,768
Supplier H $117,381 5% $5,869
* The majority of this spend is for a specific scope of work – potential savings opportunities exist in modifying the rate card(s) for future endeavors.
www.sourceoneinc.com

IT Products – Software and Hardware
8
Total Annual Spend: $3.5 Million
Potential Savings Opportunity:
5%, $180K
Opportunity for Savings: MEDIUM
Primary Savings Levers: • Sourcing & Negotiation • Establish Volume Based
Pricing • Specification
Standardization • Supplier Consolidation
Supplier Name Annual Spend Potential Savings %
Potential Savings Amount
IT Products - Software
Supplier A $307,145 10% $30,714
Supplier B $252,278 4% $10,091
Supplier C $240,070 7% $16,805
Supplier D $197,514 7% $13,826
Supplier E $191,014 7% $13,371
IT Products - Hardware
Supplier A $685,097 3% $20,553
Supplier B $219,683 3% $6,590
Supplier C $121,175 3% $3,635
Supplier D $106,878 3% $3,206
Top Suppliers
www.sourceoneinc.com
Other Projects Opportunity Analysis
9
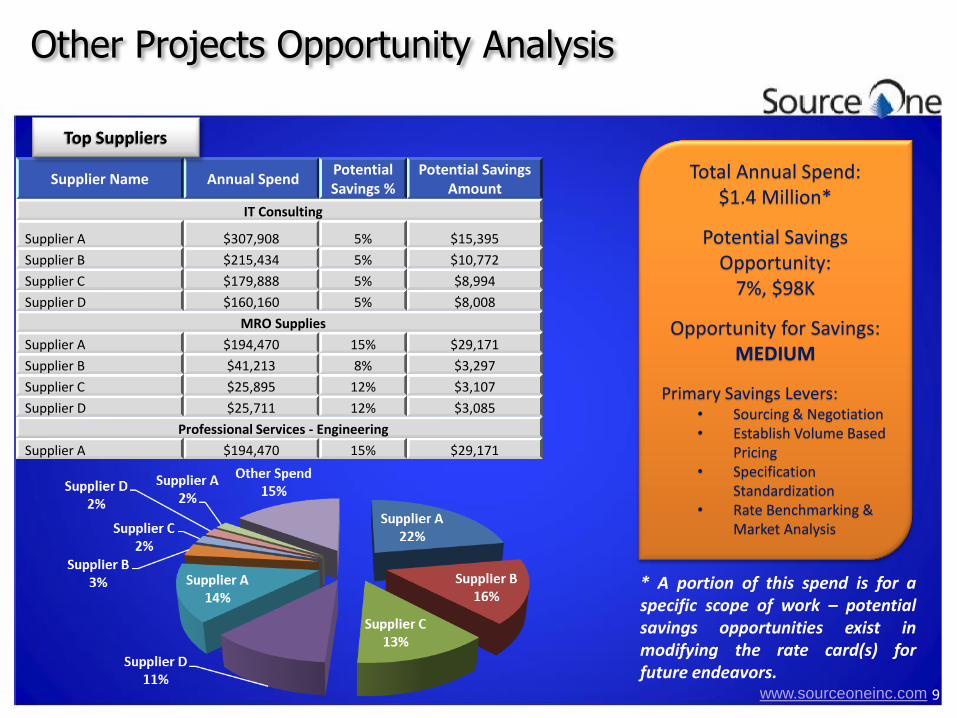
Supplier Name Annual Spend Potential Savings %
Potential Savings Amount
IT Consulting
Supplier A $307,908 5% $15,395
Supplier B $215,434 5% $10,772
Supplier C $179,888 5% $8,994
Supplier D $160,160 5% $8,008
MRO Supplies
Supplier A $194,470 15% $29,171
Supplier B $41,213 8% $3,297
Supplier C $25,895 12% $3,107
Supplier D $25,711 12% $3,085
Professional Services - Engineering
Supplier A $194,470 15% $29,171
Top Suppliers
Total Annual Spend: $1.4 Million*
Potential Savings Opportunity:
7%, $98K
Opportunity for Savings: MEDIUM
Primary Savings Levers: • Sourcing & Negotiation • Establish Volume Based
Pricing • Specification
Standardization • Rate Benchmarking &
Market Analysis
* A portion of this spend is for a specific scope of work – potential savings opportunities exist in modifying the rate card(s) for future endeavors.
www.sourceoneinc.com

What We Need to Get Started
LOA Signed
Contracts, Pricing Agreements, Quotes
Invoices (Online Credentials if Available)
Supplier Contact Information
Customer Facility List with Main Point of Contact
10 www.sourceoneinc.com