sample report number: cc-sample-out-0116 | updated: january 2016 metricnet performance benchmarking...
TRANSCRIPT
SAMPLE Outsourced Call Center Benchmark (sample report only—data is not accurate!)
1 | P a g e © M e t r i c N e t , L L C w w w . m e t r i c n e t . c o m
SAMPLE REPORT DATA IS NOT ACCURATE!
Call Center Benchmark Outsourced Call Centers Report Number: CC-SAMPLE-OUT-0116 | Updated: January 2016
MetricNet Performance Benchmarking www.metricnet.com
MetricNet’s instantly downloadable Call Center benchmarks provide valuable industry data that your organization can use to begin improving performance right away!
MetricNet Performance Benchmarking
www.metricnet.com

SAMPLE Outsourced Call Center Benchmark (sample report only—data is not accurate!)
1 | P a g e © M e t r i c N e t , L L C w w w . m e t r i c n e t . c o m
Contents
Benchmarking Overview......................................................................................4
The Basic Benchmarking Approach ............................................................................ 5
Achieving World-Class Performance .......................................................................... 7
Price vs. Quality for Call Centers ............................................................................... 9
How to Use this Benchmark Report .................................................................. 12
Step 1: Collect your Call Center’s performance data. ..........................................12
Step 2: Compare your performance to others. .......................................................13
Step 3: Develop strategies for improved performance. .......................................14
Step 4: Implement, and monitor results. ................................................................15
KPI Statistics: Summary and Quartiles ............................................................. 18
Benchmarking Performance Summary .....................................................................18
Quartile Rankings for Each KPI ................................................................................20
Benchmarking Scorecard and Rankings ............................................................ 23
The Call Center Scorecard: An Overview ................................................................23
Tracking Your Balanced Score ..................................................................................24
Benchmarking the Balanced Score ...........................................................................25
Detailed Benchmarking Data ........................................................................... 35
Price Metrics ................................................................................................................35
Price per Contact .....................................................................................................35
Price per Minute of Handle Time ..........................................................................37
Productivity Metrics ....................................................................................................39
Agent Utilization ......................................................................................................39
Inbound Contacts per Agent per Month ...............................................................42
Agents as a % of Total Call Center Headcount ..................................................44
Service Level Metrics..................................................................................................46
Average Speed of Answer (ASA) ............................................................................46
% of Calls Answered in 30 Seconds ......................................................................48
SAMPLE Outsourced Call Center Benchmark (sample report only—data is not accurate!)
2 | P a g e © M e t r i c N e t , L L C w w w . m e t r i c n e t . c o m
Call Abandonment Rate ..........................................................................................50
Quality Metrics ............................................................................................................52
Customer Satisfaction .............................................................................................52
Net First Contact Resolution Rate ........................................................................54
Call Quality ...............................................................................................................56
Agent Metrics ...............................................................................................................58
Annual Agent Turnover ...........................................................................................58
Daily Agent Absenteeism ........................................................................................60
Agent Occupancy ......................................................................................................62
Agent Schedule Adherence ....................................................................................64
New Agent Training Hours .....................................................................................66
Annual Agent Training Hours ................................................................................68
Agent Tenure ............................................................................................................70
Agent Job Satisfaction.............................................................................................72
Contact Handling Metrics ..........................................................................................74
Inbound Contact Handle Time ...............................................................................74
IVR Containment Rate .............................................................................................76
About MetricNet .............................................................................................. 78
Free Resources .........................................................................................................78

SAMPLE Outsourced Call Center Benchmark (sample report only—data is not accurate!)
3 | P a g e © M e t r i c N e t , L L C w w w . m e t r i c n e t . c o m
BENCHMARKING OVERVIEW

SAMPLE Outsourced Call Center Benchmark (sample report only—data is not accurate!)
4 | P a g e © M e t r i c N e t , L L C w w w . m e t r i c n e t . c o m
Benchmarking Overview
Benchmarking is a well-established tool for measuring and improving Call Center performance. Effective benchmarking enables you to quantify your Call Center ’s performance , compare your Call Center to others in your industry, identify negative performance gaps, and define the actions necessary to close the gaps.
A Price Benchmark is often undertaken by an organization that is contemplating outsourcing, and wishes to negotiate the best possible terms and conditions for their outsource contract, or by an organization that has already outsourced, and wishes to measure how their service provider is performing, possibly with an eye towards negotiating a more favorable contract.
The power of benchmarking for outsourced Call Centers is that it enables an organization to objectively determine the value of the service provided by the current provider. Armed with this information, the organization has the option of negotiating a more favorable price/quality value proposition with the current provider, possibly moving the business to a provider with a more favorable pricing structure, or even insourcing the service to an economically favorable location such as India.
SAMPLE Outsourced Call Center Benchmark (sample report only—data is not accurate!)
5 | P a g e © M e t r i c N e t , L L C w w w . m e t r i c n e t . c o m
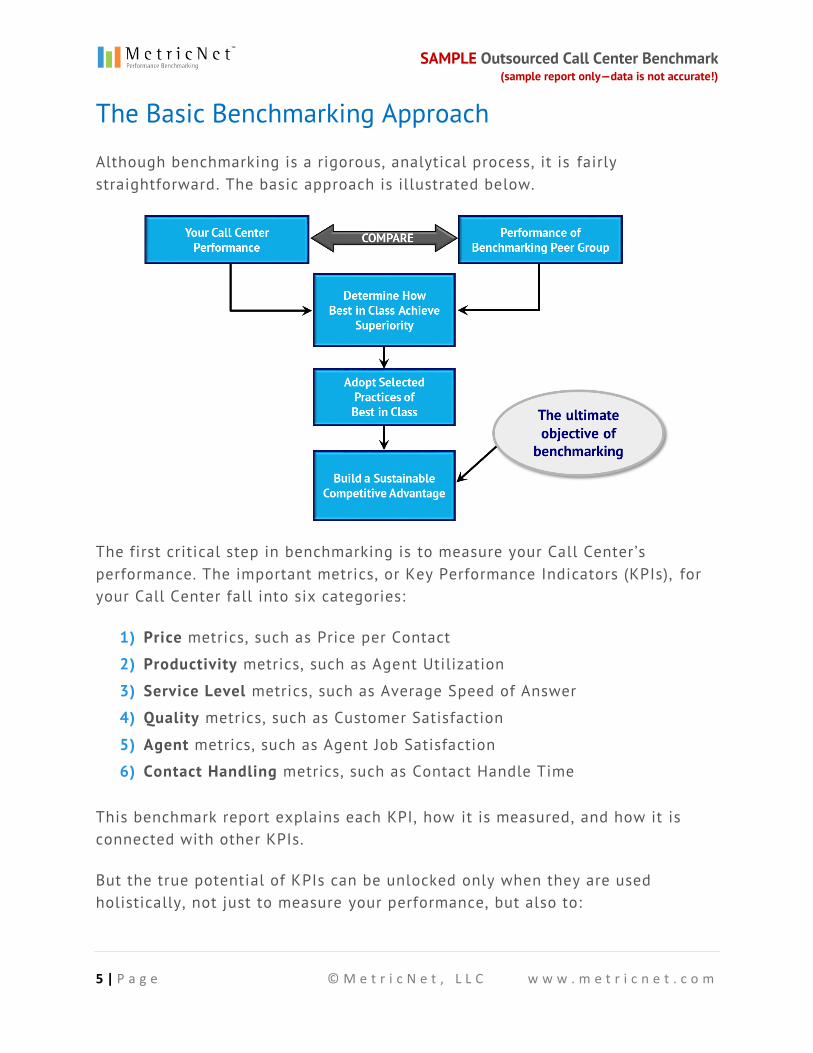
The Basic Benchmarking Approach
Although benchmarking is a rigorous, analytical process, it is fairly straightforward. The basic approach is illustrated below.
The first critical step in benchmarking is to measure your Call Center ’s performance. The important metrics, or Key Performance Indicators (KPIs), for your Call Center fall into six categories:
1) Price metrics, such as Price per Contact
2) Productivity metrics, such as Agent Utilization
3) Service Level metrics, such as Average Speed of Answer
4) Quality metrics, such as Customer Satisfaction
5) Agent metrics, such as Agent Job Satisfaction
6) Contact Handling metrics, such as Contact Handle Time
This benchmark report explains each KPI, how it is measured, and how it is connected with other KPIs.
But the true potential of KPIs can be unlocked only when they are used holistically, not just to measure your performance, but also to:

SAMPLE Outsourced Call Center Benchmark (sample report only—data is not accurate!)
6 | P a g e © M e t r i c N e t , L L C w w w . m e t r i c n e t . c o m
Track and trend your performance over time
Benchmark your performance vs. industry peers
Identify strengths and weaknesses in your Call Center
Diagnose the underlying drivers of performance gaps
Negotiate better service or pricing from service providers
In other words, once you’ve measured your performance, benchmarking involves comparing your performance to others and asking questions such as, “How did they achieve a higher level of customer satisfaction? How did they get to a lower price per contact? How did they drive customer loyalty by virtue of the Call Center?”
Once you’ve answered those questions, you’re in a position to either identify the best service provider to contract with, or negotiate terms with your current service provider that will lead to superior performance. With this basic approach, your Call Center can build a service-based competitive advantage through benchmarking!
SAMPLE Outsourced Call Center Benchmark (sample report only—data is not accurate!)
7 | P a g e © M e t r i c N e t , L L C w w w . m e t r i c n e t . c o m
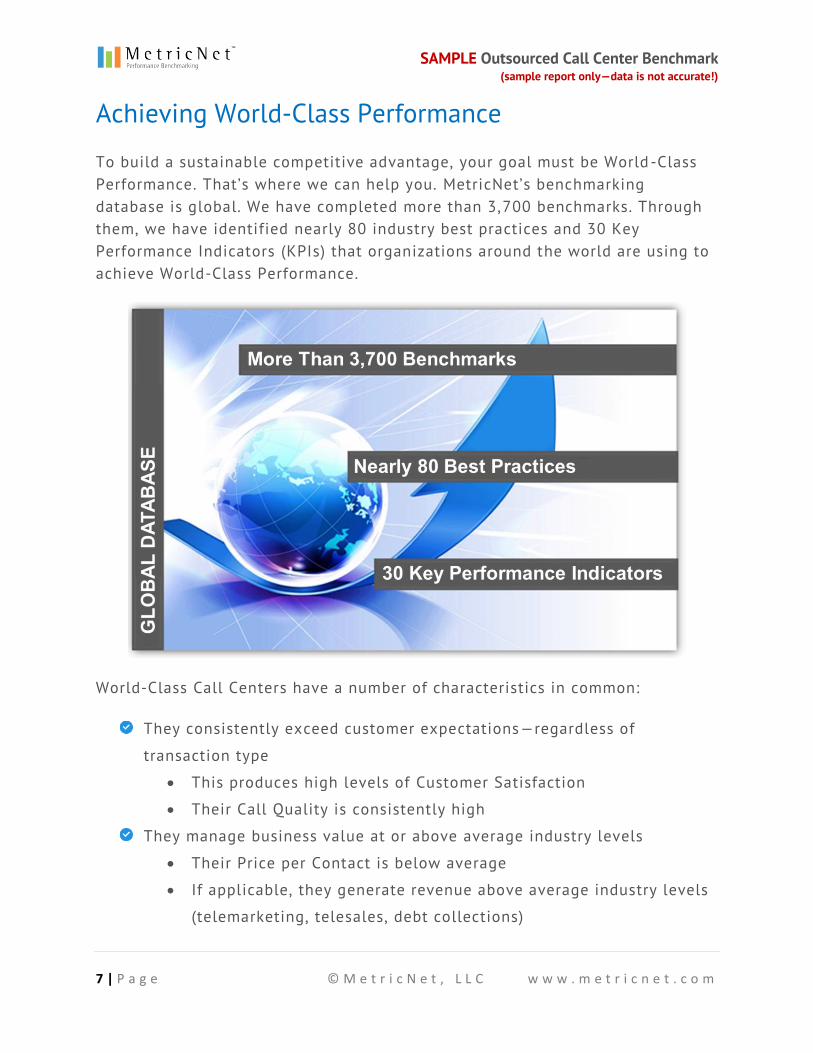
Achieving World-Class Performance
To build a sustainable competitive advantage, your goal must be World -Class Performance. That’s where we can help you. MetricNet’s benchmarking database is global. We have completed more than 3,700 benchmarks. Through them, we have identified nearly 80 industry best practices and 30 Key Performance Indicators (KPIs) that organizations around the world are using to achieve World-Class Performance.
World-Class Call Centers have a number of characteristics in common:
They consistently exceed customer expectations—regardless of
transaction type
This produces high levels of Customer Satisfaction
Their Call Quality is consistently high
They manage business value at or above average industry levels
Their Price per Contact is below average
If applicable, they generate revenue above average industry levels
(telemarketing, telesales, debt collections)
SAMPLE Outsourced Call Center Benchmark (sample report only—data is not accurate!)
8 | P a g e © M e t r i c N e t , L L C w w w . m e t r i c n e t . c o m
They follow industry best practices
Industry best practices are defined and documented
They effectively apply those best practices
They add value with every transaction
They produce a positive customer experience
They improve customer loyalty
They create positive brand awareness
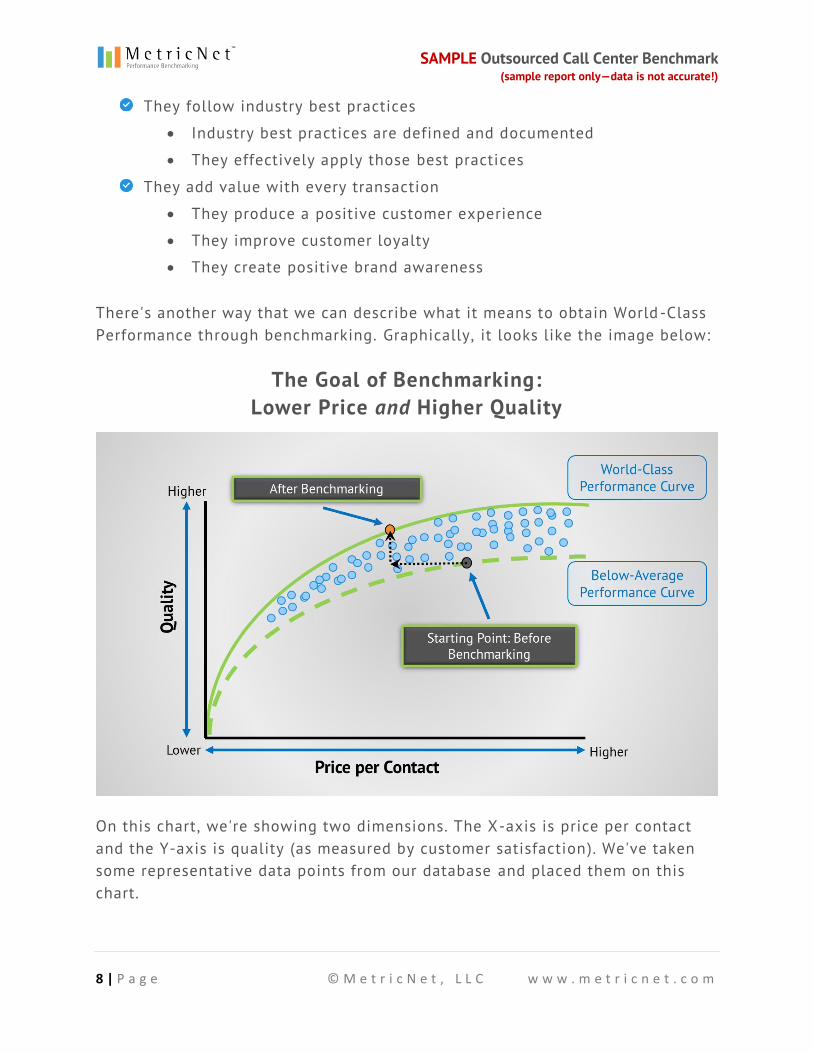
There's another way that we can describe what it means to obtain World -Class Performance through benchmarking. Graphically, it looks like the image below:
The Goal of Benchmarking: Lower Price and Higher Quality
On this chart, we're showing two dimensions. The X-axis is price per contact and the Y-axis is quality (as measured by customer satisfaction). We've taken some representative data points from our database and placed them on this chart.
SAMPLE Outsourced Call Center Benchmark (sample report only—data is not accurate!)
9 | P a g e © M e t r i c N e t , L L C w w w . m e t r i c n e t . c o m
The first thing you'll notice is that there's a cause-and-effect relationship between price and quality. Some organizations are driven by the need to minimize price. When that's the case, your price will drive your quality. Other organizations are driven by quality. In that case, quality will drive price.
The second thing you'll notice is that it's a non-linear relationship—as quality increases, the price will increase disproportionately. At some point, it probably doesn't make sense to pursue any further quality because quality is not fre e!
The point of this chart is to reinforce what it means to obtain World-Class Performance. It means that you take the limited resources you have and deploy them in the most effective way. If you do that, you will land on the upper curve, the World-Class curve. If your Call Center performs below average, you'll be on the lower curve.
Being World-Class is a relative concept. It's not about hitting a particular target on any one metric. It is about deploying your resources as effectively as you possibly can.
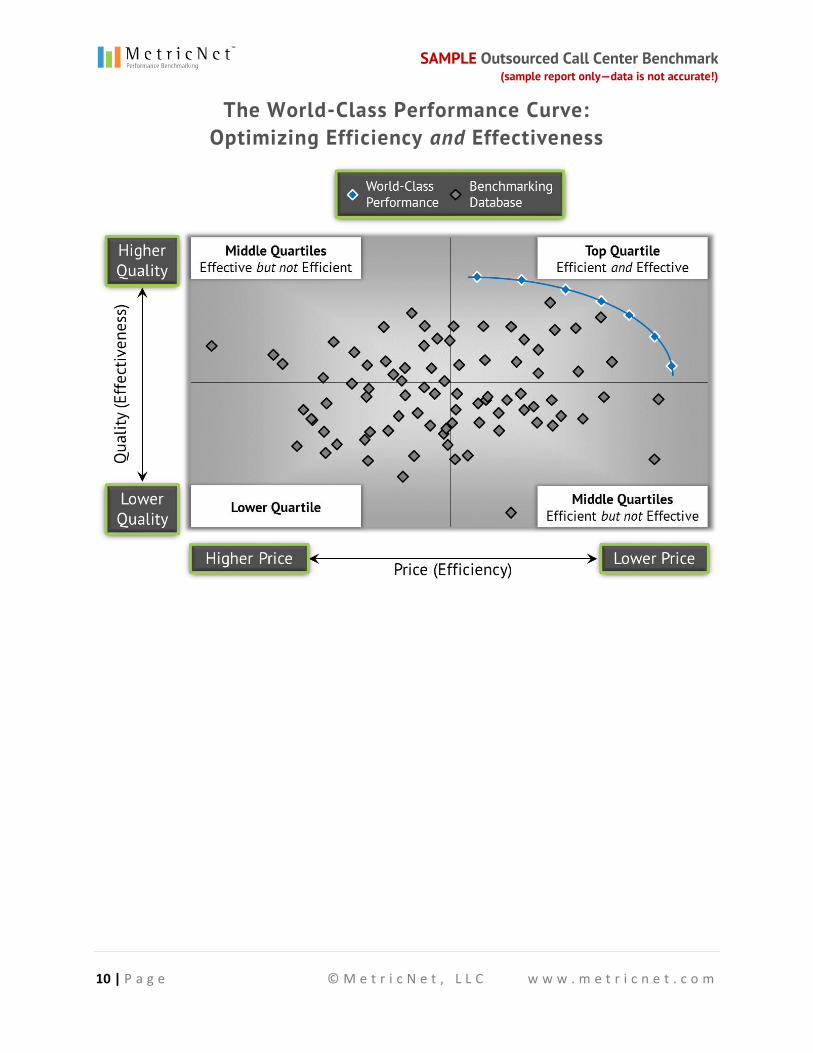
Price vs. Quality for Call Centers
Think about it this way. On the two-dimensional chart below, we again show price per contact on the X-axis (except that low price is now on the right, instead of the left) and customer satisfaction (quality) on the Y-axis. Where you want to be is on the upper-right World-Class Performance curve shown by the blue diamonds.
The blue diamonds represent Call Centers with optimized performance. As you can see in the chart, some of them are optimized at a very low price and a slightly above-average customer-satisfaction level. Others have optimized at a slightly better-than-average price and a very high customer-satisfaction level. The goal is to be in the upper-right-hand quadrant where you are both efficient (low price) and effective (high quality).
SAMPLE Outsourced Call Center Benchmark (sample report only—data is not accurate!)
10 | P a g e © M e t r i c N e t , L L C w w w . m e t r i c n e t . c o m
The World-Class Performance Curve: Optimizing Efficiency and Effectiveness

SAMPLE Outsourced Call Center Benchmark (sample report only—data is not accurate!)
11 | P a g e © M e t r i c N e t , L L C w w w . m e t r i c n e t . c o m
HOW TO USE THIS BENCHMARK
REPORT

SAMPLE Outsourced Call Center Benchmark (sample report only—data is not accurate!)
12 | P a g e © M e t r i c N e t , L L C w w w . m e t r i c n e t . c o m
How to Use this Benchmark Report
Here is the four-step benchmarking process to obtain optimized Call Center performance with this report:
Step 1: Collect your Call Center’s performance data.
Thorough, accurate data collection is the cornerstone of successful benchmarking. This is also the most time-consuming step in benchmarking. But you need accurate data in order to identify the performance gaps in your Call Center.
Ideally, your Call Center will have data that measures performance for each of the 21 KPIs that we include in this benchmarking report , the ones listed below:
Call Center Benchmarking Metrics
SAMPLE Outsourced Call Center Benchmark (sample report only—data is not accurate!)
13 | P a g e © M e t r i c N e t , L L C w w w . m e t r i c n e t . c o m
If your Call Center does not measure all 21 KPIs, you can still benefit from benchmarking the KPIs for which you can get data. At a minimum, you’ll want to benchmark six of the most important metrics, the ones we use in our Call Center Scorecard (see page 23 below), or some similar substitutes. And for the KPIs that your Call Center doesn’t measure , you can still use this report to benchmark the levels at which your Call Center ought to be performing.
We have defined each KPI in the Detailed Benchmarking Data section below (starting at page 35). You can refer to these definitions as you collect your data to ensure an apples-to-apples benchmarking comparison in Step 2.
You may also find it helpful, if possible, to review the collected data with key personnel at your service provider who understand the Call Center ’s operations. They can often provide context for the data and spot potential anomalies or inaccuracies.
Step 2: Compare your performance to others.
We provide several methods to compare your performance data with industry peers. The four primary methods are these:
1) A Benchmarking KPI Performance Summary (page 18), which lists the
industry peer group ’s average , minimum, median, and maximum
performance levels for each KPI.
2) Quartile Rankings (page 20), so you can map which quartile your Call
Center performs in for each KPI.
3) A Call Center Scorecard (page 23), which provides a more holistic,
balanced measure of your Call Center ’s overall performance compared to
the industry peer group.
4) Detailed Benchmarking Data (starting on page 35), which shows bar
charts of the performance level for each Call Center in the peer group,
for each individual KPI.
SAMPLE Outsourced Call Center Benchmark (sample report only—data is not accurate!)
14 | P a g e © M e t r i c N e t , L L C w w w . m e t r i c n e t . c o m
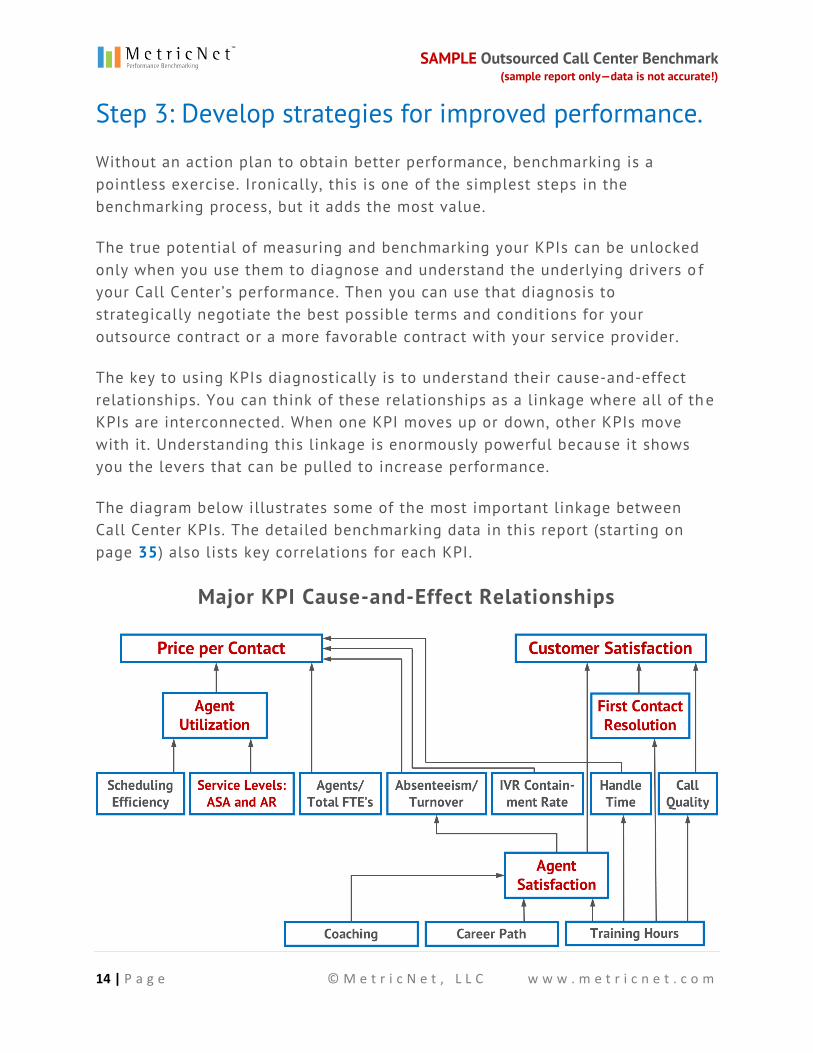
Step 3: Develop strategies for improved performance.
Without an action plan to obtain better performance, benchmarking is a pointless exercise. Ironically, this is one of the simplest steps in the benchmarking process, but it adds the most value.
The true potential of measuring and benchmarking your KPIs can be unlocked only when you use them to diagnose and understand the underlying drivers o f your Call Center’s performance. Then you can use that diagnosis to strategically negotiate the best possible terms and conditions for your outsource contract or a more favorable contract with your service provider.
The key to using KPIs diagnostically is to understand their cause-and-effect relationships. You can think of these relationships as a linkage where all of th e KPIs are interconnected. When one KPI moves up or down, other KPIs move with it. Understanding this linkage is enormously powerful because it shows you the levers that can be pulled to increase performance.
The diagram below illustrates some of the most important linkage between Call Center KPIs. The detailed benchmarking data in this report (starting on page 35) also lists key correlations for each KPI.
Major KPI Cause-and-Effect Relationships

SAMPLE Outsourced Call Center Benchmark (sample report only—data is not accurate!)
15 | P a g e © M e t r i c N e t , L L C w w w . m e t r i c n e t . c o m
We call Price per Contact and Customer Satisfaction the foundation metrics. Nearly everything a Call Center does can be viewed through the lens of price and quality. This insight is crucial because it greatly simplifies decision -making for a Call Center. Any performance gain that does not have the long-term effect of improving customer satisfaction, reducing price, or both, is simply not worth seeking. (Sales effectiveness may also be foundational for a revenue-generating Call Center, but this report does not benchmark sales metrics.)
The foundation metrics, however, cannot be directly controlled. Instead, they are controlled by other KPIs, the ones we call underlying drivers. As you can see from the diagram above, some top examples of underlying drivers are Agent Utilization, First Contact Resolution Rate, and Agent Job Satisfaction. These underlying drivers directly impact the foundation metrics—any improvement on the driver metrics will cause corresponding improvements in price, quality, or both.
By understanding the underlying drivers for price and quality, you can use your benchmarked KPIs diagnostically. If your Customer Satisfaction is low, for example, simply isolate the primary underlying drivers of Customer Satisfaction on which your Call Center’s performance was low compared to the benchmark. Then you can plan for addressing these shortcomings with your service provider.
To help understand why your Call Center is performing at the level it is, you can identify the industry best practices that determine performance on the crucial metrics that you isolated. MetricNet has identified nearly 80 industry best practices for Call Centers. Call Centers that follow these best practices will have better overall performance levels.
In identifying the areas where performance should improve, it’s important to emphasize your Call Center’s balanced score (see page 23). This shows you a more holistic view of your Call Center’s performance and helps you avoid fixating on just part of the picture.
Step 4: Implement, and monitor results.
Once you’ve benchmarked your Call Center’s performance, and diagnosed the key drivers of its efficiency and effectiveness, you’re in a better position to
SAMPLE Outsourced Call Center Benchmark (sample report only—data is not accurate!)
16 | P a g e © M e t r i c N e t , L L C w w w . m e t r i c n e t . c o m
negotiate with a service provider. Additionally, to ensure ongoing positive performance, some of MetricNet’s clients have negotiated a clause in their contracts that requires periodic benchmarking and appropriate adjustments to price or service levels based upon the benchmarking results.
Also, during the term of your contract, it is helpful to regularly monitor your Call Center’s performance for changes. One of the easiest and best ways of monitoring is to update your Call Center scorecard (see page 23) every month or every quarter, and trend the changes in your score over time.

SAMPLE Outsourced Call Center Benchmark (sample report only—data is not accurate!)
17 | P a g e © M e t r i c N e t , L L C w w w . m e t r i c n e t . c o m
KPI STATISTICS: SUMMARY AND
QUARTILES
SAMPLE Outsourced Call Center Benchmark (sample report only—data is not accurate!)
18 | P a g e © M e t r i c N e t , L L C w w w . m e t r i c n e t . c o m
KPI Statistics: Summary and Quartiles
Benchmarking Performance Summary
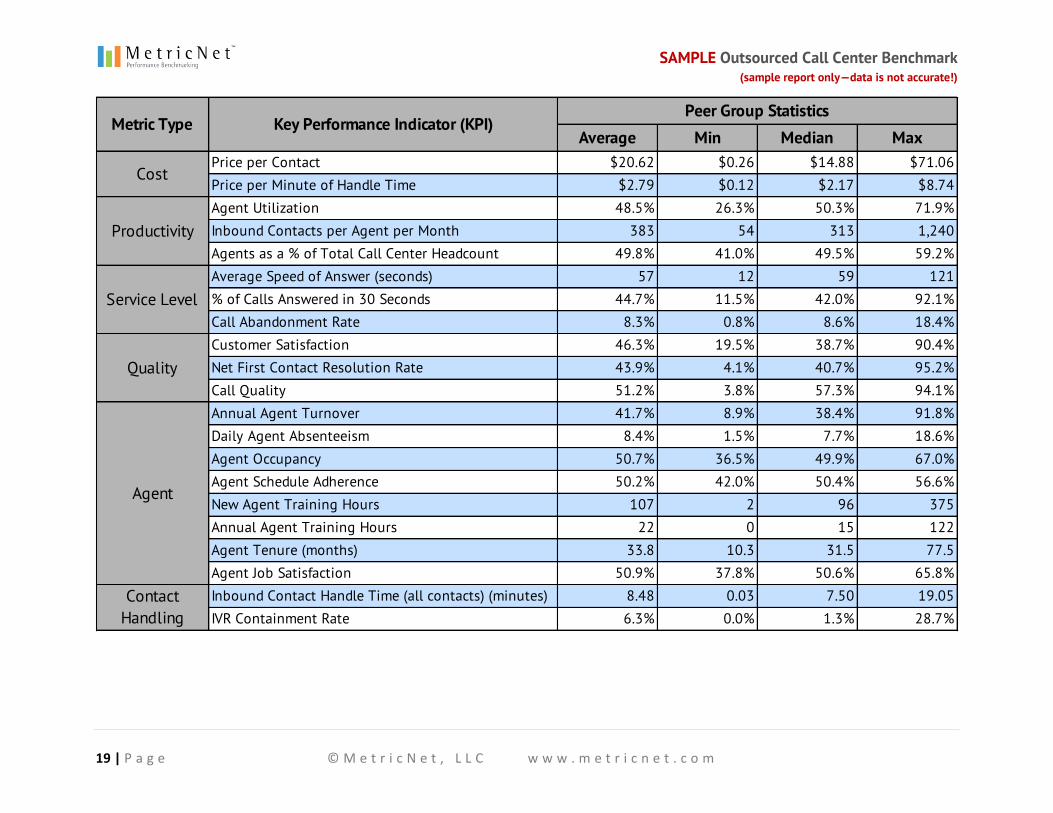
The table on the next page summarizes this report’s benchmarking data. It shows the benchmarking peer group’s average, minimum, median, and maximum performance levels for each Key Performance Indicator (KPI).
On the left of the table you see the six categories of metrics , followed by 21 KPIs that you can use to benchmark your Call Center. To compare your Call Center ’s performance with that of this peer group, simply copy the table into a spreadsheet and add a column with your data for each KPI that you measure .
It’s important to look at this data holistically. No single metric comes even close to telling the whole story. For example , if your price is high, that's not necessarily a bad thing—particularly if it comes with good quality and service levels. By contrast, if your price is low, that may not be a good thing if it comes with low Customer Satisfaction, low First Contact Resolution Rate, and the like.
SAMPLE Outsourced Call Center Benchmark (sample report only—data is not accurate!)
19 | P a g e © M e t r i c N e t , L L C w w w . m e t r i c n e t . c o m
Average Min Median MaxPrice per Contact $20.62 $0.26 $14.88 $71.06Price per Minute of Handle Time $2.79 $0.12 $2.17 $8.74Agent Utilization 48.5% 26.3% 50.3% 71.9%Inbound Contacts per Agent per Month 383 54 313 1,240Agents as a % of Total Call Center Headcount 49.8% 41.0% 49.5% 59.2%Average Speed of Answer (seconds) 57 12 59 121% of Calls Answered in 30 Seconds 44.7% 11.5% 42.0% 92.1%Call Abandonment Rate 8.3% 0.8% 8.6% 18.4%Customer Satisfaction 46.3% 19.5% 38.7% 90.4%Net First Contact Resolution Rate 43.9% 4.1% 40.7% 95.2%Call Quality 51.2% 3.8% 57.3% 94.1%Annual Agent Turnover 41.7% 8.9% 38.4% 91.8%Daily Agent Absenteeism 8.4% 1.5% 7.7% 18.6%Agent Occupancy 50.7% 36.5% 49.9% 67.0%Agent Schedule Adherence 50.2% 42.0% 50.4% 56.6%New Agent Training Hours 107 2 96 375Annual Agent Training Hours 22 0 15 122Agent Tenure (months) 33.8 10.3 31.5 77.5Agent Job Satisfaction 50.9% 37.8% 50.6% 65.8%Inbound Contact Handle Time (all contacts) (minutes) 8.48 0.03 7.50 19.05IVR Containment Rate 6.3% 0.0% 1.3% 28.7%
Contact Handling
Metric Type
Service Level
Key Performance Indicator (KPI)Peer Group Statistics
Productivity
Quality
Agent
Cost

SAMPLE Outsourced Call Center Benchmark (sample report only—data is not accurate!)
20 | P a g e © M e t r i c N e t , L L C w w w . m e t r i c n e t . c o m
Quartile Rankings for Each KPI
Quartiles are another simple way to present the benchmarking data . For each metric, the best-performing Call Centers fall into the first quartile; the worst performers fall into the fourth quartile.
For example, the Call Centers that perform in the top 25% on the first metric have a Price per Contact that ranges between $0.26 (the best) and $6.88 (the 75th percentile). The bottom 25% of Call Centers for that metric range between $26.48 and $71.06 per contact.
Price per Minute of Handle Time $0.12 $0.92 $2.17$0.92 $2.17 $4.27
$4.27$8.74
$6.88 $14.88 $26.48 $71.06Price per Contact $0.26 $6.88 $14.88 $26.48
Price MetricQuartile
1(Top)
2 3 4(Bottom)
52.7% 49.5% 46.4% 41.0%46.4%Agents as a % of Total Call Center
Headcount59.2% 52.7% 49.5%
Inbound Contacts per Agent per Month 1240 504 31359.6% 50.3% 36.2% 26.3%
504 313 206 54206
Agent Utilization 71.9% 59.6% 50.3% 36.2%
Productivity MetricQuartile
1 (Top)
2 3 4 (Bottom)
4.8% 8.6% 10.6% 18.4%10.6%
% of Calls Answered in 30 Seconds 92.1% 57.7% 42.0%
Call Abandonment Rate 0.8% 4.8% 8.6%57.7% 42.0% 31.9%
31.9%11.5%
35 59 74 121Average Speed of Answer (seconds) 12 35 59 74
Service Level MetricQuartile
1 (Top)
2 3 4 (Bottom)

SAMPLE Outsourced Call Center Benchmark (sample report only—data is not accurate!)
21 | P a g e © M e t r i c N e t , L L C w w w . m e t r i c n e t . c o m
66.3% 57.3% 29.8% 3.8%29.8%
Net First Contact Resolution Rate 95.2% 58.1% 40.7%
Call Quality 94.1% 66.3% 57.3%58.1% 40.7% 30.1%
30.1%4.1%
65.8% 38.7% 27.4% 19.5%Customer Satisfaction 90.4% 65.8% 38.7% 27.4%
Quality MetricQuartile
1 (Top) 2 3
4 (Bottom)
41.0 31.5 20.2 10.3
57.1% 50.6% 45.3% 37.8%45.3%
20.2Agent Tenure (months) 77.5 41.0 31.5
Agent Job Satisfaction 65.8% 57.1% 50.6%
New Agent Training Hours
Annual Agent Training Hours 15128 96 69 2
29 15 3 03
69375 128 96
122 29
55.4% 49.9% 45.8% 36.5%
52.9% 50.4% 48.0% 42.0%48.0%
45.8%Agent Occupancy 67.0% 55.4% 49.9%
Agent Schedule Adherence 56.6% 52.9% 50.4%
Daily Agent Absenteeism 1.5% 5.6% 7.7%5.6% 7.7% 9.6% 18.6%
9.6%
Agent MetricQuartile
1 (Top) 2 3
4 (Bottom)
Annual Agent Turnover 8.9% 29.6% 38.4% 52.8%29.6% 38.4% 52.8% 91.8%
3.74 7.50 12.98 19.05Inbound Contact Handle Time (all contacts)
(minutes)0.03 3.74 7.50 12.98
Contact Handling MetricQuartile
1 (Top) 2 3
4 (Bottom)
IVR Containment Rate 28.7% 10.2% 1.3% 0.0%10.2% 1.3% 0.0% 0.0%
SAMPLE Outsourced Call Center Benchmark (sample report only—data is not accurate!)
22 | P a g e © M e t r i c N e t , L L C w w w . m e t r i c n e t . c o m
BENCHMARKING SCORECARD AND
RANKINGS
SAMPLE Outsourced Call Center Benchmark (sample report only—data is not accurate!)
23 | P a g e © M e t r i c N e t , L L C w w w . m e t r i c n e t . c o m
Benchmarking Scorecard and Rankings
The Call Center Scorecard: An Overview
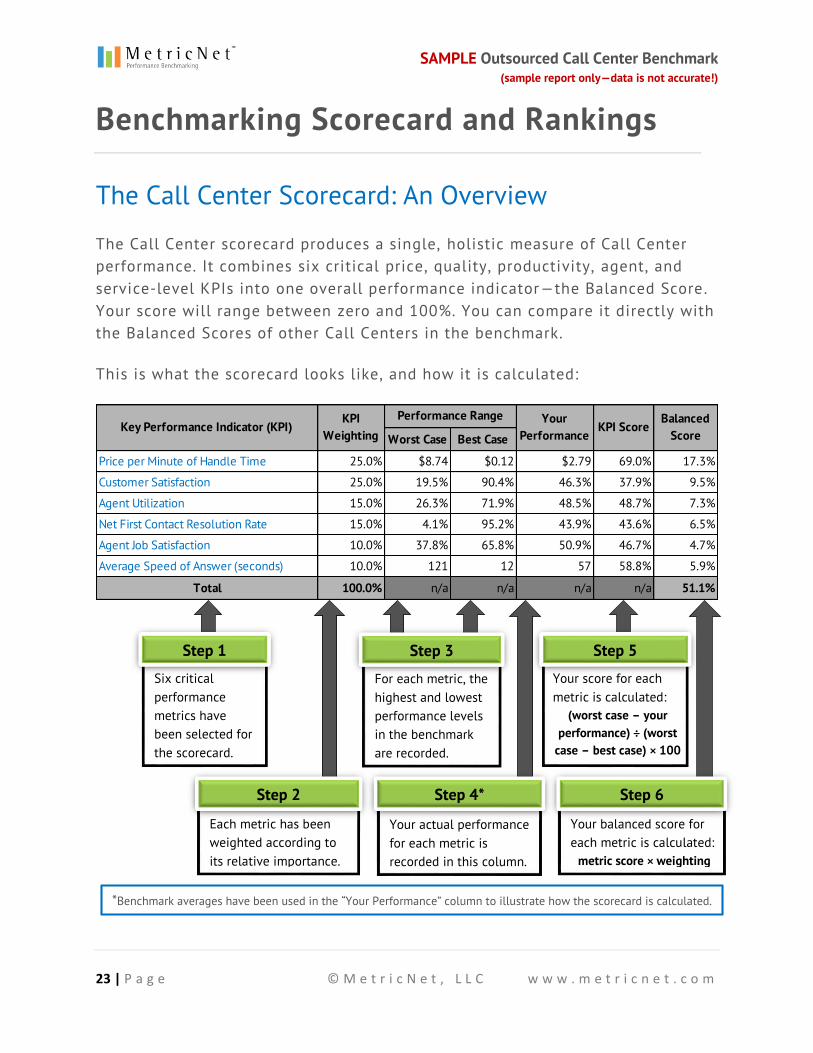
The Call Center scorecard produces a single, holistic measure of Call Center performance. It combines six critical price, quality, productivity, agent, and service-level KPIs into one overall performance indicator—the Balanced Score. Your score will range between zero and 100%. You can compare it directly with the Balanced Scores of other Call Centers in the benchmark.
This is what the scorecard looks like, and how it is calculated:
Worst Case Best Case
Price per Minute of Handle Time 25.0% $8.74 $0.12 $2.79 69.0% 17.3%
Customer Satisfaction 25.0% 19.5% 90.4% 46.3% 37.9% 9.5%
Agent Utilization 15.0% 26.3% 71.9% 48.5% 48.7% 7.3%
Net First Contact Resolution Rate 15.0% 4.1% 95.2% 43.9% 43.6% 6.5%
Agent Job Satisfaction 10.0% 37.8% 65.8% 50.9% 46.7% 4.7%
Average Speed of Answer (seconds) 10.0% 121 12 57 58.8% 5.9%
Total 100.0% n/a n/a n/a n/a 51.1%
Key Performance Indicator (KPI)KPI
WeightingPerformance Range Your
PerformanceKPI Score
Balanced Score
*Benchmark averages have been used in the “Your Performance” column to illustrate how the scorecard is calculated.
Six critical performance metrics have been selected for the scorecard.
Step 1
Each metric has been weighted according to its relative importance.
Step 2
For each metric, the highest and lowest performance levels in the benchmark are recorded.
Step 3
Your actual performance for each metric is recorded in this column.
Step 4*
Your balanced score for each metric is calculated:
metric score × weighting
Step 6
Your score for each metric is calculated:
(worst case – your performance) ÷ (worst
case – best case) × 100
Step 5

SAMPLE Outsourced Call Center Benchmark (sample report only—data is not accurate!)
24 | P a g e © M e t r i c N e t , L L C w w w . m e t r i c n e t . c o m
The six KPIs we selected for the scorecard are the metrics that are of highest importance for most Call Centers:
Price per Minute of Handle Time (price is one of the foundation metrics)
Customer Satisfaction (the other foundation metric)
Agent Utilization (the primary driver of price)
Net First Contact Resolution Rate (the primary driver of Customer
Satisfaction)
Agent Job Satisfaction (a key secondary driver of both price and quality)
Average Speed of Answer (the top service-level indicator)
The weighting percentage we assigned to each KPI is based on that KPI’s relative importance in the scorecard. For example, you can see that we gave the greatest weight to Price per Minute and Customer Satisfaction (25% each), since those are foundation metrics.
A Call Center ’s Balanced Score will always range between 0% and 100%. If your performance is the worst on each of the six KPIs, compared to the industry peer group for this benchmark report, your score will be 0%. If your performance is the best on each KPI, your score will be 100%.
When we run this algorithm for literally hundreds of Call Centers worldwide, the average Balanced Score is approximately 59%. If your score is above about 70%, you're in the top quartile; between about 60% and 70%, you're in the second quartile; between about 51% and 60%, in the third; and below 51%, in the bottom quartile.
Tracking Your Balanced Score
By calculating your overall score for every month or every quarter , you can track and trend its performance over time.
Consider this real data from a few years ago. One of MetricNet's clients simply updated their scorecard every month, as shown in the chart below. The blue bars in the chart represent the monthly Balanced Scores , while the green background represents the 12 month trailing trend in scorecard performance.

SAMPLE Outsourced Call Center Benchmark (sample report only—data is not accurate!)
25 | P a g e © M e t r i c N e t , L L C w w w . m e t r i c n e t . c o m
You can see that over the course of one year they managed to improve their performance substantially.
Balanced Score Trend
Benchmarking the Balanced Score
The Balanced Score is the single most useful performance indicator for comparing Call Center performance. The chart on the next page graphs the Balanced Scores for all Call Centers included in this report’s benchmark data. The red line shows the average overall performance level.

SAMPLE Outsourced Call Center Benchmark (sample report only—data is not accurate!)
26 | P a g e © M e t r i c N e t , L L C w w w . m e t r i c n e t . c o m
Benchmarking the Balanced Score (continued)
0.0%
5.0%
10.0%
15.0%
20.0%
25.0%
30.0%
35.0%
40.0%
45.0%
50.0%
55.0%
60.0%
65.0%
70.0%
75.0%
Bala
nced
Sco
res
High 68.3%Average ----- 51.1%Median 52.3%Low 20.0%
Key Statistics
Balanced Score

SAMPLE Outsourced Call Center Benchmark (sample report only—data is not accurate!)
27 | P a g e © M e t r i c N e t , L L C w w w . m e t r i c n e t . c o m
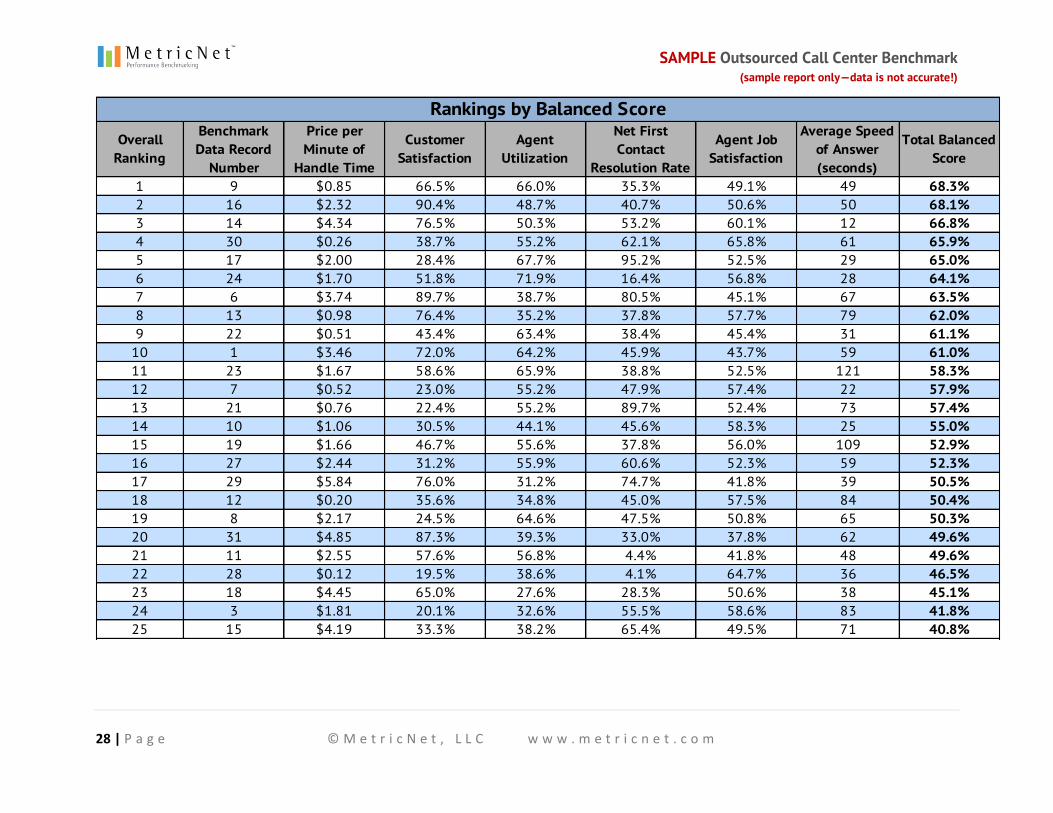
Benchmarking the Balanced Score (continued)
The next two pages list the Balanced Score for each Call Center in the benchmark. They also list each Call Center ’s performance for each of the six KPIs used to calculate the Balanced Score. The data records are listed in rank order, from the best Balanced Score (record #9) to the worst (record #2). If you want to see what any other Call Center ’s score looks like compared to yours, you can use this list .
SAMPLE Outsourced Call Center Benchmark (sample report only—data is not accurate!)
28 | P a g e © M e t r i c N e t , L L C w w w . m e t r i c n e t . c o m
Overall Ranking
Benchmark Data Record
Number
Price per Minute of
Handle Time
Customer Satisfaction
Agent Utilization
Net First Contact
Resolution Rate
Agent Job Satisfaction
Average Speed of Answer (seconds)
Total Balanced Score
1 9 $0.85 66.5% 66.0% 35.3% 49.1% 49 68.3%2 16 $2.32 90.4% 48.7% 40.7% 50.6% 50 68.1%3 14 $4.34 76.5% 50.3% 53.2% 60.1% 12 66.8%4 30 $0.26 38.7% 55.2% 62.1% 65.8% 61 65.9%5 17 $2.00 28.4% 67.7% 95.2% 52.5% 29 65.0%6 24 $1.70 51.8% 71.9% 16.4% 56.8% 28 64.1%7 6 $3.74 89.7% 38.7% 80.5% 45.1% 67 63.5%8 13 $0.98 76.4% 35.2% 37.8% 57.7% 79 62.0%9 22 $0.51 43.4% 63.4% 38.4% 45.4% 31 61.1%
10 1 $3.46 72.0% 64.2% 45.9% 43.7% 59 61.0%11 23 $1.67 58.6% 65.9% 38.8% 52.5% 121 58.3%12 7 $0.52 23.0% 55.2% 47.9% 57.4% 22 57.9%13 21 $0.76 22.4% 55.2% 89.7% 52.4% 73 57.4%14 10 $1.06 30.5% 44.1% 45.6% 58.3% 25 55.0%15 19 $1.66 46.7% 55.6% 37.8% 56.0% 109 52.9%16 27 $2.44 31.2% 55.9% 60.6% 52.3% 59 52.3%17 29 $5.84 76.0% 31.2% 74.7% 41.8% 39 50.5%18 12 $0.20 35.6% 34.8% 45.0% 57.5% 84 50.4%19 8 $2.17 24.5% 64.6% 47.5% 50.8% 65 50.3%20 31 $4.85 87.3% 39.3% 33.0% 37.8% 62 49.6%21 11 $2.55 57.6% 56.8% 4.4% 41.8% 48 49.6%22 28 $0.12 19.5% 38.6% 4.1% 64.7% 36 46.5%23 18 $4.45 65.0% 27.6% 28.3% 50.6% 38 45.1%24 3 $1.81 20.1% 32.6% 55.5% 58.6% 83 41.8%25 15 $4.19 33.3% 38.2% 65.4% 49.5% 71 40.8%
Rankings by Balanced Score

SAMPLE Outsourced Call Center Benchmark (sample report only—data is not accurate!)
29 | P a g e © M e t r i c N e t , L L C w w w . m e t r i c n e t . c o m
Overall Ranking
Benchmark Data Record
Number
Price per Minute of
Handle Time
Customer Satisfaction
Agent Utilization
Net First Contact
Resolution Rate
Agent Job Satisfaction
Average Speed of Answer (seconds)
Total Balanced Score
26 26 $0.26 40.0% 32.9% 12.8% 43.0% 86 40.5%27 25 $3.72 24.3% 37.2% 73.8% 47.3% 100 36.6%28 20 $6.40 21.7% 62.3% 18.0% 48.6% 34 33.5%29 5 $4.66 27.0% 26.3% 20.8% 49.6% 35 29.3%30 4 $8.31 27.7% 53.8% 18.6% 40.4% 75 20.7%31 2 $8.74 30.8% 34.8% 31.8% 39.8% 34 20.0%
Average $2.79 46.3% 48.5% 43.9% 50.9% 57 51.1%Max $8.74 90.4% 71.9% 95.2% 65.8% 121 68.3%Min $0.12 19.5% 26.3% 4.1% 37.8% 12 20.0%
Median $2.17 38.7% 50.3% 40.7% 50.6% 59 52.3%
Key Statistics
Rankings by Balanced Score (continued)

SAMPLE Outsourced Call Center Benchmark (sample report only—data is not accurate!)
30 | P a g e © M e t r i c N e t , L L C w w w . m e t r i c n e t . c o m
Benchmarking the Balanced Score (continued)
The next two pages show the rankings for each KPI in the scorecard. The column for each KPI has the performance levels listed in rank order, from best (top row) to worst (bottom row). This is the same data you saw in the previous list. But in this list it is not tied together by individual Call Center data records. Instead, each KPI is ranked on its own. This allows you to look at your performance for any given metric on the scorecard and see how you stack up against other outsourced Call Centers in your geographical region.

SAMPLE Outsourced Call Center Benchmark (sample report only—data is not accurate!)
31 | P a g e © M e t r i c N e t , L L C w w w . m e t r i c n e t . c o m
KPI RankingPrice per Minute of Handle Time
Customer Satisfaction
Agent Utilization
Net First Contact Resolution Rate
Agent Job Satisfaction
Average Speed of Answer (seconds)
Total Balanced Score
1 $0.12 90.4% 71.9% 95.2% 65.8% 12 68.3%2 $0.20 89.7% 67.7% 89.7% 64.7% 22 68.1%3 $0.26 87.3% 66.0% 80.5% 60.1% 25 66.8%4 $0.26 76.5% 65.9% 74.7% 58.6% 28 65.9%5 $0.51 76.4% 64.6% 73.8% 58.3% 29 65.0%6 $0.52 76.0% 64.2% 65.4% 57.7% 31 64.1%7 $0.76 72.0% 63.4% 62.1% 57.5% 34 63.5%8 $0.85 66.5% 62.3% 60.6% 57.4% 34 62.0%9 $0.98 65.0% 56.8% 55.5% 56.8% 35 61.1%
10 $1.06 58.6% 55.9% 53.2% 56.0% 36 61.0%11 $1.66 57.6% 55.6% 47.9% 52.5% 38 58.3%12 $1.67 51.8% 55.2% 47.5% 52.5% 39 57.9%13 $1.70 46.7% 55.2% 45.9% 52.4% 48 57.4%14 $1.81 43.4% 55.2% 45.6% 52.3% 49 55.0%15 $2.00 40.0% 53.8% 45.0% 50.8% 50 52.9%16 $2.17 38.7% 50.3% 40.7% 50.6% 59 52.3%17 $2.32 35.6% 48.7% 38.8% 50.6% 59 50.5%18 $2.44 33.3% 44.1% 38.4% 49.6% 61 50.4%19 $2.55 31.2% 39.3% 37.8% 49.5% 62 50.3%20 $3.46 30.8% 38.7% 37.8% 49.1% 65 49.6%21 $3.72 30.5% 38.6% 35.3% 48.6% 67 49.6%22 $3.74 28.4% 38.2% 33.0% 47.3% 71 46.5%23 $4.19 27.7% 37.2% 31.8% 45.4% 73 45.1%24 $4.34 27.0% 35.2% 28.3% 45.1% 75 41.8%25 $4.45 24.5% 34.8% 20.8% 43.7% 79 40.8%
Rankings of Each KPI

SAMPLE Outsourced Call Center Benchmark (sample report only—data is not accurate!)
32 | P a g e © M e t r i c N e t , L L C w w w . m e t r i c n e t . c o m
KPI RankingPrice per Minute of Handle Time
Customer Satisfaction
Agent Utilization
Net First Contact Resolution Rate
Agent Job Satisfaction
Average Speed of Answer (seconds)
Total Balanced Score
26 $4.66 24.3% 34.8% 18.6% 43.0% 83 40.5%27 $4.85 23.0% 32.9% 18.0% 41.8% 84 36.6%28 $5.84 22.4% 32.6% 16.4% 41.8% 86 33.5%29 $6.40 21.7% 31.2% 12.8% 40.4% 100 29.3%30 $8.31 20.1% 27.6% 4.4% 39.8% 109 20.7%31 $8.74 19.5% 26.3% 4.1% 37.8% 121 20.0%
Average $2.79 46.3% 48.5% 43.9% 50.9% 57 51.1%Max $8.74 90.4% 71.9% 95.2% 65.8% 121 68.3%Min $0.12 19.5% 26.3% 4.1% 37.8% 12 20.0%
Median $2.17 38.7% 50.3% 40.7% 50.6% 59 52.3%
Rankings of Each KPI (continued)

SAMPLE Outsourced Call Center Benchmark (sample report only—data is not accurate!)
33 | P a g e © M e t r i c N e t , L L C w w w . m e t r i c n e t . c o m
Benchmarking the Balanced Score (continued)
For a graphical benchmark of each individual metric in the scorecard, see the following section of this report. It contains charts for all 21 KPIs, including the six scorecard KPIs. The red line in each chart represents the average performance within the benchmark peer group, for you to compare against your own Call Center ’s performance. You can jump to the charts for the six scorecard KPIs using these links (each of those charts has links above it that you can use to return to this page or to jump to the next scorecard -KPI chart):
Price per Minute of Handle Time
Customer Satisfaction
Agent Utilization
Net First Contact Resolution Rate
Agent Job Satisfaction
Average Speed of Answer
We always organize these charts from left to right so that good performance is on the left and bad performance is on the right. In some cases, such as price, you'll notice an ascending distribution because lower numbers are better. In other cases such as customer satisfaction, you will see a descending distribution because higher numbers are better.
SAMPLE Outsourced Call Center Benchmark (sample report only—data is not accurate!)
34 | P a g e © M e t r i c N e t , L L C w w w . m e t r i c n e t . c o m
DETAILED BENCHMARKING
DATA

SAMPLE Outsourced Call Center Benchmark (sample report only—data is not accurate!)
35 | P a g e © M e t r i c N e t , L L C w w w . m e t r i c n e t . c o m
Detailed Benchmarking Data
Price Metrics
Price per Contact
Definition: Price per Inbound Contact is the amount paid to the servi ce provider for each inbound contact handled. It is typically calculated by dividing the annual fee paid to the service provider by the annual inbound contact volume. Contact volume includes inbound contacts from all sources: live voice, voicemail, email, web chat, fax, etc.
Why it’s important: Price per Contact is one of the most important Call Center metrics. It is a measure of contract efficiency and effectiveness with your service provider. A higher-than-average Price per Contact is not necessarily a bad thing, particularly if accompanied by higher-than-average quality levels. Conversely, a low Price per Contact is not necessarily good, particularly if the low price is achieved by sacrificing Call Quality or service levels. Every outsourced Call Center should track and trend Price per Contact on an ongoing basis.
Key correlations: Price per Contact is strongly correlated with the following metrics:
Agent Utilization
Net First Contact Resolution Rate
Inbound Contact Handle Time
IVR Containment Rate
Average Speed of Answer
𝑷𝒓𝒊𝒄𝒆 𝒑𝒆𝒓 𝑪𝒐𝒏𝒕𝒂𝒄𝒕 =(𝑻𝒐𝒕𝒂𝒍 𝒂𝒏𝒏𝒖𝒂𝒍 𝒇𝒆𝒆 𝒑𝒂𝒊𝒅 𝒕𝒐 𝒔𝒆𝒓𝒗𝒊𝒄𝒆 𝒑𝒓𝒐𝒗𝒊𝒅𝒆𝒓)
(𝑨𝒏𝒏𝒖𝒂𝒍 𝒊𝒏𝒃𝒐𝒖𝒏𝒅 𝒄𝒐𝒏𝒕𝒂𝒄𝒕 𝒗𝒐𝒍𝒖𝒎𝒆)

SAMPLE Outsourced Call Center Benchmark (sample report only—data is not accurate!)
36 | P a g e © M e t r i c N e t , L L C w w w . m e t r i c n e t . c o m
Price per Contact (continued)
$0.00
$5.00
$10.00
$15.00
$20.00
$25.00
$30.00
$35.00
$40.00
$45.00
$50.00
$55.00
$60.00
$65.00
$70.00
$75.00
Pric
e pe
r Con
tact
High $71.06Average ----- $20.62Median $14.88Low $0.26
Key Statistics
Price per Contact
SAMPLE Outsourced Call Center Benchmark (sample report only—data is not accurate!)
37 | P a g e © M e t r i c N e t , L L C w w w . m e t r i c n e t . c o m
Price Metrics (continued)
Price per Minute of Handle Time
Definition: Price per Minute of Handle Time is simply the Price per Contact divided by the average Inbound Contact Handle Time. The average Inbound Contact Handle Time includes all inbound contacts: live voice, voicemail, email, web chat, fax, etc.
Why it’s Important: Unlike Price per Contact, which does not take into account the Contact Handle Time or call complexity, Price per Minute of Handle Time measures the per-minute price paid to your service provider for providing customer service. It enables a more direct comparison of price between Call Centers because it is independent of the types of contacts that come into the Call Center and the complexity of those contacts.
Key correlations: Price per Minute of Handle Time is strongly correlated with the following metrics:
Agent Utilization
Net First Contact Resolution Rate
IVR Containment Rate
Average Speed of Answer
𝑷𝒓𝒊𝒄𝒆 𝒑𝒆𝒓 𝑴𝒊𝒏𝒖𝒕𝒆 𝒐𝒇 𝑯𝒂𝒏𝒅𝒍𝒆 𝑻𝒊𝒎𝒆 =(𝑷𝒓𝒊𝒄𝒆 𝒑𝒆𝒓 𝑪𝒐𝒏𝒕𝒂𝒄𝒕)
(𝑨𝒗𝒈. 𝑰𝒏𝒃𝒐𝒖𝒏𝒅 𝑪𝒐𝒏𝒕𝒂𝒄𝒕 𝑯𝒂𝒏𝒅𝒍𝒆 𝑻𝒊𝒎𝒆)

SAMPLE Outsourced Call Center Benchmark (sample report only—data is not accurate!)
38 | P a g e © M e t r i c N e t , L L C w w w . m e t r i c n e t . c o m
Price per Minute of Handle Time (continued) return to page 33 | next scorecard KPI
$0.00
$1.00
$2.00
$3.00
$4.00
$5.00
$6.00
$7.00
$8.00
$9.00
$10.00
Pric
e pe
r Min
ute
of H
andl
e Ti
me
High $8.74Average ----- $2.79Median $2.17Low $0.12
Key Statistics
Price per Minute of Handle Time

SAMPLE Outsourced Call Center Benchmark (sample report only—data is not accurate!)
39 | P a g e © M e t r i c N e t , L L C w w w . m e t r i c n e t . c o m
Productivity Metrics
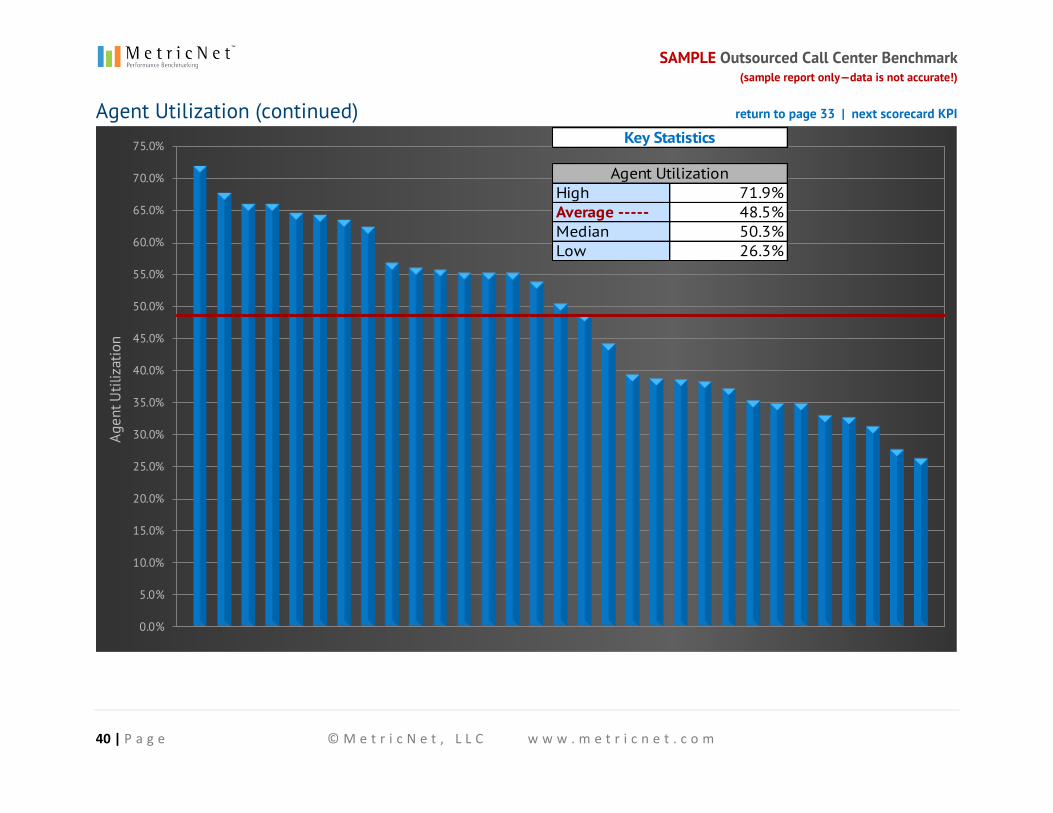
Agent Utilization
Definition: Agent Utilization is the average time that an agent spends handling both inbound and outbound contacts per month, divided by the number of work hours in a given month. (See the more thorough definition on page 41 .)
Why it’s important: Agent Utilization is the single most important indicator of agent productivity. It measures the percentage of time that the average agent is in “work mode,” and is independent of Contact Handle Time or call complexity.
Key correlations: Agent Utilization is strongly correlated with the following metrics:
Inbound Contacts per Agent per Month
Price per Contact
Price per Minute of Handle Time
Agent Occupancy
Average Speed of Answer
𝑨𝒈𝒆𝒏𝒕 𝑼𝒕𝒊𝒍𝒊𝒛𝒂𝒕𝒊𝒐𝒏 =(𝑻𝒐𝒕𝒂𝒍 𝒄𝒐𝒏𝒕𝒂𝒄𝒕 𝒉𝒂𝒏𝒅𝒍𝒊𝒏𝒈 𝒕𝒊𝒎𝒆 𝒑𝒆𝒓 𝒎𝒐𝒏𝒕𝒉)
(𝑵𝒖𝒎𝒃𝒆𝒓 𝒐𝒇 𝒘𝒐𝒓𝒌 𝒉𝒐𝒖𝒓𝒔 𝒑𝒆𝒓 𝒎𝒐𝒏𝒕𝒉)
SAMPLE Outsourced Call Center Benchmark (sample report only—data is not accurate!)
40 | P a g e © M e t r i c N e t , L L C w w w . m e t r i c n e t . c o m
Agent Utilization (continued) return to page 33 | next scorecard KPI
0.0%
5.0%
10.0%
15.0%
20.0%
25.0%
30.0%
35.0%
40.0%
45.0%
50.0%
55.0%
60.0%
65.0%
70.0%
75.0%
Agen
t Util
izat
ion
High 71.9%Average ----- 48.5%Median 50.3%Low 26.3%
Key Statistics
Agent Utilization
SAMPLE Outsourced Call Center Benchmark (sample report only—data is not accurate!)
41 | P a g e © M e t r i c N e t , L L C w w w . m e t r i c n e t . c o m
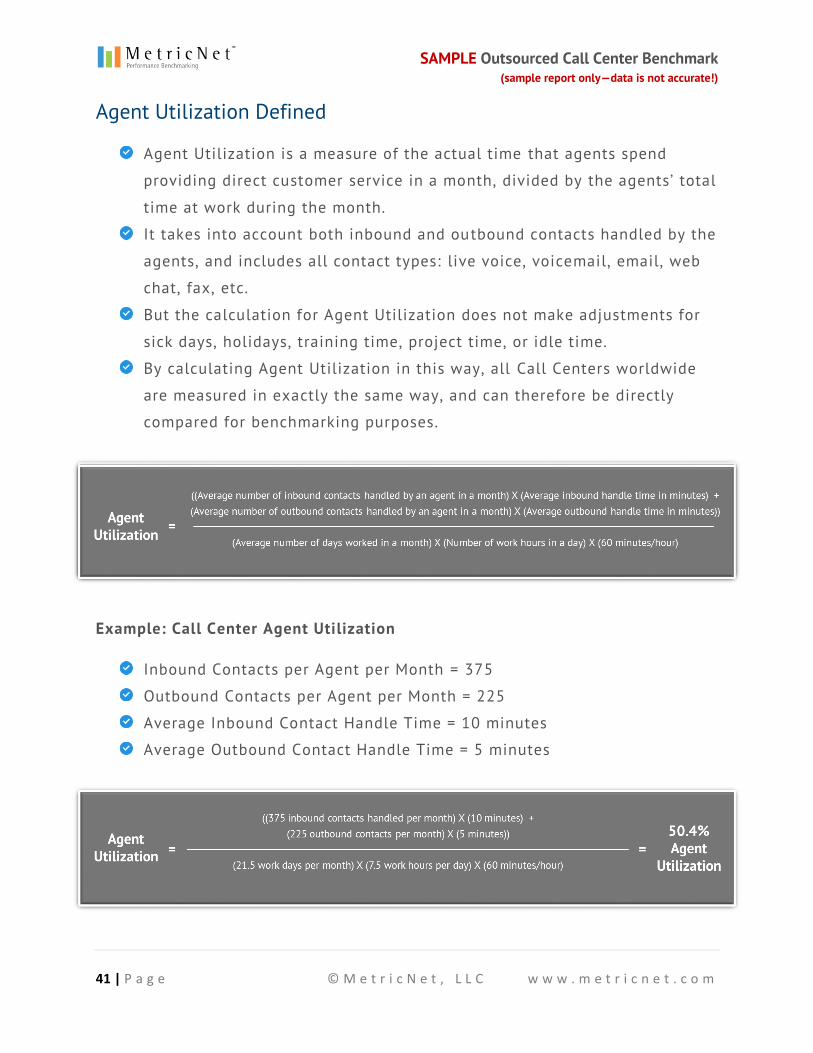
Agent Utilization Defined
Agent Utilization is a measure of the actual time that agents spend
providing direct customer service in a month, divided by the agents’ total
time at work during the month.
It takes into account both inbound and outbound contacts handled by the
agents, and includes all contact types: live voice, voicemail, email, web
chat, fax, etc.
But the calculation for Agent Utilization does not make adjustments for
sick days, holidays, training time, project time, or idle time.
By calculating Agent Utilization in this way, all Call Centers worldwide
are measured in exactly the same way, and can therefore be directly
compared for benchmarking purposes.
Example: Call Center Agent Utilization
Inbound Contacts per Agent per Month = 375
Outbound Contacts per Agent per Month = 225
Average Inbound Contact Handle Time = 10 minutes
Average Outbound Contact Handle Time = 5 minutes
SAMPLE Outsourced Call Center Benchmark (sample report only—data is not accurate!)
42 | P a g e © M e t r i c N e t , L L C w w w . m e t r i c n e t . c o m
Productivity Metrics (continued)
Inbound Contacts per Agent per Month
Definition: Inbound Contacts per Agent per Month is the average monthly inbound contact volume divided by the average Full Time Equivalent (FTE) agent headcount. Contact volume includes contacts from all sources: live voice, voicemail, email, web chat, fax, etc. Agent headcount is the average FTE number of employees and contractors handling customer contacts.
Why it’s important: Inbound Contacts per Agent per Month is an important indicator of agent productivity. A low number could indicate low Agent Utilization, poor scheduling efficiency or schedule adherence, or a higher-than-average Contact Handle Time. Conversely, a high number of inbound contacts per agent may indicate high Agent Utilization, good scheduling efficiency and schedule adherence, or a lower-than-average Contact Handle Time. Every Call Center should track and trend this metric on a monthly basis.
Key correlations: Inbound Contacts per Agent per Month is strongly correlated with the following metrics:
Agent Utilization
Inbound Contact Handle Time
Price per Contact
Price per Minute of Handle Time
Agent Occupancy
Average Speed of Answer
𝑰𝒏𝒃𝒐𝒖𝒏𝒅 𝑪𝒐𝒏𝒕𝒂𝒄𝒕𝒔 𝒑𝒆𝒓 𝑨𝒈𝒆𝒏𝒕 𝒑𝒆𝒓 𝑴𝒐𝒏𝒕𝒉 =(𝑨𝒗𝒈. 𝒊𝒏𝒃𝒐𝒖𝒏𝒅 𝒄𝒐𝒏𝒕𝒂𝒄𝒕𝒔 𝒑𝒆𝒓 𝒎𝒐𝒏𝒕𝒉)
(𝑨𝒗𝒈. 𝑭𝑻𝑬 𝒂𝒈𝒆𝒏𝒕 𝒉𝒆𝒂𝒅𝒄𝒐𝒖𝒏𝒕)

SAMPLE Outsourced Call Center Benchmark (sample report only—data is not accurate!)
43 | P a g e © M e t r i c N e t , L L C w w w . m e t r i c n e t . c o m
Inbound Contacts per Agent per Month (continued)
0
100
200
300
400
500
600
700
800
900
1,000
1,100
1,200
1,300
Inbo
und
Cont
acts
per
Age
nt p
er M
onth
High 1240Average ----- 383Median 313Low 54
Key Statistics
Inbound Contacts per Agent per Month
SAMPLE Outsourced Call Center Benchmark (sample report only—data is not accurate!)
44 | P a g e © M e t r i c N e t , L L C w w w . m e t r i c n e t . c o m
Productivity Metrics (continued)
Agents as a % of Total Call Center Headcount
Definition: This metric is the average Full Time Equivalent (FTE) agent headcount divided by the average total Call Center FTE headcount. It is expressed as a percentage, and represents the percen tage of total Call Center personnel who are engaged in direct customer service activities. Headcount includes both employees and contractors.
Why it’s important: The agent headcount as a percentage of total Call Center headcount is an important measure of management and overhead efficiency. Since non-agents include both management and non-management personnel (such as supervisors and team leads, QA/QC, trainers, etc.), this metric is not a pure measure of management span of control. But it is a more useful metric than management span of control because the denominator of this ratio takes into account all personnel that are not directly engaged in customer service activities.
Key correlations: Agents as a % of Total Call Center Headcount is strongly correlated with the following metrics:
Price per Contact
Price per Minute of Handle Time
𝑨𝒈𝒆𝒏𝒕𝒔 𝒂𝒔 𝒂 % 𝒐𝒇 𝑻𝒐𝒕𝒂𝒍 𝑪𝒂𝒍𝒍 𝑪𝒆𝒏𝒕𝒆𝒓 𝑯𝒆𝒂𝒅𝒄𝒐𝒖𝒏𝒕 =(𝑨𝒗𝒈. 𝑭𝑻𝑬 𝒂𝒈𝒆𝒏𝒕 𝒉𝒆𝒂𝒅𝒄𝒐𝒖𝒏𝒕)
(𝑨𝒗𝒈. 𝒕𝒐𝒕𝒂𝒍 𝑪𝒂𝒍𝒍 𝑪𝒆𝒏𝒕𝒆𝒓 𝒉𝒆𝒂𝒅𝒄𝒐𝒖𝒏𝒕)

SAMPLE Outsourced Call Center Benchmark (sample report only—data is not accurate!)
45 | P a g e © M e t r i c N e t , L L C w w w . m e t r i c n e t . c o m
Agents as a % of Total Call Center Headcount (continued)
20.0%
25.0%
30.0%
35.0%
40.0%
45.0%
50.0%
55.0%
60.0%
65.0%
Agen
ts a
s a
% o
f Tot
al C
all C
ente
r Hea
dcou
nt
High 59.2%Average ----- 49.8%Median 49.5%Low 41.0%
Key Statistics
Agents as a % of Total Call Center Headcount
SAMPLE Outsourced Call Center Benchmark (sample report only—data is not accurate!)
46 | P a g e © M e t r i c N e t , L L C w w w . m e t r i c n e t . c o m
Service Level Metrics
Average Speed of Answer (ASA)
Definition: Average Speed of Answer (ASA) is the total wait time that callers are in queue, divided by the number of calls handled. This includes calls handled by an Interactive Voice Response (IVR) system, as well as calls handled by live agents. Most Automatic Call Distributor (ACD) systems measure this number.
Why it’s important: ASA is a common service-level metric in the Call Center industry. It indicates how responsive a Call Center is to incoming calls. Since most Call Centers have an ASA service-level target, the ASA is tracked to ensure service-level compliance.
Key correlations: Average Speed of Answer is strongly correlated with the following metrics:
Call Abandonment Rate
% of Calls Answered in 30 Seconds
Agent Utilization
𝑨𝒗𝒆𝒓𝒂𝒈𝒆 𝑺𝒑𝒆𝒆𝒅 𝒐𝒇 𝑨𝒏𝒔𝒘𝒆𝒓 =(𝑻𝒐𝒕𝒂𝒍 𝒊𝒏𝒊𝒕𝒊𝒂𝒍 𝒘𝒂𝒊𝒕 𝒕𝒊𝒎𝒆 𝒐𝒇 𝒂𝒍𝒍 𝒄𝒂𝒍𝒍𝒆𝒓𝒔)
(𝑵𝒖𝒎𝒃𝒆𝒓 𝒐𝒇 𝒊𝒏𝒃𝒐𝒖𝒏𝒅 𝒄𝒂𝒍𝒍𝒔 𝒉𝒂𝒏𝒅𝒍𝒆𝒅)
SAMPLE Outsourced Call Center Benchmark (sample report only—data is not accurate!)
47 | P a g e © M e t r i c N e t , L L C w w w . m e t r i c n e t . c o m
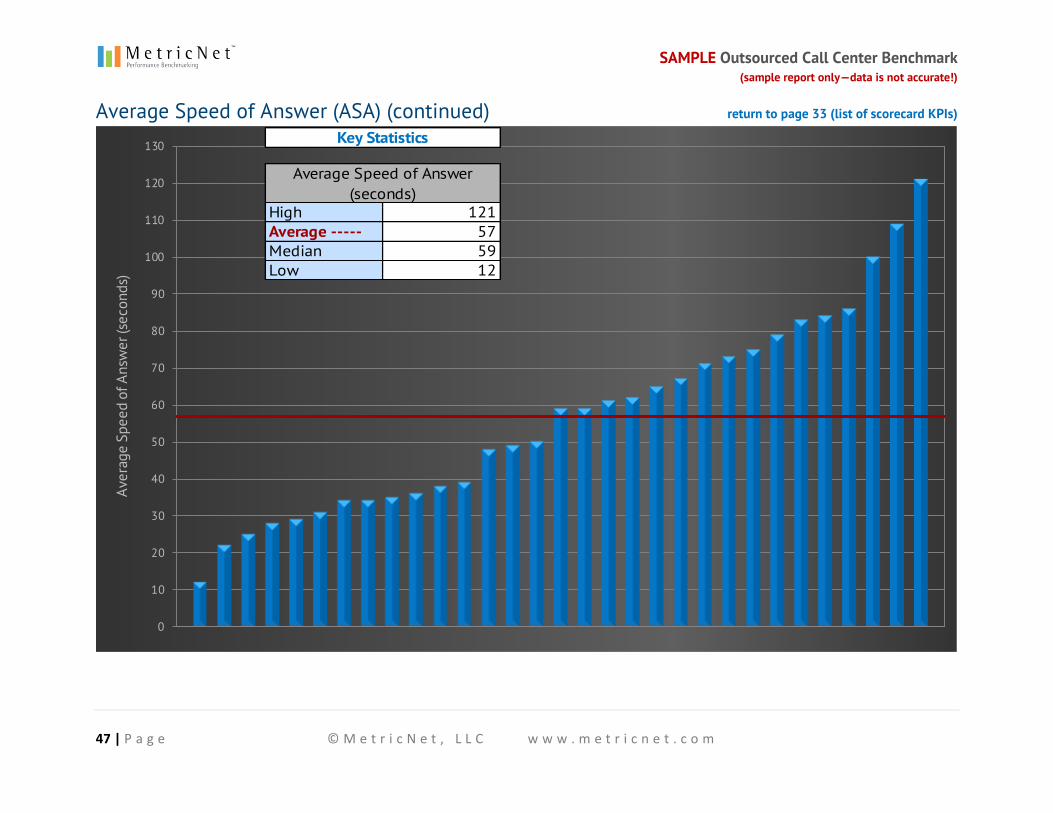
Average Speed of Answer (ASA) (continued) return to page 33 (list of scorecard KPIs)
0
10
20
30
40
50
60
70
80
90
100
110
120
130
Aver
age
Spee
d of
Ans
wer
(sec
onds
)
High 121Average ----- 57Median 59Low 12
Key Statistics
Average Speed of Answer (seconds)

SAMPLE Outsourced Call Center Benchmark (sample report only—data is not accurate!)
48 | P a g e © M e t r i c N e t , L L C w w w . m e t r i c n e t . c o m
Service Level Metrics (continued)
% of Calls Answered in 30 Seconds
Definition: This metric is fairly self-explanatory. It is the percentage of all inbound calls that are answered by a live agent within 30 seconds. For Call Centers that don’t track this exact metric , but track a similar metric such as % of Calls Answered in 60 Seconds, MetricNet uses a conversion formula to calculate the equivalent percentage of calls answered within 30 seconds.
Why it’s important: % of Calls Answered in 30 Seconds is a common service-level metric in the Call Center industry. It indicates how responsive a Call Center is to incoming calls. Many Call Centers have a service-level target for % of Calls Answered in 30 Seconds, so the metric is tracked to ensure service-level compliance.
Key correlations: % of Calls Answered in 30 Seconds is strongly correlated with the following metrics:
Average Speed of Answer
Call Abandonment Rate
Agent Utilization
% 𝒐𝒇 𝑪𝒂𝒍𝒍𝒔 𝑨𝒏𝒔𝒘𝒆𝒓𝒆𝒅 𝒊𝒏 𝟑𝟎 𝑺𝒆𝒄𝒐𝒏𝒅𝒔 =(𝑰𝒏𝒃𝒐𝒖𝒏𝒅 𝒄𝒂𝒍𝒍𝒔 𝒂𝒏𝒔𝒘𝒆𝒓𝒆𝒅 𝒊𝒏 𝟑𝟎 𝒔𝒆𝒄𝒐𝒏𝒅𝒔)
(𝑻𝒐𝒕𝒂𝒍 𝒊𝒏𝒃𝒐𝒖𝒏𝒅 𝒄𝒂𝒍𝒍𝒔)
SAMPLE Outsourced Call Center Benchmark (sample report only—data is not accurate!)
49 | P a g e © M e t r i c N e t , L L C w w w . m e t r i c n e t . c o m
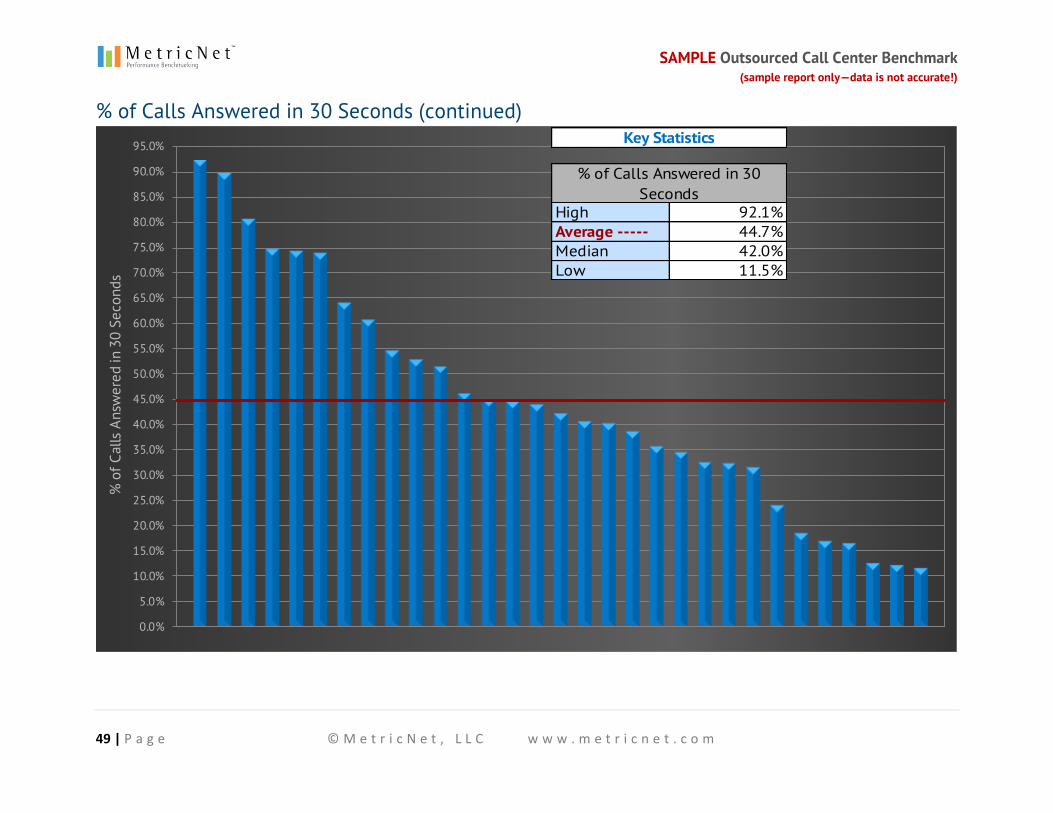
% of Calls Answered in 30 Seconds (continued)
0.0%
5.0%
10.0%
15.0%
20.0%
25.0%
30.0%
35.0%
40.0%
45.0%
50.0%
55.0%
60.0%
65.0%
70.0%
75.0%
80.0%
85.0%
90.0%
95.0%
% o
f Cal
ls A
nsw
ered
in 3
0 Se
cond
s
High 92.1%Average ----- 44.7%Median 42.0%Low 11.5%
Key Statistics
% of Calls Answered in 30 Seconds
SAMPLE Outsourced Call Center Benchmark (sample report only—data is not accurate!)
50 | P a g e © M e t r i c N e t , L L C w w w . m e t r i c n e t . c o m
Service Level Metrics (continued)
Call Abandonment Rate
Definition: Call Abandonment Rate is the percentage of calls that were connected to the ACD, but were disconnected by the caller before reaching an agent or before completing a process within the IVR.
Why it’s important: Call Abandonment Rate is a common service-level metric in the Call Center industry. An abandoned call indicates that a caller gave up and hung up the phone before receiving service from a live agent or from the IVR. Since most Call Centers have an abandonment-rate service-level target, the Call Abandonment Rate is tracked to ensure service-level compliance.
Key correlations: Call Abandonment Rate is strongly correlated with the following metrics:
Average Speed of Answer
% of Calls Answered in 30 Seconds
Agent Utilization
𝑪𝒂𝒍𝒍 𝑨𝒃𝒂𝒏𝒅𝒐𝒏𝒎𝒆𝒏𝒕 𝑹𝒂𝒕𝒆 =(𝑪𝒂𝒍𝒍𝒔 𝒂𝒃𝒂𝒏𝒅𝒐𝒏𝒆𝒅 𝒃𝒚 𝒄𝒂𝒍𝒍𝒆𝒓)
(𝑻𝒐𝒕𝒂𝒍 𝒊𝒏𝒃𝒐𝒖𝒏𝒅 𝒄𝒂𝒍𝒍𝒔)

SAMPLE Outsourced Call Center Benchmark (sample report only—data is not accurate!)
51 | P a g e © M e t r i c N e t , L L C w w w . m e t r i c n e t . c o m
Call Abandonment Rate (continued)
0.0%
2.0%
4.0%
6.0%
8.0%
10.0%
12.0%
14.0%
16.0%
18.0%
20.0%
Call
Aban
donm
ent R
ate
High 18.4%Average ----- 8.3%Median 8.6%Low 0.8%
Key Statistics
Call Abandonment Rate

SAMPLE Outsourced Call Center Benchmark (sample report only—data is not accurate!)
52 | P a g e © M e t r i c N e t , L L C w w w . m e t r i c n e t . c o m
Quality Metrics
Customer Satisfaction
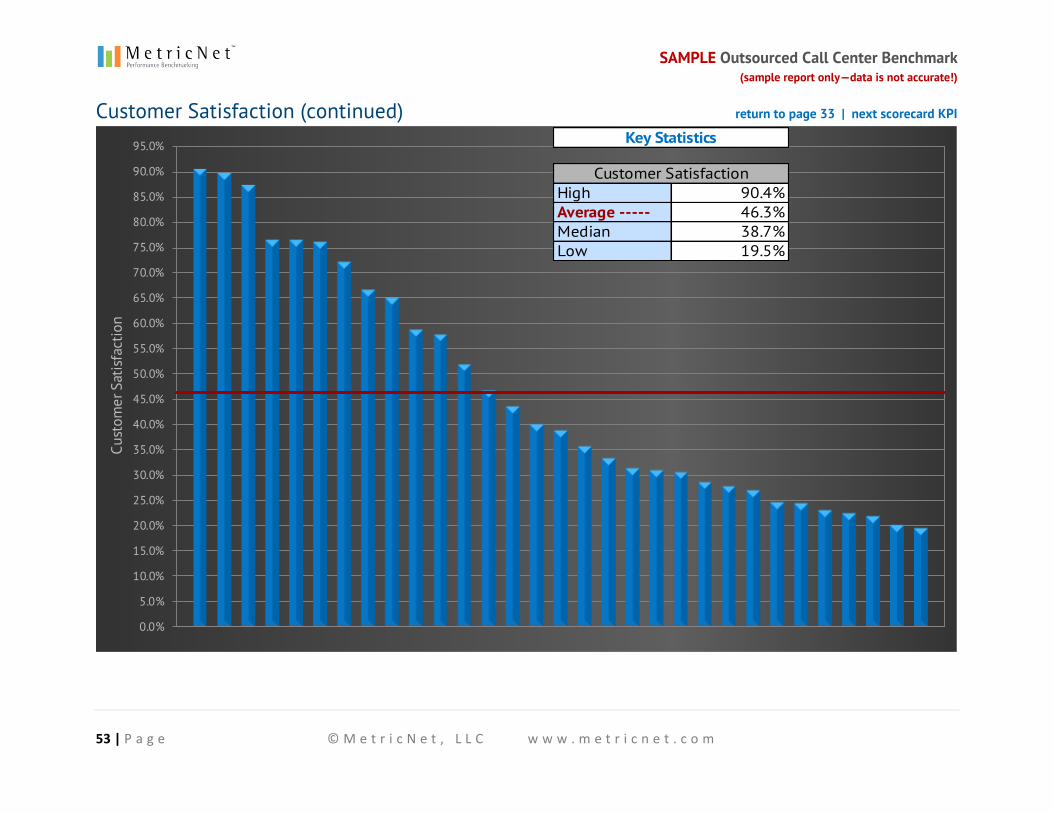
Definition: Customer Satisfaction is the percentage of customers who are either satisfied or very satisfied with their Call Center experience. This metric can be captured in a numbers of ways, including automatic after-call IVR surveys, follow-up outbound (live-agent) calls, email surveys, postal surveys, etc.
Why it’s important: Customer Satisfaction is the single most important measure of Call Center quality. Any successful Call Center will have consistently high Customer Satisfaction ratings. Some are under the impression that a low Price per Contact may justify a lower level of Customer Satisfaction. But this is not true. MetricNet’s research shows that even Call Centers with a very low Price per Contact can achieve consistently high Customer Satisfaction ratings.
Key correlations: Customer Satisfaction is strongly correlated with the following metrics:
Net First Contact Resolution Rate
Call Quality
𝑪𝒖𝒔𝒕𝒐𝒎𝒆𝒓 𝑺𝒂𝒕𝒊𝒔𝒇𝒂𝒄𝒕𝒊𝒐𝒏 =(𝑵𝒖𝒎𝒃𝒆𝒓 𝒐𝒇 𝒔𝒂𝒕𝒊𝒔𝒇𝒊𝒆𝒅 𝒐𝒓 𝒗𝒆𝒓𝒚 𝒔𝒂𝒕𝒊𝒔𝒇𝒊𝒆𝒅 𝒄𝒖𝒔𝒕𝒐𝒎𝒆𝒓𝒔)
(𝑵𝒖𝒎𝒃𝒆𝒓 𝒐𝒇 𝒄𝒖𝒔𝒕𝒐𝒎𝒆𝒓𝒔 𝒔𝒖𝒓𝒗𝒆𝒚𝒆𝒅)
SAMPLE Outsourced Call Center Benchmark (sample report only—data is not accurate!)
53 | P a g e © M e t r i c N e t , L L C w w w . m e t r i c n e t . c o m
Customer Satisfaction (continued) return to page 33 | next scorecard KPI
0.0%
5.0%
10.0%
15.0%
20.0%
25.0%
30.0%
35.0%
40.0%
45.0%
50.0%
55.0%
60.0%
65.0%
70.0%
75.0%
80.0%
85.0%
90.0%
95.0%
Cust
omer
Sat
isfa
ctio
n
High 90.4%Average ----- 46.3%Median 38.7%Low 19.5%
Key Statistics
Customer Satisfaction

SAMPLE Outsourced Call Center Benchmark (sample report only—data is not accurate!)
54 | P a g e © M e t r i c N e t , L L C w w w . m e t r i c n e t . c o m
Quality Metrics (continued)
Net First Contact Resolution Rate
Definition: Net First Contact Resolution (FCR) applies only to live (telephone) contacts. It is a percentage, equal to the number of inbound calls that are resolved on the first interaction with the customer, divided by all calls that are potentially resolvable on first contact. Calls that involve a customer callback, or are otherwise unresolved on the first contact for any reason, do not qualify for Net First Contact Resolution. Calls that cannot be resolved on first contact, such as a product break/fix, are not included in the denominator of Net First Contact Resolution Rate. Some Call Centers include email in their FCR Rate by considering an email resolved on first contact if the customer receives a resolution within a certain time of submitting the email.
Why it’s important: Net First Contact Resolution is the single biggest driver of Customer Satisfaction. A high Net FCR Rate is almost always associated with high levels of Customer Satisfaction. Call Centers that emphasize training (i.e., high training hours for new and veteran agents) generally enjoy a higher-than-average Net FCR Rate.
Key correlations: Net First Contact Resolution Rate is strongly correlated with the following metrics:
Customer Satisfaction
New Agent Training Hours
Annual Agent Training Hours
Inbound Contact Handle Time
Inbound Contacts per Agent per Month
𝑵𝒆𝒕 𝑭𝒊𝒓𝒔𝒕 𝑪𝒐𝒏𝒕𝒂𝒄𝒕 𝑹𝒆𝒔𝒐𝒍𝒖𝒕𝒊𝒐𝒏 𝑹𝒂𝒕𝒆 =(𝑪𝒂𝒍𝒍𝒔 𝒂𝒄𝒕𝒖𝒂𝒍𝒍𝒚 𝐫𝐞𝐬𝐨𝐥𝐯𝐞𝐝 𝒐𝒏 𝒇𝒊𝒓𝒔𝒕 𝒄𝒐𝒏𝒕𝒂𝒄𝒕)
(𝑪𝒂𝒍𝒍𝒔 𝐫𝐞𝐬𝐨𝐥𝐯𝐚𝐛𝐥𝐞 𝒐𝒏 𝒇𝒊𝒓𝒔𝒕 𝒄𝒐𝒏𝒕𝒂𝒄𝒕)

SAMPLE Outsourced Call Center Benchmark (sample report only—data is not accurate!)
55 | P a g e © M e t r i c N e t , L L C w w w . m e t r i c n e t . c o m
Net First Contact Resolution Rate (continued) return to page 33 | next scorecard KPI
0.0%
5.0%
10.0%
15.0%
20.0%
25.0%
30.0%
35.0%
40.0%
45.0%
50.0%
55.0%
60.0%
65.0%
70.0%
75.0%
80.0%
85.0%
90.0%
95.0%
100.0%
Net
Firs
t Con
tact
Res
olut
ion
Rate
High 95.2%Average ----- 43.9%Median 40.7%Low 4.1%
Key Statistics
Net First Contact Resolution Rate
SAMPLE Outsourced Call Center Benchmark (sample report only—data is not accurate!)
56 | P a g e © M e t r i c N e t , L L C w w w . m e t r i c n e t . c o m
Quality Metrics (continued)
Call Quality
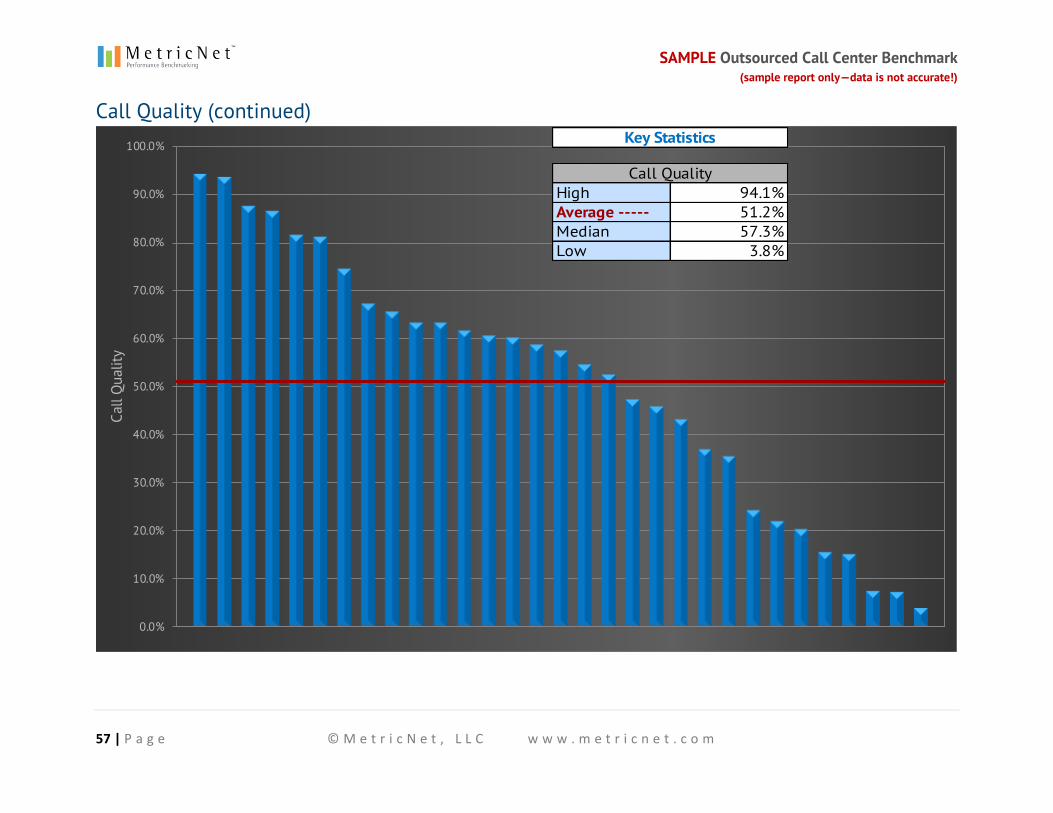
Definition: Although there is no consistent methodology for measuring Call Quality in the Call Center industry, most Call Centers have developed their own scoring system for grading the quality of a call. Most will measure call quality on a scale of zero to 100%, and evaluate such things as agent courtesy, professionalism, empathy, timeliness of resolution, quality of resolution, adherence to the script, etc.
Why it’s important: Call Quality is the foundation of Customer Satisfaction. Good Call Quality takes into account agent knowledge and expertise, call efficiency (i.e., Call Handle Time), and agent courtesy and professionalism. Unless Call Quality is consistently high, it is difficult to achieve consistently high levels of Customer Satisfaction. When measured properly, Call Quality and Customer Satisfaction should track fairly closely.
Key correlations: Call Quality is strongly correlated with the following metrics:
Customer Satisfaction
Net First Contact Resolution Rate
New Agent Training Hours
Annual Agent Training Hours
𝑪𝒂𝒍𝒍 𝑸𝒖𝒂𝒍𝒊𝒕𝒚 = 𝑨 𝒔𝒄𝒐𝒓𝒆 𝒃𝒂𝒔𝒆𝒅 𝒐𝒏 𝒕𝒉𝒆 𝒂𝒈𝒆𝒏𝒕′𝒔 𝒉𝒆𝒍𝒑𝒇𝒖𝒍𝒏𝒆𝒔𝒔, 𝒆𝒇𝒇𝒊𝒄𝒊𝒆𝒏𝒄𝒚, 𝒄𝒐𝒖𝒓𝒕𝒆𝒔𝒚, 𝒆𝒕𝒄.
SAMPLE Outsourced Call Center Benchmark (sample report only—data is not accurate!)
57 | P a g e © M e t r i c N e t , L L C w w w . m e t r i c n e t . c o m
Call Quality (continued)
0.0%
10.0%
20.0%
30.0%
40.0%
50.0%
60.0%
70.0%
80.0%
90.0%
100.0%
Call
Qua
lity
High 94.1%Average ----- 51.2%Median 57.3%Low 3.8%
Key Statistics
Call Quality

SAMPLE Outsourced Call Center Benchmark (sample report only—data is not accurate!)
58 | P a g e © M e t r i c N e t , L L C w w w . m e t r i c n e t . c o m
Agent Metrics
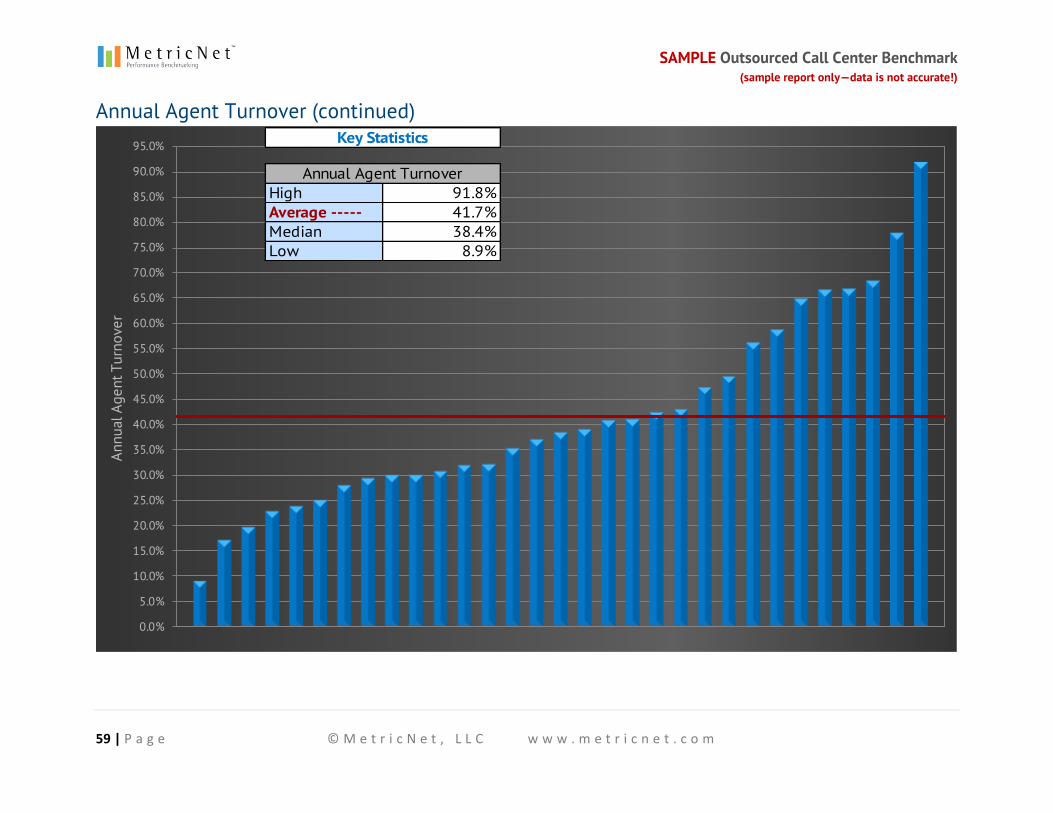
Annual Agent Turnover
Definition: Annual Agent Turnover is the average percentage of agents that leave the Call Center, for any reason (voluntarily or involuntarily), in a year.
Why it’s important: Agent turnover is costly. Each time an agent leaves the Call Center, a new agent needs to be hired to replace the outgoing agent. This results in costly recruiting, hiring, and training expenses. Additionally, it is typically several weeks or even months before an agent is fully productive, so there is lost productivity associated with agent turnover as well. High agent turnover is generally associated with low agent morale in a Call Center.
Key correlations: Annual Agent Turnover is strongly correlated with the following metrics:
Daily Agent Absenteeism
Annual Agent Training Hours
Customer Satisfaction
Net First Contact Resolution Rate
Price per Contact
Agent Job Satisfaction
𝑨𝒏𝒏𝒖𝒂𝒍 𝑨𝒈𝒆𝒏𝒕 𝑻𝒖𝒓𝒏𝒐𝒗𝒆𝒓 =(𝑨𝒗𝒈. 𝒏𝒖𝒎𝒃𝒆𝒓 𝒐𝒇 𝒂𝒈𝒆𝒏𝒕𝒔 𝒕𝒉𝒂𝒕 𝒍𝒆𝒂𝒗𝒆 𝒑𝒆𝒓 𝒚𝒆𝒂𝒓)
(𝑨𝒗𝒈. 𝒕𝒐𝒕𝒂𝒍 𝒂𝒈𝒆𝒏𝒕 𝒉𝒆𝒂𝒅𝒄𝒐𝒖𝒏𝒕)
SAMPLE Outsourced Call Center Benchmark (sample report only—data is not accurate!)
59 | P a g e © M e t r i c N e t , L L C w w w . m e t r i c n e t . c o m
Annual Agent Turnover (continued)
0.0%
5.0%
10.0%
15.0%
20.0%
25.0%
30.0%
35.0%
40.0%
45.0%
50.0%
55.0%
60.0%
65.0%
70.0%
75.0%
80.0%
85.0%
90.0%
95.0%
Annu
al A
gent
Tur
nove
r
High 91.8%Average ----- 41.7%Median 38.4%Low 8.9%
Key Statistics
Annual Agent Turnover
SAMPLE Outsourced Call Center Benchmark (sample report only—data is not accurate!)
60 | P a g e © M e t r i c N e t , L L C w w w . m e t r i c n e t . c o m
Agent Metrics (continued)
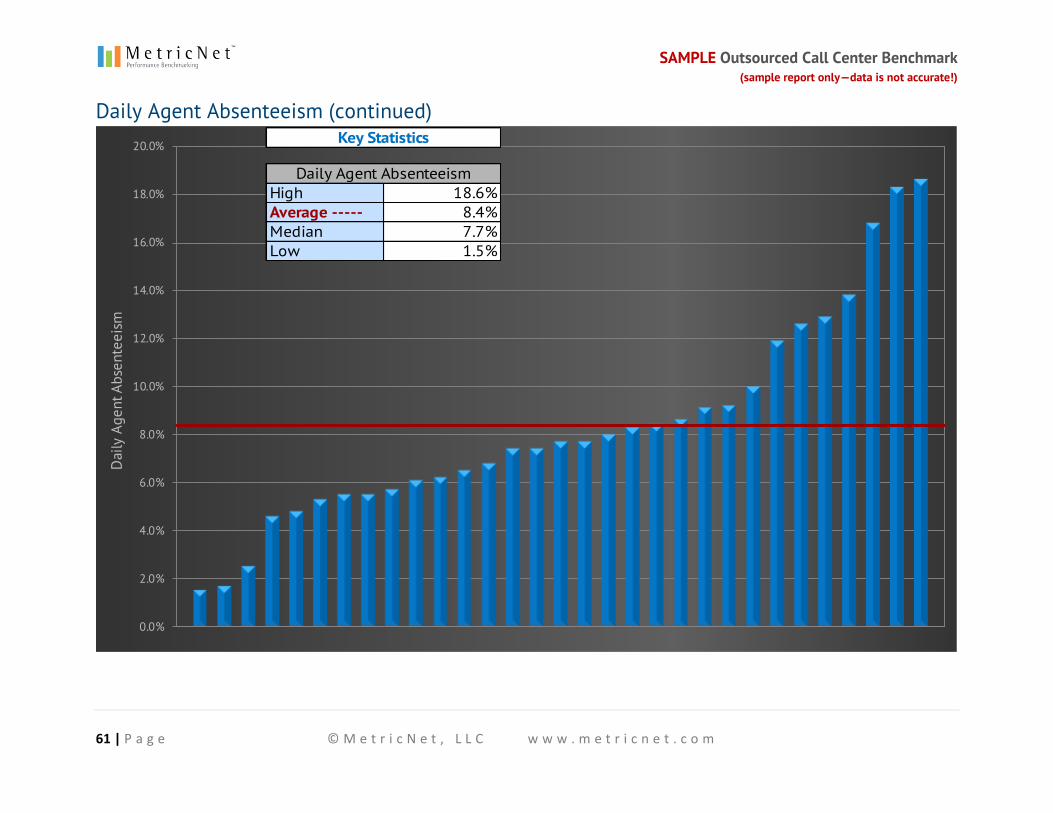
Daily Agent Absenteeism
Definition: Daily Agent Absenteeism is the average percentage o f agents with an unexcused absence on any given day. It is calculated by dividing the average number of unexcused absent agents per day by the average total number of agents per day that are scheduled to be at work.
Why it’s important: High Agent Absenteeism is problematic because it makes it difficult for a Call Center to schedule resources efficiently. High absenteeism can severely harm a Call Center ’s operating performance and increase the likelihood that service-level targets will be missed. A Call Center ’s Average Speed of Answer and Call Abandonment Rate typically suffer when absenteeism is high. Also, chronically high absenteeism is often a sign of low agent morale.
Key correlations: Daily Agent Absenteeism is strongly correlated with the following metrics:
Annual Agent Turnover
Agent Job Satisfaction
Agent Utilization
Price per Contact
Contacts per Agent per Month
𝑫𝒂𝒊𝒍𝒚 𝑨𝒈𝒆𝒏𝒕 𝑨𝒃𝒔𝒆𝒏𝒕𝒆𝒆𝒊𝒔𝒎 =(𝑨𝒗𝒈. 𝒏𝒖𝒎𝒃𝒆𝒓 𝒐𝒇 𝒖𝒏𝒆𝒙𝒄𝒖𝒔𝒆𝒅 𝒂𝒃𝒔𝒆𝒏𝒕 𝒂𝒈𝒆𝒏𝒕𝒔 𝒑𝒆𝒓 𝒅𝒂𝒚)
(𝑨𝒗𝒈. 𝒏𝒖𝒎𝒃𝒆𝒓 𝒐𝒇 𝒂𝒈𝒆𝒏𝒕𝒔 𝒔𝒄𝒉𝒆𝒅𝒖𝒍𝒆𝒅 𝒕𝒐 𝒘𝒐𝒓𝒌 𝒑𝒆𝒓 𝒅𝒂𝒚)
SAMPLE Outsourced Call Center Benchmark (sample report only—data is not accurate!)
61 | P a g e © M e t r i c N e t , L L C w w w . m e t r i c n e t . c o m
Daily Agent Absenteeism (continued)
0.0%
2.0%
4.0%
6.0%
8.0%
10.0%
12.0%
14.0%
16.0%
18.0%
20.0%
Dai
ly A
gent
Abs
ente
eism
High 18.6%Average ----- 8.4%Median 7.7%Low 1.5%
Key Statistics
Daily Agent Absenteeism
SAMPLE Outsourced Call Center Benchmark (sample report only—data is not accurate!)
62 | P a g e © M e t r i c N e t , L L C w w w . m e t r i c n e t . c o m
Agent Metrics (continued)
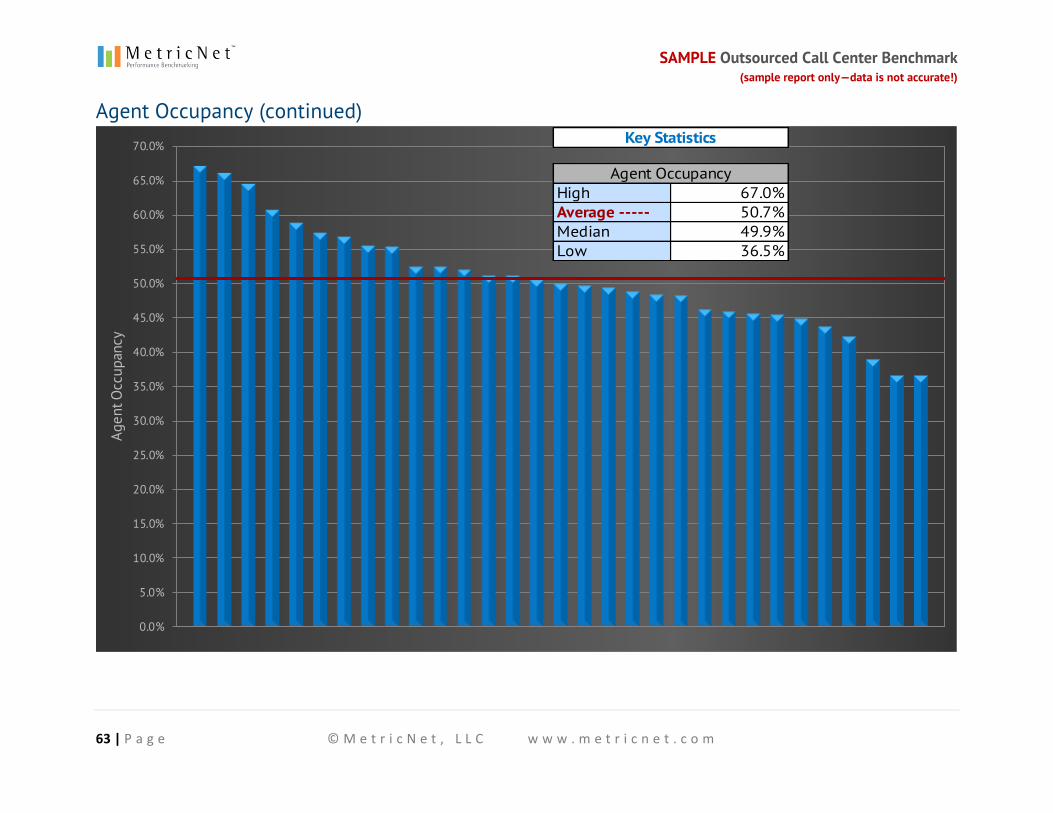
Agent Occupancy
Definition: Agent Occupancy is a percentage, equal to the amount of time that an agent is in his or her seat and connected to the ACD and either engaged in a call or ready to answer a call, divided by the agent’s total number of hours at work (excluding break time and lunch time).
Why it’s important: Agent Occupancy is an indirect measure of agent productivity and Agent Schedule Adherence. High levels of Agent Occupancy indicate an orderly, disciplined work environment. Conversely, low levels of Agent Occupancy are often accompanied by a chaotic, undisciplined work environment. Agent Occupancy and Agent Utilization are sometimes confused. Although Agent Occupancy and Agent Utilization are correlated, they are very different metrics. It is possible to have a high occupancy (when agents are logged into the ACD a large percentage of the time) but a low Agent Utilization (when few calls are coming in).
Key correlations: Agent Occupancy is strongly correlated with the following metrics:
Agent Utilization
Agent Schedule Adherence
Inbound Contacts per Agent per Month
Price per Contact
𝑨𝒈𝒆𝒏𝒕 𝑶𝒄𝒄𝒖𝒑𝒂𝒏𝒄𝒚 =(𝑯𝒐𝒖𝒓𝒔 𝒕𝒉𝒂𝒕 𝒂𝒈𝒆𝒏𝒕𝒔 𝒂𝒓𝒆 𝒓𝒆𝒂𝒅𝒚 𝒕𝒐 𝒂𝒏𝒔𝒘𝒆𝒓 𝒐𝒓 𝒂𝒄𝒕𝒖𝒂𝒍𝒍𝒚 𝒐𝒏 𝒄𝒂𝒍𝒍𝒔)
(𝑻𝒐𝒕𝒂𝒍 𝒂𝒈𝒆𝒏𝒕 𝒘𝒐𝒓𝒌 𝒉𝒐𝒖𝒓𝒔)
SAMPLE Outsourced Call Center Benchmark (sample report only—data is not accurate!)
63 | P a g e © M e t r i c N e t , L L C w w w . m e t r i c n e t . c o m
Agent Occupancy (continued)
0.0%
5.0%
10.0%
15.0%
20.0%
25.0%
30.0%
35.0%
40.0%
45.0%
50.0%
55.0%
60.0%
65.0%
70.0%
Agen
t Occ
upan
cy
High 67.0%Average ----- 50.7%Median 49.9%Low 36.5%
Key Statistics
Agent Occupancy
SAMPLE Outsourced Call Center Benchmark (sample report only—data is not accurate!)
64 | P a g e © M e t r i c N e t , L L C w w w . m e t r i c n e t . c o m
Agent Metrics (continued)
Agent Schedule Adherence
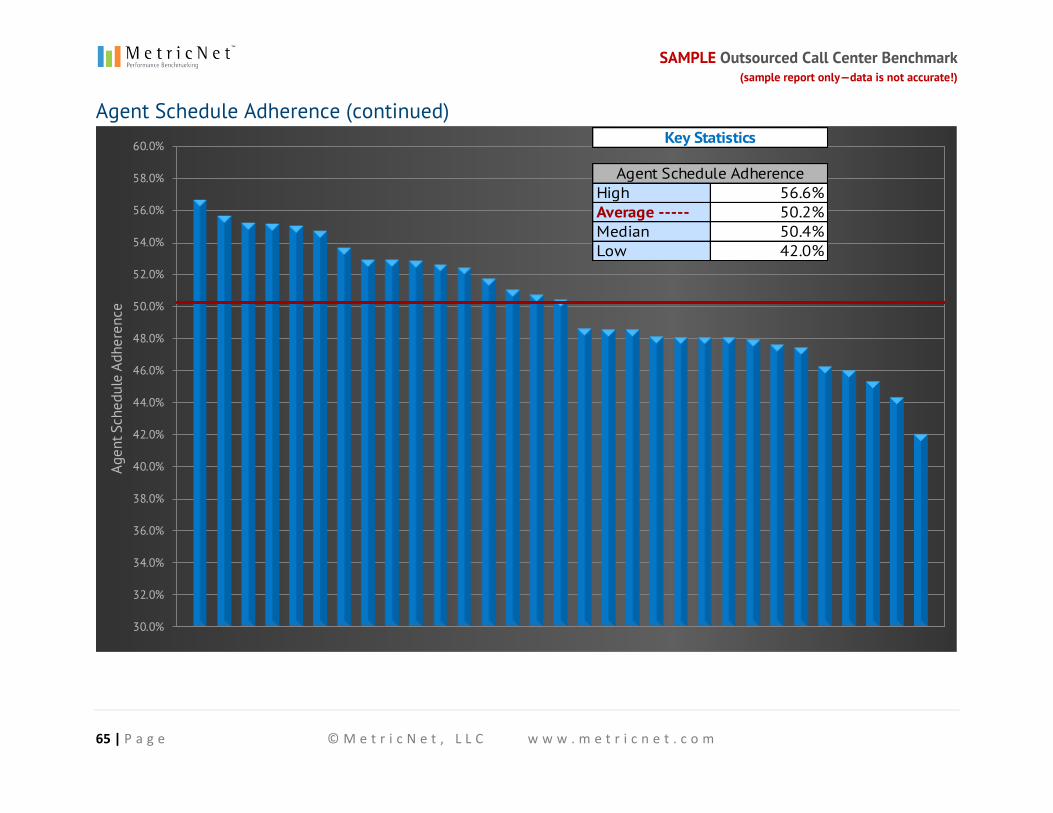
Definition: Agent Schedule Adherence measures whether agents are in their seats ready to accept calls as scheduled . That is, it measures how well a Call Center ’s agents are “adhering” to the schedule. Agent Schedule Adherence is equal to the actual time that an agent is logged in to the system ready to accept calls, divided by the total time the agent is scheduled to be available to accept calls.
Why it’s important: Effective agent scheduling is critical to achieving a Call Center ’s service-level goals and maximizing Agent Utilization. But a work schedule, no matter how well constructed, is only as good as the adherence to the schedule. It is therefore important for agents to adhere to the schedule as closely as possible to ensure that these productivity and servi ce-level goals are met.
Key correlations: Agent Schedule Adherence is strongly correlated with the following metrics:
Agent Utilization
Inbound Contacts per Agent per Month
Agent Occupancy
Average Speed of Answer
𝑨𝒈𝒆𝒏𝒕 𝑺𝒄𝒉𝒆𝒅𝒖𝒍𝒆 𝑨𝒅𝒉𝒆𝒓𝒆𝒏𝒄𝒆 =(𝑯𝒐𝒖𝒓𝒔 𝒕𝒉𝒂𝒕 𝒂𝒈𝒆𝒏𝒕𝒔 𝒂𝒓𝒆 𝒂𝒗𝒂𝒊𝒍𝒂𝒃𝒍𝒆 𝒇𝒐𝒓 𝒐𝒓 𝒐𝒏 𝒄𝒂𝒍𝒍𝒔)
(𝑯𝒐𝒖𝒓𝒔 𝒕𝒉𝒂𝒕 𝒂𝒈𝒆𝒏𝒕𝒔 𝒂𝒓𝒆 𝒔𝒄𝒉𝒆𝒅𝒖𝒍𝒆𝒅 𝒕𝒐 𝒃𝒆 𝒂𝒗𝒂𝒊𝒍𝒂𝒃𝒍𝒆)
SAMPLE Outsourced Call Center Benchmark (sample report only—data is not accurate!)
65 | P a g e © M e t r i c N e t , L L C w w w . m e t r i c n e t . c o m
Agent Schedule Adherence (continued)
30.0%
32.0%
34.0%
36.0%
38.0%
40.0%
42.0%
44.0%
46.0%
48.0%
50.0%
52.0%
54.0%
56.0%
58.0%
60.0%
Agen
t Sch
edul
e Ad
here
nce
High 56.6%Average ----- 50.2%Median 50.4%Low 42.0%
Key Statistics
Agent Schedule Adherence

SAMPLE Outsourced Call Center Benchmark (sample report only—data is not accurate!)
66 | P a g e © M e t r i c N e t , L L C w w w . m e t r i c n e t . c o m
Agent Metrics (continued)
New Agent Training Hours
Definition: The name of this metric is somewhat self-explanatory. New Agent Training Hours is the number of training hours (including classroom, computer-based training, self-study, shadowing, being coached, and on-the-job training) that a new agent receives before he or she is allowed to handle customer contacts independently.
Why it’s important: New Agent Training Hours are strongly correlated with Call Quality and Net First Contact Resolution Rate , especially during an agent’s first few months on the job. The more training that new agents receive, the higher that Call Quality and Net FCR will typically be. This, in turn, has a positive effect on many other performance metrics including Customer Satisfaction. Perhaps most importantly, training levels strongly impact agent morale—agents who receive more training typically have higher levels of job satisfaction.
Key correlations: New Agent Training Hours are strongly correlated with the following metrics:
Call Quality
Net First Contact Resolution Rate
Customer Satisfaction
Inbound Contact Handle Time
Agent Job Satisfaction
𝑵𝒆𝒘 𝑨𝒈𝒆𝒏𝒕 𝑻𝒓𝒂𝒊𝒏𝒊𝒏𝒈 𝑯𝒐𝒖𝒓𝒔 = 𝑵𝒖𝒎𝒃𝒆𝒓 𝒐𝒇 𝒕𝒓𝒂𝒊𝒏𝒊𝒏𝒈 𝒉𝒐𝒖𝒓𝒔 𝐫𝐞𝐪𝐮𝐢𝐫𝐞𝐝 𝒃𝒆𝒇𝒐𝒓𝒆
𝒂 𝒏𝒆𝒘 𝒂𝒈𝒆𝒏𝒕 𝒎𝒂𝒚 𝒉𝒂𝒏𝒅𝒍𝒆 𝒄𝒐𝒏𝒕𝒂𝒄𝒕𝒔 𝒊𝒏𝒅𝒆𝒑𝒆𝒏𝒅𝒆𝒏𝒕𝒍𝒚

SAMPLE Outsourced Call Center Benchmark (sample report only—data is not accurate!)
67 | P a g e © M e t r i c N e t , L L C w w w . m e t r i c n e t . c o m
New Agent Training Hours (continued)
0
25
50
75
100
125
150
175
200
225
250
275
300
325
350
375
400
New
Age
nt T
rain
ing
Hou
rs
High 375Average ----- 107Median 96Low 2
Key Statistics
New Agent Training Hours
SAMPLE Outsourced Call Center Benchmark (sample report only—data is not accurate!)
68 | P a g e © M e t r i c N e t , L L C w w w . m e t r i c n e t . c o m
Agent Metrics (continued)
Annual Agent Training Hours
Definition: Annual Agent Training Hours is the average number of training hours (including classroom, computer-based training, self-study, shadowing, etc.) that an agent receives on an annual basis. This number includes any training hours that an agent receives that are not part of the agent’s initial (new-agent) training. But it does not include routine team meetings, shift handoffs, or other activities that do not involve formal training.
Why it’s important: Annual Agent Training Hours are strongly corre lated with Call Quality, Net First Contact Resolution Rate, and Customer Satisfaction. Perhaps most importantly, training levels strongly impact agent morale—agents who receive more training typically have higher levels of job satisfaction.
Key correlations: Annual Agent Training Hours are strongly correlated with the following metrics:
Call Quality
Net First Contact Resolution Rate
Customer Satisfaction
Inbound Contact Handle Time
Agent Job Satisfaction
𝑨𝒏𝒏𝒖𝒂𝒍 𝑨𝒈𝒆𝒏𝒕 𝑻𝒓𝒂𝒊𝒏𝒊𝒏𝒈 𝑯𝒐𝒖𝒓𝒔 = 𝑨𝒗𝒆𝒓𝒂𝒈𝒆 𝒏𝒖𝒎𝒃𝒆𝒓 𝒐𝒇 𝒇𝒐𝒓𝒎𝒂𝒍 𝒕𝒓𝒂𝒊𝒏𝒊𝒏𝒈 𝒉𝒐𝒖𝒓𝒔 𝒑𝒆𝒓 𝒂𝒈𝒆𝒏𝒕 𝒑𝒆𝒓 𝒚𝒆𝒂𝒓 (𝒆𝒙𝒄𝒍𝒖𝒅𝒊𝒏𝒈 𝒏𝒆𝒘– 𝒉𝒊𝒓𝒆 𝒕𝒓𝒂𝒊𝒏𝒊𝒏𝒈 𝒉𝒐𝒖𝒓𝒔)

SAMPLE Outsourced Call Center Benchmark (sample report only—data is not accurate!)
69 | P a g e © M e t r i c N e t , L L C w w w . m e t r i c n e t . c o m
Annual Agent Training Hours (continued)
0
10
20
30
40
50
60
70
80
90
100
110
120
130
Annu
al A
gent
Tra
inin
g H
ours
High 122Average ----- 22Median 15Low 0
Key Statistics
Annual Agent Training Hours
SAMPLE Outsourced Call Center Benchmark (sample report only—data is not accurate!)
70 | P a g e © M e t r i c N e t , L L C w w w . m e t r i c n e t . c o m
Agent Metrics (continued)
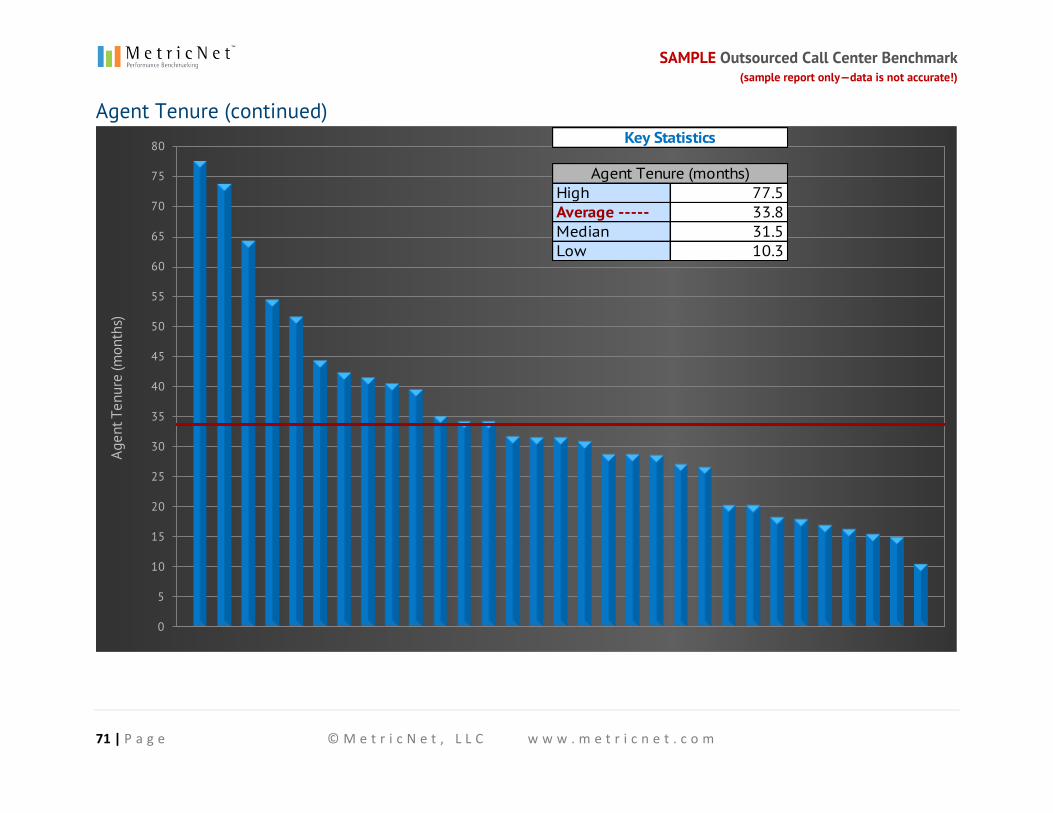
Agent Tenure
Definition: Agent Tenure is the average number of months that each agent has worked in a particular Call Center.
Why it’s important: Agent Tenure is a measure of agent experience. Almost every metric related to Call Center price and quality is impacted by the level of experience the agents have.
Key correlations: Agent Tenure is strongly correlated with the following metrics:
Price per Contact
Call Quality
Customer Satisfaction
Annual Agent Turnover
Agent Training Hours
Agent Coaching Hours
Inbound Contact Handle Time
Net First Contact Resolution Rate
Agent Job Satisfaction
𝑨𝒈𝒆𝒏𝒕 𝑻𝒆𝒏𝒖𝒓𝒆 = 𝑨𝒗𝒆𝒓𝒂𝒈𝒆 𝒏𝒖𝒎𝒃𝒆𝒓 𝒐𝒇 𝒎𝒐𝒏𝒕𝒉𝒔 𝒕𝒉𝒂𝒕 𝒆𝒂𝒄𝒉
𝒂𝒈𝒆𝒏𝒕 𝒉𝒂𝒔 𝒘𝒐𝒓𝒌𝒆𝒅 𝒊𝒏 𝒚𝒐𝒖𝒓 𝑪𝒂𝒍𝒍 𝑪𝒆𝒏𝒕𝒆𝒓
SAMPLE Outsourced Call Center Benchmark (sample report only—data is not accurate!)
71 | P a g e © M e t r i c N e t , L L C w w w . m e t r i c n e t . c o m
Agent Tenure (continued)
0
5
10
15
20
25
30
35
40
45
50
55
60
65
70
75
80
Agen
t Ten
ure
(mon
ths)
High 77.5Average ----- 33.8Median 31.5Low 10.3
Key Statistics
Agent Tenure (months)
SAMPLE Outsourced Call Center Benchmark (sample report only—data is not accurate!)
72 | P a g e © M e t r i c N e t , L L C w w w . m e t r i c n e t . c o m
Agent Metrics (continued)
Agent Job Satisfaction
Definition: Agent Job Satisfaction is the percentage of agents in a Call Center who are either satisfied or very satisfied with their jobs.
Why it’s important: Agent Job Satisfaction is a proxy for agent morale. And morale, while difficult to measure, affects performance on almost every metric in the Call Center. High-performance Call Centers almost always have high levels of Agent Job Satisfaction. A Call Center can control and improve its performance on this metric through training, coaching, and career pathing.
Key correlations: Agent Job Satisfaction is strongly correlated with the following metrics:
Annual Agent Turnover
Daily Agent Absenteeism
Agent Training Hours
Agent Coaching Hours
Customer Satisfaction
Net First Contact Resolution Rate
Inbound Contact Handle Time
Price per Contact
𝑨𝒈𝒆𝒏𝒕 𝑱𝒐𝒃 𝑺𝒂𝒕𝒊𝒔𝒇𝒂𝒄𝒕𝒊𝒐𝒏 =(𝑵𝒖𝒎𝒃𝒆𝒓 𝒐𝒇 𝒔𝒂𝒕𝒊𝒔𝒇𝒊𝒆𝒅 𝒐𝒓 𝒗𝒆𝒓𝒚 𝒔𝒂𝒕𝒊𝒔𝒇𝒊𝒆𝒅 𝒂𝒈𝒆𝒏𝒕𝒔)
(𝑻𝒐𝒕𝒂𝒍 𝒏𝒖𝒎𝒃𝒆𝒓 𝒐𝒇 𝒂𝒈𝒆𝒏𝒕𝒔)

SAMPLE Outsourced Call Center Benchmark (sample report only—data is not accurate!)
73 | P a g e © M e t r i c N e t , L L C w w w . m e t r i c n e t . c o m
Agent Job Satisfaction (continued) return to page 33 | next scorecard KPI
0.0%
5.0%
10.0%
15.0%
20.0%
25.0%
30.0%
35.0%
40.0%
45.0%
50.0%
55.0%
60.0%
65.0%
70.0%
Agen
t Job
Sat
isfa
ctio
n
High 65.8%Average ----- 50.9%Median 50.6%Low 37.8%
Key Statistics
Agent Job Satisfaction

SAMPLE Outsourced Call Center Benchmark (sample report only—data is not accurate!)
74 | P a g e © M e t r i c N e t , L L C w w w . m e t r i c n e t . c o m
Contact Handling Metrics
Inbound Contact Handle Time
Definition: Inbound Contact Handle Time for live (telephone) contacts is the average time (in minutes) that an agent spends on each contact, including talk time, wrap time, and after-call work time. For non-live contacts, such as email, voicemail, and faxes, the Inbound Contact Handle Time is the average time that an agent initially spends on each inbound contact.
Why it’s important: A contact is the basic unit of work in a Call Center. Contact Handle Time, therefore, represents the amount of labor required to complete one unit of work.
Key correlations: Inbound Contact Handle Time is strongly correlated with the following metrics:
Price per Contact
Inbound Contacts per Agent per Month
Net First Contact Resolution Rate
𝑰𝒏𝒃𝒐𝒖𝒏𝒅 𝑪𝒐𝒏𝒕𝒂𝒄𝒕 𝑯𝒂𝒏𝒅𝒍𝒆 𝑻𝒊𝒎𝒆 =(𝑻𝒐𝒕𝒂𝒍 𝒎𝒊𝒏𝒖𝒕𝒆𝒔 𝒔𝒑𝒆𝒏𝒕 𝒐𝒏 𝒊𝒏𝒃𝒐𝒖𝒏𝒅 𝒄𝒐𝒏𝒕𝒂𝒄𝒕𝒔)
(𝑻𝒐𝒕𝒂𝒍 𝒊𝒏𝒃𝒐𝒖𝒏𝒅 𝒄𝒐𝒏𝒕𝒂𝒄𝒕𝒔)

SAMPLE Outsourced Call Center Benchmark (sample report only—data is not accurate!)
75 | P a g e © M e t r i c N e t , L L C w w w . m e t r i c n e t . c o m
Inbound Contact Handle Time (continued)
0.00
2.00
4.00
6.00
8.00
10.00
12.00
14.00
16.00
18.00
20.00
Inbo
und
Cont
act H
andl
e Ti
me
(all
cont
acts
) (m
inut
es)
High 19.05Average ----- 8.48Median 7.50Low 0.03
Key Statistics
Inbound Contact Handle Time (all contacts) (minutes)
SAMPLE Outsourced Call Center Benchmark (sample report only—data is not accurate!)
76 | P a g e © M e t r i c N e t , L L C w w w . m e t r i c n e t . c o m
Contact Handling Metrics (continued)
IVR Containment Rate
Definition: The IVR Containment Rate is the percentage of inbound contacts that are contained within the IVR and resolved by the customer without assistance from a live agent. A customer who opts out of the IVR to speak with a live agent does not count toward the IVR Containment Rate because the customer did not resolve the issue before speaking with a live agent.
Why it’s important: The Call Center’s cost for IVR-contained contacts is significantly lower than it is for agent-assisted calls. Increasing the number of contacts resolved through the IVR permits a significantly reduced Price per Contact. Many Call Centers, recognizing the potential to reduce their costs, constantly strive to increase their IVR Containment Rates.
Key correlations: IVR Containment Rate is strongly correlated with the following metrics:
Price per Contact
Inbound Contact Handle Time
𝑰𝑽𝑹 𝑪𝒐𝒏𝒕𝒂𝒊𝒏𝒎𝒆𝒏𝒕 𝑹𝒂𝒕𝒆 =(𝑵𝒖𝒎𝒃𝒆𝒓 𝒐𝒇 𝑰𝑽𝑹-𝒓𝒆𝒔𝒐𝒍𝒗𝒆𝒅 𝒄𝒐𝒏𝒕𝒂𝒄𝒕𝒔)
(𝑻𝒐𝒕𝒂𝒍 𝒏𝒖𝒎𝒃𝒆𝒓 𝒐𝒇 𝒊𝒏𝒃𝒐𝒖𝒏𝒅 𝒄𝒐𝒏𝒕𝒂𝒄𝒕𝒔)
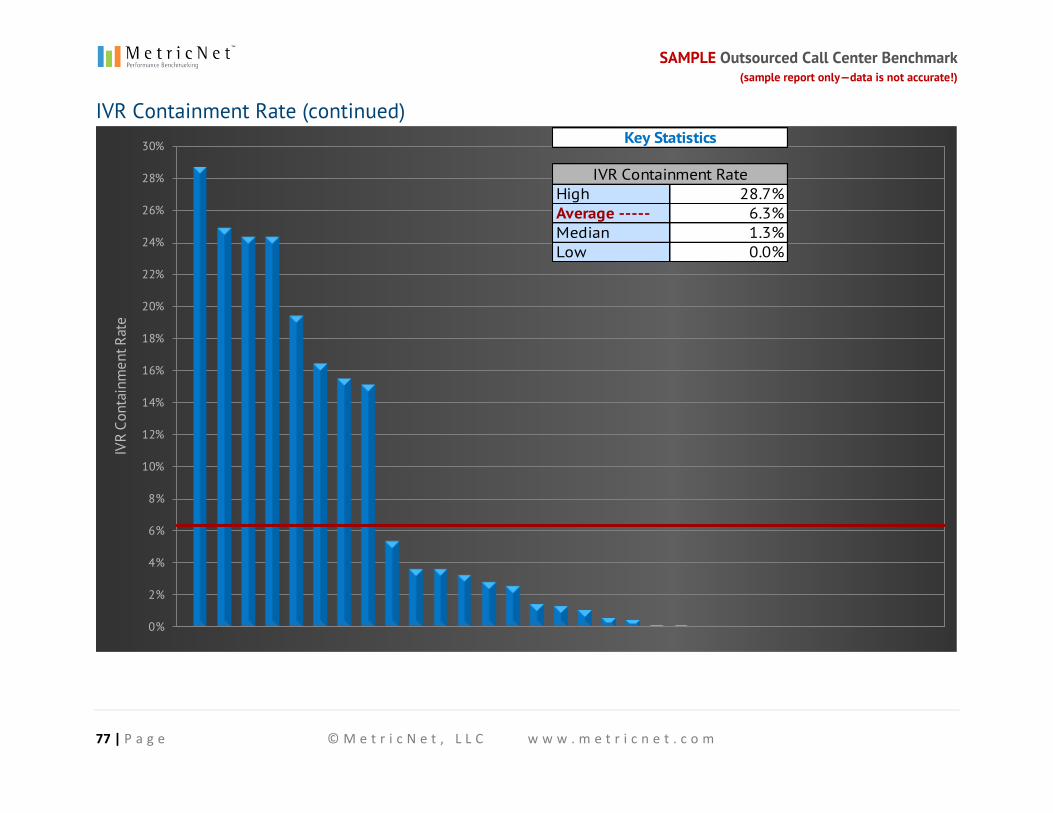
SAMPLE Outsourced Call Center Benchmark (sample report only—data is not accurate!)
77 | P a g e © M e t r i c N e t , L L C w w w . m e t r i c n e t . c o m
IVR Containment Rate (continued)
0%
2%
4%
6%
8%
10%
12%
14%
16%
18%
20%
22%
24%
26%
28%
30%
IVR
Cont
ainm
ent R
ate
High 28.7%Average ----- 6.3%Median 1.3%Low 0.0%
Key Statistics
IVR Containment Rate

SAMPLE Outsourced Call Center Benchmark (sample report only—data is not accurate!)
78 | P a g e © M e t r i c N e t , L L C w w w . m e t r i c n e t . c o m
About MetricNet
MetricNet, LLC is the leading source of benchmarks, scorecards, and performance metrics for Information Technology and Call Center Professionals worldwide. Our mission is to provide you with the benchmarks you need to run your business more effectively.
MetricNet has pioneered a number of innovative techniques to ensure that you receive fast, accurate benchmarks, with a minimum of time and effort.
In addition to our industry benchmarks , such as this report, MetricNet also offers:
The One Year Path to World-Class Performance , a continuous Call Center
improvement program.
Benchmarking data files for those who wish to conduct their own
benchmarking analysis.
Comprehensive peer group benchmarks that compare your performance to
others in your vertical market.
Free Resources
Every month, MetricNet presents a live training webcast. Thousa nds of professionals attend each year and many of our clients have their entire teams attend. These events are a great way to boost Annual Agent Training Hours! Topics include Service Desk Best Practices and KPIs, Desktop Support Best Practices and KPIs, C all Center Best Practices and KPIs, and more. Sign up for our Free Webcasts .
We also have developed an extensive resource library filled with free training materials for Information Technology and Call Center professionals. Each resource is available to download in PDF format. Browse our resource library .