sample report: global online shopping snapshot 2016
TRANSCRIPT
© Copyright 2015 ystats.com GmbH & Co. KG, 22765 Hamburg, Germany 2

3
4
GENERAL METHODOLOGY OF MARKET REPORTS
Secondary Market Research
The reports are compiled based on secondary market research. Secondary research is information gathered from previously published sources. Our reports are
solely based on information and data acquired from national and international statistical offices, industry and trade associations, business reports, business and
company databases, journals, company registries, news portals and many other reliable sources. By using various sources we ensure maximum objectivity for
all obtained data. As a result, companies gain a precise and unbiased impression of the market situation.
Cross referencing of data is conducted in order to ensure validity and reliability.
The source of information and its release date are provided on every chart. It is possible that the information contained in one chart is derived from several
sources. If this is the case, all sources are mentioned on the chart.
The reports include mainly data from the last 12 months prior to the date of report publication. Exact publication dates are mentioned in every chart.
Definitions
The reports take into account a broad definition of B2C E-Commerce, which might include mobile commerce. As definitions may vary among sources, exact
definition used by the source (if available) is included at the bottom of the chart.
Chart Types
Our reports include text charts, pie charts, bar charts, rankings, line graphs and tables. Every chart contains an Action Title, which summarizes the main
idea/finding of the chart and a Subtitle, which provides necessary information about the country, the topic, units or measures of currency, and the applicable time
period(s) to which the data refers. With respect to rankings, it is possible that the summation of all categories amounts to more than 100%. In this case, multiple
answers were possible, which is noted at the bottom of the chart.
Report Structure
Reports are comprised of the following elements, in the following order: Cover page, preface, legal notice, methodology, definitions, table of contents,
management summary (summarizing main information contained in each section of report) and report content (divided into sections and chapters). When
available, we also include forecasts in our report content. These forecasts are not our own; they are published by reliable sources. Within Global and Regional
reports, we include all major developed and emerging markets, ranked in order of importance by using evaluative criteria such as sales figures.
Notes and Currency Values
If available, additional information about the data collection, for example the time of survey and number of people surveyed, is provided in the form of a note. In
some cases, the note (also) contains additional information needed to fully understand the contents of the respective data.
When providing information about amounts of money, local currencies are most often used. When referencing currency values in the Action Title, the EUR
values are also provided in brackets. The conversions are always made using the average currency exchange rate for the respective time period. Should the
currency figure be in the future, the average exchange rate of the past 12 months is used.
5
METHODOLOGY OF THE CURRENT REPORT
Report Coverage
This report provides a snapshot of the global B2C E-Commerce market, including relevant information about global B2C E-Commerce sales and trends,
international comparisons, products purchased by online shoppers worldwide, their preferences regarding delivery and payment methods, as well as a global
ranking of the leading B2C E-Commerce market players.
Report Structure
The “Global Sales and Shares” chapter opens the report, including B2C E-Commerce sales growth, forecasts and share of total retail sales worldwide.
Next, the “Regional Comparisons” chapter compares global regions with regard to their contribution to global sales, B2C E-Commerce’s share of total retail
sales in each region, Internet users growth and penetration.
The “Country Comparisons” chapter follows with a ranking of top countries by B2C E-Commerce sales, growth, market attractiveness and online shoppers’
share.
The “Trends” chapter includes information related to important global market trends, such as cross-border B2C E-Commerce, M-Commerce, and social
commerce.
Major product categories purchased by online shoppers worldwide are revealed in the “Products” chapter.
The next two chapters, “Payment” and “Delivery”, cover information related to delivery and payment methods most used by global online shoppers.
Finally, the “Players” chapter includes a global ranking of top companies by B2C E-Commerce sales.

6
DEFINITIONS
B2C E-COMMERCE the sale of products (and services) through electronic transactions via the Internet from businesses to
consumers.
B2C E-COMMERCE SALES the total sales generated either on the B2C E-Commerce market in a certain country or region, or the total
sales generated through B2C E-Commerce by a player on the market.
M-COMMERCE M-Commerce, also called “Mobile Commerce”, means the sale of products (and services) through electronic
transactions via mobile devices, such as mobile phones, tablets and smartphones.
CROSS-BORDER B2C E-COMMERCE the sale of goods (and services) directly to consumers in other countries, with orders made online through
foreign online shops and delivered from the country where the foreign shop is based or from a central logistics
facility, i.e. across the country’s borders.
INTERNET USERS the total number of inhabitants in a certain country that regularly accesses the Internet.
ONLINE SHOPPERS the total number of inhabitants in a certain country or region that participates in B2C E-Commerce.
ONLINE PAYMENT transfer of money made over the Internet following a consumer’s payment command, includes payments for
product and service purchase in E-Commerce and M-Commerce.
OMNICHANNEL an approach to retail that strives to provide the customer with the seamless shopping experience across all
retail channels, such as in-store, online and mobile.
The following expressions and definitions are used in this B2C E-Commerce market report*:
Note: *the definitions used by the original sources might differ from the ones stated on this chart; the exact definition used by each source, where available, is included on the respective
charts

7
TABLE OF CONTENTS (1 OF 2)
1. Management Summary
2. Global Sales and Shares
• B2C E-Commerce Sales of Products and Services Worldwide, excl. Travel and Event Tickets, in USD billion, and in % Share of Total Retail
Sales, in 2014 - 2019f
• B2C E-Commerce Sales of Physical and Digital Goods Worldwide, in USD billion, 2014-2019f, and in % Share of Total Retail Sales, 2014 &
2019f
3. Regional Comparisons
• Breakdown of Global B2C E-Commerce Sales, by Regions and Sub-Regions, in %, 2014 & 2019f
• B2C E-Commerce Share of Total Retail Sales, by Regions, in %, 2014 & 2019f
• Number of Internet Users, by Global Regions, in millions, and in % Change, 2010 & 2015
• Internet Penetration, by Regional and Global Medians, in % of Adults, May 2015
4. Country Comparisons
• Top 10 Countries by B2C E-Commerce Sales, in USD billion, 2014 - 2019 and CAGR, in %, 2014 – 2019
• B2C E-Commerce Sales CAGR in the BRIC Countries, by Country, in %, 2009-2014 and 2014-2019f
• Top 10 Countries by B2C E-Commerce Market Attractiveness Index, and Index Composition, incl. Index for Online Market Size, Consumer
Behavior, Growth Potential, Infrastructure and Total Score for Online Market Attractiveness, 2015
• Top 10 Developing Economies in B2C E-Commerce Index, incl. Global Rank, 2016, Share of Individuals Using Internet, 2014, Share of
Individuals with Credit Card, 2014, Secure Internet Servers per 1 million People, 2014, UPU Postal Reliability Score and UNCTAD B2C E-
Commerce Index Value, 2015
• Top 10 Countries by Number of Online Shoppers, in millions, incl. Penetration, in % of Internet Users and in % of Population, 2014
• Top 5 Countries by Share of Global Online Shoppers, in %, 2019f, and Their Shares in 2015
• Top 5 Countries by Share of Active Online Shoppers, in % of Population, Q4 2015
5. Trends
• Top Factors Driving Online Purchase and In-Store Purchase, in % of Consumers, November 2015
• Breakdown of Mobile Phone Ownership, by Smartphone, Other Mobile Phone and No Mobile Phone, in % of Adults, by Regional and Global
Medians, May 2015
• Share of Online Shoppers Buying Products via Mobile, in %, 2014 & 2015
• Breakdown of M-Commerce Transactions, by Mobile Browser and App, in %, Q4 2015

8
TABLE OF CONTENTS (2 OF 2)
5. Trends (Cont.)
• Cross-Border B2C E-Commerce Sales, in USD billion and in % of Total B2C E-Commerce Sales, 2014 – 2020f
• Breakdown of Cross-Border E-Commerce Sales, by Regions, in %, 2025f
• Cross-Border Online Shopper Penetration, by Selected Countries, in % of Online Shoppers, Oct. 2015
• Actions Conducted on Mobile Phones While Being in-Store, incl. “Compare Prices”, in % of Mobile Phone Users, 2014
• Share of Online Shoppers Who are Concerned that Their Personal Information Could be Stolen, in %, 2014 & 2015
• Social Media Activities Influencing Online Shopping Behavior, in % of Online Shoppers, September 2015
• Share of Online Shoppers Visiting Social Media Sites for Inspiration when Searching for Products, by Age Groups, in %, August 2015
• Share of Online Shoppers Who Would Consider Purchasing from Marketplaces and from Retailers’ Websites, by Global Average and Top 3
Countries, in %, August 2015
• Major Reasons for Shopping Cart Abandonment, in % of Online Shoppers, by Selected Regions, October 2014
6. Products
• Product Categories Most Purchased Online, by Generation, in % of Online Shoppers, November 2015
7. Payment
• Payment Methods Used in Online Shopping, in % of Online Shoppers, 2015
• Share of Consumers Who Are Satisfied with the Payment Methods Used, by POS, Browser and Mobile, in % of Consumers in Selected
Developed Countries, June 2015
• Share of Online Shoppers Paying with Cash on Delivery, in %, by Selected Emerging Markets, 2015
8. Delivery
• Most Important Delivery Options in Online Shopping, in % of Online Shoppers, Q1 2015 & Q4 2014
• Share of Online Shoppers Willing to Pay More for Faster Shipping, by Selected Countries, in %, Q1 2015 & Q4 2014
9. Players
• Top 20 B2C E-Commerce Retailers, by B2C E-Commerce Sales, incl. Rank among Top Online Retailers, Rank among Top Retailers,
Company Name, Country of Origin, Retail E-Commerce Sales, in USD million, Share of Total Retail Revenues, in %, Growth Rate, in %,
2014, and CAGR, 2009-2014

9
1. Management Summary 09 – 11
2. Global Sales and Shares 12 – 14
3. Regional Comparisons 15 – 19
4. Country Comparisons 20 – 27
5. Trends 28 – 41
6. Products 42 – 43
7. Payment 44 – 47
8. Delivery 48 – 50
9. Players 51 – 53
10
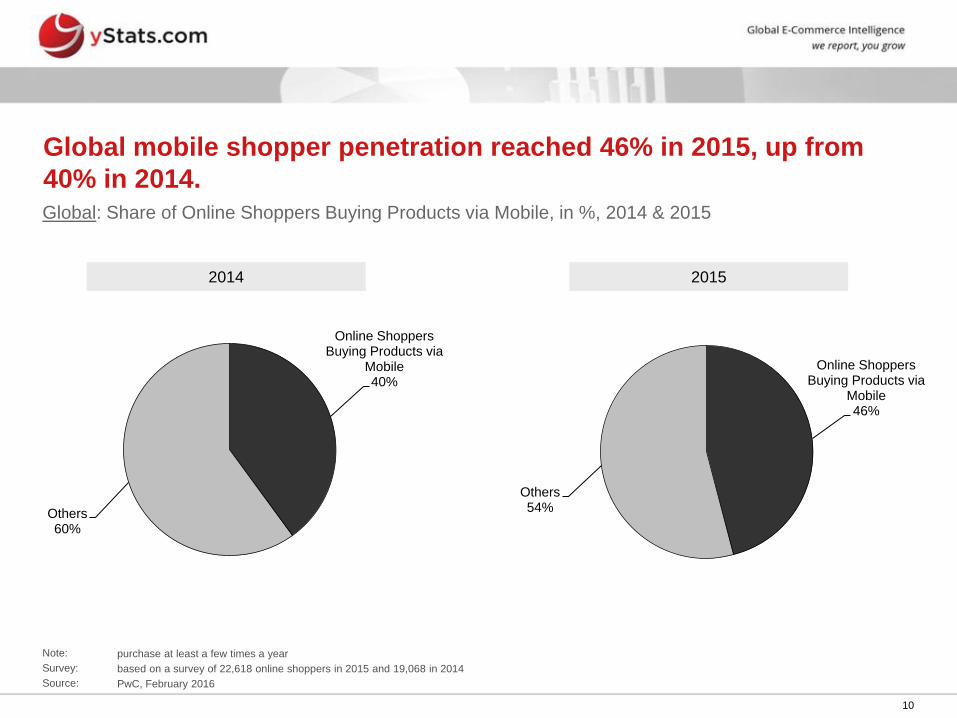
Online Shoppers Buying Products via
Mobile 40%
Others 60%
2015 2014
Global mobile shopper penetration reached 46% in 2015, up from
40% in 2014. Global: Share of Online Shoppers Buying Products via Mobile, in %, 2014 & 2015
Note: purchase at least a few times a year
Survey: based on a survey of 22,618 online shoppers in 2015 and 19,068 in 2014
Source: PwC, February 2016
Online Shoppers Buying Products via
Mobile 46%
Others 54%
11
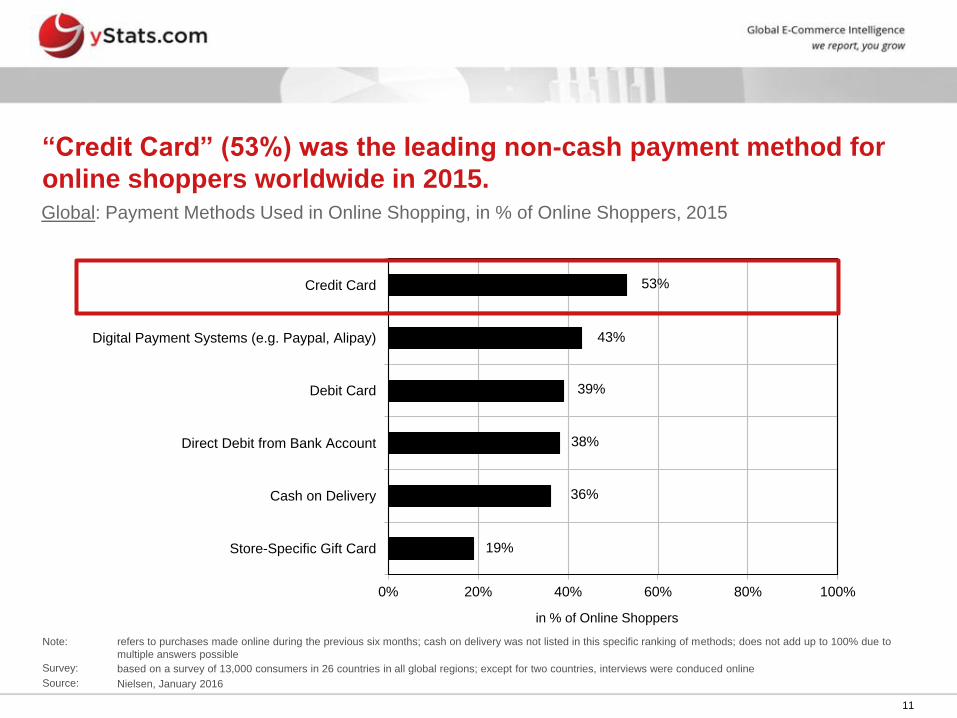
19%
36%
38%
39%
43%
53%
0% 20% 40% 60% 80% 100%
Store-Specific Gift Card
Cash on Delivery
Direct Debit from Bank Account
Debit Card
Digital Payment Systems (e.g. Paypal, Alipay)
Credit Card
in % of Online Shoppers
“Credit Card” (53%) was the leading non-cash payment method for
online shoppers worldwide in 2015. Global: Payment Methods Used in Online Shopping, in % of Online Shoppers, 2015
Note: refers to purchases made online during the previous six months; cash on delivery was not listed in this specific ranking of methods; does not add up to 100% due to
multiple answers possible
Survey: based on a survey of 13,000 consumers in 26 countries in all global regions; except for two countries, interviews were conduced online
Source: Nielsen, January 2016

12