sample preparation and ionization mode comparison … · sample preparation and ionization mode...
TRANSCRIPT

Sample Preparation
and Ionization Mode Comparison Study
for the Quantification of
25-Hydroxy Vitamin D2/D3
by LC/MS/MS for Clinical Research
Rory Doyle
Senior LC/MS Applications Scientist
Agilent Technologies
For Research Use Only. Not for use in diagnostic procedures.
Page 2
Objectives
Comparison Study between Electrospray (ESI) and Atmospheric Pressure (APCI) ionization modes
Comparison Study between 2-dimensional and 1-dimensional liquid chromatography (LC) modes
Sample Preparation comparison between Liquid-Liquid Extraction (LLE), Protein Precipitation (PPT), and Solid Phase Extraction (SPE)
For Research Use Only. Not for use in diagnostic procedures.

Page 3
Materials- Reagents
Biological Solutions
Human Serum Double Charcoal Stripped, Delipidized Golden West BiologicalsBovine Serum Albumin 10% Golden West Biologicals
Solvents
Methanol HoneywellAcetonitrile HoneywellFormic Acid Sigma-Aldrich
Phosphate Buffer Saline
Sodium Chloride Sigma-AldrichSodium Phosphate Dibasic/Monobasic Sigma-Aldrich
Other
Zinc Sulphate Sigma-Aldrich
For Research Use Only. Not for use in diagnostic procedures.

Page 4
Materials- Standards
25-Hydroxy-Vitamin D3 Isosciences
25-Hydroxy-Vitamin D2
25-Hydroxy-Vitamin D3-2H3
25-Hydroxy-Vitamin D2-2H3
Calibrators from 0.01 to 1000 ng/ml made up in 5% BSA/0.1M PBS solution
UTAK Vitamin D PLUS Controls Low, 1 and 2
NIST Standards SRM 972- Levels 1 to 4
For Research Use Only. Not for use in diagnostic procedures.

Page 5
Method 1D: Agilent 1200 RR-HPLC SL System
HPLC: binary pump, well plate sampler, thermostatic column compartment
Column: Poroshell 120 EC-C18, 2.1 x 50mm, 2.7 µm
Column temperature: 50°C
Injection volume: 10 mL
Auto sampler temp: 5°C
Needle wash: flush port (50:25:25, IPA:MeOH:H2O) 5 seconds
Mobile phase: A = H2O + 0.1% Formic AcidB = MeOH + 0.1% Formic Acid
Flow rate: 0.5 mL/min
Isocratic Analysis: A =20% B= 80%
Analysis Time: 5.0 min
For Research Use Only. Not for use in diagnostic procedures.

Page 6
Method 2D: Agilent 1200 RR-HPLC SL System
HPLC: 2 x binary pump, well plate sampler, thermostatic column compartment
Column A: Eclipse Plus-C18 Guard Column 2.1 x 12.5mm, 5 µm
Column B: Poroshell 120 EC-C18, 2.1 x 50mm, 2.7 µm
Column temperature: 50°C
Injection volume: 10 mL
Auto sampler temp: 5°C
Needle wash: flush port (50:25:25, IPA:MeOH:H2O) 5 seconds
Mobile phase: A = H2O + 0.1% Formic Acid
B = MeOH + 0.1% Formic Acid
Flow rate: 0.5 mL/min
Isocratic Analysis: A =15% B= 85%
Analysis Time: 5.0 min
For Research Use Only. Not for use in diagnostic procedures.

Page 7
Solvent Parameters
1D
Eluting Column-20%/80%
Time B%
0 80
2.3 80
2.4 98
3.9 98
4 80
2D
Loading Column 50%/50%
Time B%
1 90
2.3 90
2.4 98
3.3 98
3.4 50
Elutting Column-15%/85%
3.2 85
3.3 98
3.8 98
3.81 85
5 85
For Research Use Only. Not for use in diagnostic procedures.

Page 8
On-line Sample Clean-up (2D) Flow Diagram
Position 1: 1.9 mins Position 2: 2.4 mins
For Research Use Only. Not for use in diagnostic procedures.

Page 9
Methods: MS Parameters Used
Parameters used in this comparisonMS: Agilent 6400 Series HS Triple Quadrupole LC/MS/MS
QQQ MS Conditions-6430
Ion Mode: Positive APCI ESI
Source conditions:
Drying Gas Temp: 350 ºC 275 ºC Vaporizer Temp: 250 ºC ---Drying Gas Flow: 5 L/min 10 L/min (5)Nebulizer Pressure: 25 psi 50 psi (45)
Capillary Voltage 3000 V 5000 VCorona Current: 2 μA ---Charging Voltage: --- ---
MRM acquisition: (Q1 peak width = 0.7 and Q2 peak width = 0.70 m/z)
Delta EMV 200 to 400VNote- 6460 Sheath Gas temp- 325 ºC/ Gas Flow- 11 L/min
For Research Use Only. Not for use in diagnostic procedures.

Page 10
Methods: Other MS Parameters
Other parameters used in previous Agilent studiesMS: Agilent 6400 Series HS Triple Quadrupole LC/MS/MS
QQQ MS Conditions
Ion Mode: Positive APPI* MM-APCI MM-ESI MM-ESI + APCI
Source conditions:
Drying Gas Temp: 350 ºC 250 ºC 250 ºC 250 ºCVaporizer Temp: 250 ºC 170 ºC 170 ºC 170 ºCDrying Gas Flow: 5 L/min 5 L/min 5 L/min 5 L/minNebulizer Pressure: 20 psi 60 psi 60 psi 60 psi
Capillary Voltage 3000 V 3000 V 3000 V 3000 VCorona Current: --- 2 μA --- 2 μACharging Voltage: --- --- 2000 V 2000 V
MRM acquisition: (Q1 peak width = 0.7 and Q2 peak width = 0.70 m/z)
Delta EMV 200 to 400V
*APPI- Post column addition of 5% Toluene
For Research Use Only. Not for use in diagnostic procedures.

Page 11
MS MRM Transition Ions- ESI Mode
Compound MRM Fragmentor (V) Dwell (msec) Collision Energy (V)
25-Hydroxy Vitamin D3
401.3 > 383.2 106 100 4
401.3 > 159.1 106 100 24
25-Hydroxy Vitamin D2
413.3 > 395.3 106 100 4
413.4 > 355.2 106 100 4
IS-25-Hydroxy Vitamin D3- 2H3 404.4 > 386.3 106 100 4
IS-25-Hydroxy Vitamin D2-2H3 416.4 > 398.3 106 100 4
For Research Use Only. Not for use in diagnostic procedures.
Page 12
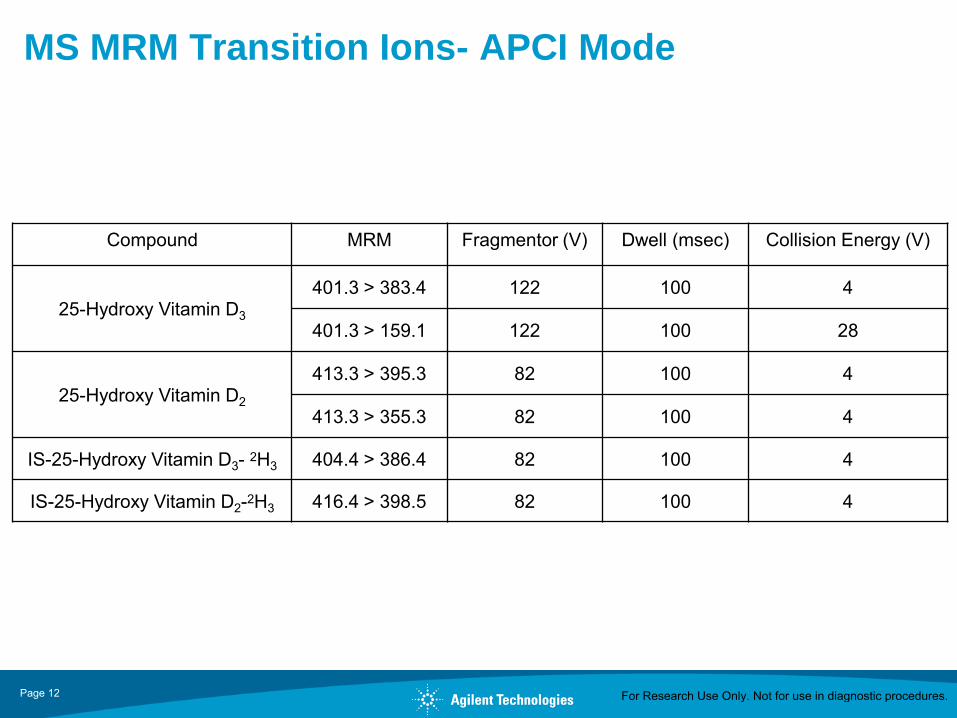
MS MRM Transition Ions- APCI Mode
Compound MRM Fragmentor (V) Dwell (msec) Collision Energy (V)
25-Hydroxy Vitamin D3
401.3 > 383.4 122 100 4
401.3 > 159.1 122 100 28
25-Hydroxy Vitamin D2
413.3 > 395.3 82 100 4
413.3 > 355.3 82 100 4
IS-25-Hydroxy Vitamin D3- 2H3 404.4 > 386.4 82 100 4
IS-25-Hydroxy Vitamin D2-2H3 416.4 > 398.5 82 100 4
For Research Use Only. Not for use in diagnostic procedures.

Page 13
Other MS MRM Transition Ions- APCI/ESI Mode
Compound MRM Fragmentor (V) Dwell (msec) Collision Energy (V)
25-Hydroxy Vitamin D3
383.3 > 365.4 152 100 8
383.3 > 211.1 152 100 20
25-Hydroxy Vitamin D2
395.3 > 269.1 152 100 16
395.3 > 211.1 152 100 24
IS-25-Hydroxy Vitamin D3-2H3 386.3 > 368.4 152 100 12
IS-25-Hydroxy Vitamin D2-2H3 398.4> 272.2 152 100 20
For Research Use Only. Not for use in diagnostic procedures.

Page 14
Structures
25-Hydroxyvitamin D2
C28H44O2
MW 412.3 g/mol
25-Hydroxyvitamin D3
C27H44O2
MW 400.3 g/mol
For Research Use Only. Not for use in diagnostic procedures.

Page 15
Internal Standard Structures
25-Hydroxyvitamin D2-2H3
C28H41D3O2
MW 415.3 g/mol
25-Hydroxyvitamin D3-2H3
C27H41D3O2
MW 403.3 g/mol
For Research Use Only. Not for use in diagnostic procedures.

Page 16
Effect of temperature on (M+H)+ Formation
(M+H)+
(M+Na)+
[(M+H)-OH]+
ESI-D2 Drying Gas 200º 275º 350ºAPCI- Vaporization temperature more important
For Research Use Only. Not for use in diagnostic procedures.

Page 17
Product Ion: MRM Ion Selection-D3
For Research Use Only. Not for use in diagnostic procedures.

Page 18
Product Ion: MRM Ion Selection-D2
For Research Use Only. Not for use in diagnostic procedures.
Page 19
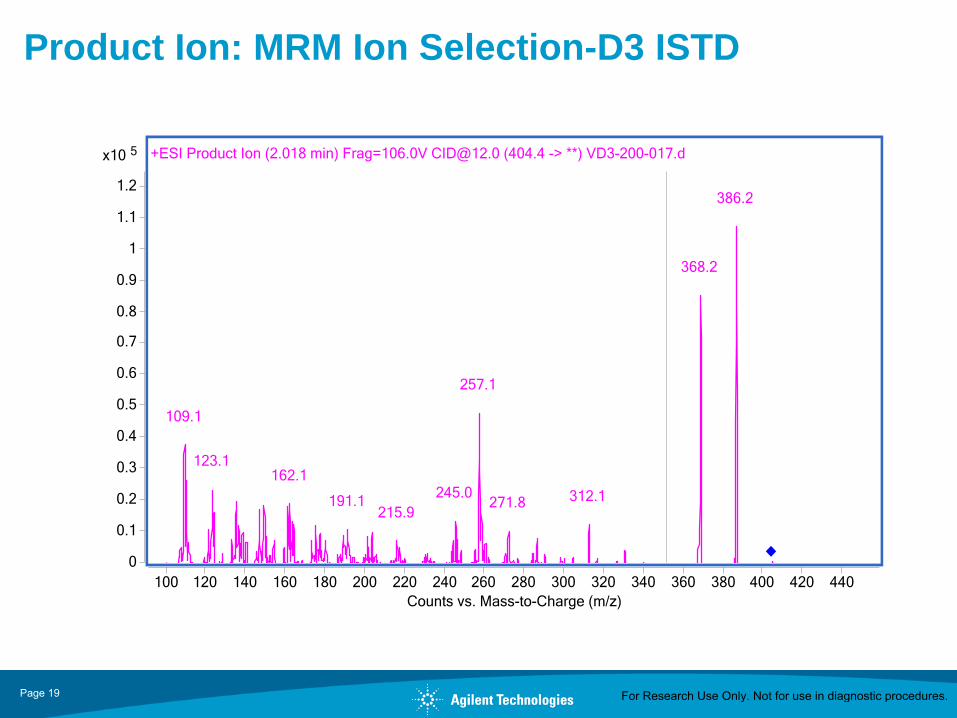
Product Ion: MRM Ion Selection-D3 ISTD
For Research Use Only. Not for use in diagnostic procedures.

Page 20
Product Ion: MRM Ion Selection- D2 ISTD
For Research Use Only. Not for use in diagnostic procedures.
Page 21
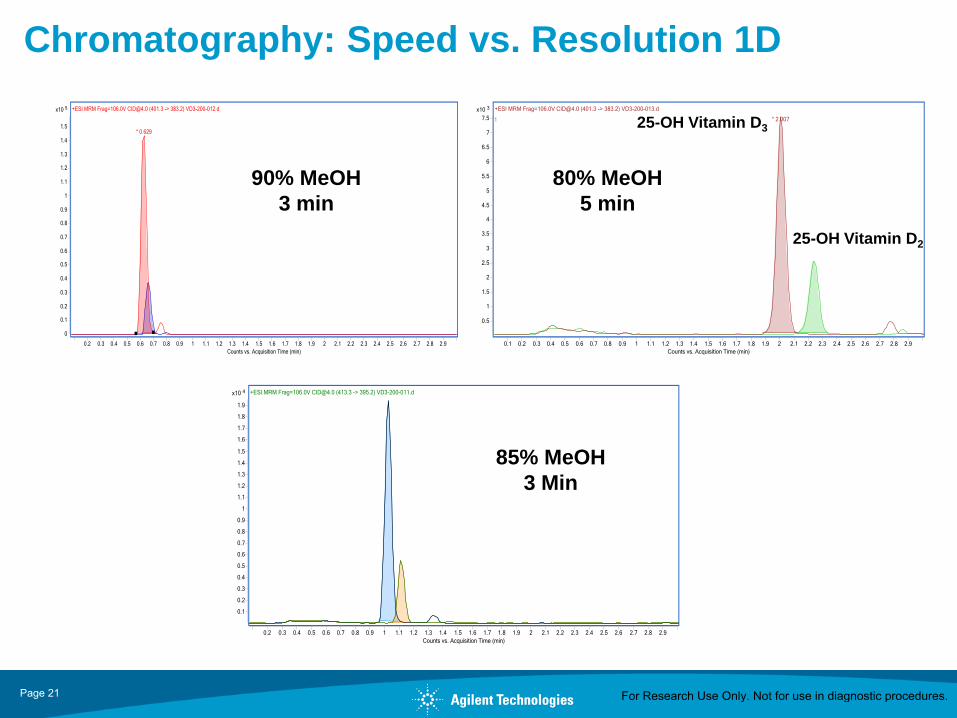
Chromatography: Speed vs. Resolution 1D
90% MeOH 85% MeOH
80% MeOH
90% MeOH
3 min
80% MeOH
5 min
85% MeOH
3 Min
25-OH Vitamin D3
25-OH Vitamin D2
For Research Use Only. Not for use in diagnostic procedures.

Page 22
Sample Preparation- Protein Crash
150 µL of plasma or serum
+
15 µL ISTD at 1000 ng/mL
+
150 µL of saturated solution of ZnSO4
+
300 µL of Acetonitrile
Vortex for 30 seconds, let stand for 15 minutes
Centrifuge @ 3000 rpm for 10 minutes
Transfer clear liquid to UniPerp vial or filtration well plate
(NB- Avoid the pellet)
Analyze by LC-MS-MS
For Research Use Only. Not for use in diagnostic procedures.
Page 23
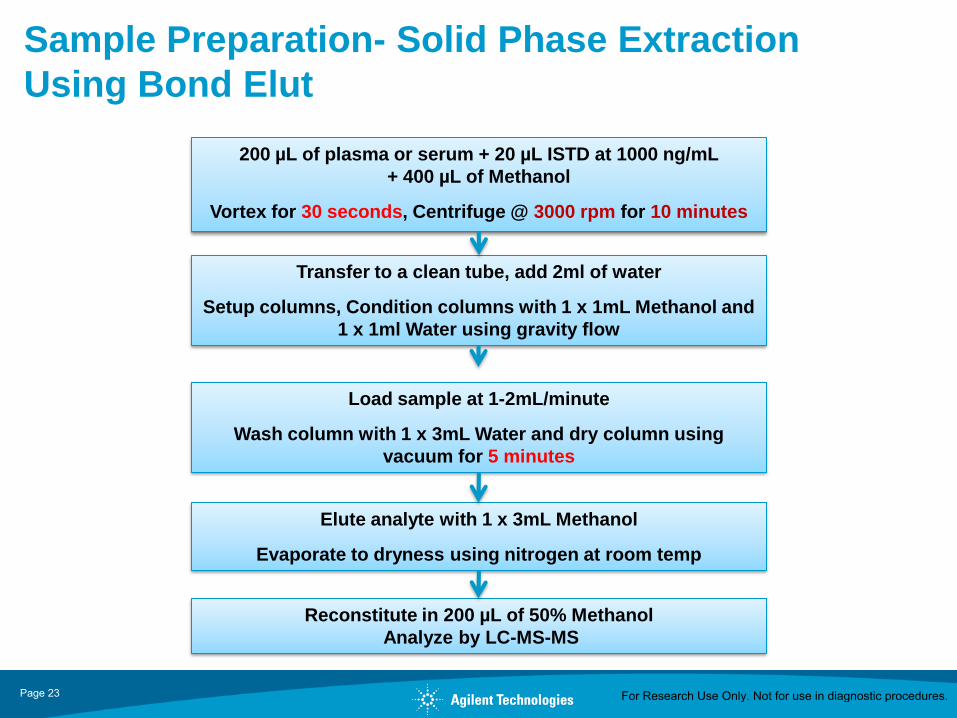
Sample Preparation- Solid Phase Extraction
Using Bond Elut
200 µL of plasma or serum + 20 µL ISTD at 1000 ng/mL
+ 400 µL of Methanol
Vortex for 30 seconds, Centrifuge @ 3000 rpm for 10 minutes
Transfer to a clean tube, add 2ml of water
Setup columns, Condition columns with 1 x 1mL Methanol and
1 x 1ml Water using gravity flow
Load sample at 1-2mL/minute
Wash column with 1 x 3mL Water and dry column using
vacuum for 5 minutes
Elute analyte with 1 x 3mL Methanol
Evaporate to dryness using nitrogen at room temp
Reconstitute in 200 µL of 50% Methanol
Analyze by LC-MS-MS
For Research Use Only. Not for use in diagnostic procedures.

Page 24
Sample Preparation- Liquid/Liquid Extraction
150 μL of plasma or serum + 15 μL ISTD at 1000ng/ml
Vortex 30 seconds, let it stand 10 minutes in room temp
150 μL of 0.2M of ZnSO4 + 300 μL Methanol
Vortex 30 seconds
750 μL Hexane
Vortex 30 seconds
Centrifuge @ 13000 rpm for 5 minutes
Transfer Hexane layer (top) to a tube
then evaporate under N2
Reconstitute in 200 μL in 50%Methanol
Analyze by LC-MS-MS
For Research Use Only. Not for use in diagnostic procedures.
Page 25
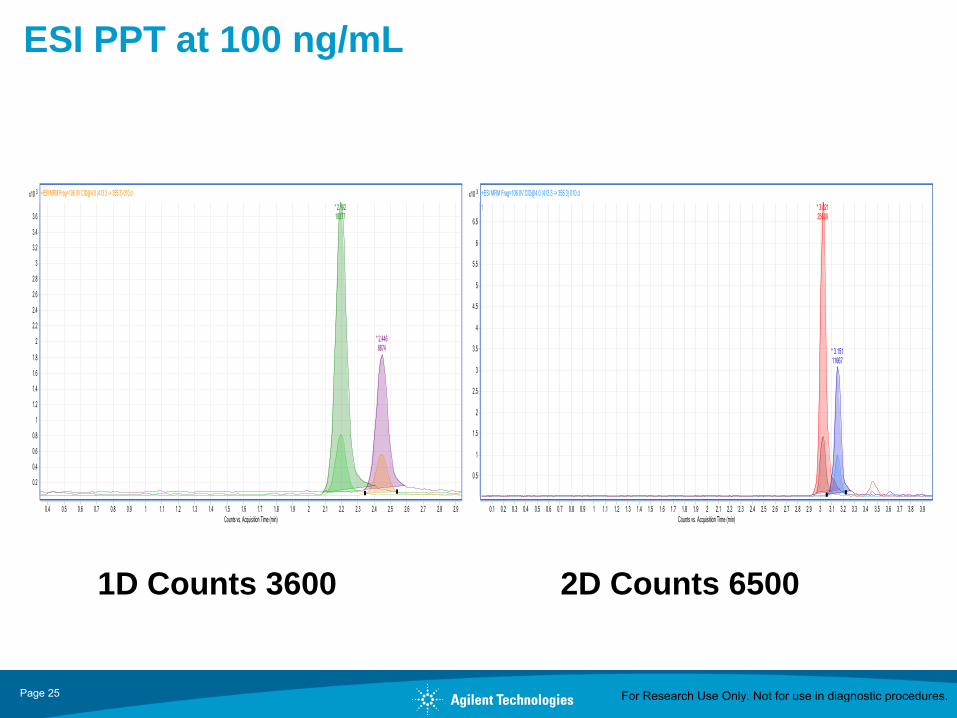
ESI PPT at 100 ng/mL
1D Counts 3600 2D Counts 6500
For Research Use Only. Not for use in diagnostic procedures.
Page 26
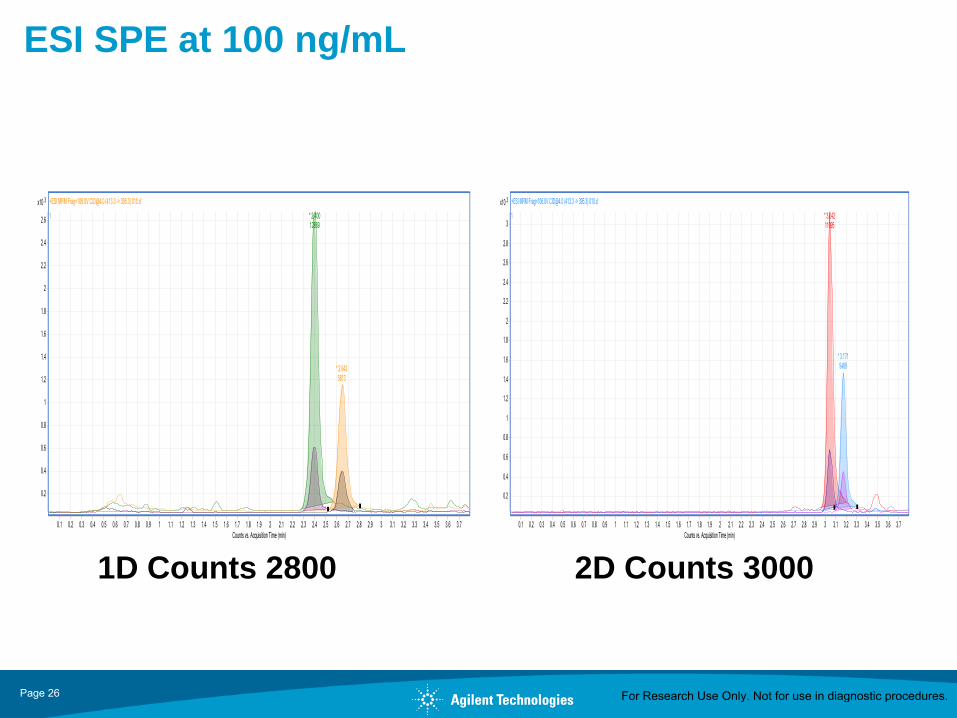
ESI SPE at 100 ng/mL
1D Counts 2800 2D Counts 3000
For Research Use Only. Not for use in diagnostic procedures.
Page 27
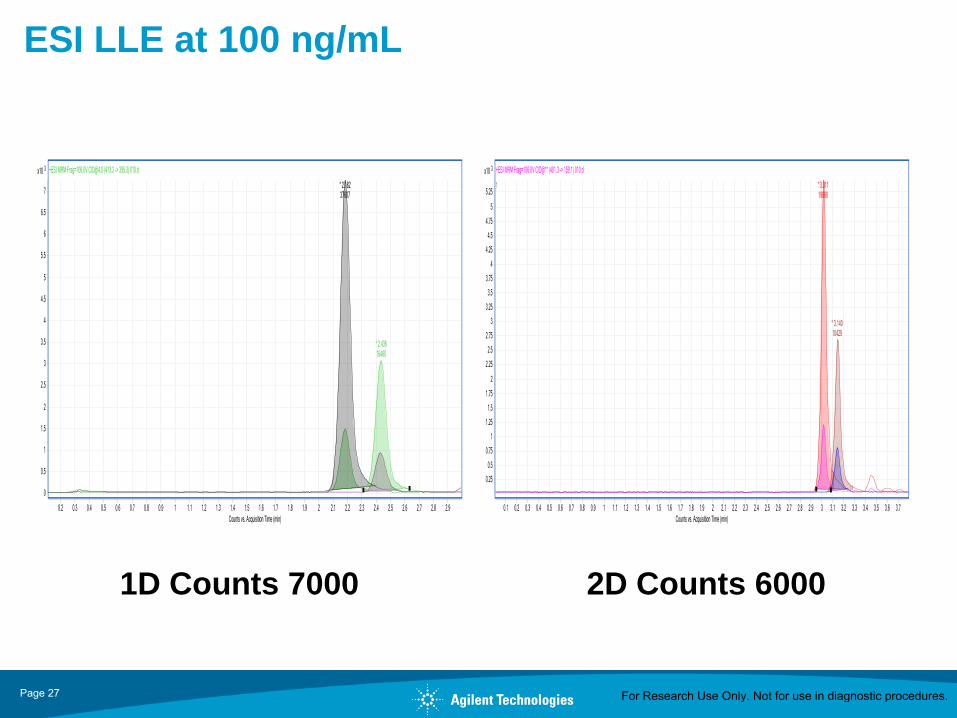
ESI LLE at 100 ng/mL
1D Counts 7000 2D Counts 6000
For Research Use Only. Not for use in diagnostic procedures.
Page 28
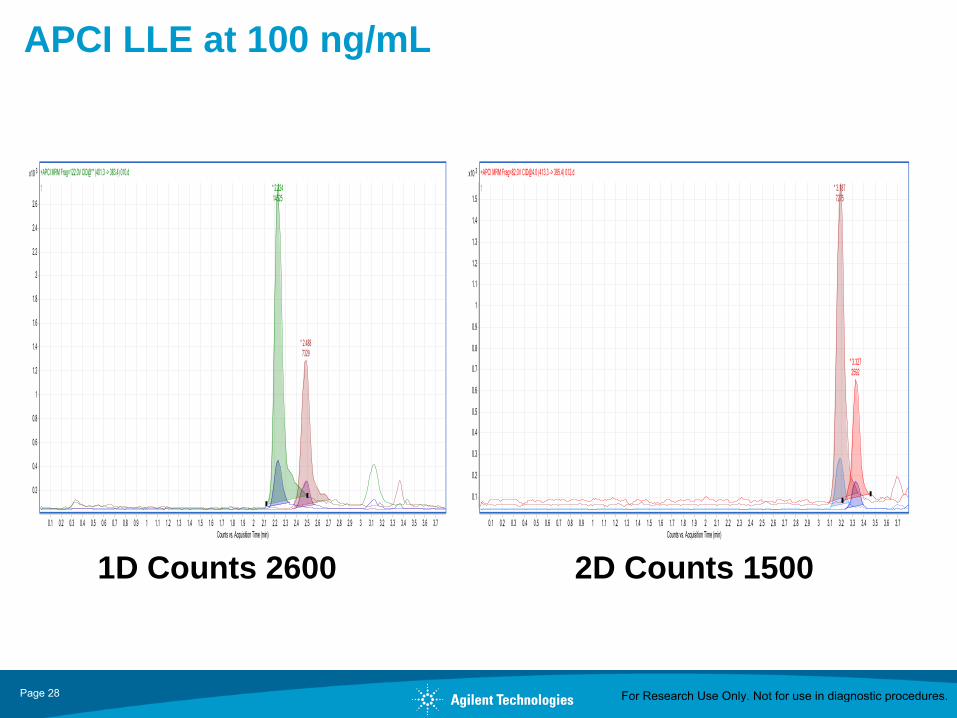
APCI LLE at 100 ng/mL
1D Counts 2600 2D Counts 1500
For Research Use Only. Not for use in diagnostic procedures.
Page 29
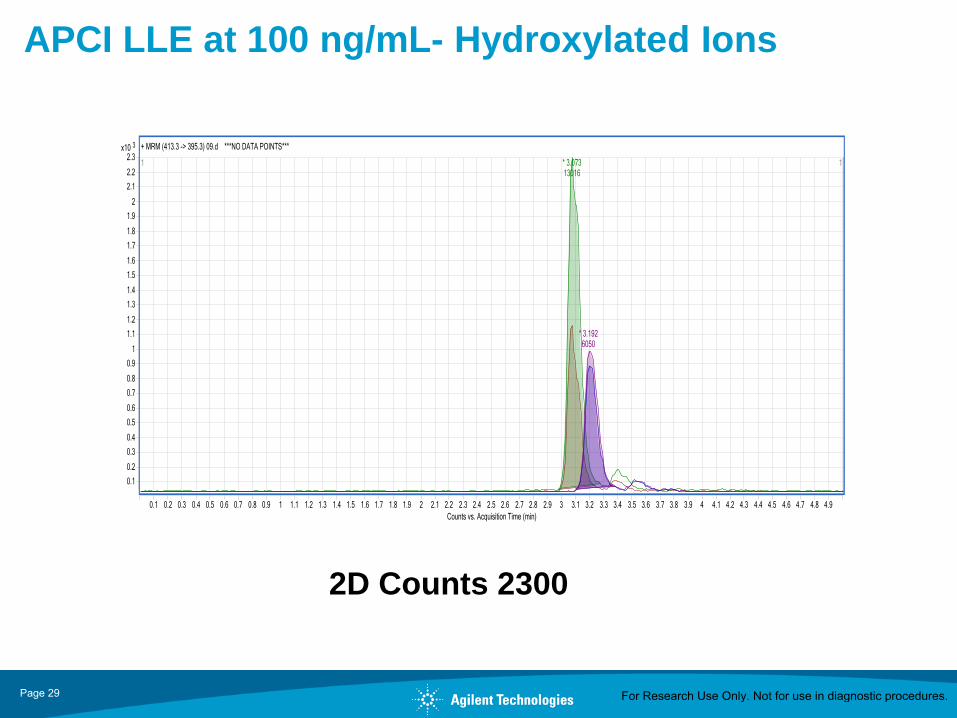
APCI LLE at 100 ng/mL- Hydroxylated Ions
2D Counts 2300
For Research Use Only. Not for use in diagnostic procedures.
Page 30
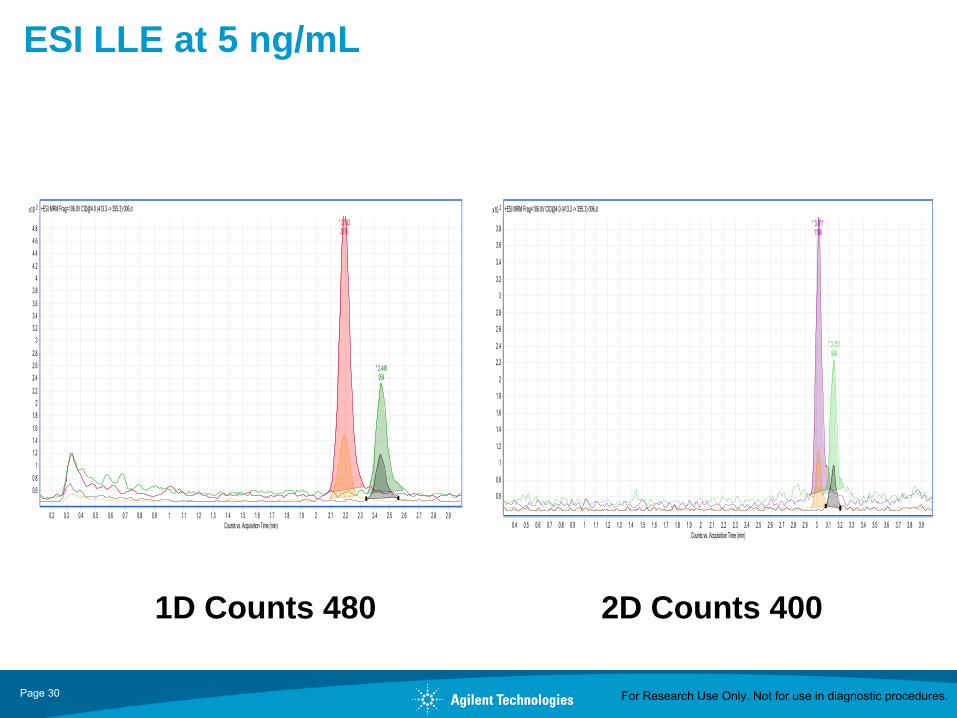
ESI LLE at 5 ng/mL
1D Counts 480 2D Counts 400
For Research Use Only. Not for use in diagnostic procedures.

Page 31
AJS LLE at 100 ng/mL- 6460 QQQ
1D Counts 38000
For Research Use Only. Not for use in diagnostic procedures.

Page 32
Clean 6430 Source
For Research Use Only. Not for use in diagnostic procedures.

Page 33
1D Issues- With Divert Valve
After LLE/SPE After PPT
For Research Use Only. Not for use in diagnostic procedures.

Page 34
Challenges in Serum
25-Hydroxy-Vitamin D3 present in Serum at 0.5 to 2 ng/ml
For Research Use Only. Not for use in diagnostic procedures.

Page 35
Standard Curve: 25-OH vitamin D3- LLE 1D
For Research Use Only. Not for use in diagnostic procedures.

Page 36
Standard Curve: 25-OH vitamin D2-LLE 1D
For Research Use Only. Not for use in diagnostic procedures.

Page 37
Standard Curve: 25-OH vitamin D3-LLE 2D
For Research Use Only. Not for use in diagnostic procedures.

Page 38
Standard Curve: 25-OHvitamin D2-LLE 2D
For Research Use Only. Not for use in diagnostic procedures.

Page 39
Limit of Detection- 6460 QQQ with AJS
D3-100 pg/mL D2-500 pg/mL
S/N= 15.1S/N=12.3
For Research Use Only. Not for use in diagnostic procedures.
Page 40
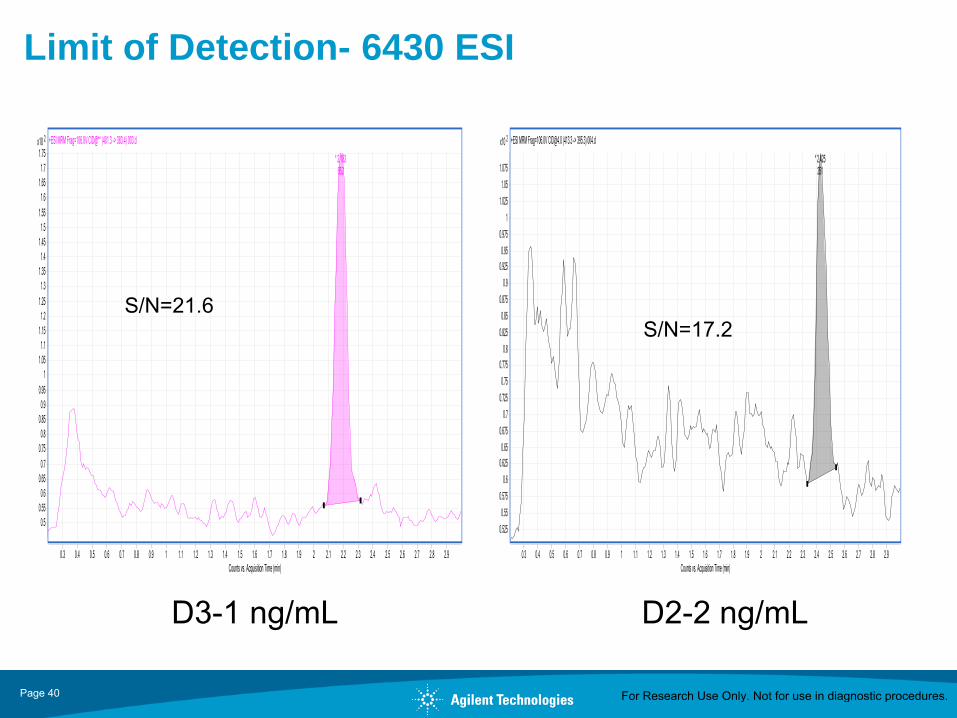
Limit of Detection- 6430 ESI
D3-1 ng/mL D2-2 ng/mL
S/N=21.6S/N=17.2
For Research Use Only. Not for use in diagnostic procedures.

Page 41
UTAK Tri-Level Vitamin D Plus Controls
Low Units Expected Range Target Value
25-OH-D2 ng/mL 9 – 13 1125-OH-D3 ng/mL 10 - 14 12Level 125-OH-D2 ng/mL 28 – 36 3325-OH-D3 ng/mL 26 - 36 31Level 225-OH-D2 ng/mL 65 - 89 7725-OH-D3 ng/mL 65 - 89 77
For Research Use Only. Not for use in diagnostic procedures.

Page 42
UTAK Tri-Level Vitamin D Plus Controls- ESI
(n=10)
%CV 1D PPT 1D LLE 1D SPE
Low
25-OH-D2 5.764 4.848 6.987
Mean 12.287 11.892 11.361
25-OH-D3 6.062 5.005 2.680
Mean 12.492 12.865 11.753
Level 1
25-OH-D2 4.237 5.693 6.973
Mean 35.675 35.494 33.221
25-OH-D3 6.504 3.632 4.929
Mean 30.208 29.536 28.333
Level 2
25-OH-D2 7.251 5.314 4.579
Mean 91.992 92.404 86.795
25-OH-D3 3.490 2.522 6.093
Mean 87.869 87.095 86.422
For Research Use Only. Not for use in diagnostic procedures.

Page 43
UTAK Tri-Level Vitamin D Plus Controls- ESI
(n=10)
%CV 2D PPT 2D LLE 2D SPE
Low
25-OH-D2 2.840 5.787 7.447
Mean 12.469 12.377 12.931
25-OH-D3 3.335 3.757 3.156
Mean 12.462 12.131 12.408
Level 1
25-OH-D2 2.694 5.509 9.267
Mean 35.683 35.296 34.892
25-OH-D3 2.736 3.598 5.273
Mean 30.771 27.969 31.145
Level 2
25-OH-D2 7.962 2.220 7.574
Mean 90.143 87.774 92.364
25-OH-D3 7.789 1.817 9.487
Mean 87.442 88.160 88.104
For Research Use Only. Not for use in diagnostic procedures.

Page 44
NIST Standard Control-ESI 2DUnits- ng/mL (N=4)
Level 1 2D PPT 2D LLE 2D SPE Expected %CV
25-OH-D225-OH-D3 24.50 23.43 24.36 23.9 4.48Level 225-OH-D2 2.68 2.34 2.60 1.71 13.7125-OH-D3 12.03 12.37 12.49 12.3 3.88Level 325-OH-D2 28.09 28.34 26.69 26.4 6.4225-OH-D3 20.46 19.36 20.25 18.5 5.83Level 425-OH-D2 2.87 2.46 2.61 2.4 15.6825-OH-D3* 85.78 85.33 85.95 70.7 0.75*Combination of 25-hydroxy Vitamin D3 and 3-Epi-25-hydroxy Vitamin D3
For Research Use Only. Not for use in diagnostic procedures.

Page 45
Conclusions
• ESI mode is more sensitive than APCI
• 2D mode gives better results than 1D due to the oncolumn clean up and concentration of the sample
• LLE is shown to be most sensitive and give consistentresults and SPE has potential but needs fine tuning
• PPT and LLE can be easily automated while SPE is laborintensive
• PPT and LLE are good for high throughput clinicalresearch laboratories
For Research Use Only. Not for use in diagnostic procedures.

Page 46
Questions?