sample exit interview survey - professional quest
TRANSCRIPT

Respondent Name Login ID Response DateYen, Rick JKYMY 27/07/2007 16:53York, Danielle RHRNI 27/07/2007 16:53York, Matthew KMKYH 27/07/2007 16:53Yotov, Brett HYFRK 27/07/2007 16:53Yotov, Kara ZDXCJ 27/07/2007 16:53Younan, Ben IBQES 27/07/2007 16:53Young, Sylvia QVWST 27/07/2007 16:53Zeldin, Christy XREIU 27/07/2007 16:53Zeldin, Michelle GMKWV 27/07/2007 16:53Zettner, Maya HOVJE 27/07/2007 16:53Ziegler, Jessica OKDXF 27/07/2007 16:53Zitterkopf, Darren WGJMG 27/07/2007 16:53Zucker, Wendy EBQBH 27/07/2007 16:53
Sample Exit Interview SurveyRespondent Listing
Page 20 of 20

Package Contents This reporting package contains a just a few of the many reports that could be used to analyse your surveys. It provides a sample of some of the flexibility available within Professional Quest. A brief description of each of the reports is provided below.
Questionnaire Structure Report
The Questionnaire Structure Report provides full details of the structure and content of a questionnaire design. It can be used as a paper-based “backup” of the design that has been set up within the software.
Questionnaire Form The paper-based questionnaire form is a simple representation of the questionnaire that can be used for manual data entry.
Questionnaire Results Sheet The results sheet report is an easy way to get the raw responses for a questionnaire. The report can be printed by question (all answers to a single question shown together) or by respondent (answers to all questions for a single response shown together).
If each response can be identified (eg. There is a name question) then the identification can be used within the report, making it easier to determine who each response relates to).
Response Grid The responses grid report is a compact table of the raw answers entered by each respondent, together with optional “calculated columns” that show responses to ratings questions as a percentage. Each row in the report is a single response.
Key features of this report include:
• The ability to show raw responses, one response per row
• All response data can be included in the report, including comments questions
• Calculated columns allow you to consolidate the answers to multiple questions into a single, simple figure. You can then sort the report by one of the calculated columns
Comments Listing The comments listing report is a simple listing of all responses to particular selected text questions in a survey. This report can easily be exported to a word-processor for inclusion in your own reports.

Question Analysis Report This is a basic report for producing charts and tabular statistics for multiple questions quickly and simply.
Key features of this report include:
• The ability to customise the chart format
• Different report layouts, including chart-only layouts
• Choice of which descriptive statistics to include
Graphical Rating Report The graphical rating report can be used for two main purposes - to print bar charts for one or more statistical questions in the questionnaire (effectively like a value range report, but with graphs), or to print "rating Gantt" graphs that clearly show positive and negative responses to questions.
Advanced features of this report include the ability to have multiple sections within the report (each with a different formatting and contents), and the ability to show direct comparisons of different subsets of data on the one graph (eg. show a graph comparing each department).
Response Groupings may be used to create comparative graphical rating charts. For example, if you have a "department" question in your questionnaire, you could create a response grouping that filters on each department as a separate item. By applying this grouping to a graphical rating chart, separate bars will be shown for each department - thus providing a comparison between departments.
Key features of this report include:
• The ability to group the statistics for related questions (eg. questions about management)
• Unlimited potential to compare different data strata (e.g. compare departments, time periods, regions etc.) on the same chart
• Use of “rating Gantt charts” to show the amount of positive and negative response for questions – very compact, and very visual reporting.
Saved Statistics Report “Custom Statistics” can be created within Professional Quest. These statistics can include cross-tabulations and consolidation or comparison of similar questions. The Custom Statistics Report can be used to print these statistics. Key features of this report include:
• The production of different charts, tables etc. on the one report
• Matching of the formatting for each custom statistic – providing high levels of customisation

Value Range Report This is a great initial report to print to provide an overall idea of the statistics for the survey. Key features of this report include:
• Extremely simple to use – just click on the report and run
• Numeric counts and percentages for answers to value range questions
• Average scores for value range questions
• Full support for flow control (indicates how many respondents “skipped” a question because of flow control)
• Optional ability to show comments questions
• Optional ability to filter responses to be included in the report (eg. only show one department)
Advanced Banner Report The Advanced Banner Report shows a “banner” across the top of the report. The data for a particular question can be “sliced” into each of the filtered columns shown in the banner. The content of each column in the report is based on a filter, and is therefore completely customisable. Features of this report include:
• Comparison of data based upon filters
• Optional reporting of significance between columns via column codes (an uppercase letter indicates 95%, and lowercase letter indicates 90%)
• Optional reporting of mean, standard deviation and standard error
• Support for large format reporting – show a detailed report on landscape A3 paper, for example
Pyramid Analysis Report The Pyramid report is a highly visual report - it shows the ratings entered into the questionnaire as a series of colored triangles within a "pyramid".
Each of the colored triangles is affected by two things - a "color" rule that determines the color that will be used (based upon either the percentage of respondents who provided a certain rating level, or an average rating) and a list of questions that will be used to determine the rating. In both cases, the questions can be weighted to ensure that more important questions have a greater affect on the color that is shown.
Uses of this report include:
• To show ratings within a questionnaire in a color-coded format
• To highlight poor ratings or deficiencies clearly and simply

Dual Range Analysis The dual range analysis is designed specifically to report on dual-range grid questions. A common use of these questions is to have a performance and an importance rating for each question in the grid. The dual range report is commonly used to answer the question “What areas are considered important, yet our performance is low?”
Key features of this report include:
• The ability to show both ranges in a dual range question on a single graph
• Calculation of the “gap” between the ranges
• Automatic determination of categories of questions (eg. “High priority issues”) based on rules.
Questionnaire Calculation Sheet
The calculation sheet reports in Professional Quest are designed to provide summarised information for any surveys that rate something. For example, let’s assume we have a question with a rating out of 5 - from very dissatisfied (1) to very satisfied (5). If a respondent entered satisfied (4), this is a score of 4/5 = 80%. These calculation sheets distil everything down into percentages, for broad analysis and comparison.
The example calculation sheet is an individual calculation sheet providing ratings given by individual customers. This shows off some of the functionality of this type of report including:
• Breakdown of ratings by groups of questions (eg. “Product Quality”, “Customer Service”)
• Historical ratings (in this example, a customer completes a satisfaction survey every quarter)
• Detailed listing of responses, and associated scores
Summary Calculation Sheet
The calculation sheet reports in Professional Quest are designed to provide summarised information for any surveys that rate something. For example, let’s assume we have a question with a rating out of 5 - from very dissatisfied (1) to very satisfied (5). If a respondent entered satisfied (4), this is a score of 4/5 = 80%. These calculation sheets distil everything down into percentages, for broad analysis and comparison.
The example calculation sheet is a summary calculation sheet providing overall ratings for different company divisions, and different geographical regions. This shows off some of the functionality of this type of report including:
• Breakdown of ratings by groups of questions (eg. “Management”, “Job Security”)
• Breakdown of ratings using filters (eg. “Australasia”, “United States” etc.)
• Filtering of an entire table of data (eg. only show one division in a table)
• Tabular and graphical representation of data
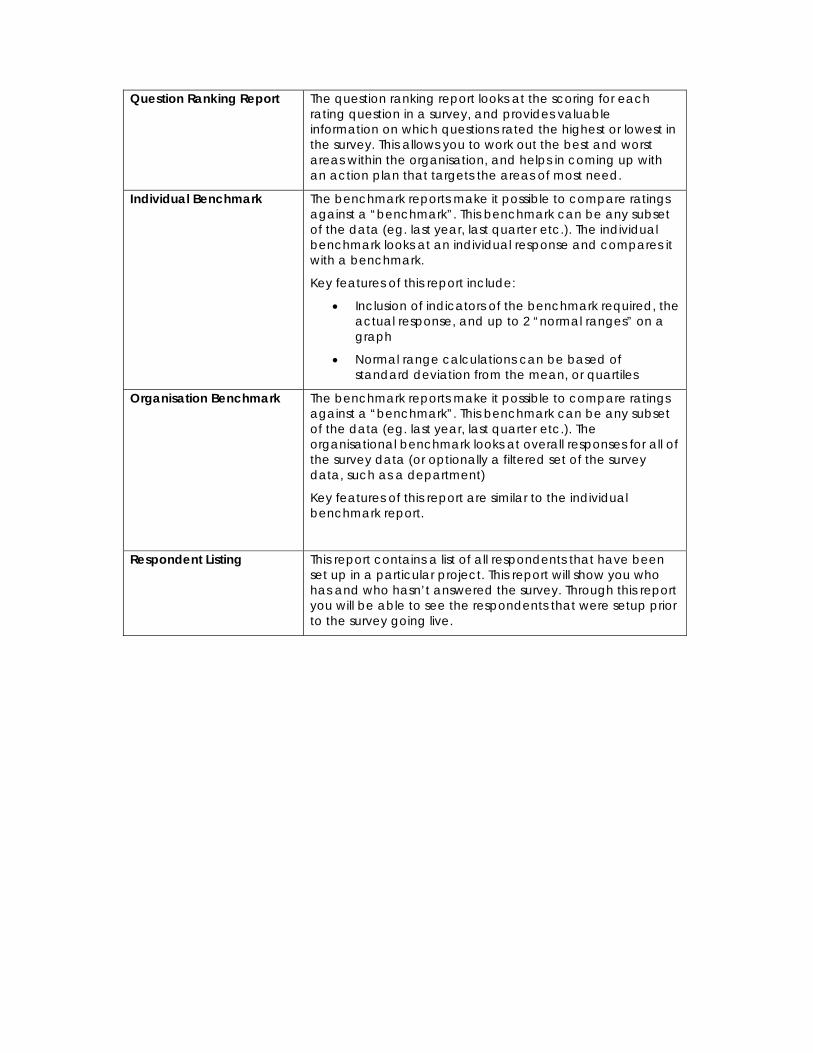
Question Ranking Report The question ranking report looks at the scoring for each rating question in a survey, and provides valuable information on which questions rated the highest or lowest in the survey. This allows you to work out the best and worst areas within the organisation, and helps in coming up with an action plan that targets the areas of most need.
Individual Benchmark The benchmark reports make it possible to compare ratings against a “benchmark”. This benchmark can be any subset of the data (eg. last year, last quarter etc.). The individual benchmark looks at an individual response and compares it with a benchmark.
Key features of this report include:
• Inclusion of indicators of the benchmark required, the actual response, and up to 2 “normal ranges” on a graph
• Normal range calculations can be based of standard deviation from the mean, or quartiles
Organisation Benchmark The benchmark reports make it possible to compare ratings against a “benchmark”. This benchmark can be any subset of the data (eg. last year, last quarter etc.). The organisational benchmark looks at overall responses for all of the survey data (or optionally a filtered set of the survey data, such as a department)
Key features of this report are similar to the individual benchmark report.
Respondent Listing This report contains a list of all respondents that have been set up in a particular project. This report will show you who has and who hasn’t answered the survey. Through this report you will be able to see the respondents that were setup prior to the survey going live.

Q Questionnaire: Dipolar Pty LimitedDescription: Sample Employee Satisfaction SurveyQuestionnaire ID: ID29000070731164030Created by: DipolarCreation date: 31/07/2007Modified date: 27/07/2007Screen size: SuperVGA (800 x 600)Pop-up help: No
T IntroductionQuestion ID: ID45600061Question Type: Text Block
T Introduction textQuestion ID: ID17870050Question Type: Text Block
T Employment DetailsQuestion ID: ID45800061Question Type: Text Block
? Employment DetailsQuestion ID: ID21900020Question Type: Group Question
? Employment - NameQuestion ID: ID24700070Question Type: TextQuestion Text: Your Name (Optional)Field length: 60Display as: Single line text field
? Employment - Your RegionQuestion ID: ID28600030Question Type: Range of ValuesQuestion Text: Which of our regional offices do you work inValue Range: Multiple Choice (user defined)No. of Values: 8No. of Columns: 1Multiple selections: NoUse lists: YesFirst Highest: Yes
Dipolar Pty LimitedQuestionnaire Structure
Page 1 of 12

Values: 8 Australian Capital Territory, 7 New South Wales, 6 Northern Territory, 5 Queensland, 4 South Australia, 3 Tasmania, 2 Victoria, 1 Western Australia
? Employment - Your DepartmentQuestion ID: ID49000001Question Type: Range of ValuesQuestion Text: Which department do you work in?Value Range: Multiple Choice (user defined)No. of Values: 5No. of Columns: 1Multiple selections: NoUse lists: YesFirst Highest: YesValues: 5 Customer Service, 4 Finance, 3 Sales and Marketing, 2 Research and
Development, 1 Human Resources
? Employment - Age GroupQuestion ID: ID29500030Question Type: Range of ValuesQuestion Text: How old are you?Value Range: Multiple Choice (user defined)No. of Values: 7No. of Columns: 2Multiple selections: NoUse lists: NoFirst Highest: YesValues: 7 18 or under, 6 19-25, 5 26-35, 4 36-45, 3 46-55, 2 56-65, 1 66 or older
? Employment - LengthQuestion ID: ID49300001Question Type: Range of ValuesQuestion Text: How long have you worked at our company?Value Range: Multiple Choice (user defined)No. of Values: 5No. of Columns: 1Multiple selections: NoUse lists: NoFirst Highest: YesValues: 5 Less than a year, 4 Between 1 and less than 2 years, 3 Between 2 and
less than 5 years, 2 Between 5 and less than 10 years, 1 10 Years or more
Dipolar Pty LimitedQuestionnaire Structure
Page 2 of 12

Introduction
Employment Details
Your Name (Optional)
Which of our regional offices do you work in Australian Capital TerritoryNew South WalesNorthern TerritoryQueenslandSouth AustraliaTasmaniaVictoriaWestern Australia
Which department do you work in? Customer ServiceFinanceSales and MarketingResearch and DevelopmentHuman Resources
How old are you? 18 or under19-2526-3536-45
46-5556-6566 or older
How long have you worked at our company? Less than a yearBetween 1 and less than 2 yearsBetween 2 and less than 5 yearsBetween 5 and less than 10 years10 Years or more
What is your Salary Range? Less than $30,000$30,000 to $39,999$40,000 to $49,999$50,000 to $59,999
$60,000 to $74,999$75,000 to $99,999$100,000 or more
General views about the Company
Let's start by getting an overall feeling for how you feel about Dipolar overall.
How would you rate your overall satisfaction with working at Dipolar?
Extremely SatisfiedVery SatisfiedSatisfied
Somewhat SatisfiedNot Satisfied
How motivated are you to see the company succeed? Very motivatedSomewhat motivatedNot very motivated
Not at all motivatedNot sure
I am proud to work in this company Agree StronglyAgreeIndifferent
DisagreeDisagree Strongly
Do you believe that the company communicates its goals and strategies to you?
Always communicatesUsually communicatesSometimes communicates
Rarely communicatesNever communicates
Dipolar Pty LimitedQuestionnaire Form
Page 1 of 4

Let's start by getting an overall feeling for how you feel about Dipolar overall.
Would your refer a friend to apply for a job at our company?
Very likelyLikelyIndifferent
UnlikelyVery unlikely
Please comment on your views about our company
New Call Logging SystemIf you are in the customer service area of Dipolar, you would be aware that a new call logging system was implemented by us in the last 6 months. We would like to know your opinion of this system, and how if has changed the way you work.
Agree Strongly Agree Indifferent Disagree DisagreeStrongly
Has made my job less stressful
Has improved my ability to answer questions
Training on the new system was adequate
I am much happier in my job since the new system was implemented
Please give us some feedback about the call logging system
Renumeration & Conditions
Below are a series of statements about your job and the company. Please indicate your level of agreement with the statements.
Agree Strongly Agree Indifferent Disagree DisagreeStrongly
If I do a good job I will be rewarded
I get what I need to do my job well
The conditions I work in are good
I am interested in my Job
I am not overly stressed in my job
Dipolar Pty LimitedQuestionnaire Form
Page 2 of 4

Alejandro HockerQuestion AnswerEmployment - Your Region Northern TerritoryEmployment - Your Department Customer ServiceEmployment - Age Group 46-55Employment - Length Between 2 and less than 5 yearsEmployment - Salary Range $30,000 to $39,999General - Overall Satisfaction Not SatisfiedGeneral - Proud DisagreeGeneral - Communications Never communicatesGeneral - Refer Friend LikelyCall Log - Less Stress Disagree StronglyCall Log - Improved Ability Agree StronglyCall Log - Training Adequate IndifferentCall Log - Happier IndifferentRem & Cond - Good Job Rewarded Disagree StronglyRem & Cond - Do Job Well Disagree StronglyRem & Cond - Good conditions Disagree StronglyRem & Cond - Interested in Job IndifferentRem & Cond - Overly Stressed Disagree StronglyManagement - Wise Decisions DisagreeManagement - Opinion Valued Disagree StronglyManagement - Employees Recognised Disagree Strongly
Management - Flexible Family DisagreeManagement - Enjoyable Work Environment Disagree Strongly
Job Security - Good Work Disagree StronglyJob Security - Provides DisagreeJob Security - Acquisition/Merger Disagree StronglyJob Security - Future of Organisation Disagree Strongly
Job Security - Competition Disagree
Dipolar Pty LimitedSample Results Sheet
Page 1 of 21
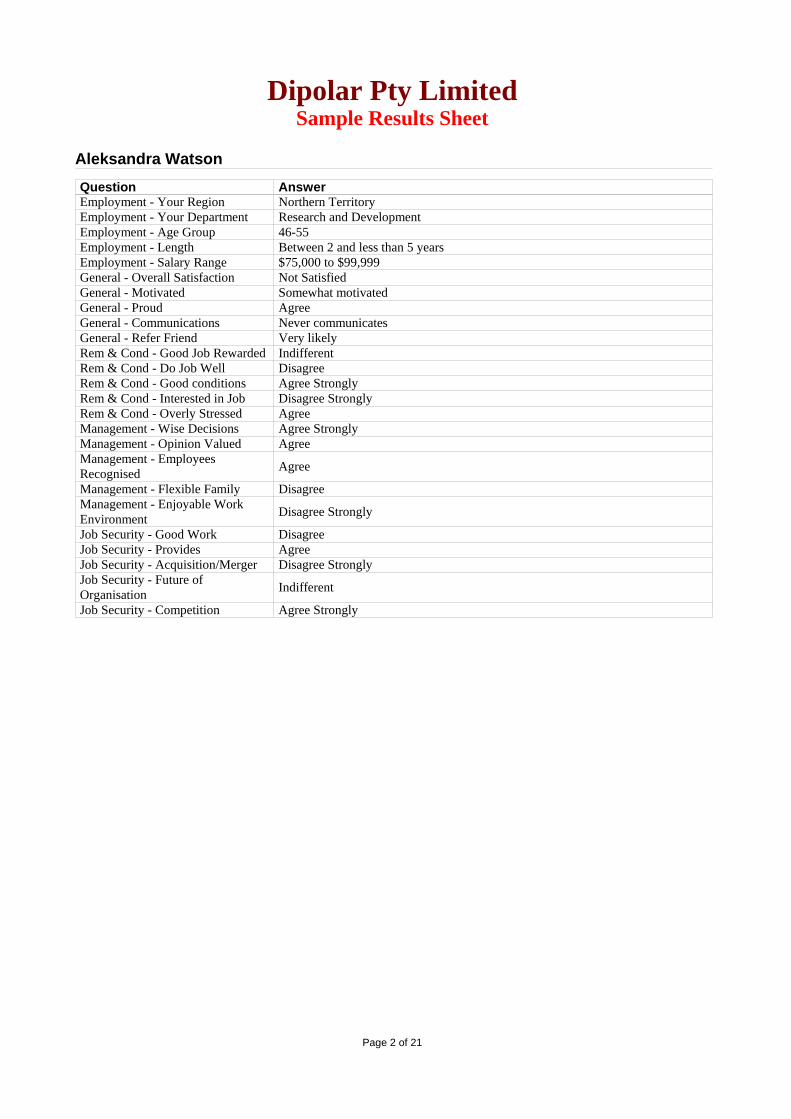
Aleksandra WatsonQuestion AnswerEmployment - Your Region Northern TerritoryEmployment - Your Department Research and DevelopmentEmployment - Age Group 46-55Employment - Length Between 2 and less than 5 yearsEmployment - Salary Range $75,000 to $99,999General - Overall Satisfaction Not SatisfiedGeneral - Motivated Somewhat motivatedGeneral - Proud AgreeGeneral - Communications Never communicatesGeneral - Refer Friend Very likelyRem & Cond - Good Job Rewarded IndifferentRem & Cond - Do Job Well DisagreeRem & Cond - Good conditions Agree StronglyRem & Cond - Interested in Job Disagree StronglyRem & Cond - Overly Stressed AgreeManagement - Wise Decisions Agree StronglyManagement - Opinion Valued AgreeManagement - Employees Recognised Agree
Management - Flexible Family DisagreeManagement - Enjoyable Work Environment Disagree Strongly
Job Security - Good Work DisagreeJob Security - Provides AgreeJob Security - Acquisition/Merger Disagree StronglyJob Security - Future of Organisation Indifferent
Job Security - Competition Agree Strongly
Dipolar Pty LimitedSample Results Sheet
Page 2 of 21
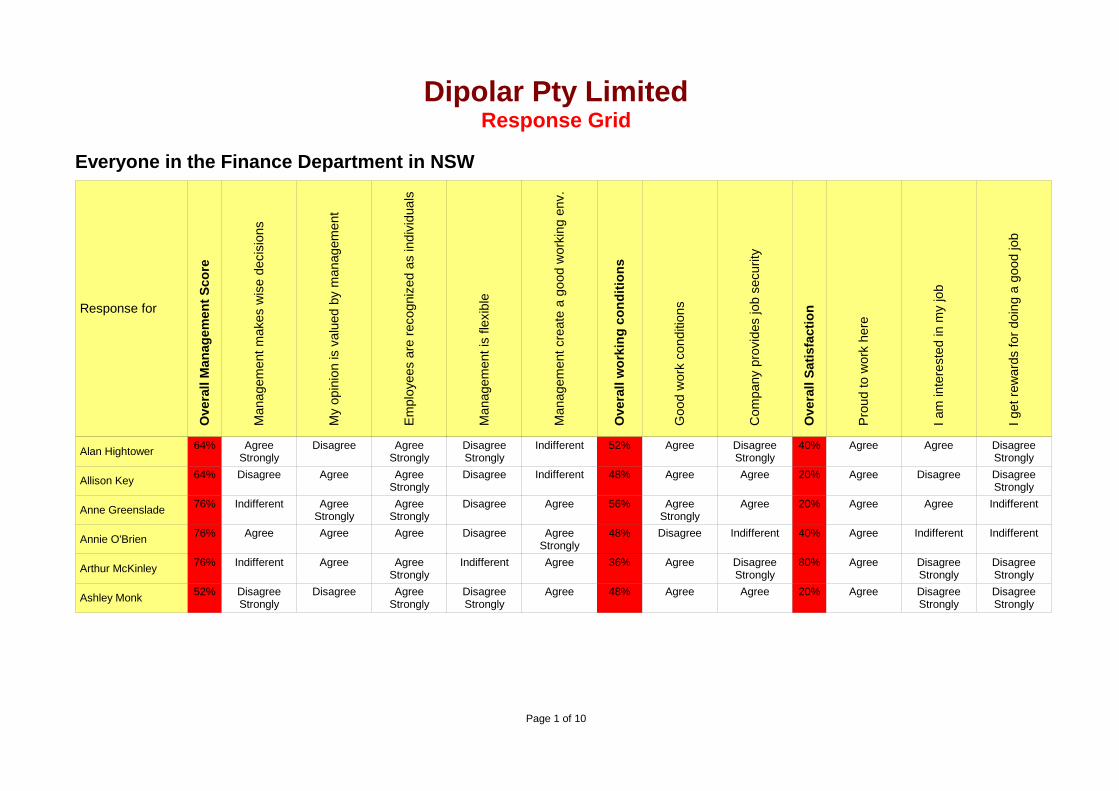
Everyone in the Finance Department in NSW
Response for
O
vera
ll M
anag
emen
t Sco
re
M
anag
emen
t mak
es w
ise
deci
sion
s
M
y op
inio
n is
val
ued
by m
anag
emen
t
E
mpl
oyee
s ar
e re
cogn
ized
as
indi
vidu
als
M
anag
emen
t is
flexi
ble
M
anag
emen
t cre
ate
a go
od w
orki
ng e
nv.
O
vera
ll w
orki
ng c
ondi
tions
G
ood
wor
k co
nditi
ons
C
ompa
ny p
rovi
des
job
secu
rity
O
vera
ll Sa
tisfa
ctio
n
P
roud
to w
ork
here
I a
m in
tere
sted
in m
y jo
b
I g
et re
war
ds fo
r doi
ng a
goo
d jo
b
Alan Hightower 64% AgreeStrongly
Disagree AgreeStrongly
DisagreeStrongly
Indifferent 52% Agree DisagreeStrongly
40% Agree Agree DisagreeStrongly
Allison Key 64% Disagree Agree AgreeStrongly
Disagree Indifferent 48% Agree Agree 20% Agree Disagree DisagreeStrongly
Anne Greenslade 76% Indifferent AgreeStrongly
AgreeStrongly
Disagree Agree 56% AgreeStrongly
Agree 20% Agree Agree Indifferent
Annie O'Brien 76% Agree Agree Agree Disagree AgreeStrongly
48% Disagree Indifferent 40% Agree Indifferent Indifferent
Arthur McKinley 76% Indifferent Agree AgreeStrongly
Indifferent Agree 36% Agree DisagreeStrongly
80% Agree DisagreeStrongly
DisagreeStrongly
Ashley Monk 52% DisagreeStrongly
Disagree AgreeStrongly
DisagreeStrongly
Agree 48% Agree Agree 20% Agree DisagreeStrongly
DisagreeStrongly
Dipolar Pty LimitedResponse Grid
Page 1 of 10

Response for
O
vera
ll M
anag
emen
t Sco
re
M
anag
emen
t mak
es w
ise
deci
sion
s
M
y op
inio
n is
val
ued
by m
anag
emen
t
E
mpl
oyee
s ar
e re
cogn
ized
as
indi
vidu
als
M
anag
emen
t is
flexi
ble
M
anag
emen
t cre
ate
a go
od w
orki
ng e
nv.
O
vera
ll w
orki
ng c
ondi
tions
G
ood
wor
k co
nditi
ons
C
ompa
ny p
rovi
des
job
secu
rity
O
vera
ll Sa
tisfa
ctio
n
P
roud
to w
ork
here
I a
m in
tere
sted
in m
y jo
b
I g
et re
war
ds fo
r doi
ng a
goo
d jo
b
Ben Stepp 80% AgreeStrongly
Agree AgreeStrongly
DisagreeStrongly
AgreeStrongly
64% AgreeStrongly
AgreeStrongly
40% Agree Indifferent Disagree
Beth York 68% Agree Disagree AgreeStrongly
Disagree Agree 56% Agree Indifferent 40% Agree Disagree Disagree
Betty Olson 76% AgreeStrongly
AgreeStrongly
AgreeStrongly
DisagreeStrongly
Indifferent 64% Agree DisagreeStrongly
40% Agree Disagree DisagreeStrongly
Brad Harms 72% Indifferent Agree Agree Disagree AgreeStrongly
44% Disagree DisagreeStrongly
20% Agree Disagree DisagreeStrongly
Cara Peters 84% AgreeStrongly
AgreeStrongly
AgreeStrongly
Disagree Agree 44% Agree Agree 40% Agree Indifferent DisagreeStrongly
Charlotte Butterfield 52% Indifferent Disagree Agree Disagree Disagree 56% DisagreeStrongly
AgreeStrongly
20% Agree Agree DisagreeStrongly
Christen Adams 76% Agree AgreeStrongly
Agree DisagreeStrongly
AgreeStrongly
72% AgreeStrongly
Agree 40% Agree Indifferent Agree
Dipolar Pty LimitedResponse Grid
Page 2 of 10
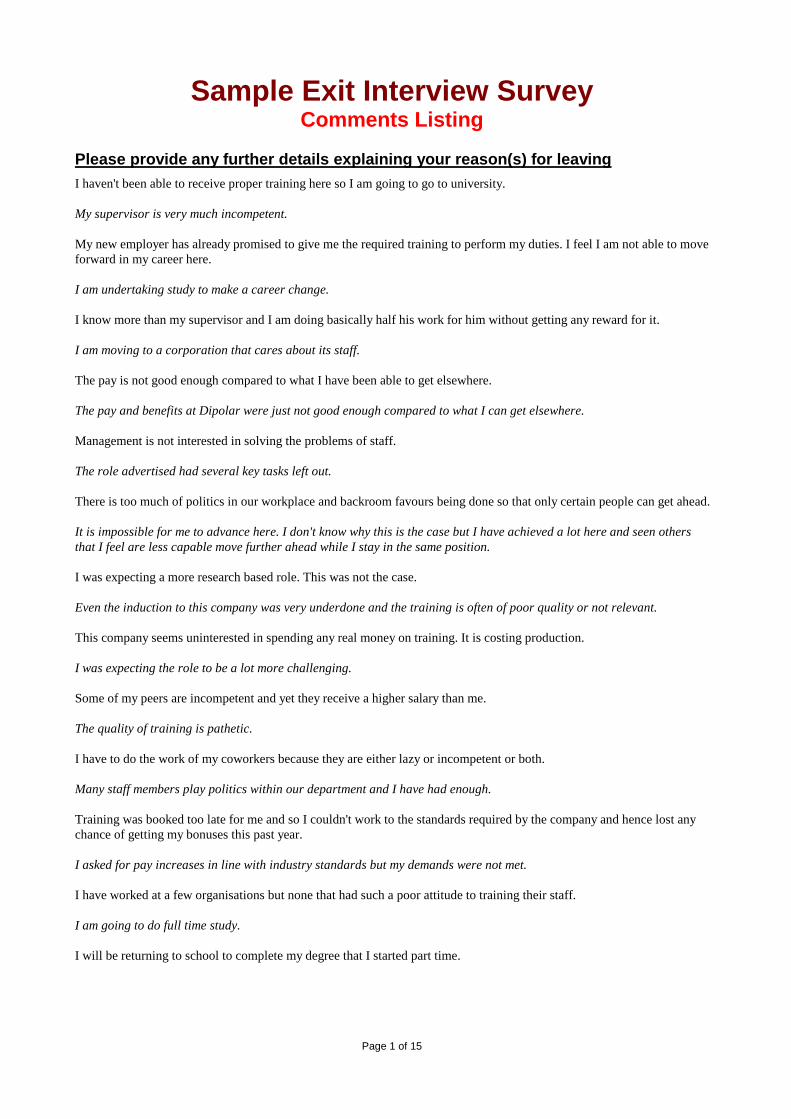
Please provide any further details explaining your reason(s) for leavingI haven't been able to receive proper training here so I am going to go to university.
My supervisor is very much incompetent.
My new employer has already promised to give me the required training to perform my duties. I feel I am not able to move forward in my career here.
I am undertaking study to make a career change.
I know more than my supervisor and I am doing basically half his work for him without getting any reward for it.
I am moving to a corporation that cares about its staff.
The pay is not good enough compared to what I have been able to get elsewhere.
The pay and benefits at Dipolar were just not good enough compared to what I can get elsewhere.
Management is not interested in solving the problems of staff.
The role advertised had several key tasks left out.
There is too much of politics in our workplace and backroom favours being done so that only certain people can get ahead.
It is impossible for me to advance here. I don't know why this is the case but I have achieved a lot here and seen others that I feel are less capable move further ahead while I stay in the same position.
I was expecting a more research based role. This was not the case.
Even the induction to this company was very underdone and the training is often of poor quality or not relevant.
This company seems uninterested in spending any real money on training. It is costing production.
I was expecting the role to be a lot more challenging.
Some of my peers are incompetent and yet they receive a higher salary than me.
The quality of training is pathetic.
I have to do the work of my coworkers because they are either lazy or incompetent or both.
Many staff members play politics within our department and I have had enough.
Training was booked too late for me and so I couldn't work to the standards required by the company and hence lost any chance of getting my bonuses this past year.
I asked for pay increases in line with industry standards but my demands were not met.
I have worked at a few organisations but none that had such a poor attitude to training their staff.
I am going to do full time study.
I will be returning to school to complete my degree that I started part time.
Sample Exit Interview SurveyComments Listing
Page 1 of 15

Please provide any further information about {NEWEMPNAME} that you feel is relevantMy new employer treats everyone based on performance and so I can have a real opportunity for advancement.
The benefits and the more interesting work and of course much better salary are very good at the new company.
The location of the new job is close to where I leave and perfect for me so that I can take care of my children.
My new employer has work that appears to be much more interesting for me.
The new company is offering me more flexibility and won't be so demanding on my time.
I have a clear path for advancement with my new company.
There are many reasons that my new job will be great including being able to study part-time.
The new employer is providing child support facilities nearby which is a great benefit to me.
My new employer happens to be in the city that I am relocating to.
The salary and benefits at my new company are 2nd to none.
My new job is closer to home which is a big plus.
The salary is better at my new job but also I will have more opportunities for advancement.
There are many reasons why I wanted to get this new job. The location of the new job being close to home is one. There is a real commitment in the new company to encourage people to improve themselves and in doing so be able to advance within the organisation.
The medical benefits at my new employer are very impressive along with the salary.
The work at my new employer will be very challenging and interesting.
The salary at my new employer is much better than I can get elsewhere.
It sppears that it will be a lot easier to get proper training and be able to advance within the new company.
The salary and benefits at my new employer will be a lot better.
I am able to get the sort of salary that I feel I am worth at my new employer.
The new job is located near to the university where I want to do some more study.
Please provide further details about your experiences in relation to trainingI had trainers that would turn up late and their level of knowledge was not good enough.
Sample Exit Interview SurveyComments Listing
Page 2 of 15

? Statistics for Emp Details - Age Group
Occurrence Counts
Value Description Number %
7 18 or under 19 1.94%6 19-25 151 15.42%5 26-35 184 18.79%4 36-45 254 25.95%3 46-55 101 10.32%2 56-65 160 16.34%1 66 or older 110 11.24%
Descriptive Statistics
Total Responses 979Sum 3708No. of Blank Responses 0Minimum 1.00Maximum 7.00Mean (Average) 3.79Mode 4.00Variance 2.71Standard Deviation 1.64Skewness -0.17274452Kurtosis -0.9915319210
? Chart for Emp Details - Age Group
Sample Exit Interview SurveyStatistical Analysis
Page 1 of 3

DemographicsThe demographics for the company employees are shown below. Note that some of the demographics questions are optional and therefore have not been answered by all respondents.
Select your region and department
0% 10% 20% 30% 40% 50% 60% 70% 80% 90% 100%
Asia Pacific, Customer Service 20%
Asia Pacific, Human Resources 10%
Asia Pacific, Information 16%
Asia Pacific, Research and Development 11%
United States, Finance 8%
United States, Human Resources. 13%
United States, Information 4%
United States, Sales and Marketing 18%
Select your age group
0% 10% 20% 30% 40% 50% 60% 70% 80% 90% 100%
18 or under 2%
19-25 15%
26-35 19%
36-45 27%
46-55 10%
56-65 16%
66 or older 11%
Select your gender
0% 10% 20% 30% 40% 50% 60% 70% 80% 90% 100%
Male 56%
Female 44%
Sample Exit Interview SurveyGraphical Rating Report
Page 1 of 10
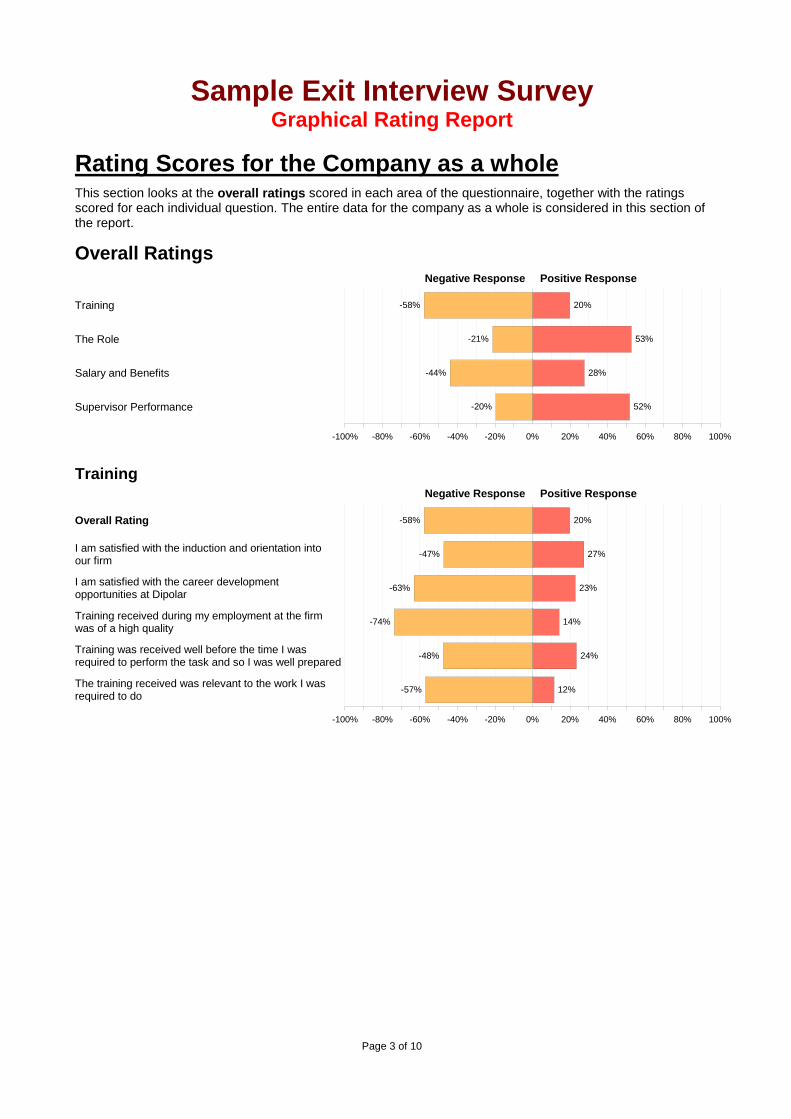
Rating Scores for the Company as a wholeThis section looks at the overall ratings scored in each area of the questionnaire, together with the ratings scored for each individual question. The entire data for the company as a whole is considered in this section of the report.
Overall RatingsNegative Response Positive Response
0% 20%-20% 40%-40% 60%-60% 80%-80% 100%-100%
Training 20%-58%
The Role 53%-21%
Salary and Benefits 28%-44%
Supervisor Performance 52%-20%
TrainingNegative Response Positive Response
0% 20%-20% 40%-40% 60%-60% 80%-80% 100%-100%
Overall Rating 20%-58%
I am satisfied with the induction and orientation into our firm
27%-47%
I am satisfied with the career development opportunities at Dipolar 23%-63%
Training received during my employment at the firm was of a high quality
14%-74%
Training was received well before the time I was required to perform the task and so I was well prepared 24%-48%
The training received was relevant to the work I was required to do 12%-57%
Sample Exit Interview SurveyGraphical Rating Report
Page 3 of 10
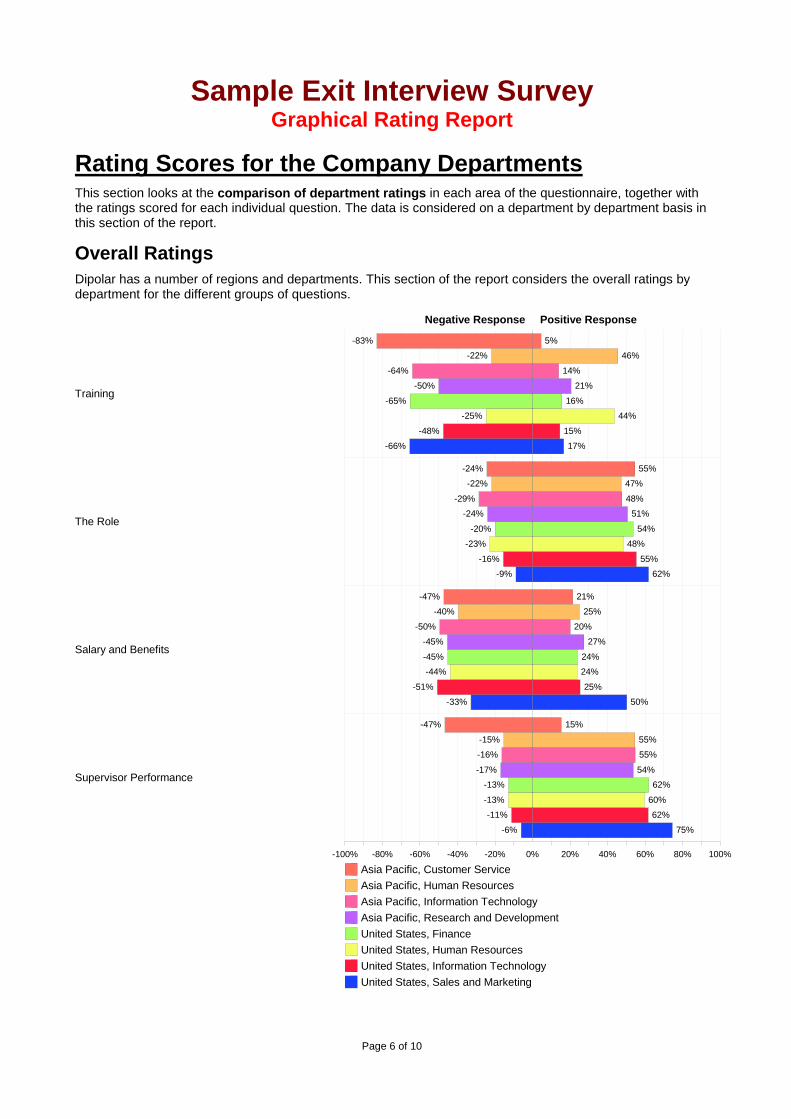
Rating Scores for the Company DepartmentsThis section looks at the comparison of department ratings in each area of the questionnaire, together with the ratings scored for each individual question. The data is considered on a department by department basis in this section of the report.
Overall RatingsDipolar has a number of regions and departments. This section of the report considers the overall ratings by department for the different groups of questions.
Negative Response Positive Response
0% 20%-20% 40%-40% 60%-60% 80%-80% 100%-100%
Training
5%-83%
46%-22%
14%-64%
21%-50%
16%-65%
44%-25%
15%-48%
17%-66%
The Role
55%-24%
47%-22%
48%-29%
51%-24%
54%-20%
48%-23%
55%-16%
62%-9%
Salary and Benefits
21%-47%
25%-40%
20%-50%
27%-45%
24%-45%
24%-44%
25%-51%
50%-33%
Supervisor Performance
15%-47%
55%-15%
55%-16%
54%-17%
62%-13%
60%-13%
62%-11%
75%-6%
Asia Pacific, Customer ServiceAsia Pacific, Human ResourcesAsia Pacific, Information TechnologyAsia Pacific, Research and DevelopmentUnited States, FinanceUnited States, Human ResourcesUnited States, Information TechnologyUnited States, Sales and Marketing
Sample Exit Interview SurveyGraphical Rating Report
Page 6 of 10
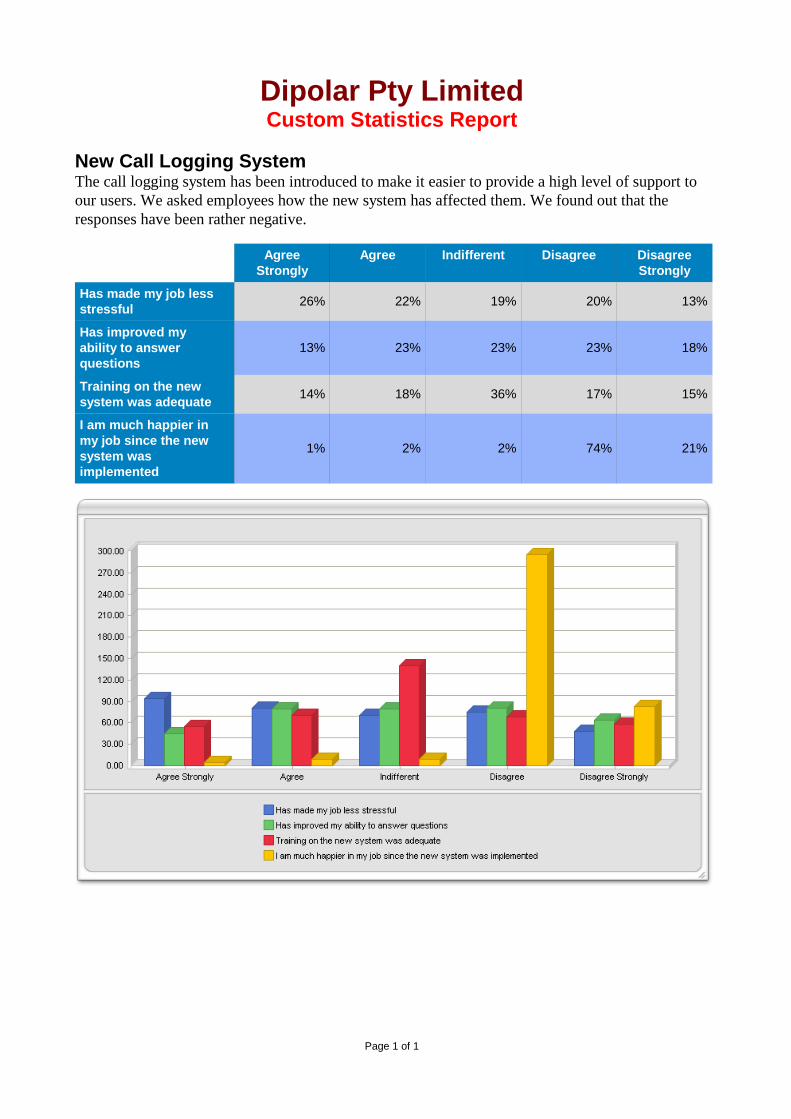
New Call Logging SystemThe call logging system has been introduced to make it easier to provide a high level of support to our users. We asked employees how the new system has affected them. We found out that the responses have been rather negative.
AgreeStrongly
Agree Indifferent Disagree DisagreeStrongly
Has made my job less stressful 26% 22% 19% 20% 13%
Has improved my ability to answer questions
13% 23% 23% 23% 18%
Training on the new system was adequate 14% 18% 36% 17% 15%
I am much happier in my job since the new system was implemented
1% 2% 2% 74% 21%
Dipolar Pty LimitedCustom Statistics Report
Page 1 of 1
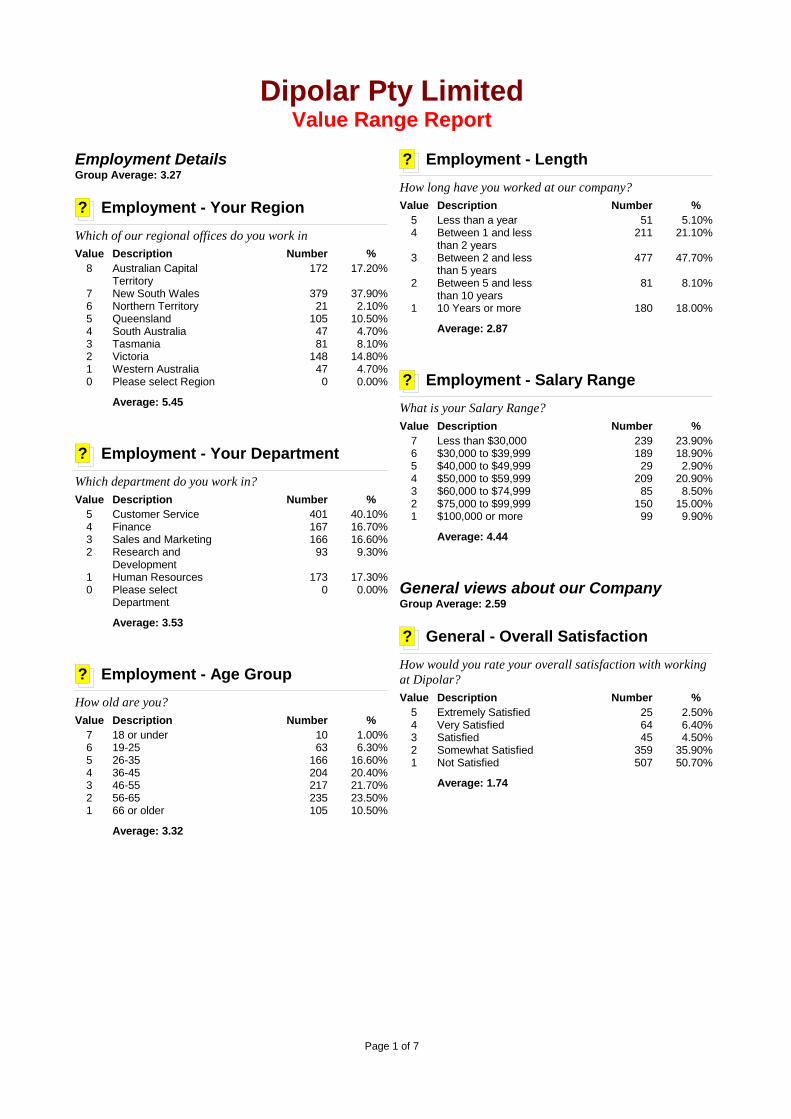
Employment DetailsGroup Average: 3.27
? Employment - Your RegionWhich of our regional offices do you work inValue Description Number %
8 Australian Capital Territory
172 17.20%
7 New South Wales 379 37.90%6 Northern Territory 21 2.10%5 Queensland 105 10.50%4 South Australia 47 4.70%3 Tasmania 81 8.10%2 Victoria 148 14.80%1 Western Australia 47 4.70%0 Please select Region 0 0.00%
Average: 5.45
? Employment - Your DepartmentWhich department do you work in?Value Description Number %
5 Customer Service 401 40.10%4 Finance 167 16.70%3 Sales and Marketing 166 16.60%2 Research and
Development93 9.30%
1 Human Resources 173 17.30%0 Please select
Department0 0.00%
Average: 3.53
? Employment - Age GroupHow old are you?Value Description Number %
7 18 or under 10 1.00%6 19-25 63 6.30%5 26-35 166 16.60%4 36-45 204 20.40%3 46-55 217 21.70%2 56-65 235 23.50%1 66 or older 105 10.50%
Average: 3.32
? Employment - LengthHow long have you worked at our company?Value Description Number %
5 Less than a year 51 5.10%4 Between 1 and less
than 2 years211 21.10%
3 Between 2 and less than 5 years
477 47.70%
2 Between 5 and less than 10 years
81 8.10%
1 10 Years or more 180 18.00%
Average: 2.87
? Employment - Salary RangeWhat is your Salary Range?Value Description Number %
7 Less than $30,000 239 23.90%6 $30,000 to $39,999 189 18.90%5 $40,000 to $49,999 29 2.90%4 $50,000 to $59,999 209 20.90%3 $60,000 to $74,999 85 8.50%2 $75,000 to $99,999 150 15.00%1 $100,000 or more 99 9.90%
Average: 4.44
General views about our CompanyGroup Average: 2.59
? General - Overall SatisfactionHow would you rate your overall satisfaction with working at Dipolar?Value Description Number %
5 Extremely Satisfied 25 2.50%4 Very Satisfied 64 6.40%3 Satisfied 45 4.50%2 Somewhat Satisfied 359 35.90%1 Not Satisfied 507 50.70%
Average: 1.74
Dipolar Pty LimitedValue Range Report
Page 1 of 7
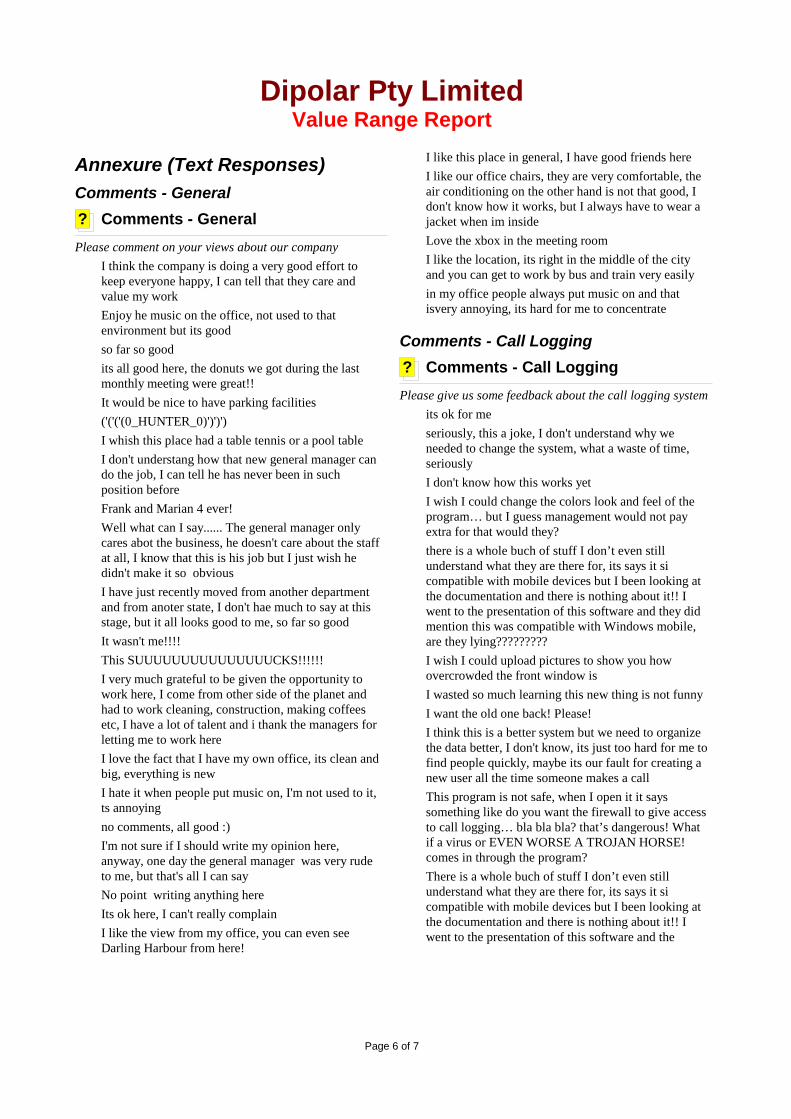
Annexure (Text Responses)Comments - General? Comments - GeneralPlease comment on your views about our company
I think the company is doing a very good effort to keep everyone happy, I can tell that they care and value my workEnjoy he music on the office, not used to that environment but its goodso far so goodits all good here, the donuts we got during the last monthly meeting were great!!It would be nice to have parking facilities('('('(0_HUNTER_0)')')')I whish this place had a table tennis or a pool tableI don't understang how that new general manager can do the job, I can tell he has never been in such position beforeFrank and Marian 4 ever!Well what can I say...... The general manager only cares abot the business, he doesn't care about the staff at all, I know that this is his job but I just wish he didn't make it so obviousI have just recently moved from another department and from anoter state, I don't hae much to say at this stage, but it all looks good to me, so far so goodIt wasn't me!!!!This SUUUUUUUUUUUUUUUCKS!!!!!!I very much grateful to be given the opportunity to work here, I come from other side of the planet and had to work cleaning, construction, making coffees etc, I have a lot of talent and i thank the managers for letting me to work hereI love the fact that I have my own office, its clean and big, everything is newI hate it when people put music on, I'm not used to it, ts annoyingno comments, all good :)I'm not sure if I should write my opinion here, anyway, one day the general manager was very rude to me, but that's all I can sayNo point writing anything hereIts ok here, I can't really complainI like the view from my office, you can even see Darling Harbour from here!
I like this place in general, I have good friends hereI like our office chairs, they are very comfortable, the air conditioning on the other hand is not that good, I don't know how it works, but I always have to wear a jacket when im insideLove the xbox in the meeting roomI like the location, its right in the middle of the city and you can get to work by bus and train very easilyin my office people always put music on and that isvery annoying, its hard for me to concentrate
Comments - Call Logging? Comments - Call LoggingPlease give us some feedback about the call logging system
its ok for meseriously, this a joke, I don't understand why we needed to change the system, what a waste of time, seriouslyI don't know how this works yetI wish I could change the colors look and feel of the program… but I guess management would not pay extra for that would they?there is a whole buch of stuff I don’t even still understand what they are there for, its says it si compatible with mobile devices but I been looking at the documentation and there is nothing about it!! I went to the presentation of this software and they did mention this was compatible with Windows mobile, are they lying?????????I wish I could upload pictures to show you how overcrowded the front window isI wasted so much learning this new thing is not funnyI want the old one back! Please!I think this is a better system but we need to organize the data better, I don't know, its just too hard for me to find people quickly, maybe its our fault for creating a new user all the time someone makes a callThis program is not safe, when I open it it says something like do you want the firewall to give access to call logging… bla bla bla? that’s dangerous! What if a virus or EVEN WORSE A TROJAN HORSE! comes in through the program?There is a whole buch of stuff I don’t even still understand what they are there for, its says it si compatible with mobile devices but I been looking at the documentation and there is nothing about it!! I went to the presentation of this software and the
Dipolar Pty LimitedValue Range Report
Page 6 of 7
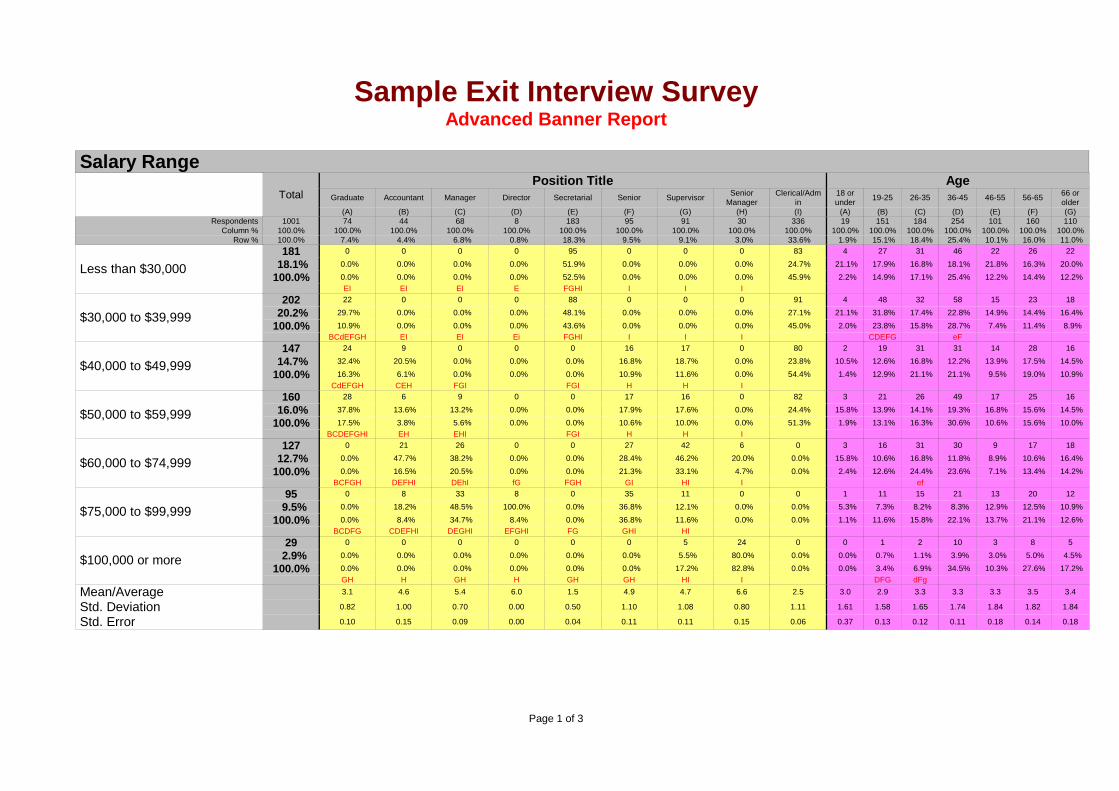
Salary RangeTotal
Position Title AgeGraduate Accountant Manager Director Secretarial Senior Supervisor Senior
ManagerClerical/Adm
in18 orunder 19-25 26-35 36-45 46-55 56-65 66 or
older(A) (B) (C) (D) (E) (F) (G) (H) (I) (A) (B) (C) (D) (E) (F) (G)
Respondents 1001 74 44 68 8 183 95 91 30 336 19 151 184 254 101 160 110Column % 100.0% 100.0% 100.0% 100.0% 100.0% 100.0% 100.0% 100.0% 100.0% 100.0% 100.0% 100.0% 100.0% 100.0% 100.0% 100.0% 100.0%
Row % 100.0% 7.4% 4.4% 6.8% 0.8% 18.3% 9.5% 9.1% 3.0% 33.6% 1.9% 15.1% 18.4% 25.4% 10.1% 16.0% 11.0%
Less than $30,000181 0 0 0 0 95 0 0 0 83 4 27 31 46 22 26 22
18.1% 0.0% 0.0% 0.0% 0.0% 51.9% 0.0% 0.0% 0.0% 24.7% 21.1% 17.9% 16.8% 18.1% 21.8% 16.3% 20.0%
100.0% 0.0% 0.0% 0.0% 0.0% 52.5% 0.0% 0.0% 0.0% 45.9% 2.2% 14.9% 17.1% 25.4% 12.2% 14.4% 12.2%EI EI EI E FGHI I I I
$30,000 to $39,999202 22 0 0 0 88 0 0 0 91 4 48 32 58 15 23 18
20.2% 29.7% 0.0% 0.0% 0.0% 48.1% 0.0% 0.0% 0.0% 27.1% 21.1% 31.8% 17.4% 22.8% 14.9% 14.4% 16.4%
100.0% 10.9% 0.0% 0.0% 0.0% 43.6% 0.0% 0.0% 0.0% 45.0% 2.0% 23.8% 15.8% 28.7% 7.4% 11.4% 8.9%BCdEFGH EI EI Ei FGHI I I I CDEFG eF
$40,000 to $49,999147 24 9 0 0 0 16 17 0 80 2 19 31 31 14 28 16
14.7% 32.4% 20.5% 0.0% 0.0% 0.0% 16.8% 18.7% 0.0% 23.8% 10.5% 12.6% 16.8% 12.2% 13.9% 17.5% 14.5%
100.0% 16.3% 6.1% 0.0% 0.0% 0.0% 10.9% 11.6% 0.0% 54.4% 1.4% 12.9% 21.1% 21.1% 9.5% 19.0% 10.9%CdEFGH CEH FGI FGI H H I
$50,000 to $59,999160 28 6 9 0 0 17 16 0 82 3 21 26 49 17 25 16
16.0% 37.8% 13.6% 13.2% 0.0% 0.0% 17.9% 17.6% 0.0% 24.4% 15.8% 13.9% 14.1% 19.3% 16.8% 15.6% 14.5%
100.0% 17.5% 3.8% 5.6% 0.0% 0.0% 10.6% 10.0% 0.0% 51.3% 1.9% 13.1% 16.3% 30.6% 10.6% 15.6% 10.0%BCDEFGHI EH EHI FGI H H I
$60,000 to $74,999127 0 21 26 0 0 27 42 6 0 3 16 31 30 9 17 18
12.7% 0.0% 47.7% 38.2% 0.0% 0.0% 28.4% 46.2% 20.0% 0.0% 15.8% 10.6% 16.8% 11.8% 8.9% 10.6% 16.4%
100.0% 0.0% 16.5% 20.5% 0.0% 0.0% 21.3% 33.1% 4.7% 0.0% 2.4% 12.6% 24.4% 23.6% 7.1% 13.4% 14.2%BCFGH DEFHI DEhI fG FGH GI HI I ef
$75,000 to $99,99995 0 8 33 8 0 35 11 0 0 1 11 15 21 13 20 12
9.5% 0.0% 18.2% 48.5% 100.0% 0.0% 36.8% 12.1% 0.0% 0.0% 5.3% 7.3% 8.2% 8.3% 12.9% 12.5% 10.9%
100.0% 0.0% 8.4% 34.7% 8.4% 0.0% 36.8% 11.6% 0.0% 0.0% 1.1% 11.6% 15.8% 22.1% 13.7% 21.1% 12.6%BCDFG CDEFHI DEGHI EFGHI FG GHI HI
$100,000 or more29 0 0 0 0 0 0 5 24 0 0 1 2 10 3 8 5
2.9% 0.0% 0.0% 0.0% 0.0% 0.0% 0.0% 5.5% 80.0% 0.0% 0.0% 0.7% 1.1% 3.9% 3.0% 5.0% 4.5%
100.0% 0.0% 0.0% 0.0% 0.0% 0.0% 0.0% 17.2% 82.8% 0.0% 0.0% 3.4% 6.9% 34.5% 10.3% 27.6% 17.2%GH H GH H GH GH HI I DFG dFg
Mean/Average 3.1 4.6 5.4 6.0 1.5 4.9 4.7 6.6 2.5 3.0 2.9 3.3 3.3 3.3 3.5 3.4
Std. Deviation 0.82 1.00 0.70 0.00 0.50 1.10 1.08 0.80 1.11 1.61 1.58 1.65 1.74 1.84 1.82 1.84
Std. Error 0.10 0.15 0.09 0.00 0.04 0.11 0.11 0.15 0.06 0.37 0.13 0.12 0.11 0.18 0.14 0.18
Sample Exit Interview SurveyAdvanced Banner Report
Page 1 of 3
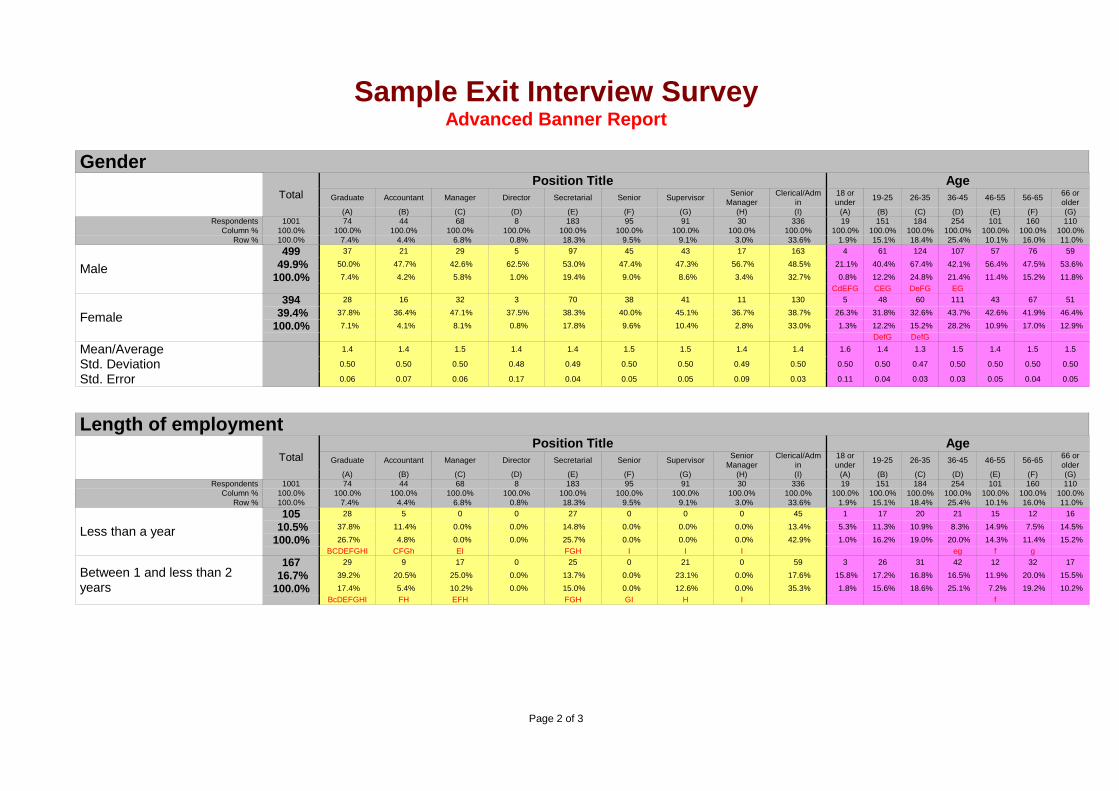
GenderTotal
Position Title AgeGraduate Accountant Manager Director Secretarial Senior Supervisor Senior
ManagerClerical/Adm
in18 orunder 19-25 26-35 36-45 46-55 56-65 66 or
older(A) (B) (C) (D) (E) (F) (G) (H) (I) (A) (B) (C) (D) (E) (F) (G)
Respondents 1001 74 44 68 8 183 95 91 30 336 19 151 184 254 101 160 110Column % 100.0% 100.0% 100.0% 100.0% 100.0% 100.0% 100.0% 100.0% 100.0% 100.0% 100.0% 100.0% 100.0% 100.0% 100.0% 100.0% 100.0%
Row % 100.0% 7.4% 4.4% 6.8% 0.8% 18.3% 9.5% 9.1% 3.0% 33.6% 1.9% 15.1% 18.4% 25.4% 10.1% 16.0% 11.0%
Male499 37 21 29 5 97 45 43 17 163 4 61 124 107 57 76 59
49.9% 50.0% 47.7% 42.6% 62.5% 53.0% 47.4% 47.3% 56.7% 48.5% 21.1% 40.4% 67.4% 42.1% 56.4% 47.5% 53.6%
100.0% 7.4% 4.2% 5.8% 1.0% 19.4% 9.0% 8.6% 3.4% 32.7% 0.8% 12.2% 24.8% 21.4% 11.4% 15.2% 11.8%CdEFG CEG DeFG EG
Female394 28 16 32 3 70 38 41 11 130 5 48 60 111 43 67 51
39.4% 37.8% 36.4% 47.1% 37.5% 38.3% 40.0% 45.1% 36.7% 38.7% 26.3% 31.8% 32.6% 43.7% 42.6% 41.9% 46.4%
100.0% 7.1% 4.1% 8.1% 0.8% 17.8% 9.6% 10.4% 2.8% 33.0% 1.3% 12.2% 15.2% 28.2% 10.9% 17.0% 12.9%DefG DefG
Mean/Average 1.4 1.4 1.5 1.4 1.4 1.5 1.5 1.4 1.4 1.6 1.4 1.3 1.5 1.4 1.5 1.5
Std. Deviation 0.50 0.50 0.50 0.48 0.49 0.50 0.50 0.49 0.50 0.50 0.50 0.47 0.50 0.50 0.50 0.50
Std. Error 0.06 0.07 0.06 0.17 0.04 0.05 0.05 0.09 0.03 0.11 0.04 0.03 0.03 0.05 0.04 0.05
Length of employmentTotal
Position Title AgeGraduate Accountant Manager Director Secretarial Senior Supervisor Senior
ManagerClerical/Adm
in18 orunder 19-25 26-35 36-45 46-55 56-65 66 or
older(A) (B) (C) (D) (E) (F) (G) (H) (I) (A) (B) (C) (D) (E) (F) (G)
Respondents 1001 74 44 68 8 183 95 91 30 336 19 151 184 254 101 160 110Column % 100.0% 100.0% 100.0% 100.0% 100.0% 100.0% 100.0% 100.0% 100.0% 100.0% 100.0% 100.0% 100.0% 100.0% 100.0% 100.0% 100.0%
Row % 100.0% 7.4% 4.4% 6.8% 0.8% 18.3% 9.5% 9.1% 3.0% 33.6% 1.9% 15.1% 18.4% 25.4% 10.1% 16.0% 11.0%
Less than a year105 28 5 0 0 27 0 0 0 45 1 17 20 21 15 12 16
10.5% 37.8% 11.4% 0.0% 0.0% 14.8% 0.0% 0.0% 0.0% 13.4% 5.3% 11.3% 10.9% 8.3% 14.9% 7.5% 14.5%
100.0% 26.7% 4.8% 0.0% 0.0% 25.7% 0.0% 0.0% 0.0% 42.9% 1.0% 16.2% 19.0% 20.0% 14.3% 11.4% 15.2%BCDEFGHI CFGh EI FGH I I I eg f g
Between 1 and less than 2 years
167 29 9 17 0 25 0 21 0 59 3 26 31 42 12 32 17
16.7% 39.2% 20.5% 25.0% 0.0% 13.7% 0.0% 23.1% 0.0% 17.6% 15.8% 17.2% 16.8% 16.5% 11.9% 20.0% 15.5%
100.0% 17.4% 5.4% 10.2% 0.0% 15.0% 0.0% 12.6% 0.0% 35.3% 1.8% 15.6% 18.6% 25.1% 7.2% 19.2% 10.2%BcDEFGHI FH EFH FGH GI H I f
Sample Exit Interview SurveyAdvanced Banner Report
Page 2 of 3

Overall Views on CompanyAsia Pacific
Training
Interest in Work
Salary
Working Hours
Benefits
Supervisor
Management
Work Conditions
Discrimination
Poor PerformanceAcceptable PerformanceHigh Performance
Sample Exit Interview SurveyPyramid Analysis Report
Page 1 of 2
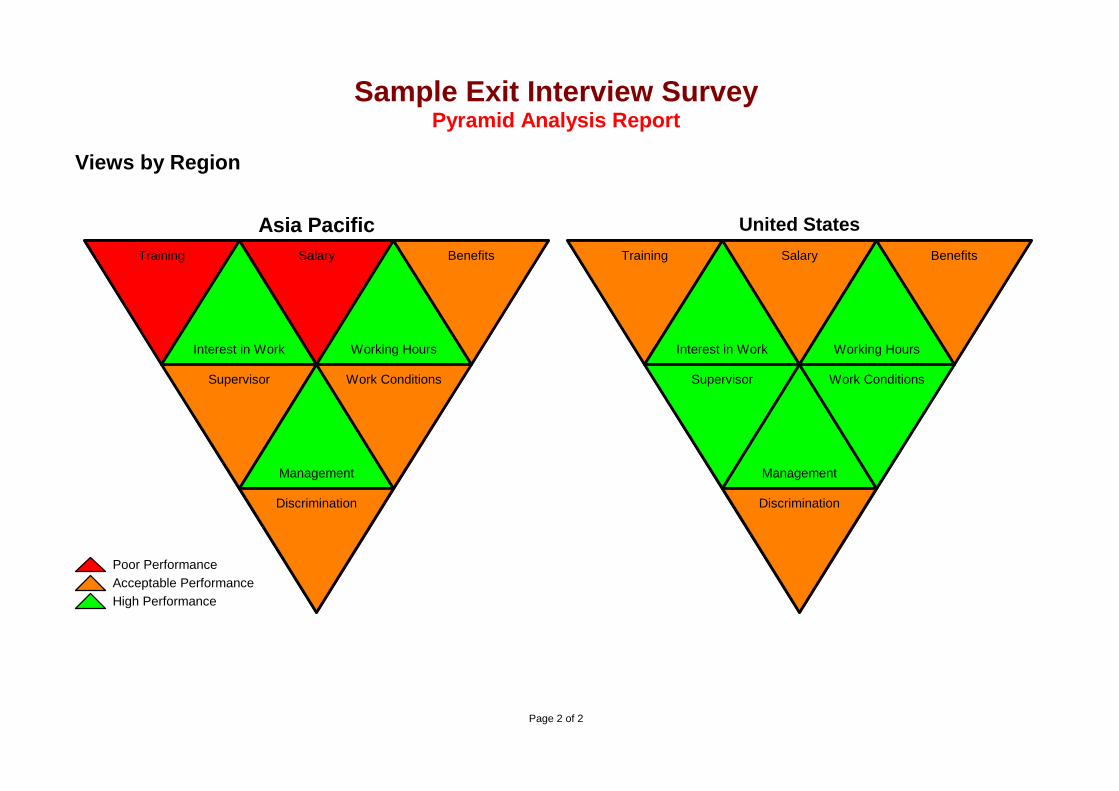
Views by Region
Asia PacificTraining
Interest in Work
Salary
Working Hours
Benefits
Supervisor
Management
Work Conditions
Discrimination
United StatesTraining
Interest in Work
Salary
Working Hours
Benefits
Supervisor
Management
Work Conditions
Discrimination
Poor PerformanceAcceptable PerformanceHigh Performance
Sample Exit Interview SurveyPyramid Analysis Report
Page 2 of 2
Table of Contents
Sample Exit Interview SurveyDual Range Analysis Report
Page 1 of 7
Interpreting this Report ................................................................................................................................... 2
Performance Analysis ..................................................................................................................................... 3Rating Analysis ............................................................................................................................................. 3
Improvement Areas ......................................................................................................................................... 4Key Improvement Areas ............................................................................................................................... 4Maintain Performance .................................................................................................................................. 4
Ranking Tables ................................................................................................................................................ 5Performance Rankings ................................................................................................................................. 5Importance Rankings .................................................................................................................................... 6

Rating AnalysisThe chart below shows the average performance and importance scores for each area surveyed.
Rating Analysis
Frequency Importance
Q26(a) Q26(b) Q26(c) Q26(d) Q26(e)
Ra t
ing
0
1
2
3
4
5
High Performance
Frequency Importance GapQ26(a) Do you feel that your individual staff needs have been recognized? 2.9 3.9 -25.6%
Q26(b) Do you feel that the goals and strategies of Dipolar were effectively communicated? 3.4 3.4 0.0%
Q26(c) Have workplace problems/disputes been resolved in a timely manner? 3.7 3.8 -2.6%
Q26(d) Have workplace problems/disputes been resolved fairly? 3.3 3.9 -15.4%
Q26(e) Do you feel that your efforts at Dipolar have been recognized? 2.8 3.9 -28.2%
Sample Exit Interview SurveyDual Range Analysis Report
Page 3 of 7

Improvement Areas
Key Improvement Areas
The following areas have been identified as needing improvement. The identification involved looking at the relative performance and importance of each area in the survey.
1. Have workplace problems/disputes been resolved fairly? (Gap: -15.4%)2. Do you feel that your individual staff needs have been recognized? (Gap: -25.6%)3. Do you feel that your efforts at Dipolar have been recognized? (Gap: -28.2%)
Maintain Performance
Areas listed here are those where performance was high (above 3.5) and importance was also high (above 3.5).
1. Have workplace problems/disputes been resolved in a timely manner? (Gap: -2.6%)
Sample Exit Interview SurveyDual Range Analysis Report
Page 4 of 7

Performance RankingsRank Question Average
1 Have workplace problems/disputes been resolved in a timely manner? 3.74
2 Do you feel that the goals and strategies of Dipolar were effectively communicated? 3.41
3 Have workplace problems/disputes been resolved fairly? 3.254 Do you feel that your individual staff needs have been recognized? 2.865 Do you feel that your efforts at Dipolar have been recognized? 2.83
Strengths
Weaknesses
Sample Exit Interview SurveyDual Range Analysis Report
Page 5 of 7

Importance RankingsRank Question Average
1 Do you feel that your efforts at Dipolar have been recognized? 3.952 Have workplace problems/disputes been resolved fairly? 3.913 Do you feel that your individual staff needs have been recognized? 3.864 Have workplace problems/disputes been resolved in a timely manner? 3.78
5 Do you feel that the goals and strategies of Dipolar were effectively communicated? 3.43
Most Important
LeastImportant
Sample Exit Interview SurveyDual Range Analysis Report
Page 6 of 7

Response FrequencyThe frequency analysis shown below is simply used as a "double-check" to ensure that there is not a large discrepancy between the number of people who provided performance information, and the number of people who provided importance information.Question Performance Importance % DifferenceDo you feel that your individual staff needs have been recognized? 997 989 0.8%
Do you feel that the goals and strategies of Dipolar were effectively communicated? 996 997 0.1%
Have workplace problems/disputes been resolved in a timely manner? 996 980 1.6%
Have workplace problems/disputes been resolved fairly? 991 994 0.3%Do you feel that your efforts at Dipolar have been recognized? 999 997 0.2%
Sample Exit Interview SurveyDual Range Analysis Report
Page 7 of 7

Survey DetailsInterviewee Name Cassandra Barnwell Position Supervisor
Category Summary
Score Out Of %Training 14 25 56%Salary and Benefits 22 40 55%Supervisor 17 30 57%
Total 53 95 56%
Training Salary Supervisor0%
10%
20%
30%
40%
50%
60%
70%
80%
90%
100%
Sample Exit Interview SurveyQuestionnaire Calculation Sheet
Page 1 of 3
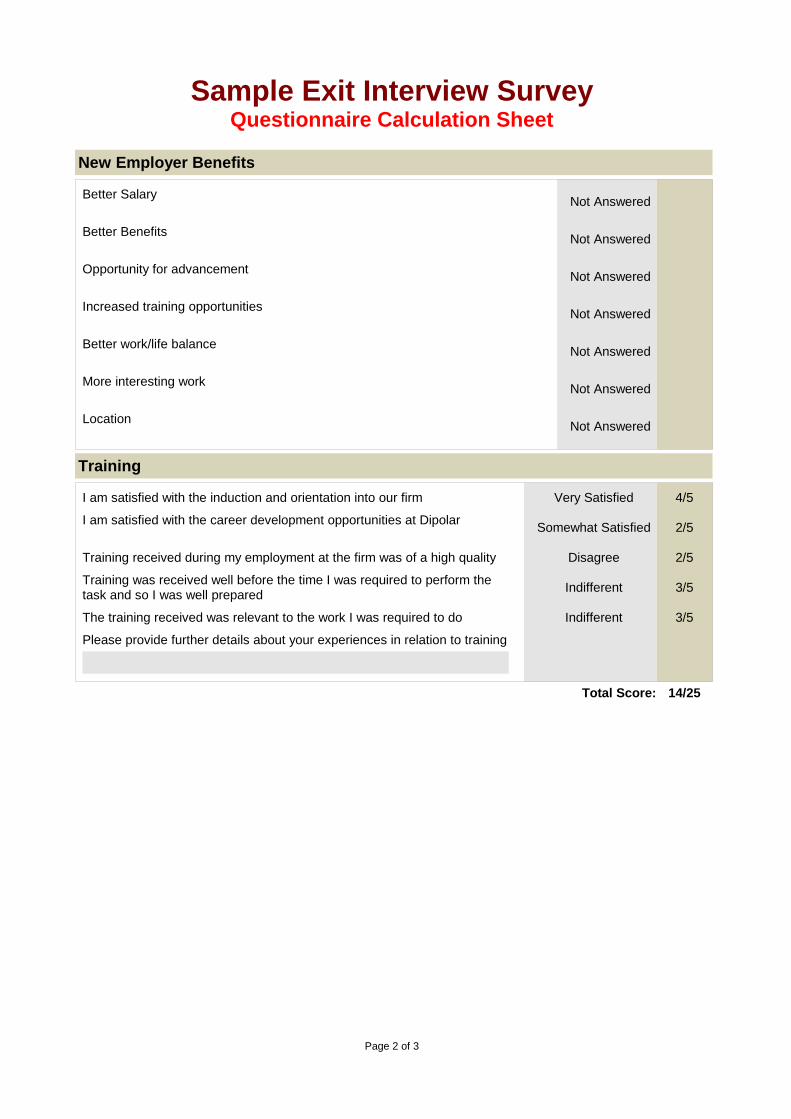
New Employer Benefits
Better Salary Not Answered
Better Benefits Not Answered
Opportunity for advancement Not Answered
Increased training opportunities Not Answered
Better work/life balance Not Answered
More interesting work Not Answered
Location Not Answered
Training
I am satisfied with the induction and orientation into our firm Very Satisfied 4/5
I am satisfied with the career development opportunities at Dipolar Somewhat Satisfied 2/5
Training received during my employment at the firm was of a high quality Disagree 2/5
Training was received well before the time I was required to perform the task and so I was well prepared Indifferent 3/5
The training received was relevant to the work I was required to do Indifferent 3/5
Please provide further details about your experiences in relation to training
Total Score: 14/25
Sample Exit Interview SurveyQuestionnaire Calculation Sheet
Page 2 of 3

Salary and Benefits
I am satisfied with the progress I made within the organisation Disagree 2/5
I am satisfied with the performance of my co-workers Uncertain 3/5
My skills and experience were utilized Uncertain 3/5
Please outline the skills that were underutilized and suggest what could have been done to make better use of these skills
My salary is in line with demands of my position Disagree 2/5
My salary is competitive with the current rate in the job market Disagree 2/5
I am satisfied with the flexibility of my working hours Not Satisfied 1/5
I am satisfied with my medical benefits Very Satisfied 4/5
I am satisfied with my leave entitlements Extremely Satisfied 5/5
Total Score: 22/40
Supervisor
My supervisor is competent Disagree 2/5
My supervisor takes the time to listen to me Indifferent 3/5
My supervisor actively encourages teamwork Indifferent 3/5
My supervisor provides assistance when required Indifferent 3/5
My supervisor has the knowledge to assist me with my work when required Indifferent 3/5
My supervisor gives fair reviews Indifferent 3/5
Total Score: 17/30
Sample Exit Interview SurveyQuestionnaire Calculation Sheet
Page 3 of 3

Survey DetailsInterviewee Name Scott Barnwell Position Graduate
Category Summary
Score Out Of %Training 18 25 72%Salary and Benefits 28 40 70%Supervisor 21 30 70%
Total 67 95 71%
Training Salary Supervisor0%
10%
20%
30%
40%
50%
60%
70%
80%
90%
100%
Sample Exit Interview SurveyQuestionnaire Calculation Sheet
Page 1 of 3

Company Departments
Asia Pacific United States0%
10%
20%
30%
40%
50%
60%
70%
80%
90%
100%
Asia Pacific United StatesHuman Resources 64% 65%Information Technology 59% 63%Other Departments 56% 65%
Human Resources
Asia Pacific United States0%
10%
20%
30%
40%
50%
60%
70%
80%
90%
100%
Asia Pacific United StatesTraining 67% 65%The Role 67% 67%Job Performance 60% 61%Supervisor 71% 73%Leadership and Support 66% 70%Salary and Benefits 55% 53%
Sample Exit Interview SurveySummary Calculation Sheet
Page 1 of 2

Information Technology
Asia Pacific United States0%
10%
20%
30%
40%
50%
60%
70%
80%
90%
100%
Asia Pacific United StatesTraining 44% 51%The Role 65% 72%Job Performance 58% 64%Supervisor 72% 75%Leadership and Support 64% 73%Salary and Benefits 51% 51%
Other Departments
Asia Pacific United States0%
10%
20%
30%
40%
50%
60%
70%
80%
90%
100%
Asia Pacific United StatesTraining 39% 45%The Role 70% 74%Job Performance 59% 67%Supervisor 58% 78%Leadership and Support 66% 67%Salary and Benefits 53% 61%
Sample Exit Interview SurveySummary Calculation Sheet
Page 2 of 2

Rank Question Title Score (%)1 Q3(a) Are you going to another Employer? 82%2 Q5(b) Better Benefits 80%3 Q26(e) Do you feel that your efforts at Dipolar have been recognized? 79%4 Q26(d) Have workplace problems/disputes been resolved fairly? 78%
5 Q10(c) I had the opportunity to pass on my expertise prior to my departure from Dipolar 77%
Q26(a) Do you feel that your individual staff needs have been recognized? 77%
7
Q19(e) My supervisor has the knowledge to assist me with my work when required 76%
Q26(c) Have workplace problems/disputes been resolved in a timely manner? 76%
Q5(c) Opportunity for advancement 76%
10 Q26(c) Have workplace problems/disputes been resolved in a timely manner? 75%
Q24(a) Did you encounter any barriers to your success at the firm? 75%
12
Q10(a) My role involved interesting and challenging work 74%Q5(a) Better Salary 74%
Q10(e) I feel that my role in the organisation is important and I take pride in my work 74%
15 Q1(d) Select your gender 72%Q12(c) I am satisfied with the performance of my co-workers 72%
17
Q19(b) My supervisor takes the time to listen to me 71%Q19(d) My supervisor provides assistance when required 71%
Q27(a) Did Dipolar show flexibility in relation to your family obligations and responsibilties? 71%
20
Q5(d) Increased training opportunities 70%Q10(b) I had significant input into the decision making process 70%Q27(b) Did you make use of the Dipolar's flexible work/life policies? 70%Q17(b) I am satisfied that Dipolar maintained a safe office environment 70%Q19(a) My supervisor is competent 70%
25 Q26(b) Do you feel that the goals and strategies of Dipolar were effectively communicated? 69%
Q1(e) Select your position title 69%
27
Q5(g) Location 68%
Q26(b) Do you feel that the goals and strategies of Dipolar were effectively communicated? 68%
Q5(e) Better work/life balance 68%Q1(f) How long have you worked at Dipolar? 68%
31 Q12(a) I am satisfied with my overall job performance 67%Q19(c) My supervisor actively encourages teamwork 67%
33 Q5(f) More interesting work 66%Q15(a) I am satisfied with the flexibility of my working hours 66%
35 Q26(d) Have workplace problems/disputes been resolved fairly? 65%Q22(a) My manager provided me with appropriate feedback 65%
37 Q17(a) I am satisfied with my physical working environment 64%
38 Q4(a) How did you find your new place of employment at {NEWEMPNAME}? 63%
39 Q19(f) My supervisor gives fair reviews 62%
40 Q12(d) My skills and experience were utilized 60%Q15(c) I am satisfied with my leave entitlements 60%
42 Q17(c) The proper tools and equipment were provided 59%
Sample Exit Interview SurveyRanking of Key Benefits
Page 1 of 2

Rank Question Title Score (%)
43Q15(b) I am satisfied with my medical benefits 58%
Q27(d) Have you ever experienced any of the following forms of discrimination or harassment at Dipolar? 58%
45 Q26(a) Do you feel that your individual staff needs have been recognized? 57%Q26(e) Do you feel that your efforts at Dipolar have been recognized? 57%
47 Q1(c) Select your age group 54%48 Q7(a) I am satisfied with the induction and orientation into our firm 53%
49 Q8(b) Training was received well before the time I was required to perform the task and so I was well prepared 52%
50 Q10(d) I had to perform tasks that were outside of my job description which hampered my overall performance 51%
Q27(c) Would your refer a friend to apply for a job at Dipolar? 51%52 Q14(b) My salary is competitive with the current rate in the job market 49%53 Q12(b) I am satisfied with the progress I made within the organisation 48%
54 Q1(g) Select your salary range 47%Q8(c) The training received was relevant to the work I was required to do 47%
56 Q7(b) I am satisfied with the career development opportunities at Dipolar 46%57 Q14(a) My salary is in line with demands of my position 41%
58 Q8(a) Training received during my employment at the firm was of a high quality 40%
Sample Exit Interview SurveyRanking of Key Benefits
Page 2 of 2

Employee DetailsEmployee Name McCrossin, Denny
Interpreting this ReportThis report "benchmarks" each employees ratings against those of other employees that were surveyed.
The "normal range" is the 1st and 3rd quartiles of the data entered.
Benchmarks
Your Response Benchmark Normal range of past survey participants
Training 1 2 3 4 5
Score for this employee is 4.40. This compares with a normal range of 1.60 to 3.00 for other employees.
Salary and Benefits 1 2 3 4 5
Score for this employee is 4.20. This compares with a normal range of 2.00 to 3.40 for other employees.
Supervisor Performance 1 2 3 4 5
The supervisor was rated at 3.67 by this employee. This compares with a normal range of 2.83 to 4.33 by other employees.
Sample Exit Interview SurveyEmployee Benchmark Report
Page 1 of 5

Employee DetailsEmployee Name Pounds, Anne
Interpreting this ReportThis report "benchmarks" each employees ratings against those of other employees that were surveyed.
The "normal range" is the 1st and 3rd quartiles of the data entered.
Benchmarks
Your Response Benchmark Normal range of past survey participants
Training 1 2 3 4 5
Score for this employee is 1.40. This compares with a normal range of 1.60 to 3.00 for other employees.
Salary and Benefits 1 2 3 4 5
Score for this employee is 2.00. This compares with a normal range of 2.00 to 3.40 for other employees.
Supervisor Performance 1 2 3 4 5
The supervisor was rated at 4.33 by this employee. This compares with a normal range of 2.83 to 4.33 by other employees.
Sample Exit Interview SurveyEmployee Benchmark Report
Page 2 of 5

Interpreting this ReportThis report "benchmarks" the Customer Service dapartment ratings against those of other departments that were surveyed.
The "normal range" is 3 standard deviations from the mean of the data entered.
Benchmarks
Customer Service Required Benchmark Asia Pacific United States
Training 1 2 3 4 5
Score for customer service is 1.66. This compares with a range of 2.15 to 2.39 for the Asia Pacific region, and 2.44 and 2.69 for the United States.
Salary and Benefits 1 2 3 4 5
Score for customer service is 2.60. This compares with a range of 2.53 to 2.74 for the Asia Pacific region, and 2.77 and 3.02 for the United States.
Supervisor Performance 1 2 3 4 5
Score for customer service is 2.57. This compares with a range of 3.08 to 3.32 for the Asia Pacific region, and 3.72 and 3.94 for the United States.
The Role 1 2 3 4 5
Score for customer service is 3.39. This compares with a range of 3.30 to 3.48 for the Asia Pacific region, and 3.48 and 3.67 for the United States.
Employment Conditions 1 2 3 4 5
Score for customer service is 2.42. This compares with a range of 2.80 to 3.05 for the Asia Pacific region, and 3.45 and 3.69 for the United States.
Sample Exit Interview SurveyOrganisation Benchmark Report
Page 1 of 2

Benchmarks
Customer Service Required Benchmark Asia Pacific United States
Job Performance 1 2 3 4 5
Score for customer service is 2.98. This compares with a range of 2.87 to 3.04 for the Asia Pacific region, and 3.13 and 3.35 for the United States.
Sample Exit Interview SurveyOrganisation Benchmark Report
Page 2 of 2

Respondent filter: Show all respondents
Respondent Name Login ID Response DateAdams, Jane EXTNR 27/07/2007 16:49Adler, Rachel FZFAY 27/07/2007 16:49Akin, Laurie OUOXU 27/07/2007 16:49Aleman, Harry WRHZD 27/07/2007 16:49Aleman, Melanie FNNOE 27/07/2007 16:49Aleman, Sharon VPVNV 27/07/2007 16:49Alexander, Sharon MIUDF 27/07/2007 16:49Alexander, Stuart UEBRG 27/07/2007 16:49Allen, Giulietta DCTTP 27/07/2007 16:49Allen, Heather WFPNI 27/07/2007 16:49Allison, Allen RTFNX 27/07/2007 16:49Allison, Stephen LWBIQ 27/07/2007 16:49Allwood, Troy ZOLCY 27/07/2007 16:49Anderson, Janet GLPIG 27/07/2007 16:49Andreou, Jack NHTNN 27/07/2007 16:49Applegate, Kathleen TEXTU 27/07/2007 16:49Applegate, Nancy CYFIV 27/07/2007 16:49Arbore, Barbara JULWW 27/07/2007 16:49Askew, Kevin RSCOM 27/07/2007 16:49Askew, Laurel QQPCE 27/07/2007 16:49Atkinson, Toby FIBWM 27/07/2007 16:49Austin, Bryan GKMJU 27/07/2007 16:49Baer, Helen MHQOB 27/07/2007 16:49Baggerly, Charles UCXDD 27/07/2007 16:49Baggerly, Laura BYCJJ 27/07/2007 16:49Baggerly, Maria JTIXK 27/07/2007 16:49Baggerly, Stefanie QPPML 27/07/2007 16:49Bailliet, Phillip SQDIN 27/07/2007 16:49Baird, Denise ZNHOU 27/07/2007 16:49Baird, Marcia HIODV 27/07/2007 16:49Baird, Veronica OFSID 27/07/2007 16:49Baker, Philip VAZWE 27/07/2007 16:49Ball, Kim JSIIS 27/07/2007 16:49Ball, Michael DWEDL 27/07/2007 16:49Banks, Russell QPMOZ 27/07/2007 16:49Baptist-Nguyen, Hunter EHWII 27/07/2007 16:49Baptist-Nguyen, Kristen XKSDB 27/07/2007 16:49Baptist-Nguyen, Nancy SYIDQ 27/07/2007 16:49Baptist-Nguyen, Victor MCEWJ 27/07/2007 16:49Barcio, Bryan ZUMIX 27/07/2007 16:49Bardsley, Ivan HQTWY 27/07/2007 16:49Bardsley, Mike PLALZ 27/07/2007 16:49Barnes, Christina VIERH 27/07/2007 16:49Barnwell, Cassandra KZPLP 27/07/2007 16:49Barnwell, Scott DEIWO 27/07/2007 16:49Barrera, Theresa LCBXW 27/07/2007 16:49Barreto, Eileen UWKVR 27/07/2007 16:49Barreto, Jamie BSOCY 27/07/2007 16:49Barreto, Jason OLWMN 27/07/2007 16:49Barreto, Sam IPSHG 27/07/2007 16:49Barrow, Patrick WHEBO 27/07/2007 16:49
Sample Exit Interview SurveyRespondent Listing
Page 1 of 20

Respondent Name Login ID Response DateBarton, Vicky DDIHV 27/07/2007 16:49Bass, George KYMMD 27/07/2007 16:49Bates, Rebecca YRWHL 27/07/2007 16:49Bates, Tracy QVQRK 27/07/2007 16:49Bazaldua, Duane GMEVM 27/07/2007 16:49Becker, Eric NIKLN 27/07/2007 16:49Beeghly, Betty UEOQU 27/07/2007 16:49Belforte, Aaron VGBDD 27/07/2007 16:49Bellamy, Beth ECHRE 27/07/2007 16:49Bellavance, Allen QUPDS 27/07/2007 16:49Bellavance, Greg KXLWL 27/07/2007 16:49Belusar, David EKPKS 27/07/2007 16:49Bennett, Jeff FMBWA 27/07/2007 16:49Bensley, Christen NHHLC 27/07/2007 16:49Berger, Allison DYUPE 27/07/2007 16:49Berger, Jenna PJVHD 27/07/2007 16:49Berger, Marisa JUYUL 27/07/2007 16:49Berggren, Alicia KWKHS 27/07/2007 16:49Berry, Carolyn SSRVT 27/07/2007 16:49Bertelson, Bill ANXLU 27/07/2007 16:49Beusse, Wayne IJFZV 27/07/2007 16:49Bickford, Courtney JLQME 27/07/2007 16:49Bird, Kathleen QHXBF 27/07/2007 16:49Birdwell, Fred YCEPG 27/07/2007 16:49Birdwell, Justin GXLFH 27/07/2007 16:49Blackmon, Crystal TQTPV 27/07/2007 16:49Blackmon, Margaret NTPKO 27/07/2007 16:49Blackwell, Christina CLAEW 27/07/2007 16:49Blackwell, Dana DNLRF 27/07/2007 16:49Blankinship, Sara QDLYF 27/07/2007 16:49Blanton, Nicole WZPEM 27/07/2007 16:49Blomkalns, Tatiana XCBRT 27/07/2007 16:49Bloomfield, Theresa GWIGV 27/07/2007 16:49Bolding, Clay VOVJX 27/07/2007 16:49Bolding, Erin ORQEQ 27/07/2007 16:49Book, Greg WQHVF 27/07/2007 16:49Boucher, Heather ELNKG 27/07/2007 16:49Boyd, Laura LIRQN 27/07/2007 16:49Boyd, Russell REVVU 27/07/2007 16:49Boyles, Troy FTVEU 27/07/2007 16:49Braden, Giulietta MQZJC 27/07/2007 16:49Braden, Larry UNRKL 27/07/2007 16:49Braden, Tom NSLVK 27/07/2007 16:49Braden, Wade DJYZM 27/07/2007 16:49Bradley, Monica JFDFT 27/07/2007 16:49Brady, Adrian XWOYC 27/07/2007 16:49Brady, Larry QCHKB 27/07/2007 16:49Brandow, Jenna FTSFJ 27/07/2007 16:49Bray, Kathryn MOYTK 27/07/2007 16:49Bray, Nathan TKGIL 27/07/2007 16:49Bredenberg, Deanne VMRVT 27/07/2007 16:49Breyer, Lauren EHBSO 27/07/2007 16:49
Sample Exit Interview SurveyRespondent Listing
Page 2 of 20