sample costs to establish an orchard and … · sample costs to establish an almond orchard and...
TRANSCRIPT
UNIVERSITY OF CALIFORNIA AGRICULTURE AND NATURAL RESOURCES COOPERATIVE EXTENSION
AGRICULTURAL ISSUES CENTER UC DAVIS DEPARTMENT OF AGRICULTURAL AND RESOURCE ECONOMICS
SAMPLE COSTS TO ESTABLISH AN ORCHARD AND PRODUCE
ALMONDS
SACRAMENTO VALLEY Micro-Sprinkler Irrigation-2016
Kathrine S. Pope Farm Advisor, UC Cooperative Extension, Yolo County Danielle M. Lightle Farm Advisor, UC Cooperative Extension, Butte & Glenn County Richard P. Buchner Farm Advisor, UC Cooperative Extension, Tehama-Shasta Counties Franz Niederholzer Farm Advisor, UC Cooperative Extension, Sutter-Yuba Counties Karen Klonsky Extension Specialist Emeritus, Department of Agricultural and Resource
Economics, UC Davis Daniel A. Sumner Director, Agricultural Issues Center, Professor, Department of Agricultural and
Resource Economics, UC Davis Donald Stewart Staff Research Associate, Agricultural Issues Center and Department of
Agricultural and Resource Economics, UC Davis Christine A. Gutierrez Staff Research Associate, Agricultural Issues Center and Department of
Agricultural and Resource Economics, UC Davis

UC AGRICULTURE AND NATURAL RESOURCES COOPERATIVE EXTENSION
AGRICULTURAL ISSUES CENTER UC DAVIS DEPARTMENT OF AGRICULTURAL AND RESOURCE ECONOMICS
SAMPLE COSTS TO ESTABLISH AN ORCHARD AND PRODUCE ALMONDS
Sacramento Valley – 2016
CONTENTS INTRODUCTION 2 ASSUMPTIONS 3 Establishment Cultural Practices and Material Inputs 3 Production Cultural Practices and Material Inputs 6 Labor, Equipment and Interest 8 Cash Overhead 9 Non-Cash Overhead 10 REFERENCES 12 Table 1. COSTS PER ACRE TO ESTABLISH AN ALMOND ORCHARD 13 Table 2. COSTS PER ACRE TO PRODUCE ALMONDS 15 Table 3. COSTS AND RETURNS PER ACRE TO PRODUCE ALMONDS 17 Table 4. MONTHLY CASH COSTS – ALMONDS 19 Table 5. RANGING ANALYSIS 20 Table 6. WHOLE FARM EQUIPMENT, INVESTMENT & BUSINESS OVERHEAD 21 Table 7. HOURLY EQUIPMENT COSTS 21 Table 8. OPERATIONS WITH EQUIPMENT AND MATERIALS 22 Acknowledgment. Appreciation is expressed to the UC Cooperative Extension, growers, input suppliers, and other industry representatives who provided information, assistance, and expertise for this study.
INTRODUCTION Sample costs to establish an almond orchard and produce almonds under micro sprinkler irrigation in the Sacramento Valley are presented in this study. This study is intended as a guide only. It can be used to help guide production decisions, estimate potential returns, prepare budgets and evaluate production loans. Sample costs given for labor, materials, equipment and contract services are based on early 2016 figures. Practices described are based on production practices considered typical for the crop and area, but will not apply to every situation. A blank column titled Your Costs is provided in Tables 1 and 2 to enter your estimated costs. For an explanation of calculations used in the study, refer to the section titled Assumptions. For more information contact Donald Stewart, University of California Agriculture and Natural Resources, Agricultural Issues Center, Department of Agricultural and Resource Economics, at 530-752-4651 or [email protected] or Christine Gutierrez, University of California Agriculture and Natural Resources, Agricultural Issues Center, at 530-752-5355 or [email protected]. Sample Cost of Production studies for many commodities are available and can be down loaded from the Department website, http://coststudies.ucdavis.edu. Archived studies are also available on the website.
The university is an affirmative action/equal opportunity employer.
2016 Almonds Costs and Returns Study Sacramento Valley UC Cooperative Extension-Ag Issues Center 3
ASSUMPTIONS
The assumptions refer to Tables 1 to 8 and pertain to sample costs to establish an orchard and produce almonds under micro sprinkler irrigation in the Sacramento Valley. The cultural practices described represent production operations and materials considered typical for a well-managed farm in the region. Costs, materials, and practices in this study will not apply to all farms. Timing of and types of cultural practices will vary among growers within the region and from season to season due to variables such as weather, soil, insect and disease pressure. The study is intended as a guide only. The use of trade names and cultural practices in this report does not constitute an endorsement or recommendation by the University of California nor is any criticism implied by omission of other similar products or cultural practices.
Farm. The hypothetical farm consists of 105 contiguous acres farmed by the owner. Smaller non- contiguous parcels may have additional costs for travel time and equipment re-calibration. Larger farms will have increased efficiencies and lower per acre costs. Almonds are being established on 100 acres; roads, irrigation systems and farmstead occupy five acres.
Establishment Cultural Practices and Material Inputs
Site Preparation. This 100-acre orchard is established on ground previously planted to another tree crop. The land is assumed to be well drained and either a class I or II soil. The existing well and main lines stay in place, while the sub-main lines, lateral lines and emitters are removed and replaced as part of the new micro-sprinkler irrigation system. Orchard Removal/Land Preparation. Fifty percent of the cost to remove the old orchard is charged to this crop. A custom operator uses a dozer to push over the trees. A front-end loader with a clamp grabs the trees and hauls them to the horizontal grinder to mulch the wood. A common practice is to either push the chips to the edge of the orchard and burn or transport the chips to a cogent plant. In this study, the chips are pushed and burned at the edge of the orchard. The soil is ripped 3 to 4-feet deep in two directions to break up underlying hardpan and pull up old roots. The roots are removed by hand. The orchard site is disced and rolled twice to break up clods. The new orchard site is laser leveled to reduce or eliminate the possibility of standing water. Fumigation, if needed is in the fall and would be done based on nematode count using Telone C35. Most areas of the Sacramento Valley do not require soil fumigation; these charges are not included in this study. Berms in the tree row are formed with a ridger using GPS. The irrigation system is installed underground in the area between the trees; the cost of installation is included in the total cost of the irrigation system. The row middles are then smoothed/floated once to fill in borrow pits. All operations that prepare the orchard for planting are done in October/November of the year prior to planting, but costs are shown in the first year. Trees. Almond orchards will include at least two or more varieties in which pollen shedding and bloom periods’ overlap to insure adequate pollination or one self-cultivating variety. The Non-Pareil variety is the dominant variety planted in California and planted on approximately 50 percent of the acreage. Planting densities may range from 100 to 180 trees per acre. In this study, 124 trees per acre are planted on a 16 foot x 22 foot spacing (tree x row spacing). The life of the orchard at the time of planting is estimated to be 25 years. Contact the local UCCE advisor or a commercial nursery for varieties and root stocks that are available.
Plant. The trees are planted in February. In this study, the trees are planted with bare roots; however, some growers choose to plant potted trees. Prior to planting, the trees are treated for crown gall prevention by treating the bare roots with Galltrol-A, or similar product. One Galltrol-A plate, (K-84) will treat 200 trees at ¾ inch

2016 Almonds Costs and Returns Study Sacramento Valley UC Cooperative Extension-Ag Issues Center 4
diameter. A commercial planting crew plants the trees by hand and applies 3-5 gallons of water with each tree. The trees are whitewashed, cartons put on, topped and staked by the grower. Note that for tree support, in east-west plantings, the trees are typically staked, which potentially may have higher costs. On north-south rows, the trees are typically trellised and the cost would include the tree ties and tying of the trees by the planting crew.
Train/Prune. Pruning begins in the first year when newly planted trees are topped by the planting crew and is included in the planting costs. In early summer of that year, the trees are suckered. Prunings in the first year are placed in the row middles and shredded with the regular mowing. From year two onward, minimal pruning is required, aside from light hand pruning in December to allow for equipment access and safety. Starting in year two, prunings are pushed to the edge of the orchard and burned. Winter Sanitation. In November of the third year and subsequent years, the mummy nuts are shaken from the trees and swept into the row middles for shredding in this study. A custom operator shakes and sweeps the mummies, which are shredded by the grower. Fertilizer. Triple fifteen (15-15-15), is applied by hand within the drip line of the trees in March, April and June during the first year. From the second year through the production years, liquid UAN-32 is applied through the irrigation system in equal amounts in March, April, and May. Annual rates of actual nitrogen (N) applied are shown in Table A. Beginning in the fall of the second year, zinc sulfate is applied as a foliar spray. Beginning in year two, Potassium sulfate (K2SO4) is banded along the tree row in the fall using a pull type fertilizer applicator. Table A below shows the amount of potassium sulfate per acre.
Table A. Applied Nitrogen (N) Table B. Total Applied Water
Table C. Annual Yields/Acre
Year
Lbs. of N/Acre
Lbs. of K2S04/Acre
Year AcIn/Year
Year Kernel (meat) Lbs.
1 15 0
1-2 18
3 400
2 30 40
3 26
4 800
3 60 80
4 32
5 1,400
4 120 160
5+ 38
6 2,000
5 160 280
7+ 2,200
6+ 220 400+
Sampling: Starting in the 3rd year, one leaf sample per 20 acres is collected by the PCA in July to analyze tree nutrient status. If the leaf analysis shows a nitrogen deficiency, a small amount if UAN-32 is applied through the irrigation system just prior to hull-split. One hull sample per 25 acres is collected by the PCA post-harvest. If this sample shows a nitrogen deficiency, a small amount of UAN-32 is applied through the irrigation system in the fall. Irrigation. In this study, the electrical cost for pumping well water is calculated to cost $100.00 per acre-foot or $8.33 per acre-inch. Price per acre-foot of water will vary by grower depending on water source – well or district water, well characteristics, and water district. It is assumed soil stored water from rainfall will supply a portion of the early season water requirements (in this study, this amounts to approximately 6 acre inches of water stored in the soil that is not included in the applied water amounts). The field is irrigated an average of twice per week from April to October. Amounts will vary each year depending upon the environment. The average, annual water applied to an almond orchard is shown in Table B. Irrigation labor is provided as a separate line item. An annual water analysis to determine nitrate availability and to maintain regulatory records is included in this study.
2016 Almonds Costs and Returns Study Sacramento Valley UC Cooperative Extension-Ag Issues Center 5
Frost Protection. Frost protection begins in February or March of the fourth year. Frost protection may not be required every year and the amount of protection needed will vary. This study assumes two acre- inches of water will be applied annually in February, which is in addition to the amounts of water shown in Table B.
Pollination. A commercial beekeeper sets out one-half hive per acre in the third year, one hive in the fourth year, two hives in the fifth year and two and one-half hives in the sixth year. Bee colony strength should be a standard eight frames per hive and the cost ranges from $150-$225 per hive. For this study, $180 per hive is charges.
Pest Management. The pesticides and rates mentioned in this cost study as well as other materials available are listed in Integrated Pest Management Guidelines, Almonds and the 2015 Fungicide Efficacy and Treatment Timing for Almonds publication located on the UC Davis IPM website at www.ipm.ucdavis.edu. For information on other pesticides available, pest identification, monitoring, and management, check with your PCA and/or visit the UC IPM website at www.ipm.ucdavis.edu. Although growers commonly use the pesticides mentioned, many other pesticides are available. For information and pesticide use permits, contact the local county agricultural commissioner's office. Pesticides with different active ingredients, mode of action, and sites of action should be rotated as needed to combat species shift and resistance. Bees: Bees are sensitive to pesticides and timing of applications must coordinate with bee pollinating activity. See the individual pesticide labels, environmental hazards section, for these requirements in the following publication: Oregon State University, “How to Reduce Bee Poisonings from Pesticides”: https://catalog.extension.oregonstate.edu/pnw591.
Pest Control Adviser (PCA/CCA). The PCA or crop consultant monitors the field for agronomic problems including pests and nutrition and writes pesticide recommendations. Growers may hire private PCAs or receive the service as part of a service agreement with an agricultural chemical and fertilizer company. For this study, the PCA charge is $20 per acre during the first three years and $35 per acre thereafter. Vegetation Management-Weeds. In the first year, weeds are controlled in the row middles by mowing in May, June and August. The tree row (strip spray) is sprayed with Alion, Matrix and Super Gramoxone in January, April, June and August. In the second calendar year, the row middles are mowed twice - February and June. The tree row is sprayed with a dormant strip spray using Surflan and Roundup in January. Two spot or strip sprays with Roundup are applied to the tree row during the year, one in April and one in July. From the third year on, the row middles are mowed five times in February, April, May, June and August. A dormant season strip spray with Alion, Matrix, and Roundup is applied in January. Roundup is applied as a strip spray in May to pick up escaped weeds. A pre-harvest weed spray in July with Roundup and Rely 280 is applied to the entire orchard floor (row middles and tree row). Insects. In the first year, sprays are applied using a sprayer with a handgun and due to the small tree size; the applied rate is 10 percent of recommended total volume. An insecticide treatment of Alticor for peach twig borer (PTB) control and AgriMek for mites is made in May. Starting in the second year an Airblast sprayer is used to apply the materials. Intrepid, and dormant oil are applied on alternate rows in late-January (delayed dormant) of the second year if complete coverage is possible. For PTB in the fourth, fifth and sixth year, a biological insecticide, Dipel, is added to the brown rot materials; two treatments are made, one at bloom in February and one at petal fall in early March.

2016 Almonds Costs and Returns Study Sacramento Valley UC Cooperative Extension-Ag Issues Center 6
Diseases. In the third, fourth and fifth years, Vanguard WG is applied in February to control brown rot. In the fourth and fifth year, Ziram is applied in March/April to control shot hole, scab and rust. In the sixth year, brown rot may be controlled with Vanguard in February and shot hole with Merivon, Luna or Bravo (this study applies Bravo) in early March, and Ziram in late March. Additional fungicide sprays can be applied in April or later (approximately 5 weeks after petal fall) for control of scab, rust and Alternaria.
Vertebrate Pests. Treatments will vary depending upon rodent populations. Gophers in this study are managed with poison bait applied in the spring and fall using a hand bait applicator. The grower uses an ATV to check the stations. Trapping is used to control squirrels at a cost of $8.50/trap, which is included in shop tools. Squirrel traps are set from March through October. The grower uses an ATV to set 2.5 traps/acre. Rates and times for vertebrate control are estimated. See the following websites for additional information. http://ucanr.org/sites/Ground_Squirrel_BMP/ http://www.ipm.ucdavis.edu/PMG/menu.vertebrate.html.
Harvest. Beginning in the third year the almonds are mechanically harvested; albeit, great care is taken when shaking the trees in the first harvest year as to not damage the root system. A farm of this size may own the harvesting equipment, but in this study, the grower contracts to have the almond crop custom harvested. The grower furnishes labor for hand raking to move nuts missed by the sweeper into the windrows. Almond harvest starts in August and goes through September. A shaker head attaches to the tree trunk to shake the nuts from the tree. The nuts fall to the ground, are allowed to dry and in a separate operation are blown from around the tree and swept into windrows. A pickup machine gathers the nuts from the windrow and loads them into a cart or bankout wagon. In this study, the nuts are elevated or dumped into bottom dump trailers for delivery to the huller.
Production Cultural Practices and Material Inputs
Prune. Hand pruning is done in alternate years during the winter months (December-January) to remove dead or diseased wood, facilitate orchard management and provide equipment access. In this study, one-half of the cost is charged each year to the orchard operation. Prunings are placed into the row middles and pushed out of the orchard by a tractor with a brush rake and burned. Some growers elect to shred prunings in the rows. Winter Sanitation. Winter sanitation in January destroys overwintering sites for navel orange worm (NOW). The trees containing mummy nuts are mechanically shaken to drop the mummies to the orchard floor where they are swept into the middles and shredded with a flail mower. The shaking and sweeping operations are custom hired and the grower does the shredding. For this study, this operation begins in November of the third year.
Fertilizer. UAN-32 is applied through the irrigation system at 220 pounds of N per acre and is split into equal applications in March, April, and May. Zinc sulfate is applied as a foliar spray in November. Potassium sulfate (K2SO4) at 440+ pounds per acre is banded along the tree row in late November, depending on tree nutrient status. Samples: Tree nutrient status is determined by leaf analysis, with one sample per 20 acres is collected in July. If the leaf analysis shows a nitrogen deficiency, a small amount if UAN-32 is applied through the irrigation system just prior to hull-split. One hull sample per 25 acres is collected post-harvest. If this sample shows a nitrogen deficiency, a small amount of UAN-32 is applied through the irrigation system in the fall.

2016 Almonds Costs and Returns Study Sacramento Valley UC Cooperative Extension-Ag Issues Center 7
Irrigation. The water is pumped from a well and passes through a filtration system into the micro sprinkler system. Thirty-eight acre inches of water are applied to the orchard from April to October averaging two irrigation per week over the 25-week period. Irrigations early and late in the season may be less than twice per week. Pumping costs are $8.33 per acre-inch, ($100 per Acre-foot) based on current grower costs. Rates will vary depending upon pump and well specifications and rate program selected. Irrigation labor is a separate line item.
Frost Protection. Frost protection may not be required every year and the amount of protection needed will vary. This study assumes two acre- inches of water will be applied annually in February, which is in addition to the amounts of water shown in Table B. Pollination. For maximum pollination, mature orchards require two and one-half hives (6 – 8 frames of bees per hive) per acre for pollination during February through mid-March at a cost of $180/hive.
Pest Management. See Pest Management in the previous section. Vegetation Management-Weeds. In this study, weeds in mature orchards are controlled in the tree row (strip spray) in the winter (January) using Alion, Matrix and Roundup. In addition, one strip spray with Roundup is made during May. Row middles are mowed five times to control resident vegetation. To prepare the orchard floor for harvest, an herbicide application of Rely 280 and Roundup is made in late July. The grower uses an ATV and pull sprayer for spraying the herbicides.
Insects and Mites. Several insect and mite pests are controlled each year using integrated pest management. It is assumed that biological insecticides such as Dipel applied at bloom and post bloom will control peach twig borer (PTB); therefore, dormant sprays are not needed. The materials are applied with the disease sprays in early to late March. An insecticide application of Altacor for navel orange worm (NOW) and Zeal for mites is applied in July. This spray may not be done every year, other insecticides and timings may be utilized depending upon insect type and timing.
Diseases. Fungicide applications are made to control brown rot, shot hole, scab, Alternaria and anthracnose. Applications for brown rot control are made with Vanguard during bloom in February. Bravo is applied at late petal fall for shot hole in March and Ziram for scab and anthracnose later in March. Additional fungicide sprays may be applied in April or later for scab, Alternaria and anthracnose. Alternate fungicides with different modes of action should be used to protect against chemical resistance. See Efficacy and Timing of Fungicides, Bactericides, and Biologicals for Deciduous Tree Fruit, Nut Crops, and Grapevines at http://ipm.ucdavis.edu/PDF/PMG/fungicideefficacytiming.pdf
Vertebrate Pests. Treatments will vary depending upon rodent populations. Gophers in this study are managed with poison bait applied in the spring and fall using a hand bait applicator. The grower uses an ATV to check the stations. Trapping is used to control squirrels at a cost of $8.50/trap, which is included in shop tools. Squirrel traps are set from March through October. The grower uses an ATV to set 2.5 traps/acres. Rates and times for vertebrate control are estimated. Harvest. The almonds are mechanically shaken, mechanically swept and hand raked to the centers into windrows, then mechanically picked up and hauled to the huller. The harvest in this study is performed by a custom operator, with the grower providing the labor for hand raking missed nuts into the windrows. Almond harvest starts in August and goes through September.
2016 Almonds Costs and Returns Study Sacramento Valley UC Cooperative Extension-Ag Issues Center 8
Yields. Typical annual yields for almonds are measured in pounds of kernels (meats) per acre and are shown in Table C. Yields will vary by location, grower, year, and age of orchard. For this study, it is assumed the orchard will average 2,200 pounds per acre for the life of the orchard. Returns. In this study, the almond meats are sold for $2.50 per pound based on reported current returns. A range of returns and yields are shown in the Ranging Analysis in Table 6. Almond Hulls and By-Products. The almond hulls are high in fiber and are sold as a feed additive. Other by-products include shells, almond hash, huller dust, and press cakes, which all can be used as livestock feed. Wood for firewood, and wood chips for composting, from tree removal could be another source of income from the orchard. No revenues from any of these potential sources of income are included in this study. Assessment. The Almond Board of California (ABC) assesses all almonds commercially grown in the state to pay for almond promotions and research. The mandatory assessment is paid by processors and is not reflected in grower costs.
Pickup/ATV. The study assumes business use mileage of 100 minutes per acre per year for the pickup. The ATV is used for baiting ants and gophers and is included in those costs. ATV use at 50 minutes per acre of for checking the orchard, diseases and irrigation system is shown as an operation.
Labor, Equipment, and Interest
Labor. Hourly wages for workers are $14.00 for machine operators and $12.00 per hour non-machine labor. Adding 40 percent for the employer’s share of federal and state payroll taxes, workers compensation insurance, for nut crops (Code 0045), and other possible benefits gives the labor rates shown of $19.60 and $16.80 per hour for machine labor and non-machine labor, respectively. Workers’ compensation costs will vary among growers, but for this study, the cost is based upon the average industry final rate as of January 2016. Labor time for operations involving machinery is 20 percent higher than the equipment time to account for the extra labor involved in equipment set up, moving, maintenance, work breaks, and field repair. Equipment Operating Costs. Repair costs are based on purchase price, annual hours of use, total hours of life, and repair coefficients formulated by American Society of Agricultural Engineers (ASAE). Fuel and lubrication costs are also determined by ASAE equations based on maximum power takeoff (PTO) horsepower, and fuel type. Prices for on-farm delivery of diesel and gasoline are $2.49 and $2.77 per gallon, respectively. The costs are based on January 2016, Energy Information Administration (EIA), monthly data. The cost includes a 2.5 percent local sales tax on diesel fuel and 7.5 percent sales tax on gasoline. Gasoline also includes federal and state excise tax, which are refundable for on-farm use when filing your income tax. The fuel, lube, and repair cost per acre for each operation in Table 2 is determined by multiplying the total hourly operating cost in Table 7 for each piece of equipment used for the selected operation by the hours per acre. Tractor time is 10 percent higher than implement time for a given operation to account for setup, travel and down time.
Interest on Operating Capital. Interest on operating capital is based on cash operating costs and is calculated monthly until harvest at a nominal rate of 4.25 percent per year. A nominal interest rate is the typical market cost of borrowed funds. The interest cost of post-harvest operations is discounted back to the last harvest month using a negative interest charge. The rate will vary depending upon various factors, but the rate in this study is considered a typical lending rate by a farm-lending agency as of January 2016.

2016 Almonds Costs and Returns Study Sacramento Valley UC Cooperative Extension-Ag Issues Center 9
Risk. The risks associated with crop production should not be minimized. While this study makes every effort to model a production system based on typical, real world practices, it cannot fully represent financial, agronomic and market risks, which affect profitability and economic viability of almond production. Because of so many potential risk factors, effective risk management must combine specific tactics in a detailed manner, in various combinations for a sustainable operation.
Cash Overhead
Cash overhead consists of various cash expenses paid out during the year that are assigned to the whole farm and not to a particular operation. These costs include property taxes, interest on operating capital, office expense, liability and property insurance, sanitation services, and equipment repairs.
Property Taxes. Counties charge a base property tax rate of 1 percent on the assessed value of the property. In some counties, special assessment districts exist and charge additional taxes on property including equipment, buildings, and improvements. For this study, county taxes are calculated as 1 percent of the average value of the property.
Insurance. Insurance for farm investments varies depending on the assets included and the amount of coverage. Property Insurance. This provides coverage for property loss and is charged at 0.843 percent of the average value of the assets over their useful life. Liability Insurance. A standard farm liability insurance policy will help cover the expenses for which you become legally obligated to pay for bodily injury claims on your property and damages to another person’s property as a result of a covered accident. Common liability expenses covered under your policy include attorney fees and court costs, medical expenses for people injured on your property, injury or damage to another’s property. In this study, $792 is charged and covers the entire farm. Crop Insurance. This is available to Almond growers for any unavoidable loss of production, damage or poor quality resulting from adverse weather conditions such as cool wet weather, freeze, frost, hail, heat, rain, wind and damage from birds, drought, earthquakes and fire. Coverage levels are from 50-85 percent of the approved average yield as established by verifiable production records from the orchard. Actual insurance coverage is by unit, not by acre. A significant number of growers purchase crop insurance in this region. Due to variability in coverages, no level is specified in this study. The USDA Risk Management Agency, 2016 Crop Insurance Policies link: http://www.rma.usda.gov/policies/2016policy.html Office Expense. Office and business expenses are estimated at $60 per acre. These expenses include office supplies, communications, bookkeeping, accounting and legal fees. Environmental/Regulatory/Safety Training Costs. Various environmental fees are collected by the county and state. The fees will vary by county. For example there are fees assessed by the Air Resources Board (state agency) regulating air pollution, a Water Coalition Fee (local coalition), formerly called an Ag Waiver Fee for water discharges, and hazardous material storage fee (local coalition). The grower must also provide safety training, safety equipment, and maintain training records. For this study, a cost of $10.00 per acre is included.

2016 Almonds Costs and Returns Study Sacramento Valley UC Cooperative Extension-Ag Issues Center 10
Sanitation Services. Sanitation services provide one portable toilet and cost the farm $800 annually. The cost includes one double toilet unit with washbasin, delivery and 4 months of weekly service.
Management Salary. Wages for management are not included as a cash cost. Any return above total costs is considered a return to management. Investment Repairs. Annual maintenance is calculated as two percent of the purchase price.
Non-Cash Overhead
Non-cash overhead is calculated as the capital recovery cost for equipment and other farm investments. Capital Recovery Costs. Capital recovery cost is the annual depreciation and interest costs for a capital investment. It is the amount of money required each year to recover the difference between the purchase prices and salvage value (unrecovered capital). It is equivalent to the annual payment on a loan for the investment with the down payment equal to the discounted salvage value. This is a more complex method of calculating ownership costs than straight-line depreciation and opportunity costs, but more accurately represents the annual costs of ownership because it takes the time value of money into account (Boehlje and Eidman). The formula for the calculation of the annual capital recovery costs is ((Purchase Price – Salvage Value) x Capital Recovery Factor) + (Salvage Value x Interest Rate). Salvage Value. Salvage value is an estimate of the remaining value of an investment at the end of its useful life. For farm machinery (tractors and implements), the remaining value is a percentage of the new cost of the investment (Boehlje and Eidman). The percent remaining value is calculated from equations developed by the American Society of Agricultural Engineers (ASAE) based on equipment type and years of life. The life in years is estimated by dividing the wear out life, as given by ASAE by the annual hours of use in this operation. For other investments including irrigation systems, buildings, and miscellaneous equipment, the value at the end of its useful life is zero. The salvage value for land is the purchase price because land does not depreciate. The purchase price and salvage value for equipment and investments are shown in Table 7. Capital Recovery Factor. Capital recovery factor is the amortization factor or annual payment whose present value at compound interest is 1. The amortization factor is a table value that corresponds to the interest rate used and the life of the machine. Interest Rate. An interest rate of 3.25 percent is used to calculate capital recovery. The rate will vary depending upon loan amount and other lending agency conditions, but is the basic suggested rate by a farm-lending agency as of January 2016. Land. Crop or bare land values range from $13,000 to $28,000. The orchard site is assumed to be on previously farmed open agricultural ground and in this study is valued at $18,000 per acre. Establishment Cost. Costs to establish the orchard are used to determine the non-cash overhead expenses, capital recovery, and interest on investment for the production years. The establishment cost is the sum of cash costs for land preparation, planting, trees, production expenses, and cash overhead for growing almond trees through the third year less returns from production. The Accumulated Net Cash Cost in the third year shown in Table 1 represents the establishment cost per acre. For this study, this cost is $4,591 per acre or $459,100 for the 100-acre orchard. Establishment cost is amortized beginning in the fourth year over the remaining 22 years of production.
2016 Almonds Costs and Returns Study Sacramento Valley UC Cooperative Extension-Ag Issues Center 11
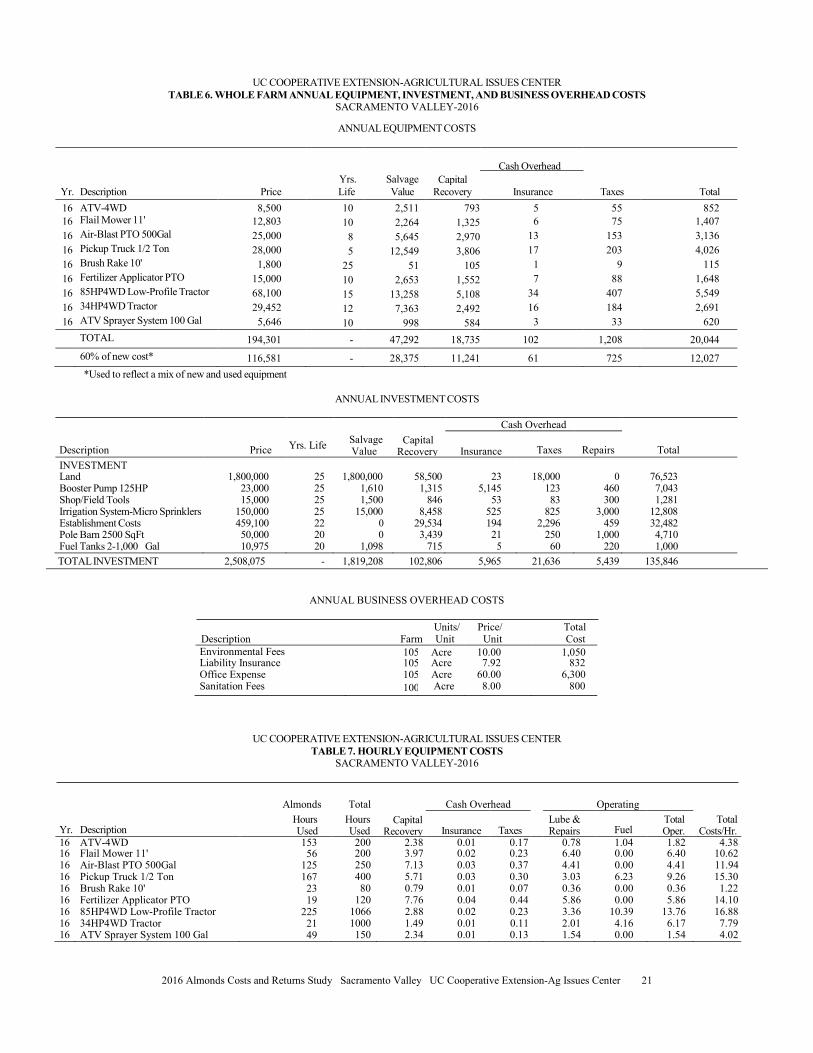
Tree Replacement. One or more trees per acre may die each year and are replaced in late winter. Costs in this study are basic costs that will vary with each orchard and type of tree loss. Ongoing tree replacement is included Cash Overhead at a rate of 0.10 percent per acre in investment repairs for Establishment costs. Irrigation System. The pump and well cost is based on one 75 horsepower electric pump lifting from a water level depth of 75 feet. The pump and 300-foot deep well, already existed on the site. The cost of the irrigation system is for the re-casing of the well and refurbishing the pump. The sprinkler system costs include the installation of new filtration and chemigation systems, buried main lines and micro sprinklers. A separate 125 HP booster pump, is used to pump the water through the filtration station out into the sprinkler system. The life of the irrigation system is estimated to be 25 years. An annual pump test is performed in January to monitor pumping level and efficiency (gallons/minute) at a cost of $200 for each pump. The irrigation system is considered an improvement and is shown in the non-cash overhead sections of the tables and the investment portion of Table 7. Building. The pole barn totals approximately 2,500 square feet and is used for equipment storage. The building is located on the grower owned land. Equipment. Farm equipment is purchased new or used, but the study shows the current purchase price for new equipment. The new purchase price is adjusted to 60 percent to indicate a mix of new and used equipment. Annual ownership costs for equipment and other investments are shown in Table 6. Equipment costs are composed of three parts: non-cash overhead, cash overhead, and operating costs. Both of the overhead factors have been discussed in previous sections. The operating costs consist of repairs, fuel, and lubrication and are discussed under operating costs. Shop/Field Tools. Includes shop tools/equipment, hand tools, and field tools such as pruning equipment, bait stations, rakes, and shovels. The frost protection alarm is also included in this cost. Fuel Tanks. Two 1,000-gallon fuel tanks, one for diesel and one for gasoline, are placed on stands in a cement containment meeting federal, state, and local regulations. Table Values. Due to rounding, the totals may be slightly different from the sum of the components.

2016 Almonds Costs and Returns Study Sacramento Valley UC Cooperative Extension-Ag Issues Center 12
REFERENCES American Society of Agricultural and Biological Engineers. (ASABE). July 2013. “American Society of Agricultural Engineers Standards Yearbook”. Russell H. Hahn and Evelyn E. Rosentreter (ed.). St. Joseph, MO. 41st edition, ANSI/ASAE S279_17.PDF. [email protected] Boehlje, Michael D., and Vernon R. Eidman. 1984. “Farm Management”. John Wiley and Sons. New York, New York. California Chapter of the American Society of Farm Managers and Rural Appraisers. 2015 “Trends in Agricultural Land & Lease Values”. American Society of Farm Managers and Rural Appraisers, Woodbridge, CA. www.calasfmra.com Energy Information Administration. Weekly Retail on Highway Diesel Prices-October 2015. http://www.eia.gov/petroleum/gasdiesel/ California State Board of Equalization. Fuel Tax Division Tax Rates. Internet accessed January 2016. http://www.boe.ca.gov/sptaxprog/spftdrates.htm California Department of Insurance. 2016 California Workers’ Compensation Rating Data for Selected Agricultural Classifications as of January 2016. California Department of Insurance, Rate Regulation Branch. http://www.insurance.ca.gov/0500-about-us/ University of California Statewide Integrated Pest Management Program. UC Pest Management Guidelines, Almonds. 2015. University of California, Davis, CA. http://www.ipm.ucdavis.edu Connell, Joe H., John P. Edstrom, Karen Klonsky, Richard Buchner, and Franz Niederholzer. "Sample Costs to Establish and Produce Almonds, Sacramento Valley." University of California, Cooperative Extension. Department of Agricultural and Resource Economics. Davis, CA. Home - Accessed February 23, 2016. http://coststudies.ucdavis.edu/en/current/. Micke, Warren C. Almond Production Manual. 3364, Oakland, Calif: University of California, Division of Agriculture and Natural Resources, 1996.

2016 Almonds Costs and Returns Study Sacramento Valley UC Cooperative Extension-Ag Issues Center 13
UC COOPERATIVE EXTENSION-AGRICULTURAL ISSUES CENTER Table 1. COSTS PER ACRE TO ESTABLISH AN ALMOND ORCHARD
SACRAMENTO VALLEY-2016
Cost Per Acre Year: 1st 2nd 3rd 4th 5th 6th Meat Pounds Per Acre @$2.50/lbs. 400 800 1,400 2,000
Pre-Plant: Tree Removal (50%) 375 Rip 4’ Depth/Root Removal (50%) 117 Disc & Roll 2x 50 Laser Leveling 70 Make Berms/Rows 30 Smooth Row Middles 30 Pests: Weeds – Strip Spray 34 TOTAL PRE-PLANT COSTS 706 Plant: Dip Roots/Plant/Top 1,162
Stake/Whitewash/Cartons 309 TOTAL PLANTING COSTS 1,471 Cultural: Irrigate: Pump Test 4 4 4 4 4 4 Irrigate: Water Analysis 1 1 1 1 1 1 Irrigate: Frost Protection 17 17 17 Irrigate 150 150 217 267 317 317 Irrigation Labor 24 24 35 46 54 54 Pollination: Hive Rental 90 180 360 450 Fertilize: Hand (15-15-15) 3x 112 Fertilize: UAN – 32, 3x 17 35 70 93 128 Fertilize: Zinc Sulfate (36%) 25 30 39 39 39 Fertilize: K2SO4 14 36 64 108 151 Fertilize: Leaf Sample (1/20 acres) 1 1 1 1 Fertilize: Hull Sample (1/25 acres) 1 1 1 1 Pests: Gophers – Bait 2x 8 7 7 7 7 7 Pests: Squirrels – Traps 6x 4 4 4 4 4 4 Pests: Weeds – Strip Spray 102 20 6 6 6 6 Pests: Weeds – Pre-Harvest Spray 42 42 42 42 Pests: Weeds – Mow Middles 13 8 21 21 21 21 Pests: Weeds – Dormant Spray 22 68 68 68 68 Pests: Insects (Yr.1 Hand, Yr.2 50% of ac., Yr.3+ alternate years) 11 32 107 90 Pests: Disease 64 136 142 155 PCA Service Fee 20 20 20 35 35 35 Prune: Summer Suckering 22 Prune: Dormant – Hand Crew 34 34 34 34 34 Prune: Push Prunings 17 17 17 17 17 Winter Sanitation 104 104 104 104 Pickup Truck Use 55 55 55 55 55 55 ATV Use 21 21 21 21 21 21 TOTAL CULTURAL COSTS 545 476 912 1,347 1,550 1,821

2016 Almonds Costs and Returns Study Sacramento Valley UC Cooperative Extension-Ag Issues Center 14
UC COOPERATIVE EXTENSION-AGRICULTURAL ISSUES CENTER Table 1. CONTINUED
SACRAMENTO VALLEY-2016
Cost per Acre Year 1st 2nd 3rd 4th 5th 6th Meat Pounds Per Acre @$2.50/lbs. 400 800 1,400 2,000 Harvest: Shake Trees 94 100 100 106 Sweep Nuts 38 38 38 56 Hand Rake/Blow Nuts 8 8 8 8 Pick up/Haul Nuts 38 38 38 56 Hull/Shell Nuts
20 40 70 100 TOTAL HARVEST COSTS 197 223 253 327 Interest On Operating Capital @ 4.25% 89 7 7 13 21 21 TOTAL OPERATING COSTS/ACRE 2,811 483 1,117 1,583 1,825 2,169 Cash Overhead Liability Insurance 8 8 8 8 8 8 Office Expense 60 60 60 60 60 60 Sanitation Fees SV 8 8 8 8 8 8 Environmental Fee 10 10 10 10 10 10 Property Taxes 194 194 194 218
218 218
Property Insurance 64 64 64 60 60 60 Investment Repairs 49 49 49 56 54 54
TOTAL CASH OVERHEAD COSTS 394 394 393 418 418 417 TOTAL CASH COSTS/ACRE 3,204 877 1,510 2,000 2,243 2,586 INCOME/ACRE FROM PRODUCTION 1,000 2,000 3,500 5,000 NET CASH COSTS/ACRE FOR THE YEAR 510 0 PROFIT/ACRE ABOVE CASH COSTS 0 1,257 2,414 ACCUMULATED NET CASH COSTS/ACRE 3,204 4,081 4,591 4,591 3,334 920 NON-CASH OVERHEAD:
Pole Barn 2,500 sq. ft. 33 33 33 33 33 33 Fuel Tanks 2-1,000 Gal 7 7 7 7 7 7 Booster Pump 125HP 13 13 13 13 13 13 Shop/Field Tools 8 8 8 8 8 8 Irrigation System-Micro Sprinklers 85 85 85 85 85 85 Land 585 585 585 585 585 585 Establishment Costs 295 295 295 Equipment 17 20 26 31 29 34 TOTAL NON-CASH OVERHEAD COST/ACRE 747 752 756 1,057 1,154 1,060 TOTAL COST/ACRE FOR THE YEAR 3,952 1,629 2,267 3,057 3,397 3,646 INCOME/ACRE FROM PRODUCTION 1,000 2,000 3,500 5,000 TOTAL NET COST/ACRE FOR THE YEAR 1,267 1,057 NET PROFIT/ACRE ABOVE TOTAL COSTS 103 1,354 TOTAL ACCUMULATED NET COST/ACRE 3,952 5,581 6,848 7,905 7,802 6,448

2016 Almonds Costs and Returns Study Sacramento Valley UC Cooperative Extension-Ag Issues Center 15
UC COOPERATIVE EXTENSION-AGRICULTURAL ISSUES CENTER Table 2. COSTS PER ACRE TO PRODUCE ALMONDS
SACRAMENTO VALLEY-2016
Cash and Labor Costs per Acre
Operation Equipment
Time (Hrs/A) Labor Cost Fuel Lube
& Repairs Material
Cost Custom/
Rent Total Cost Your Cost Cultural: Pests: Weeds - Dormant Spray 0.16 4 0 0 64 0 68 Pests: Weeds - Mow Middles 5x 0.47 11 5 5 0 0 21 Pollination 0.00 0 0 0 0 450 450 Irrigation: Frost Protection 0.00 3 0 0 17 0 19 Irrigation: Pump Test 0.00 0 0 0 0 4 4 Irrigation: Water Analysis 0.00 0 0 0 0 1 1 Pests: Disease/Insects 3x 0.75 18 9 6 123 0 155 Pests: Squirrel - Traps 6x 0.15 4 0 0 0 0 4 Fertilize: UAN-32 3x 0.00 0 0 0 128 0 128 Pests: Gophers - Bait 2x 0.05 1 0 0 6 0 7 Irrigate 0.00 51 0 0 317 0 368 Pests: Weeds - Strip Spray 0.16 4 0 0 2 0 6 Fertilize: Leaf Sample (1/20ac) 0.00 0 0 0 0 1 1 Pests: Insects 0.25 6 3 2 96 0 107 Pests: Weeds - Pre-Harvest 0.16 4 0 0 38 0 42 Fertilize: Hull Sample (1/25ac) 0.00 0 0 0 0 1 1 Fertilize: K2SO4 0.19 4 1 2 158 0 165 Fertilize: Zinc Sulfate (36%) 0.25 6 3 2 29 0 39 Winter Sanitation 0.09 2 1 1 0 100 104 Prune: Dormant (Alternate Years) 0.00 34 0 0 0 0 34 Prune: Push Prunings (Alternate Rows) 0.23 14 3 1 0 0 17 Pickup Truck Use 1.67 39 10 5 0 0 55 ATV Use 0.83 20 1 1 0 0 21 PCA Fee 0.00 0 0 0 0 35 35 TOTAL CULTURAL COSTS 5.42 223 36 25 976 592 1,852
Harvest: Shake-Trees 0.00 0 0 0 0 125 125 Hand Rake/Blow Nuts 0.00 8 0 0 0 0 8 Sweep Windrows 0.00 0 0 0 0 75 75 Pickup/Haul Nuts 0.00 0 0 0 0 75 75 Hull/Shell Nuts 0.00 0 0 0 0 110 110
TOTAL HARVEST COSTS 0.00 8 0 0 0 385 393
Interest on Operating Capital at 4.25% 22
TOTAL OPERATING COSTS/ACRE 5.42 232 36 25 976 977 2,267

2016 Almonds Costs and Returns Study Sacramento Valley UC Cooperative Extension-Ag Issues Center 16
UC COOPERATIVE EXTENSION-AGRICULTURAL ISSUES CENTER Table 2. CONTINUED
SACRAMENTO VALLEY-2016
Cash and Labor Costs per Acre
Operation Equipment
Time (Hrs/A) Labor Cost Fuel Lube& Repairs
Material Cost
Custom/ Rent Total Cost Your Cost
CASH OVERHEAD: Environmental Fees 10 Liability Insurance 8 Office Expense 60 Sanitation Fee SV 8 Property Taxes 218 Property Insurance 60 Investment Repairs 54
TOTAL CASH OVERHEAD COSTS/ACRE 417
TOTAL CASH COSTS/ACRE 2,685
NON-CASH OVERHEAD: Per Producing Annual Cost Acre Capital Recovery
Fuel Tanks 2 – 1,000 Gal 105 7 7 Land 18,000 585 585 Booster Pump 125HP 230 13 13 Shop/Field Tools 143 8 8 Irrigation System – Micro Sprinklers 1,500 85 85 Establishment Costs 4,591 295 295 Pole Barn 2,500 sqft 476 33 33 Equipment 324 34 34
TOTAL NON-CASH OVERHEAD COSTS 25,368 1,060 1,060
TOTAL COSTS/ACRE 3,744

2016 Almonds Costs and Returns Study Sacramento Valley UC Cooperative Extension-Ag Issues Center 17
UC COOPERATIVE EXTENSION-AGRICULTURAL ISSUES CENTER TABLE 3. COSTS AND RETURNS PER ACRE TO PRODUCE ALMONDS
SACRAMENTO VALLEY-2016
Quantity/ Acre Unit
Price or Cost/Unit
Value or Cost/Acre Your Cost
GROSS RETURNS Production 2,200 Lb 2.50 5,500 TOTAL GROSS RETURNS 2,200 Lb 5,500
OPERATING COSTS Herbicide: 104
Matrix SG 2.00 Oz 6.37 13 Alion 3.50 FlOz 13.84 48 Roundup PowerMax 2.75 Pint 2.75 8 Rely 280 2.50 Pint 13.92 35
Fungicide: 101 Vanguard WG 10.00 Oz 5.34 53 Bravo-Weatherstik 32.00 FlOz 0.25 8 Ziram WDG76 8.00 Lb 5.00 40
Insecticide: 117 Dipel Pro DF 2.00 Lb 10.62 21 Altacor 4.00 FlOz 11.25 45 Zeal 3.00 Oz 17.00 51
Rodenticide: 6 Vertebrate Pest Bait 3.00 Lb 1.92 6
Custom: 977 Pollination Fee 2.50 Hive 180.00 450 Irrigation Pump Test 0.02 Each 200.00 4 Irrigation Water Analysis 0.02 Each 50.00 1 Leaf Analysis 0.05 Each 20.00 1 Shake Trees 1.50 Hour 125.00 188 Sweep 1.50 Hour 75.00 113 Pickup & Haul Nuts 1.00 Hour 75.00 75 Hull/Shell Nuts 2200.00 Lb 0.05 110 Hull Analysis 0.04 Each 20.00 1 PCA/CCA Fee (Prod Yrs.) 1.00 Acre 35.00 35
Irrigation: 333 Water-Pumped 40.00 AcIn 8.33 333
Fertilizer: 315 UAN32 (32-0-0) 220.00 Lb N 0.58 128 Potassium Sulfate-K2SO4 440.00 Lb 0.36 158 Zinc Sulfate 36% 30.00 Lb 0.95 29
Labor 232 Equipment Operator Labor 6.51 hrs 19.60 128 Irrigation Labor 3.20 hrs 16.80 54 Non-Machine Labor 0.50 hrs 16.80 8 Pruning Labor 2.50 hrs 16.80 42
Machinery 61 Fuel-Gas 0.57 gal 2.77 2 Fuel-Diesel 13.89 gal 2.49 35 Lube 5 Machinery Repair 20
Interest on Operating Capital @ 4.25% 23
TOTAL OPERATING COSTS/ACRE 2,267
TOTAL OPERATING COSTS/LB 1.03
NET RETURNS ABOVE OPERATING COSTS 3,233

2016 Almonds Costs and Returns Study Sacramento Valley UC Cooperative Extension-Ag Issues Center 18
UC COOPERATIVE EXTENSION-AGRICULTURAL ISSUES CENTER TABLE 3. CONTINUED
SACRAMENTO VALLEY-2016
Quantity/ Acre
Unit
Price or Cost/Unit
Value or Cost/Acre
Your Cost
CASH OVERHEAD COSTS Environmental Fees 10 Liability Insurance 8 Office Expense 60 Sanitation Fee SV 8 Property Taxes 218 Property Insurance 60 Investment Repairs 54 TOTAL CASH OVERHEAD COSTS/ACRE 417 TOTAL CASH OVERHEAD COSTS/LB 0.19 TOTAL CASH COSTS/ACRE 2,685 TOTAL CASH COSTS/LB 1.22 NET RETURNS ABOVE CASH COSTS 2,815 NON-CASH OVERHEAD COSTS (Capital Recovery) Land 585 Booster Pump 125HP 13 Shop/Field Tools 8 Irrigation System-Micro Sprinklers 85 Establishment Costs 295 Pole Barn 2500 sqft 33 Fuel Tanks 2-1,000 Gal 7 Equipment 34 TOTAL NON-CASH OVERHEAD COSTS/ACRE 1,060 TOTAL NON-CASH OVERHEAD COSTS/LB 0.48 TOTAL COST/ACRE 3,744 TOTAL COST/LB 1.70 NET RETURNS ABOVE TOTAL COST 1,756
2016 Almonds Costs and Returns Study Sacramento Valley UC Cooperative Extension-Ag Issues Center 19
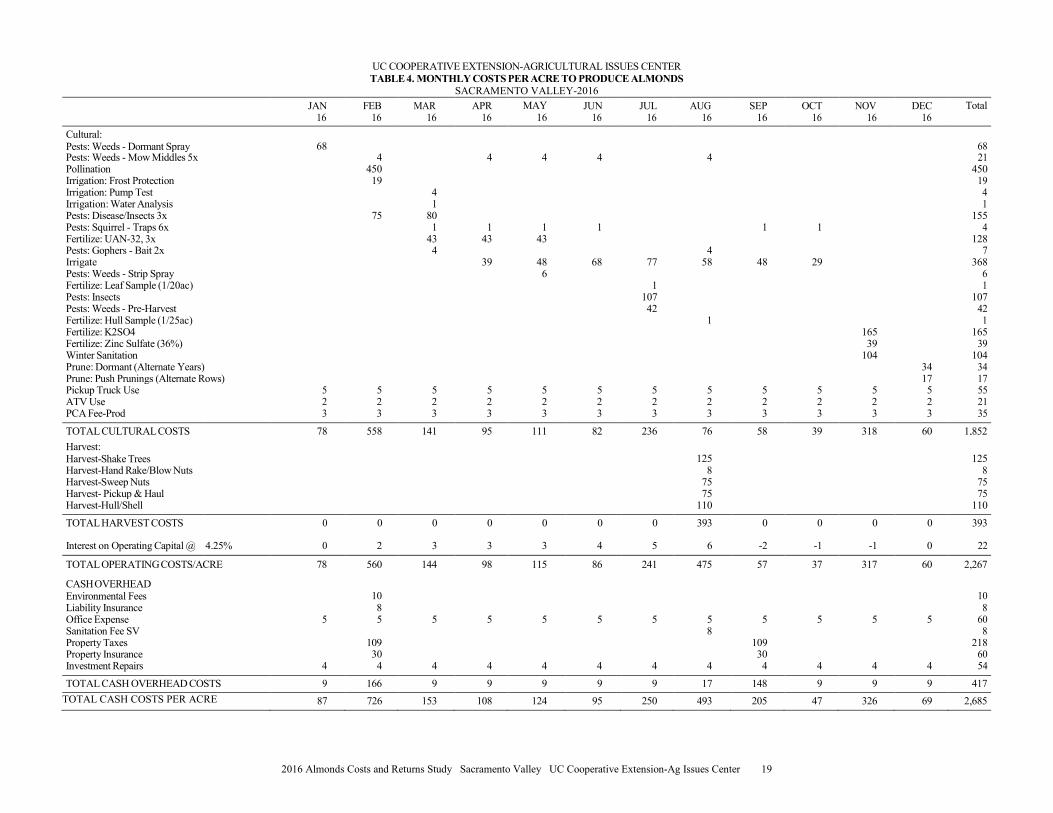
UC COOPERATIVE EXTENSION-AGRICULTURAL ISSUES CENTER TABLE 4. MONTHLY COSTS PER ACRE TO PRODUCE ALMONDS
SACRAMENTO VALLEY-2016 JAN
16 FEB
16 MAR
16 APR
16 MAY
16 JUN
16 JUL
16 AUG
16 SEP
16 OCT
16 NOV
16 DEC
16 Total
Cultural: Pests: Weeds - Dormant Spray
68
68
Pests: Weeds - Mow Middles 5x 4 4 4 4 4 21 Pollination 450 450 Irrigation: Frost Protection 19 19 Irrigation: Pump Test 4 4 Irrigation: Water Analysis 1 1 Pests: Disease/Insects 3x 75 80 155 Pests: Squirrel - Traps 6x 1 1 1 1 1 1 4 Fertilize: UAN-32, 3x 43 43 43 128 Pests: Gophers - Bait 2x 4 4 7 Irrigate 39 48 68 77 58 48 29 368 Pests: Weeds - Strip Spray 6 6 Fertilize: Leaf Sample (1/20ac) 1 1 Pests: Insects 107 107 Pests: Weeds - Pre-Harvest 42 42 Fertilize: Hull Sample (1/25ac) 1 1 Fertilize: K2SO4 165 165 Fertilize: Zinc Sulfate (36%) 39 39 Winter Sanitation 104 104 Prune: Dormant (Alternate Years) 34 34 Prune: Push Prunings (Alternate Rows) 17 17 Pickup Truck Use 5 5 5 5 5 5 5 5 5 5 5 5 55 ATV Use 2 2 2 2 2 2 2 2 2 2 2 2 21 PCA Fee-Prod 3 3 3 3 3 3 3 3 3 3 3 3 35
TOTAL CULTURAL COSTS 78 558 141 95 111 82 236 76 58 39 318 60 1,852 Harvest: Harvest-Shake Trees
125
125
Harvest-Hand Rake/Blow Nuts 8 8 Harvest-Sweep Nuts 75 75 Harvest- Pickup & Haul 75 75 Harvest-Hull/Shell 110 110
TOTAL HARVEST COSTS 0 0 0 0 0 0 0 393 0 0 0 0 393
Interest on Operating Capital @ 4.25% 0 2 3 3 3 4 5 6 -2 -1 -1 0 22
TOTAL OPERATING COSTS/ACRE 78 560 144 98 115 86 241 475 57 37 317 60 2,267
CASH OVERHEAD Environmental Fees
10
10
Liability Insurance 8 8 Office Expense 5 5 5 5 5 5 5 5 5 5 5 5 60 Sanitation Fee SV 8 8 Property Taxes 109 109 218 Property Insurance 30 30 60 Investment Repairs 4 4 4 4 4 4 4 4 4 4 4 4 54
TOTAL CASH OVERHEAD COSTS 9 166 9 9 9 9 9 17 148 9 9 9 417 TOTAL CASH COSTS PER ACRE
87 726 153 108 124 95 250 493 205 47 326 69 2,685

2016 Almonds Costs and Returns Study Sacramento Valley UC Cooperative Extension-Ag Issues Center 20
UC COOPERATIVE EXTENSION-AGRICULTURAL ISSUES CENTER
TABLE 5. RANGING ANALYSIS SACRAMENTO VALLEY-2016
COSTS PER ACRE AT VARYING YIELDS TO PRODUCE ALMONDS
YIELD (LBS.)
1,000.00
1,400.00
1,800.00
2,200.00
2,600.00
3,000.00
3,400.00 OPERATING COSTS/ACRE: Cultural
1,852
1,852
1,852
1,852
1,852
1,852
1,852
Harvest 178 251 322 393 464 535 609 Interest on Operating Capital @ 4.25% 21.02 21.28 21.53 21.78 22.03 22.28 22.54
TOTAL OPERATING COSTS/ACRE 2,051 2,125 2,196 2,267 2,339 2,410 2,484 TOTAL OPERATING COSTS/LB 2.05 1.52 1.22 1.03 0.90 0.80 0.73
CASH OVERHEAD COSTS/ACRE 417 417 417 417 417 417 417 TOTAL CASH COSTS/ACRE 2,468 2,542 2,613 2,685 2,756 2,827 2,901 TOTAL CASH COSTS/LB 2.47 1.82 1.45 1.22 1.06 0.94 0.85
NON-CASH OVERHEAD COSTS/ACRE 1,060 1,060 1,060 1,060 1,060 1,060 1,060 TOTAL COSTS/ACRE 3,527 3,602 3,673 3,744 3,815 3,887 3,961 TOTAL COSTS/LB 3.53 2.57 2.04 1.70 1.47 1.30 1.16
Net Return per Acre above Operating Costs for Almonds
PRICE ($/lb )
YIELD (lbs/acre)
Production
1000.00
1400.00
1800.00
2200.00
2600.00
3000.00
3400.00
1.00
-1,051
-725
-396
-67
261
590
916
1.50 -551 -25 504 1,033 1,561 2,090 2,616 2.00 -51 675 1,404 2,133 2,861 3,590 4,316 2.50 449 1,375 2,304 3,233 4,161 5,090 6,016 3.00 949 2,075 3,204 4,333 5,461 6,590 7,716 3.50 1,449 2,775 4,104 5,433 6,761 8,090 9,416 4.00 1,949 3,475 5,004 6,533 8,061 9,590 11,116
Net Return per Acre above Cash Costs for Almonds
PRICE ($/lb )
YIELD (lbs /acre)
Production
1000.00
1400.00
1800.00
2200.00
2600.00
3000.00
3400.00
1.00
-1,468
-1,142
-813
-485
-156
173
499
1.50 -968 -442 87 615 1,144 1,673 2,199 2.00 -468 258 987 1,715 2,444 3,173 3,899 2.50 32 958 1,887 2,815 3,744 4,673 5,599 3.00 532 1,658 2,787 3,915 5,044 6,173 7,299 3.50 1,032 2,358 3,687 5,015 6,344 7,673 8,999 4.00 1,532 3,058 4,587 6,115 7,644 9,173 10,699
Net Return per Acre above Total Costs for Almonds
PRICE ($/lb )
YIELD (lbs /acre)
Production
1000.00
1400.00
1800.00
2200.00
2600.00
3000.00
3400.00
1.00
-2,527
-2,202
-1,873
-1,544
-1,215
-887
-561
1.50 -2,027 -1,502 -973 -444 85 613 1,139 2.00 -1,527 -802 -73 656 1,385 2,113 2,839 2.50 -1,027 -102 827 1,756 2,685 3,613 4,539 3.00 -527 598 1,727 2,856 3,985 5,113 6,239 3.50 -27 1,298 2,627 3,956 5,285 6,613 7,939 4.00 473 1,998 3,527 5,056 6,585 8,113 9,639
2016 Almonds Costs and Returns Study Sacramento Valley UC Cooperative Extension-Ag Issues Center 21
UC COOPERATIVE EXTENSION-AGRICULTURAL ISSUES CENTER TABLE 6. WHOLE FARM ANNUAL EQUIPMENT, INVESTMENT, AND BUSINESS OVERHEAD COSTS
SACRAMENTO VALLEY-2016
ANNUAL EQUIPMENT COSTS
Cash Overhead
Yrs. Salvage Capital Yr. Description Price Life Value Recovery Insurance Taxes Total 16 ATV-4WD 8,500 10 2,511 793 5 55 852 16 Flail Mower 11' 12,803 10 2,264 1,325 6 75 1,407 16 Air-Blast PTO 500Gal 25,000 8 5,645 2,970 13 153 3,136 16 Pickup Truck 1/2 Ton 28,000 5 12,549 3,806 17 203 4,026 16 Brush Rake 10' 1,800 25 51 105 1 9 115 16 Fertilizer Applicator PTO 15,000 10 2,653 1,552 7 88 1,648 16 85HP4WD Low-Profile Tractor 68,100 15 13,258 5,108 34 407 5,549 16 34HP4WD Tractor 29,452 12 7,363 2,492 16 184 2,691 16 ATV Sprayer System 100 Gal 5,646 10 998 584 3 33 620
TOTAL 194,301 - 47,292 18,735 102 1,208 20,044
60% of new cost* 116,581 - 28,375 11,241 61 725 12,027 *Used to reflect a mix of new and used equipment
ANNUAL INVESTMENT COSTS
Cash Overhead Description
Price Yrs. Life Salvage
Value Capital
Recovery Insurance
Taxes
Repairs
Total
INVESTMENT Land 1,800,000 25 1,800,000 58,500 23 18,000 0 76,523 Booster Pump 125HP 23,000 25 1,610 1,315 5,145 123 460 7,043 Shop/Field Tools 15,000 25 1,500 846 53 83 300 1,281 Irrigation System-Micro Sprinklers 150,000 25 15,000 8,458 525 825 3,000 12,808 Establishment Costs 459,100 22 0 29,534 194 2,296 459 32,482 Pole Barn 2500 SqFt 50,000 20 0 3,439 21 250 1,000 4,710 Fuel Tanks 2-1,000 Gal 10,975 20 1,098 715 5 60 220 1,000
TOTAL INVESTMENT 2,508,075 - 1,819,208 102,806 5,965 21,636 5,439 135,846
ANNUAL BUSINESS OVERHEAD COSTS
Units/ Price/ Total
Description Farm Unit Unit Cost Environmental Fees 105 Acre 10.00 1,050 Liability Insurance 105 Acre 7.92 832 Office Expense 105 Acre 60.00 6,300 Sanitation Fees 100 Acre 8.00 800
UC COOPERATIVE EXTENSION-AGRICULTURAL ISSUES CENTER TABLE 7. HOURLY EQUIPMENT COSTS
SACRAMENTO VALLEY-2016
Almonds Total Cash Overhead Operating Yr.
Description
Hours Used
Hours Used
Capital Recovery Insurance
Taxes
Lube & Repairs
Fuel
Total Oper.
Total Costs/Hr.
16 ATV-4WD 153 200 2.38 0.01 0.17 0.78 1.04 1.82 4.38 16 Flail Mower 11' 56 200 3.97 0.02 0.23 6.40 0.00 6.40 10.62 16 Air-Blast PTO 500Gal 125 250 7.13 0.03 0.37 4.41 0.00 4.41 11.94 16 Pickup Truck 1/2 Ton 167 400 5.71 0.03 0.30 3.03 6.23 9.26 15.30 16 Brush Rake 10' 23 80 0.79 0.01 0.07 0.36 0.00 0.36 1.22 16 Fertilizer Applicator PTO 19 120 7.76 0.04 0.44 5.86 0.00 5.86 14.10 16 85HP4WD Low-Profile Tractor 225 1066 2.88 0.02 0.23 3.36 10.39 13.76 16.88 16 34HP4WD Tractor 21 1000 1.49 0.01 0.11 2.01 4.16 6.17 7.79 16 ATV Sprayer System 100 Gal 49 150 2.34 0.01 0.13 1.54 0.00 1.54 4.02

2016 Almonds Costs and Returns Study Sacramento Valley UC Cooperative Extension-Ag Issues Center 22
UC COOPERATIVE EXTENSION-AGRICULTURAL ISSUES CENTER TABLE 8. OPERATIONS WITH EQUIPMENT & MATERIALS
SACRAMENTO VALLEY-2016 Operation
Operation Month
Tractor Labor Type/ Material Rate/ acre Unit
Pests: Weeds - Dormant Jan ATV-4WD Equipment Operator Labor 0.20 hour Matrix SG 2.00 Oz ATV Sprayer System
Alion 3.50 FlOz
Roundup PowerMax 1.00 Pint Pests: Weeds - Mow Feb - Aug 85HP4WD Tractor Equipment Operator Labor 0.11 (5x) hour Pollination Feb Pollination Fee 2.50 Hive Irrigation: Frost Protect Feb Irrigation Labor 0.16 hour
Water-Pumped 2.00 AcIn Irrigation: Pump Test Mar Irrigation Pump Test 0.02 Each Irrigation: Water Analysis Mar Irrigation Water Analysis 0.02 Each Pests: Disease/Insect Feb 85HP4WD Tractor Equipment Operator Labor 0.30 hour
Vanguard WG 10.00 Oz Dipel Pro DF 1.00 Lb Mar 85HP4WD Tractor Equipment Operator Labor 0.30 hour Bravo-Weatherstik 32.00 FlOz Mar 85HP4WD Tractor Equipment Operator Labor 0.30 hour Ziram WDG76 8.00 Lb Dipel Pro DF 1.00 Lb Pests: Squirrel - Traps Mar - Oct ATV-4WD Equipment Operator Labor 0.03 (6x) hour Fertilize: UAN-32 3x Mar - May UAN32 (32-0-0) 73.34 (3x) Lb N Pests: Gophers - Bait Mar & Aug ATV-4WD Equipment Operator Labor 0.03 (2x) hour
Vertebrate Pest Bait 1.50 (2x) Lb Irrigate Apr Irrigation Labor 0.32 hour
Water-Pumped 4.00 AcIn May Irrigation Labor 0.40 hour Water-Pumped 5.00 AcIn June Irrigation Labor 0.56 hour Water-Pumped 7.00 AcIn July Irrigation Labor 0.64 hour Water-Pumped 8.00 AcIn Aug Irrigation Labor 0.48 hour Water-Pumped 6.00 AcIn Sept Irrigation Labor 0.40 hour Water-Pumped 5.00 AcIn Oct Irrigation Labor 0.24 hour Water-Pumped 3.00 AcIn Pests: Weeds, Strip Spray May ATV-4WD Equipment Operator Labor 0.20 hour
Roundup PowerMax 0.75 Pint Fertilize: Leaf Sample July Leaf Analysis 0.05 Each Pests: Insects July 85HP4WD Tractor Equipment Operator Labor 0.30 hour
Altacor 4.00 FlOz Zeal 3.00 Oz Pests: Weeds, Pre-Harvest July ATV-4WD Equipment Operator Labor 0.20 hour
Roundup PowerMax 1.00 Pint ATV Sprayer System
Rely 280 2.50 Pint
Fertilize: Hull Sample Aug Hull Analysis 0.04 Each Fertilize: K2SO4 Nov 34HP4WD Tractor Equipment Operator Labor 0.22 hour
Potassium Sulfate-K2SO4 440.00 Lb Fertilize: Zinc Sulfate Nov 85HP4WD Tractor Equipment Operator Labor 0.30 hour
Zinc Sulfate 36% 30.00 Lb Winter Sanitation Nov 85HP4WD Tractor Equipment Operator Labor 0.11 hour
Shake Trees 0.50 Hour Sweep 0.50 Hour Prune: Dormant (Alt.) Dec Pruning Labor 2.00 hours Prune: Push Prunings Dec 85HP4WD Tractor Pruning Labor 0.50 hour Pickup Truck Use Dec Pickup Truck 1/2 Ton Equipment Operator Labor 2.00 hours ATV Use Dec ATV-4WD Equipment Operator Labor 1.00 hour PCA Fee Dec PCA/CCA Fee (Prod Yrs.) 1.00 Acre Harvest-Shake Trees Aug Shake Trees 1.00 Hour Harvest-Hand Rake Aug Non-Machine Labor 0.50 hour Harvest-Sweep Nuts Aug Sweep 1.00 Hour Harvest- Pickup & Haul Aug Pickup & Haul Nuts SV 1.00 Hour Harvest-Hull/Shell Aug Hull/Shell Nuts 2,200.00 Lb