salix spp. as a biomass crop: investigating its potential
TRANSCRIPT

58
SALIX SPP. AS A BIOMASS CROP: INVESTIGATING ITS POTENTIAL ON MINED LANDS AND THE USE OF BIOCHAR AS A
SOIL AMENDMENT1
H.A. Nobert2, D.W. McGill, S.T. Grushecky, J.G. Skousen, and J.L Schuler
Abstract: Rising energy demands and costs have increased the need to develop alternate sources and markets. Biomass plantations are proposed as part of the
renewable energy solution. In West Virginia, over 50,000 acres of previously mined and reclaimed land are suitable for cultivation with bioenergy crops,
including woody plants. The feasibility of growing shrub willow (Salix spp.) for the dual purpose of restoration and biomass crop production was assessed on reclaimed surface mines and fallow agricultural land in West Virginia. Replicated
field trials were established and monitored over one growing season at four sites throughout the state. Within the field trials, biochar was tested as a soil
amendment to mitigate soil quality issues associated with mine soils and fallow agricultural land. To characterize Salix spp. potential as a feedstock, proximate analysis, ultimate analysis, and heating value were measured. Wood properties for
one-year-old material were compared with the specifications required for woody biomass combustion or ethanol production. Relative to these specifications, ash
content was slightly higher (2.7% vs. 1.0%) as was nitrogen (0.98% vs. 0.35%), whereas volatile matter was lower (79.8% vs. 82.0%). Based on these standards, Salix spp. grown on reclaimed surface mines or fallow agricultural sites appears
to be a suitable biomass feedstock for combustion and biofuel production. Biochar improved growth 80.7% and yield 72.4% compared to non-amended
plots. Improved growth and yield in biochar-amended plots in the first year of growth gave willow saplings a competitive advantage over weeds. Additionally, biochar has shown long-term positive impacts in field studies, and improved
growth and yield during the first year may prove to give higher yields in the long term.
Additional Key Words: mine reclamation, shrub willow, SRWC
________________________________
1 This paper was presented as a poster paper at the 2016 National Meeting of the American
Society of Mining and Reclamation, Spokane, WA Reclaiming the West June 4-9, 2016. R.I. Barnhisel (Ed.) Published by ASMR, 1305 Weathervane Drive, Champaign, IL 61821.
2 Heather A. Nobert graduated from West Virginia University, Morgantown, WV 26505 with a Master of Science in Forestry in December 2015; Dave McGill is a Forest Resources Professor and Extension Specialist at West Virginia University; Shawn Grushecky is a Research
Associate and Assistant Director of the Appalachian Hardwood Center in Morgantown, WV; Jeffrey Skousen is a Professor of Soil Science and Land Reclamation Extension Specialist at
West Virginia University; and Jamie Schuler is an Assistant Professor of Silviculture at West Virginia University. Journal American Society of Mining and Reclamation, 2016 Volume 5, Issue 2 pp 58-76
DOI: 10.21000/JASMR16020058
59
Introduction
At least 200,000 acres of land in West Virginia have been strip/surface mined and at least
50,000 acres of those are suitable for reclamation with cultivation biomass crops (Grushecky et
al., 2013). Biomass/bioenergy is derived from living or recently living biological material.
Short rotation woody crops (SRWCs) are a type of biomass crop that have been identified as
suitable for strip mine reclamation. West Virginia has set a standard of 25% renewable energy
from a variety of sources, including biomass, by 2025 (US Department of Energy, 2013).
Biomass, specifically SRWCs, grown on previously mined lands would help achieve the goals
set forth by legislation regulating coal mining and reclamation with environmental and economic
benefits.
Fallow fields and abandoned mine lands are often referred to as marginal lands. These lands
usually have limitations that produce lower yields and/or poorer quality crops, making them
economically marginal for food production. Limitations can be related to site and soil conditions
such as slope, moisture, compaction, rockiness, pH, nutrient deficiencies, salinity, etc. (Wicke,
2011). Growing bioenergy crops on marginal lands is desirable because the prime agricultural
lands can, and should be, used for food crops rather than growing bioenergy crops. Additionally,
there are economic benefits to landowners who choose to grow bioenergy crops on their
marginal lands.
Shrub willows, a type of SRWC, have the potential to improve land value and quality
including soil structure, pH, and nutrient cycling. Furthermore, biochar, a stable form of carbon,
has been proposed as a soil amendment to improve soil structure and fertility of marginal lands.
Its capacity to enhance plant growth and sequester carbon in the soil as a long-term sink has been
demonstrated in several field studies (Kwapinski et al., 2010; Lehmann et al., 2006; Major et al.,
2010). It retains and releases nutrients that enhance plant growth and yield, increasing soil
quality by adding carbon which is resistant to microbial degradation, and increasing water
holding capacity (Kwapinski et al., 2010). Therefore, the use of biochar on marginal lands can
improve yield of bioenergy crops grown on these lands.
Little work has been done to date on shrub willow as a bioenergy crop in West Virginia.
Similarly, there is a lack of literature on impacts of biochar on bioenergy crops. Given the
information gap on these topics, a project was designed and carried out to expand the knowledge

60
Figure 1. Site map of Salix spp. field trials locations in West
Virginia, USA.
base for biochar and shrub willow bioenergy development in the state. The project objectives
were:
Objective I: Determine the yield differences between shrub willow cultivars on marginal
lands through mortality, growth, and yield analysis.
Objective II: Determine the effects of biochar as a soil amendment to shrub willow growth,
yield, and quality as a bioenergy crop.
Methods
Site Description
Trials were established in Morgantown, WV at the West Virginia University farm
(39°39'29.55"N, 79°55'50.17"W), in Preston County at the Squires Creek No. 1 Mine
(39°28'41.03"N, 79°46'59.81"W), in Greenbrier County at the Buck Lilly Surface Mine (38°
1'7.31"N, 80°35'23.05"W), and in Mason County at the West Virginia Division of Forestry
Clements State Tree Nursery (38°57'39.83"N, 82° 5'28.58"W) (Fig. 1). Mean annual
precipitation is similar; 40-50 inches in Morgantown, in Preston Co., and in Mason Co., while
mean annual precipitation is 50-
60 inches in Greenbrier Co.
Likewise, Morgantown, Preston
Co., and Mason Co. are all
located within USDA Hardiness
Zone 6a, while Greenbrier Co.
is in the USDA Hardiness Zone
5b due to its colder winter
temperatures and higher
elevation. A full analysis of soil
properties prior to the
application of biochar is
available in Table 1. The
Morgantown location was
historically farmland and has a severe erosion hazard. Squire’s Creek was historically mined and
has been abandoned and sealed since 24 April 1986 and there is a severe erosion hazard. The
61
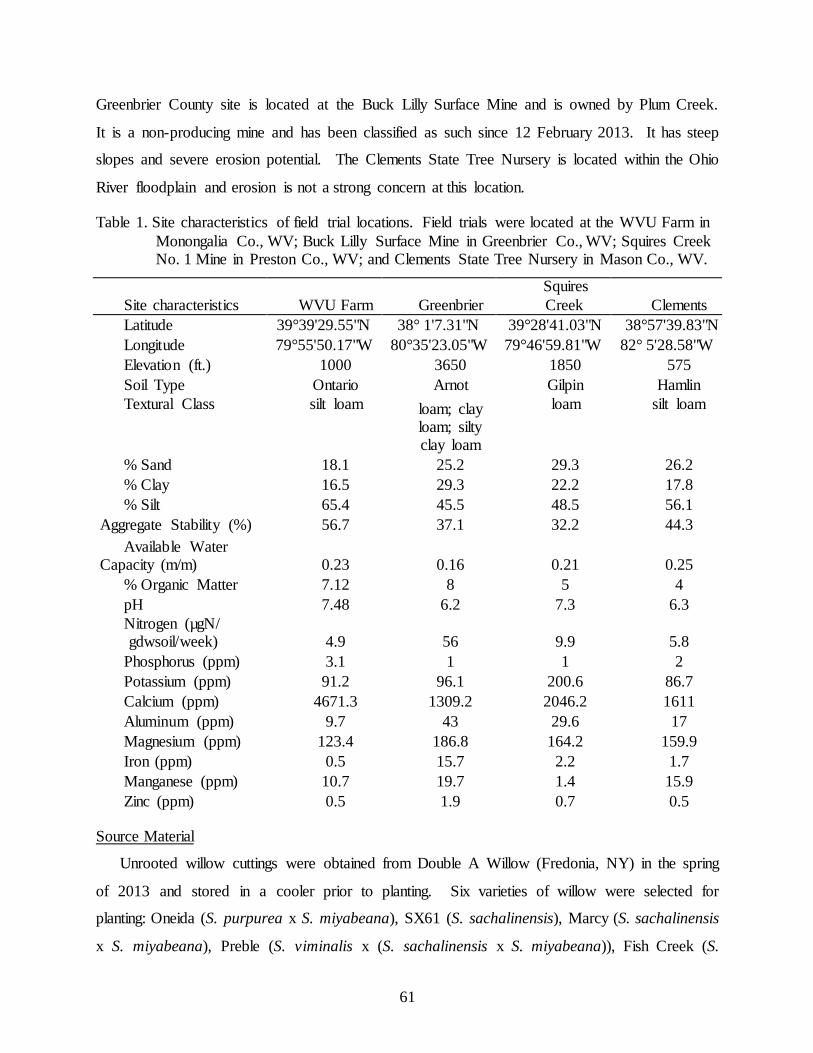
Greenbrier County site is located at the Buck Lilly Surface Mine and is owned by Plum Creek.
It is a non-producing mine and has been classified as such since 12 February 2013. It has steep
slopes and severe erosion potential. The Clements State Tree Nursery is located within the Ohio
River floodplain and erosion is not a strong concern at this location.
Table 1. Site characteristics of field trial locations. Field trials were located at the WVU Farm in
Monongalia Co., WV; Buck Lilly Surface Mine in Greenbrier Co., WV; Squires Creek No. 1 Mine in Preston Co., WV; and Clements State Tree Nursery in Mason Co., WV.
Site characteristics WVU Farm Greenbrier
Squires
Creek Clements
Latitude 39°39'29.55"N 38° 1'7.31"N 39°28'41.03"N 38°57'39.83"N
Longitude 79°55'50.17"W 80°35'23.05"W 79°46'59.81"W 82° 5'28.58"W
Elevation (ft.) 1000 3650 1850 575
Soil Type Ontario Arnot Gilpin Hamlin
Textural Class silt loam loam; clay loam; silty clay loam
loam silt loam
% Sand 18.1 25.2 29.3 26.2
% Clay 16.5 29.3 22.2 17.8
% Silt 65.4 45.5 48.5 56.1
Aggregate Stability (%) 56.7 37.1 32.2 44.3
Available Water Capacity (m/m) 0.23 0.16 0.21 0.25
% Organic Matter 7.12 8 5 4
pH 7.48 6.2 7.3 6.3
Nitrogen (µgN/ gdwsoil/week) 4.9 56 9.9 5.8
Phosphorus (ppm) 3.1 1 1 2
Potassium (ppm) 91.2 96.1 200.6 86.7
Calcium (ppm) 4671.3 1309.2 2046.2 1611
Aluminum (ppm) 9.7 43 29.6 17
Magnesium (ppm) 123.4 186.8 164.2 159.9
Iron (ppm) 0.5 15.7 2.2 1.7
Manganese (ppm) 10.7 19.7 1.4 15.9
Zinc (ppm) 0.5 1.9 0.7 0.5
Source Material
Unrooted willow cuttings were obtained from Double A Willow (Fredonia, NY) in the spring
of 2013 and stored in a cooler prior to planting. Six varieties of willow were selected for
planting: Oneida (S. purpurea x S. miyabeana), SX61 (S. sachalinensis), Marcy (S. sachalinensis
x S. miyabeana), Preble (S. viminalis x (S. sachalinensis x S. miyabeana)), Fish Creek (S.

62
purpurea), and Fabius (S. viminalis x S. miyabeana). Cultivars were selected based on
recommendations from Double A Willow and researchers at Cornell University.
The biochar used in this study was obtained from a poultry producer located in the eastern
panhandle of West Virginia. The producer installed a fixed bed gasifier in 2007 and biochar is
created from poultry litter produced on his farms. Poultry litter biochar is rich in P and K with
test runs by the International Biochar Initiative yielding results of 1.7-3.2% P and 5.4-9.6% K
(2014) and test runs by Novak et al. (2009) yielding results of 2.94-4.9% P (2009).
Field Trial Establishment and Harvest
The sites were prepared with a pre-treatment of glyphosate, and the dead plant matter and
remaining living material were cut back prior to planting. At each site, six 20 x 20 ft. (400 ft2)
plots were established (Fig. 2).
Figure 2. Field trial site and plot layout. Each site consists of 6 plots, 3 of which (grey)
receive an application of biochar. Each black dot represents a willow. Four
rows of twelve were planted for a total of 48 willows per plot, 288 per site.
A minimum three-foot buffer was maintained between plots. Willows were planted by hand
using small shovels to create holes with an approximate diameter of 6 inches and an approximate
depth of 6” (~170 in3). Three plots at each location were selected to receive an application of
63
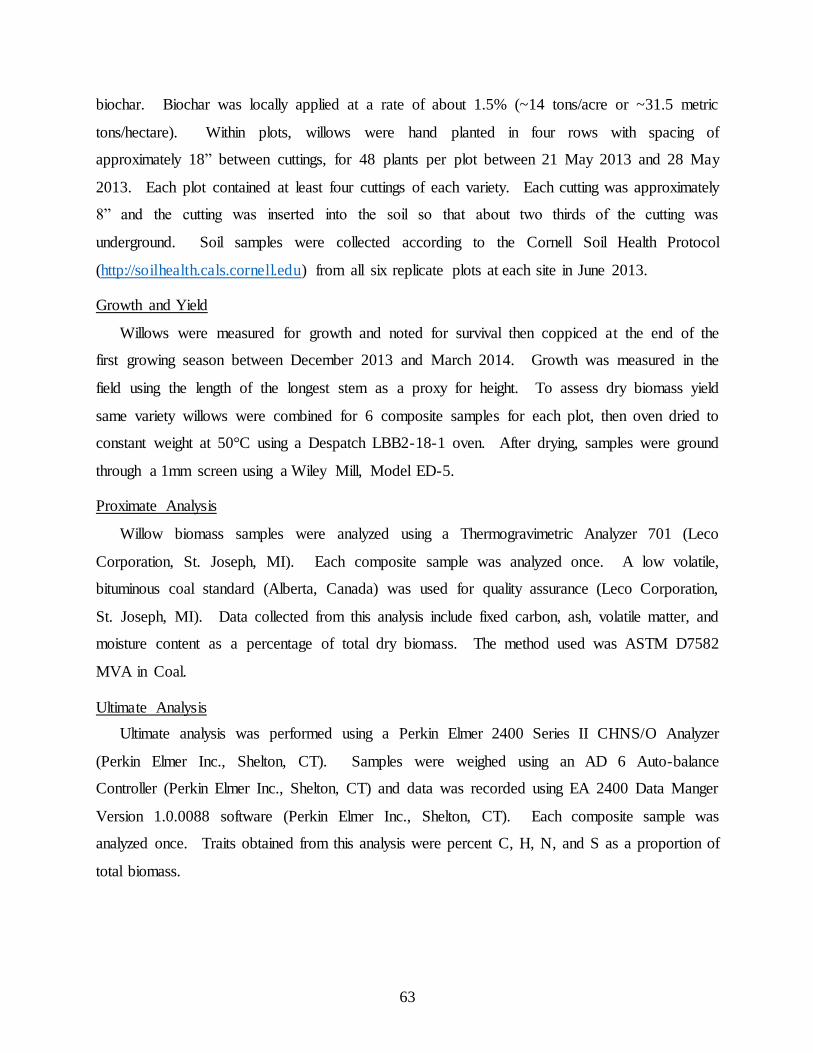
biochar. Biochar was locally applied at a rate of about 1.5% (~14 tons/acre or ~31.5 metric
tons/hectare). Within plots, willows were hand planted in four rows with spacing of
approximately 18” between cuttings, for 48 plants per plot between 21 May 2013 and 28 May
2013. Each plot contained at least four cuttings of each variety. Each cutting was approximately
8” and the cutting was inserted into the soil so that about two thirds of the cutting was
underground. Soil samples were collected according to the Cornell Soil Health Protocol
(http://soilhealth.cals.cornell.edu) from all six replicate plots at each site in June 2013.
Growth and Yield
Willows were measured for growth and noted for survival then coppiced at the end of the
first growing season between December 2013 and March 2014. Growth was measured in the
field using the length of the longest stem as a proxy for height. To assess dry biomass yield
same variety willows were combined for 6 composite samples for each plot, then oven dried to
constant weight at 50°C using a Despatch LBB2-18-1 oven. After drying, samples were ground
through a 1mm screen using a Wiley Mill, Model ED-5.
Proximate Analysis
Willow biomass samples were analyzed using a Thermogravimetric Analyzer 701 (Leco
Corporation, St. Joseph, MI). Each composite sample was analyzed once. A low volatile,
bituminous coal standard (Alberta, Canada) was used for quality assurance (Leco Corporation,
St. Joseph, MI). Data collected from this analysis include fixed carbon, ash, volatile matter, and
moisture content as a percentage of total dry biomass. The method used was ASTM D7582
MVA in Coal.
Ultimate Analysis
Ultimate analysis was performed using a Perkin Elmer 2400 Series II CHNS/O Analyzer
(Perkin Elmer Inc., Shelton, CT). Samples were weighed using an AD 6 Auto-balance
Controller (Perkin Elmer Inc., Shelton, CT) and data was recorded using EA 2400 Data Manger
Version 1.0.0088 software (Perkin Elmer Inc., Shelton, CT). Each composite sample was
analyzed once. Traits obtained from this analysis were percent C, H, N, and S as a proportion of
total biomass.

64
Heating Value
Heating value of the samples was determined using a Parr 6300 Bomb Calorimeter (Moline,
IL). Each composite sample was analyzed once. Data collected from this analysis include
BTU/lb.
Statistical Analysis
All statistical analyses were performed using SAS version 9.3 at a critical α level of 0.05.
The examination of the willow samples included thirteen split-plot analyses of variance using
randomized blocks. Site type (SiteType), either agricultural or reclaimed mine land, was a
method of randomized design testing and the main plot experimental factor. The completely
randomized sub-plot experimental factor was biochar (BC) (biochar amended or control), and the
sub-sub-plot experimental factor was variety (VAR) (one of the six cultivars listed in the
materials and methods section).
Results and Discussion
Mortality
Across all sites and cultivars, mortality was at 47.7% at the end of the growing season.
Mortality was lowest at site Greenbrier (32.1%) followed by Squires Creek (46.1%), and
Clements (64.8%) (Fig. 3). Mortality data was not collected for the WVU Farm site. Pearson’s
chi squared test revealed a significant differences in mortality by site (P<0.0001) (Table 2).
Table 2. ANOVA table for mortality of Salix spp. by site for three field trial sites in West Virginia. A significant effect was observed using
Pearson’s chi squared test (P<0.0001).
N DF -Log Like R Square (U)
860 2 31.595628 0.0531
Test Chi Square Prob > Chi Sq
Likelihood Ratio 63.191 <.0001*
Pearson 62.106 <.0001*

65
Figure 3. Mortality (%) of Salix spp. by site for three field trial sites in West Virginia. Site ‘Clements’ had the greatest mortality and a
significant mortality by site effect was observed (P<0.0001).
Significant differences in mortality were observed between cultivars (P<0.0037) (Table 4).
Cultivar ‘Oneida’ (ONE) demonstrated the least mortality with 67.2% surviving (P<0.0164).
Cultivars ‘Marcy’ (MAR) and ‘Preble’ (PRE) performed poorest with 46.0% (P<0.0059) and
45.6% (P<0.0047) survivorship, respectively (Fig. 4). Variety ‘Oneida’ had the highest
survivorship of all cultivars. ‘Oneida’ is a cultivar which has demonstrated a low incidence of
rust disease, mammal browsing, or damage by beetle or sawfly in yield trials (Cameron et al.,
2007).
Table 4. ANOVA table for mortality of Salix spp. by cultivar across all field trial sites in West Virginia. A significance difference was observed
using Pearson’s chi squared test (P<0.0037).
N DF -Log Like R Square (U)
860 5 8.8876342 0.0149
Test Chi Square Prob >ChiSq
Likelihood Ratio
17.775 0.0032*
Pearson 17.478 0.0037*
0
10
20
30
40
50
60
70
80
90
100
Greenbrier Clements Squries Creek
% M
ort
alit
y
Site

66
Figure 4. Mortality of Salix spp.by cultivar for all field trial sites in West Virginia. A significant cultivar effect was observed (P<0.0037). Cultivar
‘Oneida’showed significant differences from cultivars ‘Preble’ (P<0.0059) and ‘Marcy’ (P<0.0047)
For all six genotypes planted at the three sites in 2013, survivorship was below the predicted
90% survivorship provided by Double A Willow (Fredonia, NY). Survivorship was highest at
site ‘Greenbrier’ potentially due to the unique conditions at this site, including a lower mean
average temperature, a slightly higher annual rainfall, and a higher nitrogen content than the
other sites. Site ‘Greenbrier’ may more closely resemble the geographic origin of the cuttings,
thereby resulting in lower mortality at that particular site. However, due to the significant
number of environmental variables it is extremely difficult to attribute mortality to any of these
factors.
Growth and Yield
Average height growth regardless of site, cultivar, or treatment was 41.4 cm. A statistically
significant effect for growth by treatment was observed (P=0.0003) (Table 5; Fig. 5) with plants
in the biochar-amended plots growing on average 53.3 cm ± 3.8 cm and plants in reference plots
growing on average 29.5 cm ± 3.6 cm.
ab ab
a
b
a
ab
0
10
20
30
40
50
60
70
80
90
100
FAB FC MAR ONE PRE SX61
% M
ort
alit
y
Cultivar

67
Table 5. ANOVA table for height growth of Salix spp. at four field trial sites in West Virginia. Significant effect was observed for biochar
(P=0.0003).
Effect Num DF Den DF F Value Pr > F
SiteType 1 14 0 0.9943
BC 1 14 23.02 0.0003
SiteType*BC 1 14 0.08 0.7863
Var 5 34 2.31 0.0659
SiteType*Var 5 34 1.84 0.1319
BC*Var 5 24 2.38 0.0684
SiteType*BC*Var 5 24 2.33 0.0738
Figure 5. Height growth by treatment for Salix spp. at four field trial sites in West Virginia. A significant difference of growth by
treatment was observed (P=0.0003).
Average yield regardless of site, treatment, or variety was 3.8 kg/acre. Biochar-amended
plots yielded an average of 5.0 kg/acre which was significantly higher than reference plots which
yielded 2.9 kg/acre (P=0.0180) (Fig. 6; Table 6).
a
b
0
5
10
15
20
25
30
Reference Biochar
Hei
ght
gro
wth
(cm
)

68
Table 6. ANOVA table for yield of Salix spp. at field trial sites in West Virginia. Significant effects were observed for the interaction of site type,
treatment, and variety (P=0.0216), variety (P=0.0046), and treatment (P=0.0180).
Effect Num DF Den DF F Value Pr > F
SiteType 1 20 0.07 0.792
BC 1 20 6.65 0.018
SiteType*BC 1 20 0.73 0.4028
Var 5 50 3.91 0.0046
SiteType*Var 5 50 1.6 0.1786
BC*Var 5 39 0.63 0.6755
SiteType*BC*Var 5 39 3.01 0.0216
Figure 6. Yield (g/plot) of Salix spp. by treatment and field trial site in West Virginia. Biochar-amended plots had statistically significantly higher
yield than reference plots at all sites (P=0.0180).
Additionally, a significant variety effect was observed (P=0.0046) (Table 6). Pairwise
comparisons indicate that cultivar ‘Fabius’ performed better than all other cultivars with the
exception of cultivar ‘Preble’. Furthermore, a significant site type by biochar by variety effect
was observed (P=0.0216) (Table 11). For four of the six varieties examined, yield was highest at
a
b
0
10
20
30
40
50
60
Reference Biochar
Yiel
d/p
lot
(g)

69
Greenbrier (‘Fabius,’ ‘Marcy,’ ‘Preble,’ and ‘SX61’). The remaining two varieties (‘Fish Creek’
and ‘Oneida’) performed best at the Morgantown site. Varieties ‘Oneida’ and ‘Marcy’ had higher
yields in biochar-amended plots at reclaimed mine sites and higher yields in reference plots at
agricultural sites (Fig. 7). This indicates that biochar may have been more effective at retaining
water or essential nutrients for plant growth in depleted soils, while agricultural sites may be
more saturated with nutrients thus biochar having a less significant effect.
Figure 7. A significant site by biochar by variety effect for yield (P=0.0216) of Salix spp. at field
trial sites in West Virginia. Due to the complex interaction of biochar, soils/site type, and variety, different varieties performed better on reclaimed mine sites than
agricultural sites and/or in the absence of biochar.
Proximate Analysis
Average ash content for all sites was 2.7% by weight. This is higher than the general
guideline of 1% ash by weight for woody biomass (McKendry, 2002). The higher ash content
may also be explained by the age of the samples. Samples are generally analyzed for ash content
at the end of a rotation (3-4 years), however the samples in this study were analyzed after year
one. A higher proportion of bark to wood has been associated with higher ash content, thereby
explaining the relatively high ash content of these samples.
0
10
20
30
40
50
60
70
80
90
100
FAB FC MAR ONE PRE SX61 FAB FC MAR ONE PRE SX61
REF REF REF REF REF REF BC BC BC BC BC BC
Yiel
d/p
lot
(g)
Agricultural
Reclaimed Mine

70
The average fixed carbon regardless of site type, variety, or treatment was 17.5% by weight,
slightly higher than the 17% general guideline provided by Demirbas (2004). Significant fixed
effects for fixed carbon were observed for variety (P<0.0148) (Table 7; Fig. 8). Variety ‘Fabius’
was greatest with 18.1% fixed carbon by percent weight while varieties ‘Marcy’ and ‘SX61’
were lowest with 16.9% and 17.0% fixed carbon, respectively. In a least squares means analysis,
cultivar ‘Fabius’ was significantly different from ‘Marcy’ at α=0.05 level (P<0.0280) and there
was a trend toward a significant difference with’ SX61’ (P<0.0585), however no other trends
were observed between varieties. Furthermore, no trends were observed for other fixed effects.
Varieties ‘SX61’ and ‘Marcy’ are both cultivars of S. sachalinensis, while ‘Fabius’ is a cultivar
of S. viminalis x S. miyabeana. Differences in hybrid vigor may account for the differences
observed between these cultivars.
Table 7. ANOVA table for fixed carbon content of Salix spp. at field trial sites in West Virginia. A significant variety effect was observed (P=0.0148).
Effect Num DF Den DF F Value Pr > F
SiteType 1 20 1.31 0.2665
BC 1 20 1.33 0.2622
SiteType*BC 1 20 1.82 0.1927
Var 5 47 3.18 0.0148
SiteType*Var 5 47 0.93 0.4692
BC*Var 5 37 0.26 0.9334
SiteType*BC*Var 5 37 0.64 0.6708
Volatile matter content averaged 79.8% by weight for all samples. Volatile matter content in
willows in this study was lower than the general guideline of 82% for woody biomass
(Demirbas, 2004). These sites and cultivars are suitable for shrub willow cultivation based on
this standard in that lower volatile matter is better suited to combustion systems.
Moisture content in this study was 6.2% by weight. This is slightly higher than the 5%
general guideline for coal (Demirbas, 2004). Since moisture content is related to heating value,
heating value is expected to be lower than that of coal. Percent moisture is influenced by age,
genetic controls, and environmental factors. Moisture content did not vary significantly between
sites, variety, treatments, nor were there any interactions among the variables.

71
Figure 8. Fixed carbon (% weight) content of Salix spp. by variety observed in field trials in West Virginia. A significant effect is
observed (P<0.0148).
Moisture content in this study was 6.2% by weight. This is slightly higher than the 5%
general guideline for coal (Demirbas, 2004). Since moisture content is related to heating value,
heating value is expected to be lower than that of coal. Percent moisture is influenced by age,
genetic controls, and environmental factors. Moisture content did not vary significantly between
sites, variety, treatments, nor were there any interactions among the variables.
Ultimate Analysis
No significant differences were observed in the elemental analysis of C, H, S, or O by
percent weight. Average carbon content of all samples was 47.3% by weight. Average H
content was 6.0% by weight, average S content was 0.33% by weight, and average O content
was 45.4%. Carbon, H, and S contents were within the general guidelines provided by Demirbas
(2004), and O content was just slightly outside the guidelines of 35-45% by weight.
Average N concentration for samples in this study was 0.98% by weight. This is higher than
0.34% and 0.36% observed in similar studies, however lower than the typical 1.2% N found in
coal (Demirbas, 2004). Differences were observed in N due to biochar (P=0.0056), variety
(P=0.0385), and site type by biochar (P=0.0259) (Table 9). Nitrogen concentrations for wood
samples from biochar-amended plots were significantly higher than in reference plots
(P=0.0056); 1.0544 (± 0.03687) N by percent weight compared to 0.9080 (± 0.03640) percent N
a ab
b
ab
ab
ab
15
15.5
16
16.5
17
17.5
18
18.5
19
FAB FC MAR ONE PRE SX61
Fixe
d c
arb
on
(%
wei
ght)
Variety
72
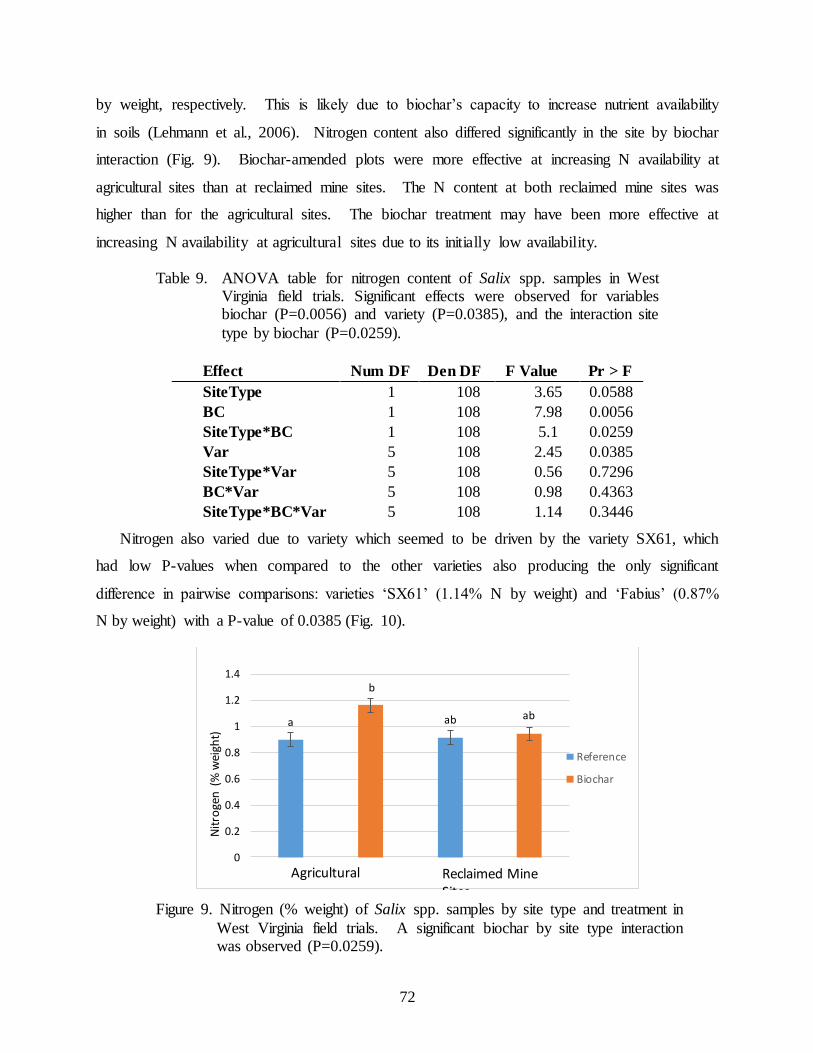
by weight, respectively. This is likely due to biochar’s capacity to increase nutrient availability
in soils (Lehmann et al., 2006). Nitrogen content also differed significantly in the site by biochar
interaction (Fig. 9). Biochar-amended plots were more effective at increasing N availability at
agricultural sites than at reclaimed mine sites. The N content at both reclaimed mine sites was
higher than for the agricultural sites. The biochar treatment may have been more effective at
increasing N availability at agricultural sites due to its initially low availability.
Table 9. ANOVA table for nitrogen content of Salix spp. samples in West Virginia field trials. Significant effects were observed for variables biochar (P=0.0056) and variety (P=0.0385), and the interaction site
type by biochar (P=0.0259).
Effect Num DF Den DF F Value Pr > F
SiteType 1 108 3.65 0.0588
BC 1 108 7.98 0.0056
SiteType*BC 1 108 5.1 0.0259
Var 5 108 2.45 0.0385
SiteType*Var 5 108 0.56 0.7296
BC*Var 5 108 0.98 0.4363
SiteType*BC*Var 5 108 1.14 0.3446
Nitrogen also varied due to variety which seemed to be driven by the variety SX61, which
had low P-values when compared to the other varieties also producing the only significant
difference in pairwise comparisons: varieties ‘SX61’ (1.14% N by weight) and ‘Fabius’ (0.87%
N by weight) with a P-value of 0.0385 (Fig. 10).
Figure 9. Nitrogen (% weight) of Salix spp. samples by site type and treatment in
West Virginia field trials. A significant biochar by site type interaction was observed (P=0.0259).
a
b
ab ab
0
0.2
0.4
0.6
0.8
1
1.2
1.4
Nit
roge
n (
% w
eigh
t)
Reference
Biochar
Agricultural Reclaimed Mine Sites

73
Figure 10. Nitrogen content (% weight) of Salix spp. by variety for West Virginia field trials. A statistically significant difference was observed
(P=0.0385).
Heating Value
Average BTU/lb for all samples is 7893.8 (18.4 MJ/kg). This falls within the estimates
provided by the general guidelines for woody biomass. Those guidelines indicate 14-21 MJ/kg
should be expected. Generally speaking, heating value is measured at the end of a rotation (after
3-4 years of growth). Bark is known to lower the average heating value of woody biomass, and
since these are samples from year one bark makes up a higher proportion of the biomass, so a
lower heating value would be expected; however, this is not what is observed. BTU/lb did not
show any correlations with factors that drive heating value such as ash or carbon.
BTU/lb values differed significantly by variety at α=0.05 level (P=0.0045) (Table 10).
Differences were driven by variety ‘Fish Creek’ which had BTU/lb values significantly higher
than varieties ’Fabius’ (P=0.0348) and ‘Marcy’ (P=0.0220) (Fig. 11). Variations in heating
value for varieties are likely due to the natural variation among cultivars that is expected due to
the intentional maintenance of genetic diversity among cultivars.
0
0.2
0.4
0.6
0.8
1
1.2
1.4
FAB FC MAR ONE PRE SX61
Nit
roge
n %
Wei
ght
Variety
a
b
ab ab ab
ab

74
Table 10. ANOVA table for heating value of Salix spp. from West Virginia field trials. A significant variety effect was observed (P=0.0045).
Effect Num DF Den DF F Value Pr > F
SiteType 1 18.46 0.86 0.3654
BC 1 18.46 0.14 0.7146
SiteType*BC 1 18.46 0.46 0.5056
VAR 5 88.34 3.68 0.0045
SiteType*VAR 5 88.34 0.86 0.5122
BC*VAR 5 88.34 1.84 0.113
SiteType*BC*VAR 5 88.34 1.17 0.3297
Figure 11. Estimated BTU/lb of Salix spp. by cultivar from West Virginia field trials.
Significant differences are observed between ‘Fish Creek’ and varieties ‘Fabius’ and ‘Marcy’ (P<0.0045).
Conclusion
Although the results of this study assess only year one data, valuable insights into shrub
willow cultivation using biochar on reclaimed mine sites and marginal agricultural sites have
been gained.
a
b
a
ab
ab
ab
7600
7650
7700
7750
7800
7850
7900
7950
8000
8050
Fabius Fish Creek Marcy Oneida Preble SX61
BTU
/lb
Cultivar

75
Survivorship of all cultivars at all sites was lower than the anticipated 90% that has been
demonstrated on prime agricultural land. Site ‘Greenbrier’ had the highest growth and yield, and
the lowest mortality. This is likely due to the slightly higher mean annual rainfall and lower
average temperatures. ‘Greenbrier’ also had more N available in the soils as well as more Fe,
Mn, and Zn than the three other sites.
Wood properties were within the general guidelines for woody biomass. Ash content was
slightly higher (2.7% vs. 1%) as was N (0.98% vs. 0.35%). Ash content was likely higher than
the general guidelines for woody biomass due to the age of the samples. Ash is typically
measured at the end of a rotation (3-4 years), whereas in this study ash was measured at the end
of the first growing season. The bark to wood ratio is higher at the end of the first growing
season thereby raising the percentage of ash in the samples. Volatile matter was lower than the
general guidelines (79.8% vs. 82%) which is beneficial for heating values and greenhouse gas
emissions.
The insights into the use of biochar on marginal lands were arguably the most important
implications of this study. This is suggested through higher growth, yield, and survivorship in
biochar-amended plots than reference plots at all sites. Additionally, biochar was more effective
at reclaimed mine sites than agricultural sites. This may be due to reclaimed mine sites having a
poorer soil structure, and the biochar therefore having a greater positive effect on structure than
at agricultural sites. The aggregate stability at both of the reclaimed mine sites was lower than
the agricultural sites (34.7% vs. 50.5%). Aggregate stability is influenced by organic matter
content, biological activity, and nutrient cycling; biochar likely improved these properties and
thus improved growth, yield, and survivorship over non-amended plots. Improved growth and
yield in biochar-amended plots in the first year of growth gave willow saplings a competitive
advantage over weeds. Additionally, biochar has shown long-term positive impacts in field
studies, and improved growth and yield in year one may be an indicator of higher yields in the
long term.
Acknowledgements
Research reported in this publication was supported by the Northeast Woody/Warm-season
Biomass Consortium (NEWBio) under the United States Department of Agriculture National
Institute of Food and Agriculture.

76
Literature Cited
Cameron, K., L. Smart, T. Volk, and L. Abrahamson. 2007. Salix purpurea ‘Fish Creek.’ The
Research Foundation of State University of New York.
Demirbas, A. 2004. Combustion characteristics of different biomass fuels. Progress in Energy
and Combustion Science 30: 219-230. http://dx.doi.org/10.1016/j.pecs.2003.10.004
Grushecky, S., J. Skousen, D, McGill, S, DiFazio, 2013. NEWBio Seed Grant.
Kwapinski, W. C.M.P. Byrne, E. Kryachoko, P. Wolfram, C. Adley, J.J. Leahy, E.H. Novotny,
and M.H.B. Hayes. 2010. Biochar from biomass and waste. Waste Biomass Valor 1: 177-
189. http://dx.doi.org/10.1007/s12649-010-9024-8
Lehmann, J., J. Gaunt, and M. Rondon. 2006. Biochar sequestration in terrestrial ecosystems – a
review. Mitigation and Adaptation Strategies for Global Change 11: 403-427.
http://dx.doi.org/10.1007/s11027-005-9006-5
Major, J., M. Rondon, D. Molina, S.J. Riha, and J. Lehmann. 2010. Maize yield and nutrition
during 4 years after biochar application to a Colombian savanna oxisol. Plant Soil 333: 117-
128. http://dx.doi.org/10.1007/s11104-010-0327-0
McKendry, P. 2002. Energy production for biomass (part 1): overview of biomass. Bioresource
Technology 83: 37-46. http://dx.doi.org/10.1016/S0960-8524(01)00118-3
Novak, J.M, I. Lima, B. Xing, J.W. Gaskin, C. Steiner, K.C. Das, M. Ahminda, D. Rehrah, D.W.
Watts, W.J. Busscher, and H. Schomberg. 2009. Characterization of designer biochar
produced at different temperatures and their effects on loamy sand. Annals of
Environmental Science 195-206.
U.S. Department of Energy. Energy.gov. Accessed Sept. 6, 2013.
Wicke, Birka. 2011. Chapter 1"Bioenergy production on degraded and marginal land: Assessing
its potentials, economic performance, and environmental impacts for different settings and
geographical scales."