sales of veterinary antimicrobial agents in 30 european ... · pdf file• develops best...
TRANSCRIPT

An agency of the European Union
Sales of veterinary antimicrobial agents in 30 European countries in 2015
Trends from 2010 to 2015Seventh ESVAC report
Sal
es o
f ve
teri
nar
y an
tim
icro
bial
age
nts
in 3
0 E
uro
pean
cou
ntr
ies
in 2
01
5 –
Tre
nds
from
201
0 to
201
5 –
Seve
nth
ESVA
C r
epor
t

The mission of the European Medicines Agency is to foster scientific excellence in the evaluation and supervision of medicines, for the benefit of public and animal health.
Legal role
The European Medicines Agency is the European Union body responsible for coordinating the existing scientific resources put at its disposal by Member States for the evaluation, supervision and pharmacovigilance of medicinal products.
The Agency provides the Member States and the institutions of the European Union (EU) and the European Economic Area (EEA) countries with the best-possible scientific advice on any questions relating to the evaluation of the quality, safety and efficacy of medicinal products for human or veterinary use referred to it in accordance with the provisions of EU legislation relating to medicinal products.
The founding legislation of the Agency is Regulation (EC) No 726/2004.
Principal activities
Working with the Member States and the European Commission as partners in a European medicines network, the European Medicines Agency:
• provides independent, science-based recommendations on the quality, safety and efficacy of medicines, and on more general issues relevant to public and animal health that involve medicines;
• applies efficient and transparent evaluation procedures to help bring new medicines to the market by means of a single, EU-wide marketing authorisation granted by the European Commission;
• implements measures for continuously supervising the quality, safety and efficacy of authorised medicines to ensure that their benefits outweigh their risks;
• provides scientific advice and incentives to stimulate the development and improve the availability of innovative new medicines;
• recommends safe limits for residues of veterinary medicines used in food-producing animals, for the establishment of maximum residue limits by the European Commission;
• involves representatives of patients, healthcare professionals and other stakeholders in its work, to facilitate dialogue on issues of common interest;
• publishes impartial and comprehensible information about medicines and their use;
• develops best practice for medicines evaluation and supervision in Europe, and contributes alongside the Member States and the European Commission to the harmonisation of regulatory standards at the international level.
Guiding principles
• We are strongly committed to public and animal health.
• We make independent recommendations based on scien-tific evidence, using state-of-the-art knowledge and expertise in our field.
• We support research and innovation to stimulate the development of better medicines.
• We value the contribution of our partners and stakeholders to our work.
• We assure continual improvement of our processes and procedures, in accordance with recognised quality stand-ards.
• We adhere to high standards of professional and personal integrity.
• We communicate in an open, transparent manner with all of our partners, stakeholders and colleagues.
• We promote the well-being, motivation and ongoing professional development of every member of the Agency.

Sales of veterinary antimicrobial agents in 30 European countries in 2015. Trends from 2010 to 2015Seventh ESVAC report
30 October 2017EMA/184855/2017 Veterinary Medicines Division
Acknowledgements
The members and observers of the ESVAC sales advisory expert group – Kari Grave (chair), Katariina Kivilahti-Mäntylä, Christina Greko, Cristina Muñoz Madero, Gérard Moulin, Jürgen Wallmann, Pierre-Alexandre Beloeil and Klaus Weist – are acknowledged for providing valuable comments and scientific advice during the production of this report.
Kari Grave1 is especially acknowledged for her contribution to the preparation of this report.
Furthermore, Klemens Fuchs, Reinhard Fuchs, Bart Hoet, Ivaylo Ivanov, Bernard Jendrašinkin, Ana Marija Turčić, Iva Gruden Zdunić, Lucie Pokludová, Jana Wojtylová, Marios Genakritis, Laura Mie Jensen, Marju Sammul, Katariina Kivilahti-Mäntylä, Gérard Moulin, Anne Chevance, Inke Reimer, Jürgen Wallmann, Spyridon Farlopoulos, Ioannis Malemis, Edit Nagy, Katalin Mészárosné Árvai, Jóhann M. Lenharðsson, Jeremiah Gabriel Beechinor, Gavin Ryan, Loredana Candela, Inese Pereverteņa, Liena Miķe, Sigitas Siriukaitis, Marcel Bruch, Bart van den Assum, Inge van Geijlswijk, Nina Pora, Agnieszka Dobrowolska, Maria Azevedo Mendes, João Pedro Duarte da Silva, Camelia Voicu, Anton Svetlin, Rinaldo Zidar, Judita Hederová, Iveta Sincaková, Cristina Muñoz Madero, Maria Concepción Porrero Calonge, Kinfe Girma, Christina Greko, Cedric Mϋntener, Kitty Healey, Stacey Brown are all acknowledged for providing data and valuable comments for the report.
European Medicines Agency staff members Kristine Ignate, Jordi Torren Edo and David Mackay are gratefully acknowledged for the preparation of the report.
Citation
Suggested citation: European Medicines Agency, European Surveillance of Veterinary Antimicrobial Consumption, 2017. ‘Sales of veterinary antimicrobial agents in 30 European countries in 2015’. (EMA/184855/2017)
Correspondence
Any correspondence relating to this report should be sent by e-mail to: [email protected]
DISCLAIMERThe views and positions expressed in this report do not necessarily represent in legal terms the official position of the European Medicines Agency. The European Medicines Agency assumes no responsibility or liability for any errors or inaccuracies that may appear in the report.
1 Norwegian Veterinary Institute.


About the European Medicines AgencyThe European Medicines Agency (EMA) is a decentralised body of the European Union (EU), located in London. Its main responsibility is the protection and promotion of public and animal health, through the evaluation and supervision of medicines for human and veterinary use.
The Agency is responsible for the scientific evaluation of applications for European marketing authorisations for both human and veterinary medicines (centralised procedure). Under the centralised procedure, companies submit a single marketing authorisa-tion application to the Agency. Once granted by the European Commission, a centralised marketing authorisation is valid in all EU Member States and, after implementation at national level, in the EEA-EFTA states (Iceland, Liechtenstein and Norway).
The Agency, with the help of its Committee for Medicinal Products for Veterinary Use (CVMP), and its Antimicrobials Working Party (AWP), has produced a strong body of scientific advice2 in relation to the use of antimicrobials and the risk of antimicrobial resistance, with the intention of promoting the continued availability of effective antimicrobials for use in animals, while at the same time acting to minimise risks to animals or humans arising from their use.
The European Surveillance of Veterinary Antimicrobial Consumption (ESVAC) project was launched by the Agency in September 2009, following a request from the European Commission to develop a harmonised approach to the collection and reporting of data on the use of antimicrobial agents in animals from the Member States.
About the reportThis seventh ESVAC report presents data on the sales of veterinary antimicrobial agents from 30 European countries in 2015, provided at package level according to a standardised protocol and template. In addition, it includes a chapter describing changes in consumption of veterinary antimicrobials for the years 2010-2015 (Chapter 2.8).
Chapter 2.8.2. focuses on the changes across time in each country. Explanations for the possible reasons for the changes across time in the various ESVAC participating countries have been provided by the ESVAC national contact points. This chapter emphasises in particular certain classes/subclasses of antimicrobials included in Category 2 of the categorisation made by the EMA Antimicrobial Advice ad hoc Expert Group (AMEG) (see classification criteria in Annex 5). The AMEG categories take into account the World Health Organization (WHO) categorisation of antimicrobials, the hazards of zoonotic relevance in Europe, the use of those antimicrobials in veterinary medicine, and the risk of resistance transfer to humans. The AMEG classification is published on the EMA webpage3.
Category 2 of the AMEG categorisation includes those veterinary antimicrobials where the risk for public health is estimated to be higher than other classes of antimicrobials; fluoroquinolones, 3rd- and 4th-generation cephalosporins and polymyxins are included in this category. Macrolides are not included in Category 2 of the AMEG categorisation4. Aminoglycosides and certain penicillins have been included provisionally under Category 2, but risk profiling has yet to be finalised by the EMA/CVMP.
This report places emphasis primarily on food-producing animals.
It is generally agreed that it usually takes at least three to four years to establish a valid baseline for the data on sales of veterinary antimicrobial agents. Consequently, the data from countries that have collected such data for the first or even second time should be interpreted with due caution.
It should be emphasised that the data presented in this report should not be used alone as a basis for setting management priorities, but should always be considered together with data from other sources.
2 Available from the European Medicines Agency website (www.ema.europa.eu) via Home > Veterinary regulatory > Overview > Antimicrobial resistance.
3 Available from the European Medicines Agency website (www.ema.europa.eu): http://www.ema.europa.eu/docs/en_GB/document_library/Other/2014/07/WC500170253.pdf (pages 29-31).
4 Although macrolides are not included in Category 2, the CVMP has made recommendations indicating that, amongst others, the responsible use of antimicrobials (macrolides) should be strongly promoted, and that although acknowledging that macrolides are first-line treatment against a number of animal diseases, there is a need to avoid unnecessary use.

Table of contents
Summary .................................................................................................................. 13Key findings ..............................................................................................................................13Concluding remarks ....................................................................................................................14
Introduction ............................................................................................................. 15Terms of reference from the European Commission .........................................................................15About ESVAC activity ..................................................................................................................151.1. Veterinary antimicrobial medicinal products included in the data sets .........................................171.2. Variables reported for each antimicrobial veterinary medicinal product .......................................171.3. Sales data .........................................................................................................................171.4. Denominator: population correction unit (PCU) .......................................................................18
1.4.1. Calculation of PCU ....................................................................................................181.4.2. Animal species and categories included in the PCU; selection of data sources ....................19
1.5. Correction of historical data..................................................................................................191.5.1. Sales data ...............................................................................................................191.5.2. PCU data .................................................................................................................19
1.6. Quality check and validation of the sales and PCU data ............................................................191.7. Analysis and reporting of the data .........................................................................................201.8. Summary of included data sources/types, by country ..............................................................20
2. Results ................................................................................................................ 252.1. Overall sales (tonnes) of veterinary antimicrobial agents ..........................................................252.2. Population-corrected sales for food-producing animals, including horses, by antimicrobial class .....262.3. Population-corrected sales for food-producing animals, including horses, by pharmaceutical form ..322.4. Distribution of sales for food-producing animals — overall and by antimicrobial class
and pharmaceutical form .....................................................................................................352.4.1. Distribution of sales of antimicrobials for food-producing animals by country ....................352.4.2. Distribution of sales of antimicrobials by class and forms by country ................................352.4.2.1. Tetracyclines .......................................................................................................362.4.2.2. Amphenicols ........................................................................................................372.4.2.3. Penicillins ............................................................................................................382.4.2.4. 1st- and 2nd-generation cephalosporins ..................................................................392.4.2.5. 3rd- and 4th-generation cephalosporins ..................................................................402.4.2.6. Sulfonamides ......................................................................................................412.4.2.7. Trimethoprim .......................................................................................................422.4.2.8. Macrolides ...........................................................................................................432.4.2.9. Lincosamides .......................................................................................................442.4.2.10. Fluoroquinolones ..................................................................................................452.4.2.11. Other quinolones ..................................................................................................462.4.2.12. Aminoglycosides ..................................................................................................472.4.2.13. Polymyxins ..........................................................................................................482.4.2.14. Pleuromutilins ......................................................................................................49
2.5. Distribution of the population correction unit by species and country ..........................................502.6. Distribution of single- and multiple-ingredient products of veterinary
antimicrobial agents ............................................................................................................532.7. Sales of tablets by veterinary antimicrobial class for companion animals ....................................532.8. Changes across time ...........................................................................................................55
2.8.1. Overall changes in the ESVAC participating countries ....................................................562.8.1.1. Changes in sales of tonnes of active ingredients, by country ......................................562.8.1.2. Changes in overall sales in mg/PCU, by country .......................................................572.8.1.3. Changes in sales by antimicrobial class in mg/PCU, by country ...................................612.8.1.4. Changes in the denominator (PCU) by country .........................................................692.8.2. Changes in the denominator (PCU) by country ..............................................................71

3. Discussion ......................................................................................................... 1313.1. Materials and methods ...................................................................................................... 1313.2. Results ............................................................................................................................ 132
Annex 1. Additional tables and charts .................................................................... 134
Annex 2. Variables to be reported for each antimicrobial veterinary medicinal product; standardisation of the data ........................................ 145
Annex 3. Population correction unit (PCU) ............................................................. 148
Annex 4. List of antimicrobial classes/active ingredients reported in ESVAC .......... 150
Annex 5. Criteria of WHO CIAs and AMEG Category 2 ............................................. 153
Annex 6. Distribution of veterinary medicines; legal framework and data sources by country .................................................................... 155
Annex 7. References to national reports ................................................................. 168
Annex 8. Country and affiliation of the ESVAC national contact points/ alternates ..... 170
Annex 9. ESVAC sales advisory expert group members and observers ................... 177

Figure 1. Organisation of the ESVAC project ........................................................................................16Figure 2. Distribution of sales, in tonnes of active ingredient, split into tablets
(used almost solely in companion animals) and all other pharmaceutical forms (used mainly in food-producing animals), by country, for 2015. ................................................26
Figure 3. Sales for food-producing species, in mg/PCU, of the various veterinary antimicrobial classes, for 30 European countries, in 2015 .......................................................................................29
Figure 4. Proportion of the total sales of the different veterinary antimicrobial classes, in mg/PCU, in the 30 European countries, for 2015 .................................................................................29
Figure 5. Figure 5. Sales of antimicrobial agents by antimicrobial class as percentage of the total sales for food-producing species, in mg/PCU, aggregated by 30 European countries, for 2015 .............30
Figure 6. Sales of tetracyclines, penicillins and sulfonamides as a percentage of the total sales for food-producing species, in mg/PCU, in 30 European countries, for 2015 ...............................30
Figure 7. Distribution of the sales, in mg/PCU, of penicillins by subclass for food-producing species, in 30 European countries, for 2015 .......................................................................................31
Figure 8. Proportion of the total sales of 3rd- and 4th-generation cephalosporins, fluoroquinolones, other quinolones and polymyxins for food-producing species, in mg/PCU, for 30 European countries, in 2015 .......................................................................................32
Figure 9. Distribution of sales of veterinary antimicrobial agents for food-producing animals, in mg per population correction unit (mg/PCU), by pharmaceutical form in 30 European countries for 2015 ...........................................................................................33
Figure 10. Oral solutions, oral powders and premixes as percentages of total sales, in mg per population correction unit (mg/PCU), of veterinary antimicrobial agents for food-producing animals, in 30 European countries for 2015 .................................................33
Figure 11. Distribution of sales, in mg/PCU, of the various pharmaceutical forms of veterinary antimicrobial agents for food-producing animals, aggregated by the 30 European countries for 2015 ..............................................................................................................34
Figure 12. Spatial distribution of overall sales of all antimicrobials for food-producing animals, in mg/PCU, for 30 countries, for 2015 ...................................................................................35
Figure 13. Spatial distribution of sales of tetracyclines for food-producing animals, in mg/PCU, by country, for 2015 ...........................................................................................................36
Figure 14. Distribution of sales by pharmaceutical forms of tetracyclines, in mg/PCU, by country, for 2015 ...........................................................................................................36
Figure 15. Spatial distribution of sales of amphenicols, in mg/PCU, by country, for 2015 .............................37Figure 16. Distribution of sales by pharmaceutical form of amphenicols, in mg/PCU,
by country, for 2015 ...........................................................................................................37Figure 17. Spatial distribution of sales of penicillins for food-producing animals, in mg/PCU,
by country, for 2015 ...........................................................................................................38Figure 18. Distribution of sales by pharmaceutical form for penicillins, in mg/PCU,
by country, for 20151 .........................................................................................................38Figure 19. Spatial distribution of sales of 1st- and 2nd-generation cephalosporins, in mg/PCU,
by country, for 2015 ...........................................................................................................39Figure 20. Distribution of sales by pharmaceutical form for 1st- and 2nd-generation cephalosporins,
in mg/PCU, by country, for 2015 .......................................................................................... 39Figure 21. Spatial distribution of sales of 3rd- and 4th-generation cephalosporins, in mg/PCU,
by country, for 2015 ...........................................................................................................40Figure 22. Distribution of sales by pharmaceutical form for 3rd- and 4th-generation cephalosporins,
in mg/PCU, by country, for 2015 ..........................................................................................40Figure 23. Spatial distribution of sales of sulfonamides, in mg/PCU, by country, for 2015 ............................41
List of figures

Figure 24. Distribution of sales by pharmaceutical form for sulfonamides, in mg/PCU, by country, for 2015 ...........................................................................................................41
Figure 25. Spatial distribution of sales of trimethoprim, in mg/PCU, by country, for 2015 ............................42Figure 26. Distribution of sales by pharmaceutical form for trimethoprim, in mg/PCU,
by country, for 2015 ...........................................................................................................42Figure 27. Spatial distribution of sales of macrolides, in mg/PCU, by country, for 2015 ...............................43Figure 28. Distribution of sales by pharmaceutical form for macrolides, in mg/PCU,
by country, for 2015 ...........................................................................................................43Figure 29. Spatial distribution of sales of lincosamides, in mg/PCU, by country, for 2015 .............................44Figure 30. Distribution of sales by pharmaceutical form for lincosamides, in mg/PCU,
by country, for 2015 ...........................................................................................................44Figure 31. Spatial distribution of sales of fluoroquinolones, in mg/PCU, by country, for 2015 .......................45Figure 32. Distribution of sales by pharmaceutical form for fluoroquinolones, in mg/PCU,
by country, for 2015 ...........................................................................................................45Figure 33. Spatial distribution of sales of other quinolones, in mg/PCU, by country, for 2015 .......................46Figure 34. Distribution of sales by pharmaceutical form for other quinolones, in mg/PCU,
by country, for 2015 ...........................................................................................................46Figure 35. Spatial distribution of sales of aminoglycosides, in mg/PCU, by country, for 2015 ........................47Figure 36. Distribution of sales by pharmaceutical form for aminoglycosides, in mg/PCU,
by country, for 2015 ...........................................................................................................47Figure 37. Spatial distribution of sales of polymyxins, in mg/PCU, by country, for 2015 ...............................48Figure 38. Distribution of sales by pharmaceutical form for polymyxins, in mg/PCU,
by country, for 2015 ...........................................................................................................48Figure 39. Spatial distribution of sales of pleuromutilins, in mg/PCU, by country, for 2015 ...........................49Figure 40. Distribution of sales by pharmaceutical form for pleuromutilins, in mg/PCU,
by country, for 2015 ...........................................................................................................49Figure 41. The denominator (PCU) and its distribution by the food-producing animal species,
including horses, (PCU = 1 kg), by country, in 2015 ............................................................... 51Figure 42. Distribution of the denominator (PCU) in weight by food-producing animal species,
including horses, by country, in 2015 ................................................................................... 51Figure 43. Percentage of sales, in tonnes of active ingredient, of premixes, oral powders
and oral solutions containing 1, 2, 3 and 4 antimicrobial agents, in 2015 .................................. 53Figure 44. Distribution of sales of tablets, in tonnes of active ingredient, by antimicrobial class
(reported according to the ATCvet hierarchical system), by country, for 2015 ............................ 54Figure 45. Distribution of sales (by weight of active ingredient) of tablets containing penicillins
by subclass, by country, in 2015 ......................................................................................... 55Figure 46. Sales, in tonnes of active ingredients, of veterinary antimicrobials for food-producing
animals, between 2010 to 2015, in 30 European countries ...................................................... 56Figure 47. Total sales of veterinary antimicrobial agents for food-producing species, in mg/PCU,
from 2010 to 2015, for 30 European countries ...................................................................... 57Figure 48. Changes in total sales and sales of fluoroquinolones, 3rd- and 4th-generation
cephalosporins and polymyxins, for 25 EU/EEA countries1, from 2011 to 2015 (note the differences in the scales of the Y axes) .......................................................................60
Figure 49. Sales of tetracyclines for food-producing species, in mg/PCU, by 30 European countries, from 2010 to 2015 .............................................................................................................61

Figure 50. Sales of doxycycline for food-producing species, in mg/PCU, by 30 European countries, from 2010 to 2015 .............................................................................................................62
Figure 51. Sales of penicillins for food-producing species, in mg/PCU, by 30 European countries, from 2010 to 2015 .............................................................................................................63
Figure 52. Sales of sulfonamides for food-producing species, in mg/PCU, by 30 European countries, from 2010 to 2015 .............................................................................................................64
Figure 53. Sales of 3rd- and 4th-generation cephalosporins for food-producing species, in mg/PCU, by 30 European countries, from 2010 to 2015 ........................................................................65
Figure 54. Sales of fluoroquinolones for food-producing species, in mg/PCU, by 30 European countries, from 2010 to 2015 .............................................................................................................66
Figure 55. Sales of quinolones (fluoroquinolones and other quinolones) for food-producing species, in mg/PCU, by 30 European countries, from 2010 to 2015 ...........................................67
Figure 56. Sales of polymyxins for food-producing species, in mg/PCU, by 30 European countries, from 2010 to 2015 .............................................................................................................68
Figure 57. Sales of macrolides for food-producing species, in mg/PCU, by 30 European countries, from 2010 to 2015 .............................................................................................................69
Figure 58. Changes in the denominator (PCU) for food-producing animals, in 1000 tonnes, by country, between 2010 to 2015, in 30 European countries ...................................................70
Figure 59. Sales (mg/PCU) by antimicrobial class in Austria, from 2010 to 2015 ........................................71Figure 60. Sales (mg/PCU) of 3rd- and 4th-generation cephalosporins, fluoroquinolones
and polymyxins in Austria, from 2010 to 2015 .......................................................................72Figure 61. Sales (mg/PCU) by antimicrobial class in Belgium, from 2010 to 2015 .......................................73Figure 62. Sales (mg/PCU) of 3rd- and 4th-generation cephalosporins, fluoroquinolones
and polymyxins in Belgium, from 2010 to 2015 ......................................................................74Figure 63. Sales (mg/PCU) by antimicrobial class in Bulgaria, from 2011 to 2015 .......................................75Figure 64. Sales (mg/PCU) of 3rd- and 4th-generation cephalosporins, fluoroquinolones
and polymyxins in Bulgaria, from 2011 to 2015 ......................................................................76Figure 65. Sales (mg/PCU) by antimicrobial class in Croatia, from 2014 to 2015 ........................................77Figure 66. Sales (mg/PCU) of 3rd- and 4th-generation cephalosporins, fluoroquinolones
and polymyxins in Croatia, from 2014 to 2015 .......................................................................78Figure 67. Sales (mg/PCU) by antimicrobial class in Cyprus, from 2011 to 2015 ........................................79Figure 68. Sales (mg/PCU) of 3rd- and 4th-generation cephalosporins, fluoroquinolones
and polymyxins in Cyprus, from 2011 to 2015 .......................................................................80Figure 69. Sales (mg/PCU) by antimicrobial class in the Czech Republic, from 2010 to 2015 ........................81Figure 70. Sales (mg/PCU) of 3rd- and 4th-generation cephalosporins, fluoroquinolones
and polymyxins in the Czech Republic, from 2010 to 2015 .......................................................82Figure 71. Sales (mg/PCU) by antimicrobial class in Denmark, from 2010 to 2015 .....................................83Figure 72. Sales (mg/PCU) of 3rd- and 4th-generation cephalosporins, fluoroquinolones
and polymyxins in Denmark, from 2010 to 2015 .................................................................... 84Figure 73. Sales (mg/PCU) by antimicrobial class in Estonia, from 2010 to 2015 ........................................85Figure 74. Sales (mg/PCU) of 3rd- and 4th-generation cephalosporins, fluoroquinolones
and polymyxins in Estonia, from 2010 to 2015 .......................................................................86Figure 75. Sales (mg/PCU) by antimicrobial class in Finland, from 2010 to 2015 ........................................87Figure 76. Sales (mg/PCU) of 3rd- and 4th-generation cephalosporins, fluoroquinolones
and polymyxins in Finland, from 2010 to 20151 .....................................................................88

Figure 77. Sales (mg/PCU) by antimicrobial class in France, from 2010 to 2015 .......................................89Figure 78. Sales (mg/PCU) of 3rd- and 4th-generation cephalosporins, fluoroquinolones
and polymyxins in France, from 2010 to 2015 ......................................................................90Figure 79. Sales (mg/PCU) by antimicrobial class in Germany, from 2011 to 2015 ....................................91Figure 80. Sales (mg/PCU) of 3rd- and 4th-generation cephalosporins, fluoroquinolones
and polymyxins in Germany, from 2011 to 2015 ...................................................................92Figure 81. Sales (mg/PCU) by antimicrobial class in Greece, in 2015 ......................................................93Figure 82. Sales (mg/PCU) of 3rd- and 4th-generation cephalosporins, fluoroquinolones
and polymyxins in Greece, in 2015 .....................................................................................94Figure 83. Sales (mg/PCU) by antimicrobial class for Hungary, from 2010 to 2015 ...................................95Figure 84. Sales (mg/PCU) of 3rd- and 4th-generation cephalosporins, fluoroquinolones
and polymyxins in Hungary, from 2010 to 2015 ....................................................................96Figure 85. Sales (mg/PCU) by antimicrobial class in Iceland, from 2010 to 2015 ......................................97Figure 86. Sales (mg/PCU) of 3rd- and 4th-generation cephalosporins and fluoroquinolones
in Iceland, from 2010 to 2015 ............................................................................................98Figure 87. Sales (mg/PCU) by antimicrobial class in Ireland, from 2010 to 2015 ......................................99Figure 88. Sales (mg/PCU) of 3rd- and 4th-generation cephalosporins and fluoroquinolones
in Ireland, from 2010 to 2015 .......................................................................................... 100Figure 89. Sales (mg/PCU) by antimicrobial class in Italy, from 2010 to 2015 ........................................101Figure 90. Sales (mg/PCU) of 3rd- and 4th-generation cephalosporins, fluoroquinolones
and polymyxins in Italy, from 2010 to 2015 ....................................................................... 102Figure 91. Sales (mg/PCU) by antimicrobial class in Latvia, from 2010 to 2015 ...................................... 103Figure 92. Sales (mg/PCU) of 3rd- and 4th-generation cephalosporins, fluoroquinolones
and polymyxins in Latvia, from 2010 to 2015 .....................................................................104Figure 93. Sales (mg/PCU) by antimicrobial class in Lithuania, from 2010 to 2015 ................................. 105Figure 94. Sales (mg/PCU) of 3rd- and 4th-generation cephalosporins, fluoroquinolones
and polymyxins in Lithuania, from 2010 to 2015 ................................................................ 106Figure 95. Sales (mg/PCU) by antimicrobial class in Luxembourg, from 2012 to 2015 ............................. 107Figure 96. Sales (mg/PCU) of 3rd- and 4th-generation cephalosporins and fluoroquinolones
in Luxembourg, from 2012 to 2015................................................................................... 108Figure 97. Sales (mg/PCU) by antimicrobial class for food-producing species,
in the Netherlands, from 2010 to 2015 ..............................................................................109Figure 98. Sales (mg/PCU) of 3rd- and 4th-generation cephalosporins, fluoroquinolones
and polymyxins in the Netherlands, from 2010 to 2015 ....................................................... 110Figure 99. Sales (mg/PCU) by antimicrobial class in Norway, from 2010 to 2015 .................................... 111Figure 100. Sales (mg/PCU) of 3rd- and 4th-generation cephalosporins and fluoroquinolones
in Norway, from 2010 to 2015 .......................................................................................... 112Figure 101. Sales (mg/PCU) by antimicrobial class in Poland, from 2011 to 2015 ..................................... 113Figure 102. Sales (mg/PCU) of 3rd- and 4th-generation cephalosporins, fluoroquinolones
and polymyxins in Poland, from 2011 to 2015 .................................................................... 114Figure 103. Sales (mg/PCU) by antimicrobial class in Portugal, from 2010 to 2015 ................................... 115Figure 104. Sales (mg/PCU) of 3rd- and 4th-generation cephalosporins, fluoroquinolones
and polymyxins in Portugal, from 2010 to 2015 .................................................................. 116Figure 105. Sales (mg/PCU) by antimicrobial class in Romania, from 2014 to 2015 .................................. 117

Figure 106. Sales (mg/PCU) of 3rd- and 4th-generation cephalosporins, fluoroquinolones and polymyxins in Romania, from 2014 to 2015 .................................................................118
Figure 107. Import data by wholesalers (2011 and 2012) and sales to end-users (2013-2015) (mg/PCU) by antimicrobial class for food-producing species, in Slovakia ................................ 119
Figure 108. Import data by wholesalers (2011 and 2012) and sales to end-users (2013-2015) (mg/PCU) of 3rd- and 4th-generation cephalosporins, fluoroquinolones and polymyxins for food-producing species, in Slovakia ....................................................... 120
Figure 109. Sales (mg/PCU) by antimicrobial class for food-producing species, in Slovenia, from 2010 to 2015 ......................................................................................................... 121
Figure 110. Sales (mg/PCU) of 3rd- and 4th-generation cephalosporins, fluoroquinolones and polymyxins for food-producing species, in Slovenia, from 2010 to 2015 ........................... 122
Figure 111. Sales (mg/PCU) by antimicrobial class in Spain, from 2010 to 2015 ...................................... 123Figure 112. Sales (mg/PCU) of 3rd- and 4th-generation cephalosporins, fluoroquinolones
and polymyxins in Spain, from 2010 to 2015...................................................................... 124Figure 113. Sales (mg/PCU) by antimicrobial class in Sweden, from 2010 to 2015 ................................... 125Figure 114. Sales (mg/PCU) of 3rd- and 4th-generation cephalosporins, fluoroquinolones
and polymyxins in Sweden, from 2010 to 2015 .................................................................. 126Figure 115. Sales (mg/PCU) by antimicrobial class in Switzerland, from 2011 to 2015 .............................. 127Figure 116. Sales (mg/PCU) of 3rd- and 4th-generation cephalosporins, fluoroquinolones
and polymyxins in Switzerland, from 2011 to 2015 ............................................................. 128Figure 117. Sales (mg/PCU) by antimicrobial class in the United Kingdom, from 2010 to 2015 ................... 129Figure 118. Sales (mg/PCU) of 3rd- and 4th-generation cephalosporins, fluoroquinolones
and polymyxins in the United Kingdom, from 2011 to 2015 .................................................. 130Figure A1. Distribution of sales of tetracyclines, penicillins and sulfonamides for food-producing
animals, in mg/PCU, by the major pharmaceutical forms sold, aggregated by the 30 European countries, for 2015 ............................................................................ 143
Figure A2. Distribution of sales of the most important CIAs for food-producing animals, in mg/PCU, by the major pharmaceutical forms sold, aggregated by the 30 European countries, for 2015 ......................................................................................................... 144

List of tables
Table 1. Categories and ATCvet codes of antimicrobial veterinary medicinal products included in the data...17Table 2. Summary of information on years collecting data, legal basis for collecting data
at national level, national data providers, sources for ESVAC data and characteristics of data, by country, for 2015 ................................................................................................21
Table 3. Distribution of overall sales, in tonnes of active ingredient, split into tablets (used in companion animals) and all other pharmaceutical forms (used mainly in food-producing animals), by country, in 2015 .....................................................................25
Table 4. Sales, in tonnes of active ingredient, of veterinary antimicrobial agents marketed mainly for food-producing animals1, population correction unit (PCU) and sales in mg/PCU, by country, for 2015 ...........................................................................................................27
Table 5. Sales for food-producing animals, in mg per population correction unit (mg/PCU), of the various veterinary antimicrobial classes in the 30 European countries in 2015 ...................28
Table 6. Estimated PCU (in 1,000 tonnes) of the population of food-producing species, including horses, by country, for 2015 ................................................................................................50
Table 7. PCU domestic, net export and net import (1,000 tonnes) of animals for fattening or slaughter, respectively, in another MS and PCU (net balance) in 2015 used to analyse and report data ...................................................................................................52
Table 8. Annual sales of veterinary antimicrobial agents for food-producing species, in mg/PCU, for 30 European countries1, from 2010 to 2015 ......................................................................58

Table A1. Sales, in tonnes of active ingredient, of veterinary antimicrobial agents applicable mainly for food-producing animals by antimicrobial class (presented according to the ATCvet hierarchical system) by country, for 2015 (tablets not included) ......................... 134
Table A2. Distribution of sales, in mg/PCU, of veterinary antimicrobial agents applicable mainly for food-producing animals, by administration route/form and country, for 2015 ............ 135
Table A3. Percentage of sales, in mg/PCU, of premixes by veterinary antimicrobial class (according to ATCvet system) by country, for 2015 .............................................................. 136
Table A4. Percentages of sales, in mg/PCU, of oral powders by antimicrobial class (according to ATCvet system) by country, for 2015 .............................................................. 137
Table A5. Percentage of sales, in mg/PCU, of oral solutions by antimicrobial class (according to ATCvet system) by country, for 2015 .............................................................. 138
Table A6. Percentage of sales, in mg/PCU, of injection preparations by antimicrobial class (according to ATCvet system) by country, for 2015 .............................................................. 139
Table A7. Number of product presentations (product name, form, strength and pack size) containing 1, 2 and 3 antimicrobial agents sold, by country, for 2015 (tablets excluded from the data) ........................................................................................ 140
Table A8. Number of product presentations (product name, form, strength and pack size) of premixes, oral powders and oral solutions sold containing 1, 2 and 3 antimicrobial agents sold, by country, for 2015 ....................................................................................... 141
Table A9. Sales, in tonnes of active ingredient, of antimicrobial agents sold as premixes, oral powders and oral solutions containing 1, 2 and 3 active ingredients, by country, for 2015 ........................................................................................................ 142
Table A10. Variables reported to ESVAC for each antimicrobial veterinary medicinal product, for 2015 ........ 145Table A11. Conversion factors used to convert from international units (IU) to weight (mg)
of active ingredient, based on WHO standards .....................................................................147Table A12. Conversion factors used to convert from prodrug content to content of active ingredient ........... 147Table A13. Animal categories included in the calculation of the population correction unit (PCU)
and data types to be reported ........................................................................................... 148Table A14. Weights used to calculate the population correction unit ........................................................149Table A15. List of substances reported sold in ESVAC 2010-2015 ...........................................................150Table A16. Antimicrobial classes highlighted in the report and its classification .........................................153Table A17. List of ESVAC national contact points/alternates 2017 ...........................................................170Table A18. List of ESVAC sales advisory expert group members .............................................................177Table A19. List of ESVAC sales advisory expert group observers from the European Commission,
ECDC and EFSA ............................................................................................................... 178
Corrections: 30/10/2017 – Figures number 5, 48, 55, 61, A1 and A2 were updated to correspond to correct data. 30/10/2017 – The note on page 142 was updated to correspond to correct data.17/01/2018 – Figure 62 was updated to correspond to correct data.
Tables and charts in Annexes 1-8

Sales of veterinary antimicrobial agents in 30 European countries in 2015Seventh ESVAC report 13
SummaryKey findingsA total of 30 European countries — 29 European Union (EU)/European Economic Area (EEA) countries and Switzerland — submitted data on sales or prescriptions (two countries) of antimicrobial veterinary medicinal products (VMPs) to the European Medicines Agency for 2015. In the ESVAC participating countries, use of antimicrobials as growth promoters is not allowed. Note that ionophore coccidiostat feed additives are not included in the data.
A population correction unit (PCU) is applied as a proxy for the size of the food-producing animal population (including horses). The main indicator used in the current report to express the sales is milligrams active ingredient sold per population correction unit — mg/PCU.
A large difference in the sales, expressed as mg/PCU, was observed between the most- and least-selling countries (range 2.9 to 434.2 mg/PCU) for 2015; the average sales for all 30 countries which delivered data in 2015 is 135.5 mg/PCU.
Of the overall sales of antimicrobials in the 30 countries in 2015, the largest amounts, expressed as a proportion of mg/PCU, were accounted for by tetracyclines (32.8 %), penicillins (25.0 %) and sulfonamides (11.8 %). Overall, these three classes accounted for 69.6 % of total sales in the 30 countries. From the antimicrobial classes listed in the World Health Organization (WHO) list (5th revision (http://who.int/foodsafety/cia/en)) of the highest priority critically important antimicrobials (CIAs) for human medicine, the sales for food-producing animals of 3rd- and 4th-generation cephalosporins, fluoroquinolones5, polymyxins and macrolides accounted for 0.2 %, 2.1 %, 6.8 % and 7.2 %, respectively, of the total sales in the 30 countries participating in ESVAC in 2015. Overall, the sales of polymyxins (mg/PCU) accounted for 6.8 % of the total sales in the 30 countries, with only colistin representing all polymyxins.
The prescribing patterns of the various antimicrobial classes, expressed as mg/PCU, varied substantially between the countries. In 2015, notable variations were observed between countries in the proportion of 3rd- and 4th-generation cephalosporins, fluoroquinolones and polymyxins sold (mg/PCU), with sales ranging from <0.01 to 0.6 mg/PCU, <0.01 to 9.5 mg/PCU and 0 to 34.9 mg/PCU, respectively (Table 5).
Aggregated across the 30 countries, the sales (mg/PCU) of pharmaceutical forms for group treatment accounted for 91.2 % of the total sales - premixes accounted for 43.4 %, oral powders for 19.1 % and oral solutions for 28.6 %. The proportion accounted for by pharmaceutical forms for group treatment varied substantially between countries, ranging from 7 % to 97 %. Of pharmaceutical forms for treatment of individual animals (8.8 %), 8.0 % of the sales were accounted for by injectable preparations, 0.5 % by intramammary preparations and 0.3 % by oral pastes, boluses and intrauterine preparations.
For all 30 countries, the proportion of the total sales in 2015 of veterinary antimicrobials applicable for group treatment (oral powder, oral solution and premix) containing two or more active ingredients was relatively low. Of these pharmaceutical forms, 81.9 %, 17.5 % and 0.5 % contained one, two and three active ingredients, respectively.
It should be noted that in the previous ESVAC report, section 2.8 addressing trends did not include 2010 data as at the time of publication they were not available in the ESVAC BI database. Of the 30 ESVAC participating countries, 25 have delivered data since 2011 and sales trends during the study period for these countries are presented separately at aggregated level, e.g. in Figure 48.
In total, 25 countries have provided data for all years between 2011 and 2015. A fall in sales (in mg/PCU) of more than 5 % was observed in 15 of these countries, whilst there was an increase of more than 5 % in eight countries during the reference period (Table 8). The PCU was stable across the years, with only a 0.8 % increase in the total PCU for these 25 countries, and there was also an overall reduction of 12.7 % in the tonnes sold.
For the 25 countries reporting sales data to ESVAC for the years 2011-2015, an overall decline in sales (mg/PCU) of 13.4 % was observed. Sales fell from 163 mg/PCU in 2011 to 141 mg/PCU in 2015 (Figure 48).
A noticeable decrease in sales (mg/PCU) from 2011 to 2015 was identified for a few of the most-selling countries, which has had a significant impact on the observed 13.5 % reduction for these 25 countries during 2011-2015.
5 According to the WHO classification, fluoroquinolones are part of the highest priority CIA; however, the WHO web page (http://www.who.int/foodsafety/cia/en/) states that the wider group of quinolones are addressed.

Sales of veterinary antimicrobial agents in 30 European countries in 2015Seventh ESVAC report14
Concluding remarksVariations between the 30 countries on reported sales (mg/PCU) and on sales patterns for 2015 are likely to be due in part to differences in the composition of the animal population and in the production systems in various countries. There are considerable variations in terms of daily dose used for the various antimicrobial agents and pharmaceutical forms, period of treatment and prices. These factors may partly explain some of the differences in sales (mg/PCU) and sales patterns between the countries. In addition, differences in the selection of data sources may have an impact, although this is thought to be low. However, these factors can only partly explain the differences in the sales observed between the 30 countries, so other factors must also be considered.
The sales data for antimicrobial agents (numerator) cover all food-producing species (including horses), thus the animal population ‘at risk’ of being treated with antimicrobial agents (denominator) includes all food-producing species. However, the use of antimicrobial agents in the various animal species varies considerably: for example, the use of antimicrobial agents in extensive production systems, e.g. sheep and goats, is generally relatively low. Therefore, interpretation of the data should take into account the distribution of the PCU value between the species in the various countries.
It should be emphasised that the PCU only represents a technical unit of measurement and not a real value for the animal population that could potentially be treated with antimicrobial agents.
Tentative explanations provided by the countries (see Chapter 2.8.2) for the decline in sales across 2010 to 2015 include, among others, the implementation of responsible-use campaigns, changes in animal demographics, changes in systems for collecting data, restrictions of use, benchmarking, increased awareness of the threat of antimicrobial resistance, and/or the setting of targets.
Over the years, some countries have changed their national data-collection systems (e.g. Slovenia in 2013, Spain in 2014 and Romania 2015) and/or have identified under-reporting for some of the years (e.g. Bulgaria 2014, Spain 2014). This emphasises the fact that changes observed over the years should be interpreted with caution.
The substantial decline in the sales of antimicrobials for food-producing species observed for some countries indicate that there is also a potential for a decrease in other countries. In 2015, the European Commission (EC) published guidelines for the prudent use of antimicrobials in veterinary medicine6. The purpose of these guidelines is to provide practical guidance for Member States on the development and implementation of strategies to promote the prudent use of antimicrobials, especially antibiotics, in veterinary medicine. Following the request from the EC, the Joint EMA and EFSA Scientific Opinion specifically focusing on measures to reduce the need to use antimicrobial agents in animal husbandry in the European Union (EU), and the resulting impacts on food safety7, was published in January 2016.
The recently published JIACRA II report8, while recognising the complexity of evaluating the association between the sales and resistance of antimicrobials in animals and humans, confirms that the reduction of the sales of antimicrobials is a desirable objective to contain antimicrobial resistance.
6 http://ec.europa.eu/health/antimicrobial_resistance/docs/2015_prudent_use_guidelines_en.pdf 7 http://www.ema.europa.eu/docs/en_GB/document_library/Report/2017/01/WC500220032.pdf8 Available on the EMA webpage (www.ema.europa.eu) via: Home > Veterinary regulatory > Overview > Antimicrobial resistance >
Analysis of consumption and resistance (JIACRA): http://www.ema.europa.eu/docs/en_GB/document_library/Report/2017/07/WC500232336.pdf

Sales of veterinary antimicrobial agents in 30 European countries in 2015Seventh ESVAC report 15
IntroductionTerms of reference from the European CommissionIn 2008, the European Council, through the Council conclusions on antimicrobial resistance, called upon the Member States to strengthen surveillance systems and improve data quality on antimicrobial resistance and the consumption of antimicrobial agents within both the human and veterinary sectors. In response to the Council conclusions, the European Commission requested the European Medicines Agency to take the lead in the collection of data on sales of veterinary antimicrobial agents in the Member States. To guarantee an integrated approach, the Agency was requested to consult the European Centre for Disease Prevention and Control (ECDC), the European Food Safety Authority (EFSA) and the EU Reference Laboratory for Antimicrobial Resistance (EURL-AMR).
The European Surveillance of Veterinary Antimicrobial Consumption (ESVAC) project was launched in September 2009, following a request to develop an approach for the harmonised collection and reporting of data on the use of antimicrobial agents in animals in the Member States (SANCO/E2/KDS/rz D(2008) 520915). Through the terms of reference from the EC, the Agency was requested, among other activities:
• to identify the existing data/surveillance systems established for collection of sales and use of antibacterial drugs in the Member States;
• to develop a harmonised approach for the collection and reporting of data based on national sales figures, combined with estimations of usage in at least major groups of species;
• to collect the data from Member States and manage the database;
• to draft and publish a summary annual report presenting the data from Member States.
Regarding the data collection:
• comparability with the sale/use of antimicrobials in humans should be ensured.
About ESVAC activityThrough ESVAC activity, data are collected on sales of antimicrobial veterinary medicinal products (VMP) at package level from the EU Member States (MSs), EEA countries and Switzerland. Furthermore, in 2016, ESVAC established defined daily doses for animals (DDDvet) and defined course doses for animals (DCDvet) (EMA/224954/20169). The ESVAC activity also includes preparing for the collection of data by animal species by producing guidance for the collection of harmonised and standardised data from MSs on the use of antimicrobials by species10. The ESVAC Vision and Strategy 2016-2020 published on the Agency’s web page11 details the intended future development of the ESVAC activity.
Organisation of the ESVAC project is illustrated in Figure 1.
The core of the ESVAC sales activity is the ESVAC network of main national contact points (NCs) and alternates, nominated by the national competent authorities in the participating EU and EEA countries. The country and affiliation of the ESVAC main NCs/alternates can be found in Annex 8 of this report. The tasks of the ESVAC main NCs are to provide sales data to the ESVAC team at the EMA in response to annual data calls, to revise the data in terms of quality and validity, following requests from the ESVAC team, to validate the data applied to calculate the population correction unit, and to provide comments on the annual ESVAC report.
The ESVAC project is supported by an Expert Advisory Group which comprises representatives of the ESVAC main NCs or alternate network. There are also observers from the EC, European Centre for Disease Prevention and Control (ECDC) and the European Food Safety Authority (EFSA). The task of the ESVAC EG sales is to provide technical advice on surveillance of overall sales data of antimicrobial agents, including collection and analysis of data and preparation of the annual report. A list of the ESVAC EG members and observers can be found in Annex 9 of this report.
9 Available on the EMA website (www.ema.europa.eu) via: Home > Veterinary regulatory > Antimicrobial resistance > European Surveillance of Veterinary Antimicrobial Consumption > Units of measurement
10 Available on the EMA website (www.ema.europa.eu): http://www.ema.europa.eu/ema/doc_index.jsp?curl=pages/includes/document/document_detail.jsp?webContentId=WC500224492&murl=menus/document_library/document_library.jsp&mid=0b01ac058009a3dc
11 Available on the EMA website (www.ema.europa.eu) via: Home > Veterinary regulatory > Antimicrobial resistance > European Surveillance of Veterinary Antimicrobial Consumption (http://www.ema.europa.eu/docs/en_GB/document_library/Regulatory_and_procedural_guideline/2016/04/WC500204522.pdf)

Sales of veterinary antimicrobial agents in 30 European countries in 2015Seventh ESVAC report16
Figure 1. Organisation of the ESVAC project
Activities in the ESVAC project also include publication by ESVAC BI (Oracle Business Intelligence Enterprise Edition) of the core graphs and tables of the ESVAC sales reports available on the Agency’s website12.
12 ESVAC Interactive Database accessible via ESVAC activity web page: http://www.ema.europa.eu/ema/index.jsp?curl=pages/regulation/document_listing/document_listing_000302.jsp&mid=WC0b01ac0580153a00
National Networks ESVAC Main National
Contact Points(NCs)/Alternates
ESVAC Species NCs
Data Managers
ESVAC salesExpert Advisory
Group
ESVAC speciesExpert Advisory Group
ESVACDDDvet/DCDvetExpert Advisory
Group
European Surveillance of Veterinary Antimicrobial
Consumption (ESVAC)
at the European Medicines
Agency (EMA)
WHO Collaborating
Centre for Drug Statistics
Methodology
Other stakeholders
IFAH - Europe EGGVP
FVEAVCGIRP
COPA-COGECABEUC
Observers
EURL-AMRWHOOIEFDAFAO
European Commission
CVMP
ECDC; EFSA

Sales of veterinary antimicrobial agents in 30 European countries in 2015Seventh ESVAC report 17
1. Technical notes1.1. Veterinary antimicrobial medicinal products included in the data setsIn order to obtain harmonised data on sales of veterinary antimicrobial medicinal products from the ESVAC participating countries, the ESVAC protocol13 has defined which antimicrobials are to be included in the data sets by using the Anatomical Therapeutic Chemical classification system for veterinary medicinal products (ATCvet14) (Table 1). All pharmaceutical forms15 are included except dermatological preparations (ATCvet group QD) and preparations for sensory organs (ATCvet group QS). The contribution from these pharmaceutical forms, in tonnes of active ingredient, to the total amount of veterinary antimicrobials sold is minimal and thus the underestimation of sales is insignificant. It should be noted that antimicrobial growth promoters are not allowed to be used in ESVAC participating countries. Ionophore coccidiostat feed additives and veterinary medicines containing zinc oxide are not included in the data material.
To harmonise the reporting of sales of veterinary medicinal products with the data on sales of antimicrobial agents in human medicine, they are presented according to the classes/subclasses defined by the ATCvet hierarchical system, using WHO international non-proprietary names (INN), where available. If INNs have not been assigned, the ATCvet system applies either USAN (United States Adopted Names) or BAN (British Approved Names).
Table 1. Categories and ATCvet codes14 of antimicrobial veterinary medicinal products included in the data
1.2. Variables reported for each antimicrobial veterinary medicinal productDetailed information on the variables to be reported for each antimicrobial veterinary medicinal product is given in Annex 2 of this report, as well as in the ESVAC protocol and ESVAC data-collection form published on the Agency’s website16. In order to standardise the information, the following categories of pharmaceutical forms have been applied for reporting the sales data to ESVAC: boluses, injections, intramammary preparations for lactating cows, intramammary preparations for dry cow treatment, intrauterine preparations, oral solutions (includes powders for administration in drinking water), oral pastes, oral powders (powder to be administered with the feed), premixes (premix for medicated feeding stuff) and tablets (including capsules). It should be noted that when, for example, there are instructions such as “powder for solution” or “powder for administration in drinking water” on the name/label and/or SPC, this should be reported as an oral solution. Premixes are veterinary medicinal products, usually in the form of powders or granules, which are intended to be mixed into animal feed by feed mills.
1.3. Sales dataThe ESVAC participating countries provided the number of packages sold for each product presentation – i.e. name of VMP, pharmaceutical form, strength and pack size. The sales (in weight of active substance) for each product presentation were calculated by multiplying the number of packages sold by the amount of active ingredient (strength) in each package; in the case of combination preparations, the amount sold is calculated for all ingredients.
13 Available on the EMA website (www.ema.europa.eu): http://www.ema.europa.eu/docs/en_GB/document_library/Other/2010/04/WC500089584.pdf
14 www.whocc.no/atcvet/15 Includes premixes used to produce medicated feed.16 Available on the EMA website (www.ema.europa.eu) via: Home > Regulatory > Veterinary medicines > Overview > Antimicrobial
resistance > European Surveillance of Veterinary Antimicrobial Consumption.
Categories of veterinary antimicrobial agents ATCvet codes
Antimicrobial agents for intestinal use QA07AA; QA07AB
Antimicrobial agents for intrauterine use QG01AA; QG01AE; QG01BA; QG01BE; QG51AA; QG51AG
Antimicrobial agents for systemic use QJ01
Antimicrobial agents for intramammary use QJ51
Antimicrobial agents for antiparasitic use1 QP51AG1 Solely sulfonamides

Sales of veterinary antimicrobial agents in 30 European countries in 2015Seventh ESVAC report18
1.4. Denominator: population correction unit (PCU)The amounts of veterinary antimicrobial agents sold in the different countries are linked, among others, to the animal demographics in each country. The population correction unit (PCU) has been established as a denominator for the sales data. The data sources used and the methodology for the calculation of PCU are described comprehensively in Appendix 2 of the Agency’s report ‘Trends in the sales of veterinary antimicrobial agents in nine European countries: 2005-2009’ (EMA/238630/2011)17. Animal categories included in the calculation of the PCU and the weights used to calculate the PCU are described in Annex 3. It must be emphasised that the PCU is purely a surrogate for the animal population at risk.
1.4.1. Calculation of PCUThe PCU for each animal category is calculated by multiplying numbers of livestock animals (dairy cows, sheep, sows and horses) and slaughtered animals (cattle, goat, pigs, sheep, poultry, rabbits and turkeys) by the theoretical weight at the most likely time for treatment. However, due to the limited availability of living goat data in Eurostat, this category was not included when the PCU methodology was established for the first ESVAC report18. For countries with a relatively high number of goats compared to other food-producing animals, this results in an underestimate of the PCU. For animals exported or imported for fattening or slaughter (cattle, goat, pigs, sheep and poultry), the PCU was calculated by multiplying the number of animals by a standardised weight.
For farmed fish, Eurostat data are given only as live-weight slaughtered rather than numbers slaughtered, and the PCU is taken as biomass live-weight slaughtered in each country. The PCU of the animals exported for fattening or slaughter in another Member State was added to the PCU of livestock and slaughter animals in the country of origin because young animals are typically treated more frequently than other age classes. The PCU for animals imported for fattening or slaughter in another Member State was subtracted from the total PCU of livestock and slaughter animals, since it is included in the data on slaughter animals (Eurostat data) and to avoid double counting (counting by both the exporting and importing country).
The PCU is calculated for each species, weight class and/or production type, as follows:
PCU domestic
• Number of animals slaughtered × estimated weight at treatment.
• Number of livestock × estimated weight at treatment.
PCU export
• Number of animals transported to another country for fattening or slaughter × estimated weight at treatment.
PCU import
• Number of animals imported from another country for fattening or slaughter × estimated weight at treatment.
Total PCU is calculated as follows: PCU = total PCUDomestic + total PCUExport – total PCUImport
The total PCU by country is calculated according to the above data.
1 PCU = 1 kg of animal biomass.
17 Available on the EMA website (www.ema.europa.eu) via: Home > Veterinary regulatory > Overview > Antimicrobial resistance > European Surveillance of Veterinary Antimicrobial Consumption.
18 Trends in the sale of veterinary antimicrobial agents in nine European countries (http://www.ema.europa.eu/docs/en_GB/document_library/Report/2011/09/WC500112309.pdf).

Sales of veterinary antimicrobial agents in 30 European countries in 2015Seventh ESVAC report 19
1.4.2. Animal species and categories included in the PCU; selection of data sources
Eurostat, the Statistical Office of the European Union, covers data on numbers and biomass of food-producing animals slaughtered, as well as data on livestock food-producing animals. Therefore, Eurostat was selected as the source19 for data on this animal category. Where data were not available in Eurostat (e.g. for rabbits and fish), national statistics were applied. In addition, national statistics on animal categories were applied for Iceland, Norway and Switzerland. For horses (food-producing species according to EU legislation), national statistics provided by the ESVAC NCs were used. As data on dogs and cats are not available in all participating countries, these species were not included in the PCU, in order to have comparable data. As tablets are typically approved only for companion animals, they were excluded from the data sets prior to the normalisation of the sales by the PCU.
Animals exported for fattening or slaughter in another Member State are likely to have been treated with antimicrobial agents in the country of origin, and it is important to correct for this for the major species (cattle, pigs, poultry and sheep). The Eurostat data on numbers of animals exported or imported for fattening or slaughter might not be complete, as exports and imports are only reported above a certain amount. Therefore, data were obtained from TRACES (TRAde Control and Expert System run by the European Commission’s DG SANTE), as these are based on health certificates, which are obligatory for all animals crossing any border, and thus the data are complete.
In cases where the deviation between the Eurostat data and/or TRACES data and national statistics was more than 5 %, several countries provided national statistics for calculating the PCU.
1.5. Correction of historical dataNote that subsequent to the correction of historical data, the updated values were published in the ESVAC Interactive Database as soon as they were validated and approved by MSs.
1.5.1. Sales dataMinor revisions have been made to the 2014 sales for four countries: Croatia identified an error in the reported number of packages sold for three products; Ireland identified an error in the number of packages sold for two intramammary preparations; Italy identified an error for one premix, for which tonnes were reported instead of number of packages. The changes in tonnes and thus mg/PCU in these countries were minor compared to the data published in the ESVAC 2014 report. For Romania, it was identified that some wholesalers failed to report a considerable number of VMPs for the 2014 sales dataset; and after the publication of the previous report 2014, data for Romania has been updated (for more details, see Chapter 2.8.2).
1.5.2. PCU dataMinor changes have been introduced to the PCU figures compared to the ESVAC 2014 report. For Estonia, the broilers data were revised for all previous years 2010-2014. However, since only a minor decrease in the annual PCU was observed, the increase in mg/PCU was insignificant.
1.6. Quality check and validation of the sales and PCU dataThe ESVAC participating countries uploaded sales data directly using a web-based submission tool (ESVAC web application) designed for this purpose. Automated warning and error messages are displayed instantaneously when any of the figures uploaded do not meet standardisation requirements. To endorse the data validation, reports are created using the ESVAC BI application. Furthermore, data were also checked by the ESVAC team to identify outliers, mainly by checking against data published for previous years.
Reference data for the denominator (PCU) gathered by the Agency from the Eurostat database and TRACES are uploaded in the ESVAC web application. The data are subsequently validated by ESVAC participating countries. To ensure data quality and validity, the PCU data are displayed in the ESVAC BI reports in a way that allows for a comparison with values per each animal category and the overall PCU approved for previous years. Possible outliers are cross-checked and addressed with each ESVAC representative until final agreement is reached.
19 http://epp.eurostat.ec.europa.eu/portal/page/portal/statistics/themes

Sales of veterinary antimicrobial agents in 30 European countries in 2015Seventh ESVAC report20
1.7. Analysis and reporting of the dataBased on the assumption that tablets are almost solely used for companion animals (boluses in food-producing animals), tablets are excluded from the dataset used to report sales for food-producing animals. In this report, sales data for tablets is reported separately as sales for use in companion animals; all other pharmaceutical forms are reported as sold for use in food-producing animals, including horses. In the current report, the term ‘group treatment’ is used for medication via feed or water; intramammary preparations for lactating cows and for dry cow treatment are reported aggregated.
The main indicator applied in this report to express the consumption of veterinary antimicrobials is mg active ingredient normalised by the population correction unit (mg/PCU):
Amount sold in tonnes × 109
PCU in kg
In this report, the term food-producing species includes horses. The data are presented according to the classes/subclasses defined by the ATCvet hierarchical system. For combination preparations, each active ingredient is reported according to the ATCvet class/subclass name for each single substance in question. Maps on the spatial consumption of the various veterinary antimicrobial agents were created using Adobe Illustrator CC 2015.
It should be noted that data presented in this report are calculated using the exact sales figures for each product (five decimals), but in the tables and graphs the numbers are aggregated and rounded. Therefore, the totals in the tables, for example, may differ slightly from the more detailed data presented in the figures.
All data presented in this report reflect the datasets available at 30 June 2017; any updates made to the data at a later stage are not included in the data analyses.
1.8. Summary of included data sources/types, by countryInformation concerning the years of collecting data, legal basis for the data collection at national level, systems for distribution of antimicrobial VMPs, sources from which the data were obtained, type of data, and the data included by country are shown in Table 2.

Sales of veterinary antimicrobial agents in 30 European countries in 2015Seventh ESVAC report 21
Tab
le 2
. S
umm
ary
of in
form
atio
n on
yea
rs c
olle
ctin
g da
ta,
lega
l bas
is f
or c
olle
ctin
g da
ta a
t na
tiona
l lev
el,
natio
nal d
ata
prov
ider
s, s
ourc
es for
ESVA
C d
ata
and
char
acte
rist
ics
of d
ata,
by
coun
try,
for
201
5
Cou
ntr
yY
ears
co
llect
ing
d
ata
Leg
al b
asis
Nat
ion
al d
ata
pro
vid
er t
o ES
VA
CS
ourc
es f
or
ESV
AC
dat
a (a
pp
rox.
no)
Sal
es d
ata,
p
resc
rip
tion
dat
a or
p
urc
has
e d
ata1
Sal
es b
etw
een
w
hol
esal
ers
and
/or
MA
Hs2
ex
clu
ded
(Y
es/
No)
Pro
du
cts
sold
on
sp
ecia
l lic
ence
in
clu
ded
(Y
es/
No)
Aus
tria
>5
year
sM
anda
tory
to
rep
ort
Aus
tria
n Age
ncy
for
Hea
lth a
nd F
ood
Saf
ety
MAH
s (n
=9)
; W
hole
sale
rs
(n=
9)
Sal
es t
o ve
terina
rian
s,
phar
mac
ies
Yes
No
Bel
gium
>5
year
sM
anda
tory
to
rep
ort
Fede
ral A
genc
y fo
r M
edic
ines
and
Hea
lth
Prod
ucts
Who
lesa
lers
(n
=25
); F
eed
mill
s (n
=57
)
Sal
es t
o ve
terina
rian
s an
d ph
arm
acie
s.
Sal
es b
y fe
ed m
ills
to
farm
ers
Yes
Yes
Bul
garia
5 ye
ars
Not
man
dato
ryBul
garian
Foo
d Saf
ety
Age
ncy
Who
lesa
lers
(n
=36
);Sal
es t
o ve
terina
rian
s,
farm
ers
and
phar
ma-
cies
Yes
No
Cro
atia
2 ye
ars
Man
dato
ry
to r
epor
tM
inis
try
of A
gric
ultu
re,
Vete
rina
ry D
irec
tora
teW
hole
sale
rs
(n=
18)
Sal
es t
o ph
arm
acie
s an
d ve
terina
rian
sYe
sN
o
Cyp
rus
5 ye
ars
Man
dato
ry
to r
epor
t M
inis
try
of A
gric
ultu
re,
Nat
ural
Res
ourc
es a
nd
Envi
ronm
ent -
Vete
rinar
y Se
rvic
es
Who
lesa
lers
(n
=21
)Sal
es t
o ph
arm
acie
s an
d ve
terina
ry c
linic
sYe
sYe
s
Cze
ch R
epub
lic>
5 ye
ars
Man
dato
ry
to r
epor
tIn
stitu
te f
or S
tate
Con
trol
of
Vete
rina
ry
Bio
logi
cals
and
Med
i-ci
nes
Who
lesa
lers
(n
=93
);Fe
ed m
ills
(n=
47)
Sal
es t
o ve
terina
-rian
s, p
harm
acie
s an
d fa
rmer
s. S
ales
by
feed
m
ills
to far
mer
s
Yes
Yes
(<0.
1 %
)
Den
mar
k>
5 ye
ars
Man
dato
ry
to r
epor
tD
anis
h Ve
terina
ry a
nd
Food
Adm
inis
trat
ion
VetS
tat
(n=
1)
obta
inin
g da
ta
from
pha
rmac
ies
(n=
350)
, ve
teri-
narian
s (n
=15
0),
feed
mill
s (n
=3)
Pres
crip
tion
data
fro
m
phar
mac
ies,
vet
erin
a-rian
s di
stribu
tors
and
fe
ed m
ills
Yes
Yes
(0.1
%)
Esto
nia
>5
year
s M
anda
tory
to
rep
ort
Sta
te A
genc
y of
M
edic
ines
Who
lesa
lers
(n
=10
)Sal
es t
o ve
terina
rian
s an
d ph
arm
acie
sYe
sYe
s (0
.5 %
of
tonn
es s
old)
Finl
and
>5
year
sM
anda
tory
to
rep
ort
Finn
ish
Med
icin
es
Age
ncy
Who
lesa
lers
(n
=1)
;Fe
ed m
ills
(n=
1);
Impo
rter
s of
m
edic
ated
fee
d (n
=1)
Sal
es t
o ph
arm
acie
s an
d ve
terina
rian
sYe
sYe
s

Sales of veterinary antimicrobial agents in 30 European countries in 2015Seventh ESVAC report22
Cou
ntr
yY
ears
co
llect
ing
d
ata
Leg
al b
asis
Nat
ion
al d
ata
pro
vid
er t
o ES
VA
CIm
por
ters
of
med
icat
ed f
eed
(n
=1
)
Sal
es d
ata,
p
resc
rip
tion
dat
a or
p
urc
has
e d
ata1
Sal
es b
etw
een
w
hol
esal
ers
and
/or
MA
Hs2
ex
clu
ded
(Y
es/
No)
Pro
du
cts
sold
on
sp
ecia
l lic
ence
in
clu
ded
(Y
es/
No)
Fran
ce>
5 ye
ars
Man
dato
ry t
o re
port
Nat
iona
l Age
ncy
for
Vete
rina
ry M
edic
inal
Pr
oduc
ts (
Ans
es-A
NM
V)
MAH
s (n
=55
)Sal
es t
o ve
terina
rian
s,
phar
mac
ies,
who
lesa
-le
rs a
nd fee
d m
ills
Not
app
licab
leYe
s
Ger
man
y5
year
sM
anda
tory
to
repo
rtFe
dera
l Offi
ce o
f Con
sum
er P
rote
ctio
n an
d Fo
od S
afet
y
MAH
s (n
=34
);
Who
lesa
lers
(n
=19
);
PSU
Rs3
dat
a fo
r pr
emix
Sal
es t
o ve
terina
rian
sYe
sN
o
Gre
ece
1 ye
arM
anda
tory
to
repo
rtG
reek
Nat
iona
l O
rgan
isat
ion
for
Med
icin
es
MAH
s (n
=39
)4Sal
es t
o w
hole
sale
rs
and
reta
ilers
Yes
No
Hun
gary
>5
year
sN
ot m
anda
tory
Nat
iona
l Foo
d Cha
in
Safe
ty O
ffice
Direc
tora
te
of V
eter
inar
y M
edic
inal
Pr
oduc
ts
Who
lesa
lers
(n
=73
)Sal
es t
o ve
terina
rian
s,
feed
mill
s, far
mer
s an
d re
taile
rs
Yes
No
Icel
and
>5
year
s M
anda
tory
to
repo
rtIc
elan
dic
Med
icin
es
Age
ncy
Who
lesa
lers
(n
=2)
Sal
es b
y w
hole
sale
rs
to v
eter
inar
ians
and
ph
arm
acie
s
Yes
Yes
Irel
and
>5
year
sM
anda
tory
to
repo
rtH
ealth
Pro
duct
s Re
gula
tory
Aut
hority
MAH
s (n
=66
)Sal
es t
o ph
arm
acie
s or
vet
erin
aria
ns,
far-
mer
s an
d w
hole
sale
rs
with
in t
he c
ount
ry
Yes
No
Ital
y>
5 ye
ars
Man
dato
ry t
o re
port
Ital
ian
Min
istr
y
of H
ealth
MAH
s (n
=48
)Sal
es t
o w
hole
sa-
lers
, ph
arm
acie
s,
feed
mill
s, a
nd far
ms
auth
oris
ed t
o pr
oduc
e m
edic
ated
fee
d fo
r se
lf-co
nsum
ptio
n
No
No
Latv
ia>
5 ye
ars
Man
dato
ry t
o re
port
Food
and
Vet
erin
ary
Ser
vice
Who
lesa
lers
(n
=24
)Sal
es t
o ph
arm
acie
s,
vete
rina
rian
s, v
e-te
rina
ry c
linic
s an
d fa
rmer
s
Yes
No
Lith
uani
a>
5 ye
ars
Man
dato
ry t
o re
port
Sta
te F
ood
and
Vete
rina
ry S
ervi
ceW
hole
sale
rs
(n=
43)
Sal
es t
o ph
arm
acie
s,
vete
rina
rian
s an
d fa
rmer
s
Yes
No

Sales of veterinary antimicrobial agents in 30 European countries in 2015Seventh ESVAC report 23
Cou
ntr
yY
ears
co
llect
ing
d
ata
Leg
al b
asis
Nat
ion
al d
ata
pro
vid
er t
o ES
VA
CS
ourc
es f
or
ESV
AC
dat
a (a
pp
rox.
no)
Sal
es d
ata,
p
resc
rip
tion
dat
a or
p
urc
has
e d
ata1
Sal
es b
etw
een
w
hol
esal
ers
and
/or
MA
Hs2
ex
clu
ded
(Y
es/
No)
Pro
du
cts
sold
on
sp
ecia
l lic
ence
in
clu
ded
(Y
es/
No)
Luxe
mbo
urg
4 ye
ars
Man
dato
ry t
o re
port
Min
istr
y of
Hea
lthW
hole
sale
rs
(n=
4)Sal
es t
o ph
arm
acie
s,
vete
rina
rian
sYe
sYe
s (6
0 %
)
Net
herlan
ds>
5 ye
ars
Not
man
dato
ryFe
dera
tion
of t
he D
utch
Ve
terina
ry P
harm
aceu
-tic
al I
ndus
try
(FID
IN)
MAH
s (n
=18
)Sal
es t
o w
hole
sale
rs
and
vete
rina
rian
sYe
sN
o
Nor
way
>5
year
sM
anda
tory
to
repo
rtN
orw
egia
n Ve
terina
ry
Inst
itute
Who
lesa
lers
(n
=5)
Fe
ed m
ills
(n=
2)
Sale
s to
pha
rmac
ies,
ve
terin
aria
ns a
nd fe
ed
(fee
d m
ills
deliv
er V
MPs
on
ly to
fish
farm
ers)
Yes
Yes
Pola
nd5
year
sM
anda
tory
to
repo
rtM
inis
try
of A
gric
ultu
re
and
Rur
al D
evel
opm
ent
Who
lesa
lers
(n
=12
6)Sal
es t
o ve
terina
rian
sYe
sYe
s
Port
ugal
>5
year
sM
anda
tory
to
repo
rt
Gen
eral
Direc
tora
te f
or
Food
and
Vet
erin
ary
Affai
rs
Who
lesa
lers
(n
=70
)Sal
es t
o re
taile
rs,
ve-
terina
rian
s, far
mer
s,
prod
ucer
org
ani-
satio
ns,
vete
rina
ry
clin
ics
and
feed
mill
s
Yes
Not
app
licab
le
Rom
ania
2 ye
ars
Man
dato
ry t
o re
port
Inst
itute
for
Con
trol
of
Bio
logi
cal P
rodu
cts
and
Vete
rina
ry M
edic
ines
MAH
s (n
=65
)5Sal
es t
o ph
arm
acie
s,
vete
rina
rian
s an
d fa
rmer
s
Yes
No
Slo
vaki
a5
year
sM
anda
tory
to
repo
rtIn
stitu
te f
or S
tate
Con
trol
of
Vete
rina
ry
Bio
logi
cals
and
M
edic
amen
ts
Who
lesa
lers
(n
=46
)Sal
es t
o ve
terina
rian
s,
phar
mac
ies,
med
i-ca
ted
feed
mill
s an
d fa
rmer
s
Yes
No
Slo
veni
a>
5 ye
ars
Man
dato
ry t
o re
port
Adm
inis
trat
ion
of t
he
Repu
blic
of
Slo
veni
a fo
r Fo
od S
afet
y, V
eter
inar
y Sec
tor
and
Plan
t Pr
o-te
ctio
n (A
FSVSPP
)
Who
lesa
lers
(n
=11
)Sal
es t
o ph
arm
acie
s,
feed
mill
s an
d ve
teri-
narian
s
Yes
Yes
(12
%)
Spa
in>
5 ye
ars
Not
man
dato
rySpa
nish
Age
ncy
for
Med
icin
es a
nd H
ealth
Pr
oduc
ts
MAH
s (n
=51
)Sal
es t
o w
hole
sale
rs
and
reta
ilers
, i.e
. ve
-te
rina
ry o
rgan
isat
ions
an
d ph
arm
acie
s
No
No

Sales of veterinary antimicrobial agents in 30 European countries in 2015Seventh ESVAC report24
Cou
ntr
yY
ears
co
llect
ing
d
ata
Leg
al b
asis
Nat
ion
al d
ata
pro
vid
er t
o ES
VA
CS
ourc
es f
or
ESV
AC
dat
a (a
pp
rox.
no)
Sal
es d
ata,
p
resc
rip
tion
dat
a or
p
urc
has
e d
ata1
Sal
es b
etw
een
w
hol
esal
ers
and
/or
MA
Hs2
ex
clu
ded
(Y
es/
No)
Pro
du
cts
sold
on
sp
ecia
l lic
ence
in
clu
ded
(Y
es/
No)
Swed
en>
5 ye
ars
Man
dato
ry t
o re
port
Nat
iona
l Vet
erin
ary
Inst
itute
and
Sw
edis
h Boa
rd o
f Agr
icul
ture
The
Swed
ish
eHea
lth A
genc
y (n
=1)
obt
aini
ng
data
fro
m p
har-
mac
ies
Dis
pens
ed p
resc
rip-
tions
Yes
Yes
(aro
und
5 %
of to
tal
tonn
es
of a
ctiv
e su
bsta
nce)
Switz
erla
nd>
5 ye
ars
Man
dato
ry t
o re
port
Fede
ral O
ffice
of
Food
Saf
ety
and
Vete
rina
ry
Affai
rs
MAH
s (n
=16
)Sal
es t
o ve
terina
rian
s,
phar
mac
ies,
med
i-ca
ted
feed
mill
s
No
No
Uni
ted
Kin
gdom
>5
year
sM
anda
tory
to
repo
rtVe
terina
ry M
edic
ines
D
irec
tora
teM
AH
s (n
=63
)Sal
es t
o w
hole
sale
rs,
vete
rina
rian
s, far
mer
s an
d ve
terina
ry p
har-
mac
ies
Yes
No
1 Pu
rcha
se/i
mpo
rt d
ata
from
, e.
g.,
phar
mac
eutic
al in
dust
ry a
nd/o
r fr
om w
hole
sale
rs in
oth
er c
ount
ries
. 2 M
AH
s =
mar
ketin
g au
thor
isat
ion
hold
ers.
3 PS
URs
= p
erio
dic
safe
ty u
pdat
e re
port
s.
4 N
eglig
ible
sal
es f
rom
a f
ew M
AH
s w
ith a
ver
y sm
all m
arke
t sh
are,
and
whi
ch d
o no
t ha
ve lo
cal r
epre
sent
ativ
es in
Gre
ece,
are
not
incl
uded
in t
he d
atas
et.
5 Sin
ce 2
015,
dat
a ha
ve b
een
colle
cted
fro
m M
AH
s, w
hile
for
201
4 th
e da
ta w
ere
obta
ined
fro
m M
AH
s an
d w
hole
sale
rs.

Sales of veterinary antimicrobial agents in 30 European countries in 2015Seventh ESVAC report 25
2. Results2.1. Overall sales (tonnes) of veterinary antimicrobial agentsThe overall national sales data cover sales of antimicrobial VMPs for use in food-producing animals, including horses (all pharmaceutical forms except tablets) plus sales of tablets that are used almost solely in companion animals. Injectable veterinary antimicrobial agents are also used in companion animals. As injectable presentations are frequently marketed for both food-producing and companion animals and their use in companion animals is minor in terms of weight of active ingredient, such sales are included in the statistics for food-producing animals. Sales of tablets, and therefore use in companion animals, accounted for a minor proportion of the total sales of veterinary antimicrobial agents in 2015, except in Finland, Iceland, Luxembourg, Norway, Slovenia and Sweden, where they represented 13.6 %, 5.2 %, 6.2 %, 8.8 %, 8.1 % and 8.8 % of the total sales, respectively (Table 3, Figure 2). Overall, sales of tablets in the 30 countries represented 0.7 % of the total sales in tonnes.
Table 3. Distribution of overall sales, in tonnes of active ingredient, split into tablets (used in companion animals) and all other pharmaceutical forms (used mainly in food-producing animals), by country, in 2015
CountryTablets All other pharmaceutical forms Total tonnes
Tonnes % of overall sales
Tonnes % of overall sales
Austria 0.3 0.6 % 48.5 99.4 % 48.8
Belgium 1.9 0.7 % 258.1 99.3 % 260.1
Bulgaria 0.5 1.0 % 46.3 99.0 % 46.8
Croatia 0.3 1.2 % 27.9 98.8 % 28.2
Cyprus 0.1 0.1 % 46.9 99.9 % 46.9
Czech Republic 1.1 2.2 % 47.5 97.8 % 48.6
Denmark 0.8 0.8 % 101.9 99.2 % 102.8
Estonia 0.1 1.6 % 8.1 98.4 % 8.2
Finland 1.7 13.6 % 10.6 86.4 % 12.3
France 12.3 2.4 % 501.5 97.6 % 513.8
Germany 7.1 0.8 % 851.1 99.2 % 858.2
Greece 0.5 0.7 % 72.6 99.3 % 73.1
Hungary 0.3 0.2 % 176.0 99.8 % 176.3
Iceland 0.03 5.2 % 0.6 94.8 % 0.6
Ireland 0.6 0.6 % 96.4 99.4 % 97.0
Italy 9.7 0.7 % 1,300.0 99.3 % 1,309.7
Latvia 0.1 1.3 % 6.8 98.7 % 6.9
Lithuania 0.04 0.3 % 11.9 99.7 % 11.9
Luxembourg 0.1 6.2 % 1.8 93.8 % 1.9
Netherlands 2.8 1.3 % 213.7 98.7 % 216.5
Norway 0.5 8.8 % 5.6 91.2 % 6.1
Poland 2.3 0.4 % 582.5 99.6 % 584.8
Portugal 0.7 0.5 % 134.0 99.5 % 134.6
Romania 2.3 0.9 % 257.2 99.1 % 259.6
Slovakia 0.2 1.4 % 13.3 98.6 % 13.4
Slovenia 0.4 8.1 % 4.6 91.9 % 5.0
Spain 1.9 0.1 % 3,027.8 99.9 % 3,029.8
Sweden 0.9 8.8 % 9.6 91.2 % 10.5
Switzerland 0.1 0.2 % 41.2 99.8 % 41.3
United Kingdom 12.8 3.1 % 394.9 96.9 % 407.7
Total 30 countries 62.4 0.7 % 8,298.9 99.3 % 8,361.3

Sales of veterinary antimicrobial agents in 30 European countries in 2015Seventh ESVAC report26
Figure 2. Distribution of sales, in tonnes of active ingredient, split into tablets (used almost solely in companion animals) and all other pharmaceutical forms (used mainly in food-producing animals), by country, for 2015.
2.2. Population-corrected sales for food-producing animals, including horses, by antimicrobial class
The sales of veterinary antimicrobial agents, expressed as mg sold per population correction unit (PCU), ranged from 2.9 mg/PCU to 434.2 mg/PCU across the 30 countries. The sales patterns of the antimicrobial classes also varied substantially between the countries (Table 5, Figure 3).
0%
10%
20%
30%
40%
50%
60%
70%
80%
90%
100%Au
stria
Belg
ium
Bulg
aria
Cro
atia
Cyp
rus
Cze
ch R
epub
licD
enm
ark
Esto
nia
Finl
and
Fran
ceG
erm
any
Gre
ece
Hun
gary
Icel
and
Irel
and
Ital
yLa
tvia
Lith
uani
aLu
xem
bour
gN
ethe
rlan
dsN
orw
ayPo
land
Port
ugal
Rom
ania
Slov
akia
Slov
enia
Spai
nSw
eden
Switz
erla
ndU
nite
d Ki
ngdo
m
All other pharmaceutical form Tablets

Sales of veterinary antimicrobial agents in 30 European countries in 2015Seventh ESVAC report 27
Table 4. Sales, in tonnes of active ingredient, of veterinary antimicrobial agents marketed mainly for food-producing animals1, population correction unit (PCU) and sales in mg/PCU, by country, for 2015
Country Sales (tonnes) for food-producing animals
PCU (1,000 tonnes) mg/PCU
Austria 48.5 957 50.7
Belgium 258.1 1,719 150.1
Bulgaria 46.3 380 121.9
Croatia 27.9 274 101.6
Cyprus 46.9 108 434.2
Czech Republic 47.5 698 68.1
Denmark 101.9 2,415 42.2
Estonia 8.1 123 65.2
Finland 10.6 519 20.4
France 501.5 7,147 70.2
Germany 851.1 8,690 97.9
Greece 72.6 1,268 57.2
Hungary 176.0 833 211.4
Iceland 0.6 116 5.0
Ireland 96.4 1,892 51.0
Italy 1,300.0 4,038 322.0
Latvia 6.8 180 37.6
Lithuania 11.9 339 35.1
Luxembourg 1.8 53 34.6
Netherlands 213.7 3,318 64.4
Norway 5.6 1,912 2.9
Poland 582.5 4,193 138.9
Portugal 134.0 997 134.4
Romania 257.2 2,559 100.5
Slovakia 13.3 246 53.8
Slovenia 4.6 173 26.4
Spain 3,027.8 7,532 402.0
Sweden 9.6 808 11.8
Switzerland 41.2 815 50.6
United Kingdom 394.9 6,961 56.7
1 Tablets excluded as used almost solely in companion animals; injectable antimicrobial VMPs can also be used in companion animals; a few other products may solely be used in companion animals, but as their proportional use is minor, these are included in the sales for food-producing animals.

Sales of veterinary antimicrobial agents in 30 European countries in 2015Seventh ESVAC report28
Tab
le 5
. S
ales
for
foo
d-pr
oduc
ing
anim
als,
in m
g pe
r po
pula
tion
corr
ectio
n un
it (m
g/PC
U),
of
the
variou
s ve
terina
ry a
ntim
icro
bial
cla
sses
in
the
30
Euro
pean
cou
ntries
in 2
0151
Tetracyclines
Amphenicols
Penicillins
1st- and 2nd-gen. cephalosporins
3rd- and 4th-gen. cephalosporins
Sulfonamides
Trimethoprim
Macrolides
Lincosamides
Fluoroquinolones
Other quinolones
Aminoglycosides
Polymyxins
Pleuromutilins
Others*
Total mg/PCU
Aus
tria
27.7
0.4
8.5
0.05
0.2
4.2
0.8
4.1
0.4
0.5
01.
41.
60.
40.
450
.7Bel
gium
34.8
1.2
46.3
0.1
0.4
35.9
7.2
9.8
3.3
1.0
1.3
0.3
2.8
0.6
5.2
150.
1Bul
garia
60.2
3.8
15.5
0.03
0.2
9.7
1.1
13.6
1.2
5.3
0.4
5.0
3.6
1.5
0.8
121.
9Cro
atia
41.4
4.4
21.5
0.6
0.2
13.8
2.1
2.2
0.2
3.5
0.8
6.5
2.6
1.6
0.3
101.
6Cyp
rus
183.
33.
445
.4<
0.01
0.3
59.1
11.3
21.1
64.4
1.1
0.4
4.7
12.4
24.5
2.7
434.
2Cze
ch R
epub
lic24
.10.
517
.30.
30.
411
.11.
23.
40.
21.
70.
052.
41.
03.
90.
468
.1D
enm
ark
11.8
0.5
11.8
0.02
0.01
4.3
0.7
4.5
1.0
<0.
010.
41.
40.
54.
01.
242
.2Es
toni
a15
.60.
328
.70.
20.
60.
80.
22.
80.
81.
80
3.2
1.3
7.5
1.4
65.2
Finl
and
4.3
0.2
9.6
0.04
0.01
3.8
0.8
1.1
0.2
0.1
00.
10
0.06
020
.4Fr
ance
26.2
0.5
8.3
0.2
0.2
14.7
2.2
5.0
0.4
0.3
0.4
6.2
4.1
0.8
0.7
70.2
Ger
man
y26
.80.
638
.80.
10.
48.
21.
06.
21.
31.
10
1.8
9.2
1.6
1.0
97.9
Gre
ece
23.9
0.2
11.4
00.
16.
81.
13.
00.
41.
72.
61.
93.
40.
20.
557
.2H
unga
ry97
.72.
746
.90.
20.
411
.72.
47.
15.
59.
50.
22.
39.
612
.42.
921
1.4
Icel
and
0.4
03.
30
<0.
010.
30.
10
00
00.
90
00
5.0
Irel
and2
21.7
1.0
10.0
0.3
0.1
10.2
0.9
2.9
0.2
0.4
03.
00.
351
.0It
aly
93.0
4.7
87.3
0.2
0.4
36.5
4.6
29.1
15.0
2.9
3.3
4.6
26.1
9.6
4.7
322.
0La
tvia
10.9
0.04
10.5
0.2
0.4
1.8
0.4
3.8
0.1
1.1
0.01
3.6
0.9
3.6
0.3
37.6
Lith
uani
a4.
50.
310
.30.
20.
18.
01.
92.
10.
51.
70.
22.
00.
62.
50.
235
.1Lu
xem
bour
g12
.31.
26.
80.
10.
65.
11.
00.
90.
60.
70.
11.
21.
50.
12.
334
.6N
ethe
rlan
ds27
.01.
413
.30.
03<
0.01
10.7
2.0
6.9
0.1
0.1
1.2
0.7
0.5
0.3
0.3
64.4
Nor
way
0.1
0.1
1.6
0<
0.01
0.7
0.1
<0.
010
0.01
0.04
0.2
00.
040
2.9
Pola
nd42
.91.
544
.50.
40.
110
.51.
28.
70.
98.
60.
025.
55.
97.
30.
913
8.9
Port
ugal
47.4
1.2
25.1
0.1
0.4
4.6
0.9
17.1
2.8
7.9
0.1
3.8
12.1
9.2
1.5
134.
4Ro
man
ia26
.93.
217
.70.
010.
044.
50.
913
.46.
46.
10.
210
.47.
42.
50.
810
0.5
Slo
vaki
a15
.00.
38.
20.
30.
36.
30.
74.
10.
52.
90.
021.
91.
19.
22.
753
.8Slo
veni
a2.
60.
611
.70.
10.
23.
00.
60.
90.
33.
00.
012.
60.
10.
20.
426
.4Spa
in13
4.9
4.6
92.6
0.1
0.3
45.4
8.8
23.7
18.6
9.0
0.8
15.1
34.9
9.9
3.4
402.
0Sw
eden
0.8
0.1
7.5
<0.
01<
0.01
2.0
0.4
0.4
<0.
010.
020
0.3
0.1
0.2
011
.8Sw
itzer
land
310
.90.
211
.30.
10.
218
.31.
13.
20.
50
3.8
0.6
0.2
50.6
Uni
ted
Kin
gdom
23.8
0.4
10.0
0.1
0.2
8.1
1.6
5.5
0.9
0.3
02.
00.
12.
31.
456
.7
* O
ther
ant
ibac
terial
s (b
acitr
acin
, fo
sfom
ycin
, fu
ralta
done
, m
etro
nida
zole
, no
vobi
ocin
, pa
rom
omyc
in,
rifa
xim
in a
nd s
pect
inom
ycin
, cl
assi
fied
as ‘O
ther
ant
ibac
terial
s’ in
the
ATC
vet
syst
em).
1
For
the
coun
trie
s w
ere
the
inje
ctab
le 3
rd-
and
4th-
gen.
cep
halo
spor
ins
are
alm
ost
sole
ly m
arke
ted
for
dogs
and
cat
s, t
he d
ata
prov
ides
a c
onsi
dera
ble
over
estim
ate
for
food
-pro
duci
ng a
nim
als.
2 Po
lym
yxin
s an
d pl
euro
mut
ilins
are
agg
rega
ted
with
‘Oth
ers’
for
rea
sons
of co
mm
erci
al c
onfid
entia
lity.
3 Fo
r co
nfide
ntia
lity
reas
ons,
ple
urom
utili
ns a
re g
roup
ed w
ith o
ther
s an
d lin
cosa
mid
es a
re g
roup
ed w
ith m
acro
lides
.
Cou
ntr
y

Sales of veterinary antimicrobial agents in 30 European countries in 2015Seventh ESVAC report 29
* O
ther
ant
ibac
terial
s (b
acitr
acin
, fo
sfom
ycin
, fu
ralta
done
, m
etro
nida
zole
, no
vobi
ocin
, pa
rom
omyc
in,
rifa
xim
in a
nd s
pect
inom
ycin
, cl
assi
fied
as ‘O
ther
ant
ibac
terial
s’ in
the
ATC
vet
syst
em).
1
For
the
coun
trie
s w
ere
the
inje
ctab
le 3
rd-
and
4th-
gen.
cep
halo
spor
ins
are
alm
ost
sole
ly m
arke
ted
for
dogs
and
cat
s, t
he d
ata
prov
ides
a c
onsi
dera
ble
over
estim
ate
for
food
-pro
duci
ng a
nim
als.
2 Po
lym
yxin
s an
d pl
euro
mut
ilins
are
agg
rega
ted
with
‘Oth
ers’
for
rea
sons
of co
mm
erci
al c
onfid
entia
lity.
3 Fo
r co
nfide
ntia
lity
reas
ons,
ple
urom
utili
ns a
re g
roup
ed w
ith o
ther
s an
d lin
cosa
mid
es a
re g
roup
ed w
ith m
acro
lides
.
Figure 3. Sales for food-producing species, in mg/PCU, of the various veterinary antimicrobial classes, for 30 European countries, in 20151
* Amphenicols, cephalosporins, other quinolones and other antibacterials (classified as such in the ATCvet system).1 Differences between countries can be partly explained by differences in animal demographics, in the selection of antimicrobial agents,
in dosage regimes, in type of data sources, and veterinarians prescribing habits and prices.
Figure 4. Proportion of the total sales of the different veterinary antimicrobial classes, in mg/PCU, in the 30 European countries, for 2015
* Amphenicols, cephalosporins, other quinolones and other antibacterials (classified as such in the ATCvet system).
0
50
100
150
200
250
300
350
400
450Au
stria
Belg
ium
Bulg
aria
Cro
atia
Cyp
rus
Cze
ch R
epub
licD
enm
ark
Esto
nia
Finl
and
Fran
ceG
erm
any
Gre
ece
Hun
gary
Icel
and
Irel
and
Ital
yLa
tvia
Lith
uani
aLu
xem
bour
gN
ethe
rlan
dsN
orw
ayPo
land
Port
ugal
Rom
ania
Slov
akia
Slov
enia
Spai
nSw
eden
Switz
erla
ndU
nite
d Ki
ngdo
m
Others*
Fluoroquinolones
Pleuromutilins
Aminoglycosides
Polymyxins
Lincosamides
Macrolides
Trimethoprim
Sulfonamides
Penicillins
Tetracyclines
mg/
PCU
0%
10%
20%
30%
40%
50%
60%
70%
80%
90%
100%
Aust
ria
Belg
ium
Bulg
aria
Cro
atia
Cyp
rus
Cze
ch R
epub
licD
enm
ark
Esto
nia
Finl
and
Fran
ceG
erm
any
Gre
ece
Hun
gary
Icel
and
Irel
and
Ital
yLa
tvia
Lith
uani
aLu
xem
bour
gN
ethe
rlan
dsN
orw
ayPo
land
Port
ugal
Rom
ania
Slov
akia
Slov
enia
Spai
nSw
eden
Switz
erla
ndU
nite
d Ki
ngdo
m
Others*
Fluoroquinolones
Pleuromutilins
Aminoglycosides
Polymyxins
Lincosamides
Macrolides
Trimethoprim
Sulfonamides
Penicillins
Tetracyclines

Sales of veterinary antimicrobial agents in 30 European countries in 2015Seventh ESVAC report30
Figure 5. Sales of antimicrobial agents by antimicrobial class as percentage of the total sales for food-producing species, in mg/PCU, aggregated by 30 European countries, for 2015
* Amphenicols, cephalosporins, other quinolones and other antibacterials (classified as such in the ATCvet system).
Correction: 30/10/2017 – The number for aminoglycosides in Figure 5 was updated to correspond to correct data.
For all 30 countries, the sales of tetracyclines, penicillins and sulfonamides, in mg/PCU, accounted for 69.6 % of the total sales in 2015 (Figure 6). Of the overall sales in the 30 countries, 0.1 % was accounted for by 1st- and 2nd-generation cephalosporins, 0.2 % were for 3rd- and 4th-generation cephalosporins, 1.2 % were for amphenicols, and 0.4 % for other quinolones.
Figure 6. Sales of tetracyclines, penicillins and sulfonamides as a percentage of the total sales for food-producing species, in mg/PCU, in 30 European countries, for 2015
The percentage of sales of penicillins attributed to the various subclasses differed substantially between the 30 countries (Figure 7). In the Nordic countries, where the proportion of sales of penicillin are typically high, beta-lactamase-sensitive penicillins20 accounted for the majority of penicillins sold (range: 55.3 % to 96.5 %), (Figure 11). For countries other than the Nordic ones, penicillins with an extended spectrum (mainly represented by amoxicillin) accounted for the major proportion of penicillin sales.
20 Beta-lactamase-sensitive penicillins belong to ATCvet code QJ01CE. Procaine benzylpenicillin, penethamate hydriodide and phenoxymethylpenicillin accounted for the majority of sales of these penicillins.
Tetracyclines
Penicillins
Sulfonamides
Trimethoprim
Macrolides
Lincosamides
Polymyxins
Aminoglycosides
Pleuromutilins
Fluoroquinolones
Others*
32.8%
25.0%
11.8%
1.9%
7.2%
3.2%
6.8%
3.5%
2.8%2.1% 3.0%
0%
10%
20%
30%
40%
50%
60%
70%
80%
90%
100%
Aust
ria
Belg
ium
Bulg
aria
Cro
atia
Cyp
rus
Cze
ch R
epub
licD
enm
ark
Esto
nia
Finl
and
Fran
ceG
erm
any
Gre
ece
Hun
gary
Icel
and
Irel
and
Ital
yLa
tvia
Lith
uani
aLu
xem
bour
gN
ethe
rlan
dsN
orw
ayPo
land
Port
ugal
Rom
ania
Slov
akia
Slov
enia
Spai
nSw
eden
Switz
erla
ndU
nite
d Ki
ngdo
m
Tetracyclines Penicillins Sulfonamides

Sales of veterinary antimicrobial agents in 30 European countries in 2015Seventh ESVAC report 31
Figure 7. Distribution of the sales, in mg/PCU, of penicillins by subclass for food-producing species, in 30 European countries, for 2015
* Note: In the ATCvet system classified as combinations of penicillins that include beta-lactamase inhibitors.
The substances included in each of the categories in the above figure are detailed in Table A15. Penicillins plus beta-lactamase inhibitors refer to penicillins in combination with clavulanic acid.
The proportion of certain classes of antimicrobials that are also added among the highest priority critically important antimicrobials (CIAs), and as included in the AMEG Category 2 (see Annex 5, Table A16): 3rd- and 4th-generation cephalosporins, fluoroquinolones and polymyxins – sold in 2015 – varied substantially between the 30 countries, ranging from 0.01 % to 2 %, 0.01 % to 12 % and 0% to 9 %, respectively (Figure 8). The total sales, in mg/PCU, of these classes/subclasses in the 30 European countries are shown in Figures 53 to 57.
Overall, in the 30 countries, the sales (mg/PCU) of 3rd- and 4th-generation cephalosporins, fluoroquinolones, and polymyxins accounted for 0.2 %, 2.1 % and 6.8 %, respectively, of the total sales of antimicrobial VMPs in 2015.
0%
10%
20%
30%
40%
50%
60%
70%
80%
90%
100%
Aus
tria
Bel
gium
Bul
garia
Cro
atia
Cyp
rus
Cze
ch R
epub
licD
enm
ark
Esto
nia
Finl
and
Fran
ceG
erm
any
Gre
ece
Hun
gary
Icel
and
Irel
and
Ital
yLa
tvia
Lith
uani
aLu
xem
bour
gN
ethe
rlan
dsN
orw
ayPo
land
Port
ugal
Rom
ania
Slo
vaki
aSlo
veni
aSpa
inSw
eden
Switz
erla
ndU
nite
d Kin
gdom
Beta-lactamase sensitive penicillins
Penicillins with extended spectrum
Beta-lactamase resistant penicillins
Penicillins + beta-lactamase-inhib.*

Sales of veterinary antimicrobial agents in 30 European countries in 2015Seventh ESVAC report32
Figure 8. Proportion of the total sales of 3rd- and 4th-generation cephalosporins, fluoroquinolones, other quinolones and polymyxins for food-producing species, in mg/PCU, for 30 European countries, in 20151,2,3
1 Variations between the countries should be interpreted with great care due to the large differences in dosing between these classes/subclasses of antimicrobials.
2 No sales of other quinolones in Austria, Estonia, Finland, Germany, Iceland, Ireland, Sweden, Switzerland and the United Kingdom.3 No sales of polymyxins in Finland, Iceland and Norway.
Throughout this report, there is a special focus on certain antimicrobials that are either included in the AMEG Category 2 or are among the highest priority WHO CIAs.
Detailed criteria for both the AMEG categorisation and the WHO classification of highest priority CIAs can be found in Annex 5 and Table A16.
Sales (mg/PCU) across time and by country of these classes/subclasses in the 30 countries are shown in Chapter 2.8.2.
2.3. Population-corrected sales for food-producing animals, including horses, by pharmaceutical form
The sales of veterinary antimicrobial agents for food-producing animals, including horses (hereafter designated as food-producing animals), stratified into pharmaceutical forms, by country, are shown in Figure 9. Tablets are not included in the data as these are used almost solely in companion animals.
0%
2%
4%
6%
8%
10%
12%
14%
16%
Aus
tria
Bel
gium
Bul
garia
Cro
atia
Cyp
rus
Cze
ch R
epub
licD
enm
ark
Esto
nia
Finl
and
Fran
ceG
erm
any
Gre
ece
Hun
gary
Icel
and
Irel
and
Ital
yLa
tvia
Lith
uani
aLu
xem
bour
gN
ethe
rlan
dsN
orw
ayPo
land
Port
ugal
Rom
ania
Slo
vaki
aSlo
veni
aSpa
inSw
eden
Switz
erla
ndU
nite
d Kin
gdom
3rd- and 4th-gen. cephalosporins Other quinolonesFluoroquinolones Polymyxins

Sales of veterinary antimicrobial agents in 30 European countries in 2015Seventh ESVAC report 33
Figure 9. Distribution of sales of veterinary antimicrobial agents for food-producing animals, in mg per population correction unit (mg/PCU), by pharmaceutical form in 30 European countries for 2015
Figure 10. Oral solutions, oral powders and premixes as percentages of total sales, in mg per population correction unit (mg/PCU), of veterinary antimicrobial agents for food-producing animals, in 30 European countries for 2015
Aust
ria
Bel
gium
Bul
garia
Cro
atia
Cyp
rus
Cze
ch R
epub
licD
enm
ark
Esto
nia
Finl
and
Fran
ceG
erm
any
Gre
ece
Hun
gary
Icel
and
Irel
and
Ital
yLa
tvia
Lith
uani
aLu
xem
bour
gN
ethe
rlan
dsN
orw
ayPo
land
Port
ugal
Rom
ania
Slo
vaki
aSlo
veni
aSpa
inSw
eden
Switz
erla
ndU
nite
d Kin
gdom
0%
10%
20%
30%
40%
50%
60%
70%
80%
90%
100%
Premix Oral powder Oral solution Injection Oral paste Bolus Intramammary prep. Intrauterine prep.
Aust
ria
Bel
gium
Bul
garia
Cro
atia
Cyp
rus
Cze
ch R
epub
licD
enm
ark
Esto
nia
Finl
and
Fran
ceG
erm
any
Gre
ece
Hun
gary
Icel
and
Irel
and
Ital
yLa
tvia
Lith
uani
aLu
xem
bour
gN
ethe
rlan
dsN
orw
ayPo
land
Port
ugal
Rom
ania
Slo
vaki
aSlo
veni
aSpa
inSw
eden
Switz
erla
ndU
nite
d Kin
gdom
0%
10%
20%
30%
40%
50%
60%
70%
80%
90%
100%
Premix Oral solutionOral powder

Sales of veterinary antimicrobial agents in 30 European countries in 2015Seventh ESVAC report34
Figure 11. Distribution of sales, in mg/PCU, of the various pharmaceutical forms of veterinary antimicrobial agents for food-producing animals, aggregated by the 30 European countries for 2015
* Oral pastes, boluses and intrauterine preparations.
The proportions accounted for by premixes and oral powders vary considerably between the countries, which could be attributed to whether or not the farmers in the country administer medicated feed stuff prepared by a feed mill by using premixes, or whether group treatment is performed by the application of oral powder as e.g a top dressing on the feed at the farm. It could also be influenced by the distribution of the animal species, as group medication is used mainly in poultry and pigs, and less, for example, in sheep or goats. Also, the products available and national policies for in feed medication can influence the patterns of forms sold.
Although a small proportion of oral powders and oral solutions are applicable for treatment of one single animal or a very limited number of animals, the sales figures for these pharmaceutical forms are reasonable estimates of group treatment, including groups in one pen/farm.
Aggregated by the 30 countries, the sales (mg/PCU) of premixes accounted for 52.3 % of the overall sales, while 9.2 % were oral powders, 38.3 % were oral solutions and 0.05 % was intramammary preparations and oral pastes, boluses and intrauterine preparations.
More graphs showing the distribution of sales for the most-sold antimicrobial classes and the most important CIAs by pharmaceutical form, aggregated by the 30 European countries, can be found in Annex 1 and Figures A1 and A2.
Premix
Oral powder
Oral solution
Injection
Intramammary prep.
Others*
0.3%
43.4%28.6%
8.0%
19.1%
0.5%

Sales of veterinary antimicrobial agents in 30 European countries in 2015Seventh ESVAC report 35
2.4. Distribution of sales for food-producing animals — overall and by antimi-crobial class and pharmaceutical form
2.4.1. Distribution of sales of antimicrobials for food-producing animals by country
Figure 12. Spatial distribution of overall sales of all antimicrobials for food-producing animals, in mg/PCU, for 30 coun-tries, for 2015
2.4.2. Distribution of sales of antimicrobials by class and forms by countryThere was considerable variation among the participating countries in the distribution of sales, in mg/PCU, in terms of antimicrobial classes and pharmaceutical forms.
Russia
R u s s i a
Bosniaand
Herz.
Andorra
Lebanon
Israel
T u r k e y
Croatia
Serbia
Montenegro
Albania
Macedonia
Moldova
U k r a i n e
B e l a r u s
N o r w a y
I c e l a n d
SwitzerlandLiech.
P o l a n d
G e r m a n y
S w e d e n
F i n l a n d
U n i t e d K i n g d o m
Ireland
D e n mark
Netherlands
Luxembourg
Belgium
F r a n c e
S p a i n
Po r t u g a l
I t a l y
M a l t a
C y p r u s
Greece
A u s t r i a
Slovenia
H u n g a r y
C z e c hR e p u b l i c
Lithuania
Latvia
Estonia
Slovakia
B u l g a r i a
R o m a n i a
mg/PCU≥ 2.92
≤ 434.21No dataavailable

Sales of veterinary antimicrobial agents in 30 European countries in 2015Seventh ESVAC report36
2.4.2.1. Tetracyclines
Figure 13. Spatial distribution of sales of tetracyclines for food-producing animals, in mg/PCU, by country, for 2015
Figure 14. Distribution of sales by pharmaceutical forms of tetracyclines, in mg/PCU, by country, for 20151
1 In addition, negligible amounts were sold as boluses, intramammary preparations and/or oral pastes in some countries.
Russia
R u s s i a
Bosniaand
Herz.
Andorra
Lebanon
Israel
T u r k e y
Croatia
Serbia
Montenegro
Albania
Macedonia
Moldova
U k r a i n e
B e l a r u s
N o r w a y
I c e l a n d
SwitzerlandLiech.
P o l a n d
G e r m a n y
S w e d e n
F i n l a n d
U n i t e d K i n g d o m
Ireland
D e n mark
Netherlands
Luxembourg
Belgium
F r a n c e
S p a i n
Po r t u g a l
I t a l y
M a l t a
C y p r u s
Greece
A u s t r i a
Slovenia
H u n g a r y
C z e c hR e p u b l i c
Lithuania
Latvia
Estonia
Slovakia
B u l g a r i a
R o m a n i a
mg/PCU≥ 0.08
≤ 183.29No dataavailable
0%
10%
20%
30%
40%
50%
60%
70%
80%
90%
100%
Aust
ria
Belg
ium
Bulg
aria
Cro
atia
Cyp
rus
Cze
ch R
epub
licD
enm
ark
Esto
nia
Finl
and
Fran
ceG
erm
any
Gre
ece
Hun
gary
Icel
and
Irel
and
Ital
yLa
tvia
Lith
uani
aLu
xem
bour
gN
ethe
rlan
dsN
orw
ayPo
land
Port
ugal
Rom
ania
Slov
akia
Slov
enia
Spai
nSw
eden
Switz
erla
ndU
nite
d Ki
ngdo
m
Premix Oral solutionOral powder Injection Intrauterine prep.

Sales of veterinary antimicrobial agents in 30 European countries in 2015Seventh ESVAC report 37
2.4.2.2. Amphenicols
Figure 15. Spatial distribution of sales of amphenicols, in mg/PCU, by country, for 20151
1 No sales in Iceland.
Figure 16. Distribution of sales by pharmaceutical form of amphenicols, in mg/PCU, by country, for 20151
1 No sales in Iceland.
Russia
R u s s i a
Bosniaand
Herz.
Andorra
Lebanon
Israel
T u r k e y
Croatia
Serbia
Montenegro
Albania
Macedonia
Moldova
U k r a i n e
B e l a r u s
N o r w a y
I c e l a n d
SwitzerlandLiech.
P o l a n d
G e r m a n y
S w e d e n
F i n l a n d
U n i t e d K i n g d o m
Ireland
D e n mark
Netherlands
Luxembourg
Belgium
F r a n c e
S p a i n
Po r t u g a l
I t a l y
M a l t a
C y p r u s
Greece
A u s t r i a
Slovenia
H u n g a r y
C z e c hR e p u b l i c
Lithuania
Latvia
Estonia
Slovakia
B u l g a r i a
R o m a n i a
mg/PCU≥ 0.04
≤ 4.66No dataavailable
0
10
20
30
40
50
60
70
80
90
100
Aust
ria
Belg
ium
Bulg
aria
Cro
atia
Cyp
rus
Cze
ch R
epub
licD
enm
ark
Esto
nia
Finl
and
Fran
ceG
erm
any
Gre
ece
Hun
gary
Icel
and
Irel
and
Ital
yLa
tvia
Lith
uani
aLu
xem
bour
gN
ethe
rlan
dsN
orw
ayPo
land
Port
ugal
Rom
ania
Slov
akia
Slov
enia
Spai
nSw
eden
Switz
erla
ndU
nite
d Ki
ngdo
m
Premix Oral solutionOral powder Injection

Sales of veterinary antimicrobial agents in 30 European countries in 2015Seventh ESVAC report38
2.4.2.3. Penicillins
Figure 17. Spatial distribution of sales of penicillins for food-producing animals, in mg/PCU, by country, for 2015
Figure 18. Distribution of sales by pharmaceutical form for penicillins, in mg/PCU, by country, for 20151
1 In addition, negligible amounts were sold as boluses, intrauterine preparations and/or oral pastes in some countries.
Russia
R u s s i a
Bosniaand
Herz.
Andorra
Lebanon
Israel
T u r k e y
Croatia
Serbia
Montenegro
Albania
Macedonia
Moldova
U k r a i n e
B e l a r u s
N o r w a y
I c e l a n d
SwitzerlandLiech.
P o l a n d
G e r m a n y
S w e d e n
F i n l a n d
U n i t e d K i n g d o m
Ireland
D e n mark
Netherlands
Luxembourg
Belgium
F r a n c e
S p a i n
Po r t u g a l
I t a l y
M a l t a
C y p r u s
Greece
A u s t r i a
Slovenia
H u n g a r y
C z e c hR e p u b l i c
Lithuania
Latvia
Estonia
Slovakia
B u l g a r i a
R o m a n i a
mg/PCU≥ 1.57
≤ 92.65No dataavailable
Aus
tria
Bel
gium
Bul
garia
Cro
atia
Cyp
rus
Cze
ch R
epub
licD
enm
ark
Esto
nia
Finl
and
Fran
ceG
erm
any
Gre
ece
Hun
gary
Icel
and
Irel
and
Ital
yLa
tvia
Lith
uani
aLu
xem
bour
gN
ethe
rlan
dsN
orw
ayPo
land
Port
ugal
Rom
ania
Slo
vaki
aSlo
veni
aSpa
inSw
eden
Switz
erla
ndU
nite
d Kin
gdom
Intramammary prep.
0%
10%
20%
30%
40%
50%
60%
70%
80%
90%
100%Premix Oral solutionOral powder Injection

Sales of veterinary antimicrobial agents in 30 European countries in 2015Seventh ESVAC report 39
2.4.2.4. 1st- and 2nd-generation cephalosporins
Figure 19. Spatial distribution of sales of 1st- and 2nd-generation cephalosporins, in mg/PCU, by country, for 20151
1 No sales in Iceland, Greece and Norway; negligible amounts (≤1kg) were sold in Sweden.
Figure 20. Distribution of sales by pharmaceutical form for 1st- and 2nd-generation cephalosporins, in mg/PCU, by country, for 20151,2
1 No sales in Iceland, Greece and Norway; negligible amounts (≤1kg) were sold in Sweden.2 In addition, negligible amounts were sold as oral pastes or oral powders in some countries.
Russia
R u s s i a
Bosniaand
Herz.
Andorra
Lebanon
Israel
T u r k e y
Croatia
Serbia
Montenegro
Albania
Macedonia
Moldova
U k r a i n e
B e l a r u s
N o r w a y
I c e l a n d
SwitzerlandLiech.
P o l a n d
G e r m a n y
S w e d e n
F i n l a n d
U n i t e d K i n g d o m
Ireland
D e n mark
Netherlands
Luxembourg
Belgium
F r a n c e
S p a i n
Po r t u g a l
I t a l y
M a l t a
C y p r u s
Greece
A u s t r i a
Slovenia
H u n g a r y
C z e c hR e p u b l i c
Lithuania
Latvia
Estonia
Slovakia
B u l g a r i a
R o m a n i a
mg/PCU≥ 0.0014
≤ 0.60No dataavailable
Aust
ria
Belg
ium
Bulg
aria
Croa
tia
Cypr
us
Czec
h Re
publ
ic
Den
mar
k
Esto
nia
Finl
and
Fran
ce
Ger
man
y
Hung
ary
Irel
and
Ital
y
Latv
ia
Lith
uani
a
Luxe
mbo
urg
Neth
erla
nds
Pola
nd
Port
ugal
Rom
ania
Slov
akia
Slov
enia
Spai
n
Swed
en
Switz
erla
nd
Unite
d Ki
ngdo
m
Intrauterine prep.Injection Intramammary prep.
0%
10%
20%
30%
40%
50%
60%
70%
80%
90%
100%

Sales of veterinary antimicrobial agents in 30 European countries in 2015Seventh ESVAC report40
2.4.2.5. 3rd- and 4th-generation cephalosporins
Figure 21. Spatial distribution of sales of 3rd- and 4th-generation cephalosporins, in mg/PCU, by country, for 2015
Figure 22. Distribution of sales by pharmaceutical form for 3rd- and 4th-generation cephalosporins, in mg/PCU, by country, for 20151,2
1 Sales <1 kg in Iceland and Norway.2 For countries where the injectable 3rd- and 4th-generation cephalosporins are almost solely marketed for dogs and cats,
the data provides a considerable overestimate for food-producing animals.
Russia
R u s s i a
Bosniaand
Herz.
Andorra
Lebanon
Israel
T u r k e y
Croatia
Serbia
Montenegro
Albania
Macedonia
Moldova
U k r a i n e
B e l a r u s
N o r w a y
I c e l a n d
SwitzerlandLiech.
P o l a n d
G e r m a n y
S w e d e n
F i n l a n d
U n i t e d K i n g d o m
Ireland
D e n mark
Netherlands
Luxembourg
Belgium
F r a n c e
S p a i n
Po r t u g a l
I t a l y
M a l t a
C y p r u s
Greece
A u s t r i a
Slovenia
H u n g a r y
C z e c hR e p u b l i c
Lithuania
Latvia
Estonia
Slovakia
B u l g a r i a
R o m a n i a
mg/PCU≥ 0.0003
≤ 0.62No dataavailable
Aus
tria
Bel
gium
Bul
garia
Cro
atia
Cyp
rus
Cze
ch R
epub
licD
enm
ark
Esto
nia
Finl
and
Fran
ceG
erm
any
Gre
ece
Hun
gary
Icel
and
Irel
and
Ital
yLa
tvia
Lith
uani
aLu
xem
bour
gN
ethe
rlan
dsN
orw
ayPo
land
Port
ugal
Rom
ania
Slo
vaki
aSlo
veni
aSpa
inSw
eden
Switz
erla
ndU
nite
d Kin
gdom
Injection Intramammary prep.
0%
10%
20%
30%
40%
50%
60%
70%
80%
90%
100%

Sales of veterinary antimicrobial agents in 30 European countries in 2015Seventh ESVAC report 41
2.4.2.6. Sulfonamides
Figure 23. Spatial distribution of sales of sulfonamides, in mg/PCU, by country, for 2015
Figure 24. Distribution of sales by pharmaceutical form for sulfonamides, in mg/PCU, by country, for 20151
1 In addition, negligible amounts were sold as boluses, intramammary and/or intrauterine preparations in some countries.
Russia
R u s s i a
Bosniaand
Herz.
Andorra
Lebanon
Israel
T u r k e y
Croatia
Serbia
Montenegro
Albania
Macedonia
Moldova
U k r a i n e
B e l a r u s
N o r w a y
I c e l a n d
SwitzerlandLiech.
P o l a n d
G e r m a n y
S w e d e n
F i n l a n d
U n i t e d K i n g d o m
Ireland
D e n mark
Netherlands
Luxembourg
Belgium
F r a n c e
S p a i n
Po r t u g a l
I t a l y
M a l t a
C y p r u s
Greece
A u s t r i a
Slovenia
H u n g a r y
C z e c hR e p u b l i c
Lithuania
Latvia
Estonia
Slovakia
B u l g a r i a
R o m a n i a
mg/PCU≥ 0.34
≤ 59.13No dataavailable
Aus
tria
Bel
gium
Bul
garia
Cro
atia
Cyp
rus
Cze
ch R
epub
licD
enm
ark
Esto
nia
Finl
and
Fran
ceG
erm
any
Gre
ece
Hun
gary
Icel
and
Irel
and
Ital
yLa
tvia
Lith
uani
aLu
xem
bour
gN
ethe
rlan
dsN
orw
ayPo
land
Port
ugal
Rom
ania
Slo
vaki
aSlo
veni
aSpa
inSw
eden
Switz
erla
ndU
nite
d Kin
gdom
Oral solutionPremix Oral powder
0%
10%
20%
30%
40%
50%
60%
70%
80%
90%
100%
Injection Oral paste

Sales of veterinary antimicrobial agents in 30 European countries in 2015Seventh ESVAC report42
2.4.2.7. Trimethoprim
Figure 25. Spatial distribution of sales of trimethoprim, in mg/PCU, by country, for 2015
Figure 26. Distribution of sales by pharmaceutical form for trimethoprim, in mg/PCU, by country, for 20151
1 In addition, negligible amounts were sold as intramammary preparations and/or boluses in some countries.
Russia
R u s s i a
Bosniaand
Herz.
Andorra
Lebanon
Israel
T u r k e y
Croatia
Serbia
Montenegro
Albania
Macedonia
Moldova
U k r a i n e
B e l a r u s
N o r w a y
I c e l a n d
SwitzerlandLiech.
P o l a n d
G e r m a n y
S w e d e n
F i n l a n d
U n i t e d K i n g d o m
Ireland
D e n mark
Netherlands
Luxembourg
Belgium
F r a n c e
S p a i n
Po r t u g a l
I t a l y
M a l t a
C y p r u s
Greece
A u s t r i a
Slovenia
H u n g a r y
C z e c hR e p u b l i c
Lithuania
Latvia
Estonia
Slovakia
B u l g a r i a
R o m a n i a
mg/PCU≥ 0.05
≤ 11.34No dataavailable
Aus
tria
Bel
gium
Bul
garia
Cro
atia
Cyp
rus
Cze
ch R
epub
licD
enm
ark
Esto
nia
Finl
and
Fran
ceG
erm
any
Gre
ece
Hun
gary
Icel
and
Irel
and
Ital
yLa
tvia
Lith
uani
aLu
xem
bour
gN
ethe
rlan
dsN
orw
ayPo
land
Port
ugal
Rom
ania
Slo
vaki
aSlo
veni
aSpa
inSw
eden
Switz
erla
ndU
nite
d Kin
gdom
Oral solutionPremix Oral powder
0%
10%
20%
30%
40%
50%
60%
70%
80%
90%
100%
Injection Oral paste

Sales of veterinary antimicrobial agents in 30 European countries in 2015Seventh ESVAC report 43
2.4.2.8. Macrolides
Figure 27. Spatial distribution of sales of macrolides, in mg/PCU, by country, for 20151
1 No sales in Iceland.
Figure 28. Distribution of sales by pharmaceutical form for macrolides, in mg/PCU, by country, for 20151,2
1 No sales in Iceland.2 In addition, negligible amounts were sold as intramammary preparations in some countries.
Russia
R u s s i a
Bosniaand
Herz.
Andorra
Lebanon
Israel
T u r k e y
Croatia
Serbia
Montenegro
Albania
Macedonia
Moldova
U k r a i n e
B e l a r u s
N o r w a y
I c e l a n d
SwitzerlandLiech.
P o l a n d
G e r m a n y
S w e d e n
F i n l a n d
U n i t e d K i n g d o m
Ireland
D e n mark
Netherlands
Luxembourg
Belgium
F r a n c e
S p a i n
Po r t u g a l
I t a l y
M a l t a
C y p r u s
Greece
A u s t r i a
Slovenia
H u n g a r y
C z e c hR e p u b l i c
Lithuania
Latvia
Estonia
Slovakia
B u l g a r i a
R o m a n i a
mg/PCU≥ 0.34
≤ 59.13No dataavailable
Aus
tria
Bel
gium
Bul
garia
Cro
atia
Cyp
rus
Cze
ch R
epub
licD
enm
ark
Esto
nia
Finl
and
Fran
ceG
erm
any
Gre
ece
Hun
gary
Irel
and
Ital
yLa
tvia
Lith
uani
aLu
xem
bour
gN
ethe
rlan
dsN
orw
ayPo
land
Port
ugal
Rom
ania
Slo
vaki
aSlo
veni
aSpa
inSw
eden
Switz
erla
ndU
nite
d Kin
gdom
Oral solutionPremix Oral powder
0%
10%
20%
30%
40%
50%
60%
70%
80%
90%
100%
Injection

Sales of veterinary antimicrobial agents in 30 European countries in 2015Seventh ESVAC report44
2.4.2.9. Lincosamides
Figure 29. Spatial distribution of sales of lincosamides, in mg/PCU, by country, for 20151
1 No sales in Iceland and Norway.
Figure 30. Distribution of sales by pharmaceutical form for lincosamides, in mg/PCU, by country, for 20151
1 No sales in Iceland and Norway.
Russia
R u s s i a
Bosniaand
Herz.
Andorra
Lebanon
Israel
T u r k e y
Croatia
Serbia
Montenegro
Albania
Macedonia
Moldova
U k r a i n e
B e l a r u s
N o r w a y
I c e l a n d
SwitzerlandLiech.
P o l a n d
G e r m a n y
S w e d e n
F i n l a n d
U n i t e d K i n g d o m
Ireland
D e n mark
Netherlands
Luxembourg
Belgium
F r a n c e
S p a i n
Po r t u g a l
I t a l y
M a l t a
C y p r u s
Greece
A u s t r i a
Slovenia
H u n g a r y
C z e c hR e p u b l i c
Lithuania
Latvia
Estonia
Slovakia
B u l g a r i a
R o m a n i a
mg/PCU≥ 0.1
≤ 64.41No dataavailable
Aust
ria
Belg
ium
Bulg
aria
Croa
tia
Cypr
us
Czec
h Re
publ
ic
Den
mar
k
Esto
nia
Finl
and
Fran
ce
Ger
man
y
Gre
ece
Hun
gary
Irel
and
Ital
y
Latv
ia
Lith
uani
a
Luxe
mbo
urg
Net
herlan
ds
Pola
nd
Port
ugal
Rom
ania
Slov
akia
Slov
enia
Spai
n
Swed
en
Switz
erla
nd
Uni
ted
King
dom
Intramammary prep.
0%
10%
20%
30%
40%
50%
60%
70%
80%
90%
100%
Oral solutionPremix Oral powder Injection

Sales of veterinary antimicrobial agents in 30 European countries in 2015Seventh ESVAC report 45
2.4.2.10. Fluoroquinolones
Figure 31. Spatial distribution of sales of fluoroquinolones, in mg/PCU, by country, for 2015
Figure 32. Distribution of sales by pharmaceutical form for fluoroquinolones, in mg/PCU, by country, for 20151,2
1 In addition, negligible amounts were sold as boluses and/or premixes in some countries. 2 Sales <1 kg in Iceland.
Russia
R u s s i a
Bosniaand
Herz.
Andorra
Lebanon
Israel
T u r k e y
Croatia
Serbia
Montenegro
Albania
Macedonia
Moldova
U k r a i n e
B e l a r u s
N o r w a y
I c e l a n d
SwitzerlandLiech.
P o l a n d
G e r m a n y
S w e d e n
F i n l a n d
U n i t e d K i n g d o m
Ireland
D e n mark
Netherlands
Luxembourg
Belgium
F r a n c e
S p a i n
Po r t u g a l
I t a l y
M a l t a
C y p r u s
Greece
A u s t r i a
Slovenia
H u n g a r y
C z e c hR e p u b l i c
Lithuania
Latvia
Estonia
Slovakia
B u l g a r i a
R o m a n i a
mg/PCU≥ 0.003
≤ 9.46No dataavailable
Aus
tria
Bel
gium
Bul
garia
Cro
atia
Cyp
rus
Cze
ch R
epub
licD
enm
ark
Esto
nia
Finl
and
Fran
ceG
erm
any
Gre
ece
Hun
gary
Icel
and
Irel
and
Ital
yLa
tvia
Lith
uani
aLu
xem
bour
gN
ethe
rlan
dsN
orw
ayPo
land
Port
ugal
Rom
ania
Slo
vaki
aSlo
veni
aSpa
inSw
eden
Switz
erla
ndU
nite
d Kin
gdom
0%
10%
20%
30%
40%
50%
60%
70%
80%
90%
100%
Oral solution Injection

Sales of veterinary antimicrobial agents in 30 European countries in 2015Seventh ESVAC report46
Russia
R u s s i a
Bosniaand
Herz.
Andorra
Lebanon
Israel
T u r k e y
Croatia
Serbia
Montenegro
Albania
Macedonia
Moldova
U k r a i n e
B e l a r u s
N o r w a y
I c e l a n d
SwitzerlandLiech.
P o l a n d
G e r m a n y
S w e d e n
F i n l a n d
U n i t e d K i n g d o m
Ireland
D e n mark
Netherlands
Luxembourg
Belgium
F r a n c e
S p a i n
Po r t u g a l
I t a l y
M a l t a
C y p r u s
Greece
A u s t r i a
Slovenia
H u n g a r y
C z e c hR e p u b l i c
Lithuania
Latvia
Estonia
Slovakia
B u l g a r i a
R o m a n i a
mg/PCU≥ 0.01
≤ 3.28No dataavailable
2.4.2.11. Other quinolones
Figure 33. Spatial distribution of sales of other quinolones, in mg/PCU, by country, for 20151
1 No sales in Austria, Estonia, Finland, Germany, Iceland, Ireland, Sweden, Switzerland and the United Kingdom.
Figure 34. Distribution of sales by pharmaceutical form for other quinolones, in mg/PCU, by country, for 20151,2
1 No sales in Austria, Estonia, Finland, Germany, Iceland, Ireland, Sweden, Switzerland and the United Kingdom.2 In addition, negligible amounts were sold as injections, boluses and/or oral pastes in some countries.
Bel
gium
Bul
garia
Cro
atia
Cyp
rus
Cze
ch R
epub
lic
Den
mar
k
Fran
ce
Gre
ece
Hun
gary
Ital
y
Latv
ia
Lith
uani
a
Luxe
mbo
urg
Net
herlan
ds
Nor
way
Pola
nd
Port
ugal
Rom
ania
Slo
vaki
a
Slo
veni
a
Spa
in
0%
10%
20%
30%
40%
50%
60%
70%
80%
90%
100%
Oral solutionPremix Oral powder

Sales of veterinary antimicrobial agents in 30 European countries in 2015Seventh ESVAC report 47
2.4.2.12. Aminoglycosides
Figure 35. Spatial distribution of sales of aminoglycosides, in mg/PCU, by country, for 2015
Figure 36. Distribution of sales by pharmaceutical form for aminoglycosides, in mg/PCU, by country, for 2015
Russia
R u s s i a
Bosniaand
Herz.
Andorra
Lebanon
Israel
T u r k e y
Croatia
Serbia
Montenegro
Albania
Macedonia
Moldova
U k r a i n e
B e l a r u s
N o r w a y
I c e l a n d
SwitzerlandLiech.
P o l a n d
G e r m a n y
S w e d e n
F i n l a n d
U n i t e d K i n g d o m
Ireland
D e n mark
Netherlands
Luxembourg
Belgium
F r a n c e
S p a i n
Po r t u g a l
I t a l y
M a l t a
C y p r u s
Greece
A u s t r i a
Slovenia
H u n g a r y
C z e c hR e p u b l i c
Lithuania
Latvia
Estonia
Slovakia
B u l g a r i a
R o m a n i a
mg/PCU≥ 0.06
≤ 15.10No dataavailable
Aus
tria
Bel
gium
Bul
garia
Cro
atia
Cyp
rus
Cze
ch R
epub
licD
enm
ark
Esto
nia
Finl
and
Fran
ceG
erm
any
Gre
ece
Hun
gary
Icel
and
Irel
and
Ital
yLa
tvia
Lith
uani
aLu
xem
bour
gN
ethe
rlan
dsN
orw
ayPo
land
Port
ugal
Rom
ania
Slo
vaki
aSlo
veni
aSpa
inSw
eden
Switz
erla
ndU
nite
d Kin
gdom
0%
10%
20%
30%
40%
50%
60%
70%
80%
90%
100%
Oral solutionPremix Oral powder
Injection Intrauterine prep.Intramammary prep.

Sales of veterinary antimicrobial agents in 30 European countries in 2015Seventh ESVAC report48
2.4.2.13. Polymyxins
Figure 37. Spatial distribution of sales of polymyxins, in mg/PCU, by country, for 20151
1 No sales in Finland, Iceland and Norway.
Figure 38. Distribution of sales by pharmaceutical form for polymyxins, in mg/PCU, by country, for 20151,2
1 No sales in Finland, Iceland and Norway. 2 In addition, negligible amounts were sold as boluses, intramammary preparations and/or oral pastes in some countries.
Russia
R u s s i a
Bosniaand
Herz.
Andorra
Lebanon
Israel
T u r k e y
Croatia
Serbia
Montenegro
Albania
Macedonia
Moldova
U k r a i n e
B e l a r u s
N o r w a y
I c e l a n d
SwitzerlandLiech.
P o l a n d
G e r m a n y
S w e d e n
F i n l a n d
U n i t e d K i n g d o m
Ireland
D e n mark
Netherlands
Luxembourg
Belgium
F r a n c e
S p a i n
Po r t u g a l
I t a l y
M a l t a
C y p r u s
Greece
A u s t r i a
Slovenia
H u n g a r y
C z e c hR e p u b l i c
Lithuania
Latvia
Estonia
Slovakia
B u l g a r i a
R o m a n i a
mg/PCU≥ 0.07
≤ 34.91No dataavailable
Aus
tria
Bel
gium
Bul
garia
Cro
atia
Cyp
rus
Cze
ch R
epub
lic
Den
mar
k
Esto
nia
Fran
ce
Ger
man
y
Gre
ece
Hun
gary
Irel
and
Ital
y
Latv
ia
Lith
uani
a
Luxe
mbo
urg
Net
herlan
ds
Pola
nd
Port
ugal
Rom
ania
Slo
vaki
a
Slo
veni
a
Spa
in
Swed
en
Switz
erla
nd
Uni
ted
Kin
gdom
Oral solutionPremix Oral powder Injection
0%
10%
20%
30%
40%
50%
60%
70%
80%
90%
100%

Sales of veterinary antimicrobial agents in 30 European countries in 2015Seventh ESVAC report 49
2.4.2.14. Pleuromutilins
Figure 39. Spatial distribution of sales of pleuromutilins, in mg/PCU, by country, for 20151
1 No sales in Iceland.
Figure 40. Distribution of sales by pharmaceutical form for pleuromutilins, in mg/PCU, by country, for 20151
1 No sales in Iceland.
Russia
R u s s i a
Bosniaand
Herz.
Andorra
Lebanon
Israel
T u r k e y
Croatia
Serbia
Montenegro
Albania
Macedonia
Moldova
U k r a i n e
B e l a r u s
N o r w a y
I c e l a n d
SwitzerlandLiech.
P o l a n d
G e r m a n y
S w e d e n
F i n l a n d
U n i t e d K i n g d o m
Ireland
D e n mark
Netherlands
Luxembourg
Belgium
F r a n c e
S p a i n
Po r t u g a l
I t a l y
M a l t a
C y p r u s
Greece
A u s t r i a
Slovenia
H u n g a r y
C z e c hR e p u b l i c
Lithuania
Latvia
Estonia
Slovakia
B u l g a r i a
R o m a n i a
mg/PCU≥ 0.0014
≤ 0.60No dataavailable
Aus
tria
Bel
gium
Bul
garia
Cro
atia
Cyp
rus
Cze
ch R
epub
licD
enm
ark
Esto
nia
Finl
and
Fran
ceG
erm
any
Gre
ece
Hun
gary
Irel
and
Ital
yLa
tvia
Lith
uani
aLu
xem
bour
gN
ethe
rlan
dsN
orw
ayPo
land
Port
ugal
Rom
ania
Slo
vaki
aSlo
veni
aSpa
inSw
eden
Switz
erla
ndU
nite
d Kin
gdom
Oral solutionPremix Oral powder Injection
0%
10%
20%
30%
40%
50%
60%
70%
80%
90%
100%

Sales of veterinary antimicrobial agents in 30 European countries in 2015Seventh ESVAC report50
2.5. Distribution of the population correction unit by species and countryThe value of the denominator (PCU), i.e. the estimated weight at treatment of livestock and of slaughter animals, for the various species and countries is shown in Table 6. The EU countries included in the ESVAC 2015 data cover almost 100 % of the food-producing animal population in the EU measured as PCU.
Distribution of the various food-producing species by country, expressed by PCU, is shown in Table 6 and Figures 41 and 42.
Overall, pigs, cattle, poultry and sheep/goats accounted for 32 %, 31 %, 14 % and 14 %, respectively, of the PCU in the 30 countries.
Table 6. Estimated PCU (in 1,000 tonnes) of the population of food-producing species1,2, including horses, by country, for 2015
Country Cattle Pigs Poultry Sheep/ goats
Fish Rabbits Horses Total
Austria 438 374 79 34 0 0 32 957
Belgium 457 905 221 16 0 4 115 1,719
Bulgaria 129 73 46 96 0 0 35 380
Croatia 112 81 36 45 0 0 0 274
Cyprus 18 46 13 30 0 0 2 108
Czech Republic 295 202 122 18 20 7 34 698
Denmark 389 1,784 116 12 44 0 70 2,415
Estonia 64 45 3 7 1 0 4 123
Finland 227 165 70 13 15 0 30 519
France 3,214 1,817 1,169 632 45 51 219 7,147
Germany 3,167 3,901 1,067 138 27 34 356 8,690
Greece 104 130 116 799 106 0 13 1,268
Hungary 157 333 191 100 20 7 24 833
Iceland 18 6 5 48 8 0 30 116
Ireland 1,137 276 79 300 40 0 60 1,892
Italy 1,569 828 730 573 177 30 130 4,038
Latvia 110 40 19 8 0 0 4 180
Lithuania 197 72 51 11 0 0 7 339
Luxembourg 40 11 0 0 0 0 2 53
Netherlands 1,055 1,661 404 88 62 1 47 3,318
Norway 214 126 65 104 1,388 0 14 1,912
Poland 1,521 1,412 1,118 18 0 2 121 4,193
Portugal 229 344 214 174 11 7 18 997
Romania 614 337 423 998 4 0 183 2,559
Slovakia 96 61 53 31 1 0 4 246
Slovenia 96 19 38 8 2 0 10 173
Spain 941 3,660 793 1,477 335 73 253 7,532
Sweden 305 200 97 50 11 0 145 808
Switzerland 485 208 68 32 0 1 22 815
United Kingdom 1,743 770 1,082 2,796 193 0 378 6,961
Total 30 countries 19,141 19,887 8,491 8,656 2,511 216 2,364 61,266
1 See Annex 3 for animal categories included.2 When PCU is given as zero it indicates zero or insignificant production.

Sales of veterinary antimicrobial agents in 30 European countries in 2015Seventh ESVAC report 51
Figure 41. The denominator (PCU) and its distribution by the food-producing animal species, including horses, (1 PCU = 1 kg), by country, in 2015
* Includes horses and, for some countries, fish and/or rabbits.
Figure 42. Distribution of the denominator (PCU) in weight by food-producing animal species, including horses, by country, in 2015
* Includes horses and, for some countries, fish and/or rabbits.
Aus
tria
Bel
gium
Bul
garia
Cro
atia
Cyp
rus
Cze
ch R
epub
licD
enm
ark
Esto
nia
Finl
and
Fran
ceG
erm
any
Gre
ece
Hun
gary
Icel
and
Irel
and
Ital
yLa
tvia
Lith
uani
aLu
xem
bour
gN
ethe
rlan
dsN
orw
ayPo
land
Port
ugal
Rom
ania
Slo
vaki
aSlo
veni
aSpa
inSw
eden
Switz
erla
ndU
nite
d Kin
gdom
PoultryCattle Pigs Sheep and goats
0
1,000
2,000
3,000
4,000
5,000
6,000
7,000
8,000
9,000
10,000
Others*
PCU
(1,
000
tonn
es)
Aus
tria
Bel
gium
Bul
garia
Cro
atia
Cyp
rus
Cze
ch R
epub
licD
enm
ark
Esto
nia
Finl
and
Fran
ceG
erm
any
Gre
ece
Hun
gary
Icel
and
Irel
and
Ital
yLa
tvia
Lith
uani
aLu
xem
bour
gN
ethe
rlan
dsN
orw
ayPo
land
Port
ugal
Rom
ania
Slo
vaki
aSlo
veni
aSpa
inSw
eden
Switz
erla
ndU
nite
d Kin
gdom
PoultryCattle Pigs Sheep and goats
0%
10%
20%
30%
40%
50%
60%
70%
80%
90%
100%
Others*

Sales of veterinary antimicrobial agents in 30 European countries in 2015Seventh ESVAC report52
In 2015, of the 30 countries, 12 had a net export of animals for slaughter and/or fattening to other MSs that accounted for ≥ 5 % of the total denominator (PCU), whilst 11 countries had a net import accounting for ≥ 5 % of the total denominator.
Table 7. PCU domestic, net export and net import (1,000 tonnes) of animals for fattening or slaughter, respectively, in another MS and PCU (net balance) in 2015
Country PCU - domestic
PCU - export
Proportion, export
PCU - import
Proportion, import
PCU
Austria 1,047 14 1 % -104 -11 % 957
Belgium 1,838 120 7 % -238 -14 % 1,719
Bulgaria 384 0.4 0.1 % -4 -1 % 380
Croatia 301 8 3 % -35 -13 % 274
Cyprus 106 2 1 % -0.01 -0.01 % 108
Czech Republic 631 85 12 % -18 -3 % 698
Denmark 2,064 352 15 % 0 0 % 2,415
Estonia 107 17 14 % -1 -1 % 123
Finland 518 2 0.3 % -0.02 -0.005 % 519
France 6,901 283 4 % -37 -1 % 7,147
Germany 8,843 443 5 % -595 -7 % 8,690
Greece 1,278 0.1 0.01 % -10 -1 % 1,268
Hungary 851 45 5 % -63 -8 % 833
Iceland 116 0 0 % 0 0 % 116
Ireland 1,848 59 3 % -14 -1 % 1,892
Italy 4,250 7 0.2 % -219 -5 % 4,038
Latvia 162 23 13 % -5 -3 % 180
Lithuania 332 21 6 % -14 -4 % 339
Luxembourg 43 14 27 % -5 -9 % 53
Netherlands 3,190 561 17 % -433 -13 % 3,318
Norway 1,912 0 0 % 0 0 % 1,912
Poland 4,411 16 0.4 % -234 -6 % 4,193
Portugal 1,058 37 4 % -98 -10 % 997
Romania 2,508 83 3 % -32 -1 % 2,559
Slovakia 195 66 27 % -15 -6 % 246
Slovenia 166 14 8 % -7 -4 % 173
Spain 7,530 135 2 % -134 -2 % 7,532
Sweden 808 0.1 0.02 % -0.2 -0.03 % 808
Switzerland 815 1 0.2 % -1 -0.2 % 815
United Kingdom 6,999 11 0.2% -49 -1 % 6,961

Sales of veterinary antimicrobial agents in 30 European countries in 2015Seventh ESVAC report 53
2.6. Distribution of single- and multiple-ingredient products of veterinary antimicrobial agents
Of the 9,368 product presentations (tablets excluded) for which sales were reported – i.e. product name, form, strength and pack size – 80.9 % contained only one active ingredient, 16.7 % contained two active ingredients, and 2.1 % contained three active ingredients (Annex 1, Table A7). In addition, 0.2 % (n=21) of the product presentations contained four active ingredients. Sales of products with three active ingredients were accounted for almost solely by products for individual treatment (injections, intramammary and intrauterine preparations), and sales of products containing four active ingredients were only accounted for by intramammary preparations.
For all 30 countries, 43.1 % of the product presentations of antimicrobial VMPs were for group treatment, i.e. premixes, oral powders and oral solutions. Of these, 83.2 % contained one active ingredient, 15.4 % two active ingredients and 1.3 % contained three active ingredients (Annex 1, Table A8).
Across the 30 countries, of the total sales of premixes, oral powders and oral solutions, in tonnes of active ingredient, 81.9 %, 17.5 % and 0.5 % were accounted for by products containing 1, 2 and 3 active ingredients, respectively (Figure 43).
Figure 43. Percentage of sales, in tonnes of active ingredient, of premixes, oral powders and oral solutions containing 1, 2, 3 and 4 antimicrobial agents, in 2015
2.7. Sales of tablets by veterinary antimicrobial class for companion animalsTablets are excluded from the dataset used to report sales for food-producing animals based on the assumption that tablets are used almost solely for companion animals. Figure 44 shows the distribution of sales of tablets, in tonnes of active ingredient, by antimicrobial class and country, for 2015. The sales patterns for tablets varied substantially between countries, but in general the most-sold tablets contained penicillins (mainly in combination with a beta-lactamase inhibitor, see Figure 45).
Antimicrobial medicinal products marketed for human use can also be used in companion animals, in application of Article 10 of Directive 2001/82/EC, as amended, of the European Parliament and of the Council. Such sales are included in the sales data for human antimicrobial agents (ESAC-net data) if, for instance, they are based on pharmacy sales and not on the reimbursement of physicians’ prescriptions, as provided by insurance companies. Therefore, the data presented in Figure 44 only covers sales of tablets containing antimicrobials marketed for veterinary use and should be interpreted as such. In the current report, all injectable veterinary antimicrobial products are included in the sales data for food-producing animals, but some of the injectable preparations are also used in companion animals and a few are only marketed for companion animals.
81.9%
0.03%0.5%
17.5%
1 ingredient
2 ingredients
3 ingredients
4 ingredients

Sales of veterinary antimicrobial agents in 30 European countries in 2015Seventh ESVAC report54
Figure 44. Distribution of sales of tablets, in tonnes of active ingredient, by antimicrobial class (reported according to the ATCvet hierarchical system), by country, for 2015 1, 2
1 Small amount of aminoglycosides, amphenicols, polymyxins, 3rd- and 4th-gen. cephalosporins and other antibacterials (classified as such in the ATCvet system) were sold in some countries, but are not included in this figure. No sales of VMP tablets containing other quinolones were reported.
2 In Romania, 65 % (1.5 tonnes) of tablets sold were indicated for poultry (tablets authorised for use in chickens are milled into powder and mixed with the feed).
Aggregated by 30 countries, penicillins (39 %), 1st- and 2nd-generation cephalosporins (25 %), sulfonamides (10 %) and macrolides (8 %) were the most-sold antimicrobial classes of tablets.
The sales (tonnes active substance) of penicillin tablets varied significantly in terms of distribution by penicillin subclasses in the 30 countries (Figure 45). Combinations of penicillins with beta-lactamase inhibitors represented from 0 % to 100 % (in seven countries) of the total sales of penicillin tablets (sales of clavulanic acid inhibitors as such are not included in the data).
Aus
tria
Bel
gium
Bul
garia
Cro
atia
Cyp
rus
Cze
ch R
epub
licD
enm
ark
Esto
nia
Finl
and
Fran
ceG
erm
any
Gre
ece
Hun
gary
Icel
and
Irel
and
Ital
yLa
tvia
Lith
uani
aLu
xem
bour
gN
ethe
rlan
dsN
orw
ayPo
land
Port
ugal
Rom
ania
Slo
vaki
aSlo
veni
aSpa
inSw
eden
Switz
erla
ndU
nite
d Kin
gdom
Tetracyclines
Penicillins
1st- and 2nd-gen. cephalosporins
Sulfonamides
Trimethoprim
Macrolides
Lincosamides
Fluoroquinolones
0%
10%
20%
30%
40%
50%
60%
70%
80%
90%
100%

Sales of veterinary antimicrobial agents in 30 European countries in 2015Seventh ESVAC report 55
Figure 45. Distribution of sales (by weight of active ingredient) of tablets containing penicillins by subclass, by country, in 2015
* In the ATCvet system, classified as combinations of penicillins which includes penicillin + beta-lactamase inhibitors.
2.8. Changes across time
Throughout the report, there is a special focus either on those antimicrobials that belong to the high-selling classes, or are among those considered of the highest importance in the AMEG categorisation, or are included in the WHO list of the highest priority CIAs.
The WHO list of the highest priority CIAs has recently been revised and the AMEG is in the process of revising its categorisation (see Annex 5, Table A16).
Chapter 2.8.1 presents the changes across time for all participating countries for the most-sold classes (tetracyclines, penicillins and sulfonamides) and the antimicrobials belonging to AMEG Category 2 as well as those additional classes classified by WHO as highest priority CIA for human medicine (Table A16). These are quinolones (fluoroquinolones and other quinolones), 3rd- and 4th-generation cephalosporins, macrolides and polymyxins (glycopeptides and carbapenems are not authorised for use in food-producing animals in the ESVAC participating countries).
Chapter 2.8.2 focuses on some of the antimicrobial classes that are included in the categorisation of antimicrobial agents made by the EMA Antimicrobial Advice ad hoc Expert Group (AMEG), in terms of their public health importance in Europe21 (Annex 5, Table A16).
21 Available on the EMA website (www.ema.europa.eu): via Home > Veterinary regulatory > Overview > Antimicrobial resistance > Use of antibiotics in animals (http://www.ema.europa.eu/docs/en_GB/document_library/Other/2014/07/WC500170253.pdf)
0%
10%
20%
30%
40%
50%
60%
70%
80%
90%
100%
Aust
riaBe
lgiu
mBu
lgar
iaCr
oatia
Cypr
usCz
ech
Repu
blic
Denm
ark
Esto
nia
Finl
and
Fran
ceGe
rman
yGr
eece
Hung
ary
Icel
and
Irel
and
Ital
yLa
tvia
Lith
uani
aLu
xem
bour
gNe
ther
land
sNo
rway
Pola
ndPo
rtug
alRo
man
iaSl
ovak
iaSl
oven
iaSp
ain
Swed
enSw
itzer
land
Unite
d Ki
ngdo
m
Penicillins with extended spectrum Penicillins + beta-lactamase-inhib.*

Sales of veterinary antimicrobial agents in 30 European countries in 2015Seventh ESVAC report56
2.8.1. Overall changes in the ESVAC participating countries
2.8.1.1. Changes in sales of tonnes of active ingredients, by country
Figure 46. Sales, in tonnes of active ingredients, of veterinary antimicrobials for food-producing animals, between 2010 to 2015, in 30 European countries1-8
1 Correction of sales data published in the ESVAC 2014 report is described in Chapter 1.5.2 Under-reported for Bulgaria for 2011, 2012 and 2014 as several wholesalers failed to report data. 3 Strength reported as the base for most VMPs for 2011-2012 for the Czech Republic; for 2013-2015, strength reported
as in the VMPs’ label. 4 Strength reported as the base for some VMPs for 2011–2012 for the Netherlands; for 2013-2015, strength reported
as in the label of the VMPs. 5 For Romania, 2014 data was updated, as wholesalers initially failed to deliver all sales data.6 For Slovakia, for 2011 and 2012, the data only represents antimicrobial VMPs imported by wholesalers; from 2013, data represents
all sales from wholesalers to end-users (veterinarians, pharmacies, producers of medicated feeding stuffs and farmers, obtained by import and from national manufacturers).
7 For Spain, under-reporting has been identified for 2010 to 2013 (underestimates). 8 For the UK, high sales of certain products containing tetracyclines late in 2010 were probably used in 2011 and thus their use
has been underestimated for 2011. For more details, see Chapter 2.8.2.
AustriaBelgiumBulgariaCroatiaCyprus
Czech RepublicDenmark
EstoniaFinlandFrance
GermanyGreece
HungaryIcelandIreland
ItalyLatvia
LithuaniaLuxembourgNetherlands
NorwayPoland
PortugalRomaniaSlovakiaSlovenia
SpainSweden
SwitzerlandUnited Kingdom
0 500 1,000 1,500 2,000 2,500 3,000 3,500
2010 2011 2012 2013 2014 2015
Tonnes

Sales of veterinary antimicrobial agents in 30 European countries in 2015Seventh ESVAC report 57
2.8.1.2. Changes in overall sales in mg/PCU, by country
Figure 47. Total sales of veterinary antimicrobial agents for food-producing species, in mg/PCU, from 2010 to 2015, for 30 European countries1-8
1 Correction of sales data and/or PCU data published in the ESVAC 2014 report is described in Chapter 1.5.2 Under-reported for Bulgaria for 2011, 2012 and 2014 as several wholesalers failed to report data. 3 Strength reported as the base for most VMPs for 2011-2012 for the Czech Republic; for 2013-2015, strength reported
as in the label of the VMPs.4 Strength reported as the base for some VMPs for 2011–2012 for the Netherlands; for 2013-2015, strength reported
as in the VMPs’ label.5 For Romania, 2014 data was updated, as wholesalers initially failed to deliver all sales data.6 For Slovakia, for 2011 and 2012, the data represents antimicrobial VMPs imported by wholesalers; from 2013 data represents
all sales from wholesalers to end-users (veterinarians, pharmacies, producers of medicated feeding stuffs and farmers, obtained by import and from national manufacturers).
7 For Spain, under-reporting for the years 2010 to 2013 has been identified (underestimated). 8 For the UK, high sales of certain tetracycline-containing products late in 2010 were probably used in 2011 and thus their use
has been underestimated for 2011. For more details, see Chapter 2.8.2.
For the 25 countries that reported data for all years from 2011 to 2015, a drop of more than 5 % (range 6.9 % to 53.7 %) in the sales (mg/PCU) was observed for 15 countries (Table 8). For eight countries, an increase of more than 5 % is seen (range 6.5 % to 31.7 %).
AustriaBelgiumBulgariaCroatiaCyprus
Czech RepublicDenmark
EstoniaFinlandFrance
GermanyGreece
HungaryIcelandIreland
ItalyLatvia
LithuaniaLuxembourgNetherlands
NorwayPoland
PortugalRomaniaSlovakiaSlovenia
SpainSweden
SwitzerlandUnited Kingdom
0 50 100 150 200 250 300 350 400 450
2010 2011 2012 2013 2014 2015
mg/PCU

Sales of veterinary antimicrobial agents in 30 European countries in 2015Seventh ESVAC report58
Table 8. Annual sales of veterinary antimicrobial agents for food-producing species, in mg/PCU, for 30 European countries1, from 2010 to 2015
Country 2010 2011 2012 2013 2014 2015 Trends 2010-2015
Austria 62.9 54.5 54.9 57.2 56.3 50.7
Belgium 180.1 175.3 163.1 156.6 158.3 150.1
Bulgaria2 92.6 98.9 116.1 82.9 121.9
Croatia 114.8 101.6
Cyprus 407.6 396.5 425.8 391.5 434.2
Czech Republic3 94.3 83.0 79.8 82.2 79.5 68.1
Denmark 47.5 42.6 44.1 44.9 44.2 42.2
Estonia 70.9 70.7 62.9 70.4 77.1 65.2
Finland 22.7 21.9 21.8 22.4 22.3 20.4
France 136.0 116.5 102.7 95.0 107.0 70.2
Germany 211.5 204.8 179.7 149.3 97.9
Greece 57.2
Hungary 269.9 192.5 245.8 230.7 193.1 211.4
Iceland 12.7 6.6 5.9 5.3 5.2 5.0
Ireland 51.5 46.5 55.0 55.9 47.6 51.0
Italy 421.1 371.0 341.0 301.6 332.4 322.0
50.7
62.9
150.1
180.1
82.9
121.9
101.6
114.8
391.5
434.2
68.1
94.3
42.2
47.5
62.9
77.1
20.4
22.7
70.2
136.0
97.9
211.5
56.2
57.2
192.5
269.9
5.0
12.7
46.5
55.9
301.6
421.1
36.7
41.5
29.1
48.2
34.6
52.1
64.4
164.8
2.9
4.1
127.3
151.5
134.4
201.6
100.5
109.0
43.3
65.9
22.4
46.9
259.5
418.8
11.5
15.2
50.6
56.9
51.1
67.9

Sales of veterinary antimicrobial agents in 30 European countries in 2015Seventh ESVAC report 59
Latvia 39.5 36.7 41.5 37.7 36.7 37.6
Lithuania 48.2 41.3 39.2 29.1 35.5 35.1
Luxembourg 43.2 52.1 40.9 34.6
Netherlands4 164.8 113.8 74.9 69.9 68.4 64.4
Norway 4.1 3.7 3.8 3.7 3.1 2.9
Poland 127.3 135.2 151.5 140.8 138.9
Portugal 177.9 161.8 156.9 187.2 201.6 134.4
Romania5 109.0 100.5
Slovakia6 43.7 43.3 63.1 65.9 53.8
Slovenia 46.9 46.1 37.0 22.4 33.4 26.4
Spain7 259.5 335.8 302.4 317.1 418.8 402.0
Sweden 15.2 13.6 13.5 12.7 11.5 11.8
Switzerland 56.9 50.6
United Kingdom8 67.9 51.1 66.3 62.1 62.1 56.7
1 Correction of sales data and/or PCU data published in the ESVAC 2014 report is described in Chapter 1.5. 2 Under-reported for Bulgaria for 2011, 2012 and 2014 as several wholesalers failed to report data.3 Strength reported as the base for most VMPs for 2011-2012 for the Czech Republic; for 2013-2015, strength reported as in the label of the VMPs. 4 Strength reported as the base for some VMPs for 2011–2012 for the Netherlands; for 2013-2015, strength reported as in the label of the VMPs.5 For Romania, 2014 data was updated as wholesalers initially failed to deliver all sales data.6 For Slovakia, the data for 2011 and 2012 represents only imported antimicrobial VMPs by wholesalers; from 2013, data represent all sales from
wholesalers to end-users (veterinarians, pharmacies, producers of medicated feeding stuffs producers and farmers, obtained by import and from national manufacturers).
7 For Spain, under-reporting has been identified for the years 2010 to 2013.8 For the UK, high sales of certain tetracycline-containing products late in 2010 were probably used in 2011 and thus their use has
been underestimated for 2011. For more details, see Chapter 2.8.2.
50.7
62.9
150.1
180.1
82.9
121.9
101.6
114.8
391.5
434.2
68.1
94.3
42.2
47.5
62.9
77.1
20.4
22.7
70.2
136.0
97.9
211.5
56.2
57.2
192.5
269.9
5.0
12.7
46.5
55.9
301.6
421.1
36.7
41.5
29.1
48.2
34.6
52.1
64.4
164.8
2.9
4.1
127.3
151.5
134.4
201.6
100.5
109.0
43.3
65.9
22.4
46.9
259.5
418.8
11.5
15.2
50.6
56.9
51.1
67.9
Country 2010 2011 2012 2013 2014 2015 Trends 2010-2015
50.7
62.9
150.1
180.1
82.9
121.9
101.6
114.8
391.5
434.2
68.1
94.3
42.2
47.5
62.9
77.1
20.4
22.7
70.2
136.0
97.9
211.5
56.2
57.2
192.5
269.9
5.0
12.7
46.5
55.9
301.6
421.1
36.7
41.5
29.1
48.2
34.6
52.1
64.4
164.8
2.9
4.1
127.3
151.5
134.4
201.6
100.5
109.0
43.3
65.9
22.4
46.9
259.5
418.8
11.5
15.2
50.6
56.9
51.1
67.9
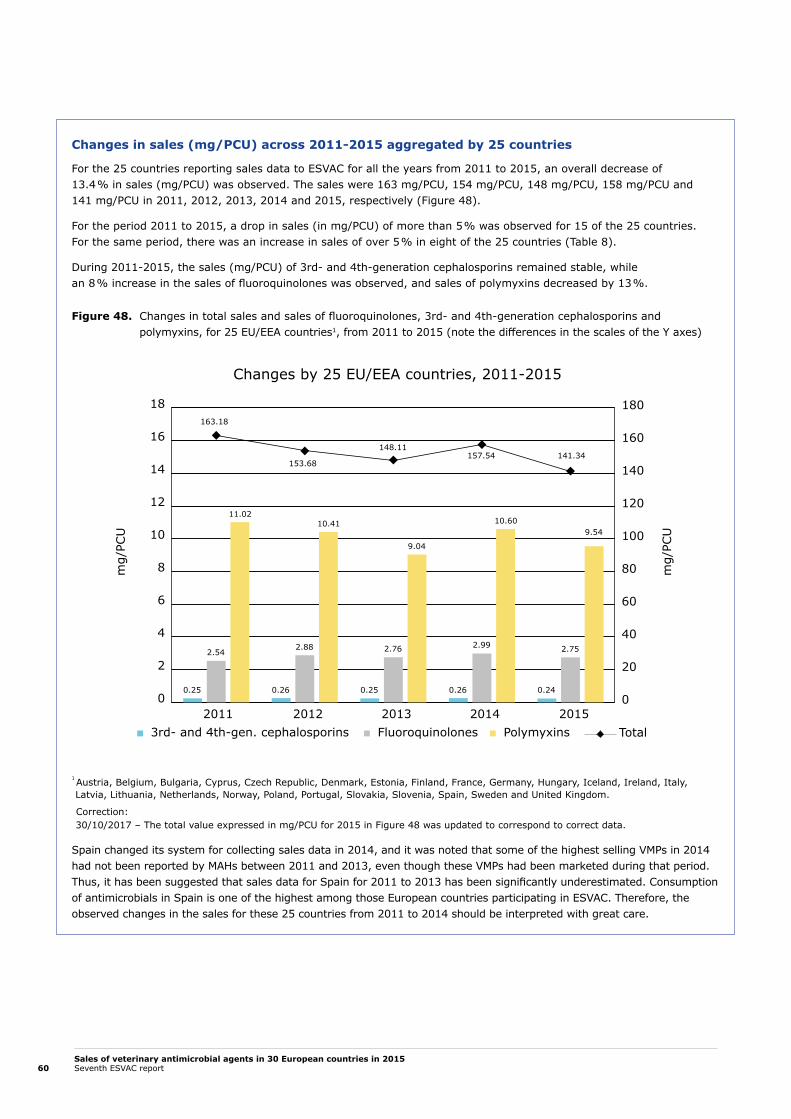
Changes in sales (mg/PCU) across 2011-2015 aggregated by 25 countries
For the 25 countries reporting sales data to ESVAC for all the years from 2011 to 2015, an overall decrease of 13.4 % in sales (mg/PCU) was observed. The sales were 163 mg/PCU, 154 mg/PCU, 148 mg/PCU, 158 mg/PCU and 141 mg/PCU in 2011, 2012, 2013, 2014 and 2015, respectively (Figure 48).
For the period 2011 to 2015, a drop in sales (in mg/PCU) of more than 5 % was observed for 15 of the 25 countries. For the same period, there was an increase in sales of over 5 % in eight of the 25 countries (Table 8).
During 2011-2015, the sales (mg/PCU) of 3rd- and 4th-generation cephalosporins remained stable, while an 8 % increase in the sales of fluoroquinolones was observed, and sales of polymyxins decreased by 13 %.
Figure 48. Changes in total sales and sales of fluoroquinolones, 3rd- and 4th-generation cephalosporins and polymyxins, for 25 EU/EEA countries1, from 2011 to 2015 (note the differences in the scales of the Y axes)
1 Austria, Belgium, Bulgaria, Cyprus, Czech Republic, Denmark, Estonia, Finland, France, Germany, Hungary, Iceland, Ireland, Italy,Latvia, Lithuania, Netherlands, Norway, Poland, Portugal, Slovakia, Slovenia, Spain, Sweden and United Kingdom.
Correction:30/10/2017 – The total value expressed in mg/PCU for 2015 in Figure 48 was updated to correspond to correct data.
Spain changed its system for collecting sales data in 2014, and it was noted that some of the highest selling VMPs in 2014 had not been reported by MAHs between 2011 and 2013, even though these VMPs had been marketed during that period. Thus, it has been suggested that sales data for Spain for 2011 to 2013 has been significantly underestimated. Consumption of antimicrobials in Spain is one of the highest among those European countries participating in ESVAC. Therefore, the observed changes in the sales for these 25 countries from 2011 to 2014 should be interpreted with great care.
0
2
4
6
8
10
12
14
16
18
0
20
40
60
80
100
120
140
160
180
0
20
40
60
80
100
120
140
160
180
3rd- and 4th-gen. cephalosporins PolymyxinsFluoroquinolones2011 2012 2013 2014 2015
Total
0.25
11.02
2.54
0.26
10.41
2.88
0.25
9.04
2.76
0.26
10.60
2.99
0.24
9.54
2.75
163.18
153.68
148.11157.54 141.34
Changes by 25 EU/EEA countries, 2011-2015
mg/
PCU
mg/
PCU
Sales of veterinary antimicrobial agents in 30 European countries in 2015Seventh ESVAC report60

Sales of veterinary antimicrobial agents in 30 European countries in 2015Seventh ESVAC report 61
2.8.1.3. Changes in sales by antimicrobial class in mg/PCU, by country
Sales of tetracyclines are shown in Figure 49. The sales of doxycycline are presented separately because of the lower dosing used in the treatment of animals compared to other tetracyclines and the high volume of sales attributed to this class of antimicrobials (Figure 50). Therefore, an increase in the sales of doxycycline could be associated with a reduction in total sales of tetracyclines.
Figure 49. Sales of tetracyclines for food-producing species, in mg/PCU, by 30 European countries, from 2010 to 20151
1 Sales in Iceland, Norway and Sweden ≤1 mg/PCU.
AustriaBelgiumBulgariaCroatiaCyprus
Czech RepublicDenmark
EstoniaFinlandFrance
GermanyGreece
HungaryIcelandIreland
ItalyLatvia
LithuaniaLuxembourgNetherlands
NorwayPoland
PortugalRomaniaSlovakiaSlovenia
SpainSweden
SwitzerlandUnited Kingdom
0 20 40 60 80 100 120 140 160 180 200
2010 2011 2012 2013 2014 2015
mg/PCUTetracyclines

Sales of veterinary antimicrobial agents in 30 European countries in 2015Seventh ESVAC report62
Figure 50. Sales of doxycycline for food-producing species, in mg/PCU, by 30 European countries, from 2010 to 20151
1 Countries not included in the figure: no sales in Iceland since 2012, negligible amount sold only in 2011; Finland, Ireland, Norway and Sweden, no sales reported for some of the years or sales were very low (≤0.14 mg/PCU); see Chapter 2.8.2.
In some countries, it can be observed that the overall sales of tetracyclines have decreased while sales of doxycycline have either increased or remained stable.
Austria
Belgium
Bulgaria
Croatia
Cyprus
Czech Republic
Denmark
Estonia
France
Germany
Greece
Hungary
Italy
Latvia
Lithuania
Luxembourg
Netherlands
Poland
Portugal
Romania
Slovakia
Slovenia
Spain
Switzerland
United Kingdom
0 5 10 15 20 25 30 35 40 45 50 55
2010 2011 2012 2013 2014 2015
mg/PCUDoxycycline

Sales of veterinary antimicrobial agents in 30 European countries in 2015Seventh ESVAC report 63
AustriaBelgiumBulgariaCroatiaCyprus
Czech RepublicDenmark
EstoniaFinlandFrance
GermanyGreece
HungaryIcelandIreland
ItalyLatvia
LithuaniaLuxembourgNetherlands
NorwayPoland
PortugalRomaniaSlovakiaSlovenia
SpainSweden
SwitzerlandUnited Kingdom
0 20 40 60 80 100
2010 2011 2012 2013 2014 2015
mg/PCUPenicillins
Figure 51. Sales of penicillins for food-producing species, in mg/PCU, by 30 European countries, from 2010 to 2015

Sales of veterinary antimicrobial agents in 30 European countries in 2015Seventh ESVAC report64
Figure 52. Sales of sulfonamides for food-producing species, in mg/PCU, by 30 European countries, from 2010 to 20151
1 Negligible sales in Iceland (<1mg/PCU), see Chapter 2.8.2.
AustriaBelgiumBulgariaCroatiaCyprus
Czech RepublicDenmark
EstoniaFinlandFrance
GermanyGreece
HungaryIcelandIreland
ItalyLatvia
LithuaniaLuxembourgNetherlands
NorwayPoland
PortugalRomaniaSlovakiaSlovenia
SpainSweden
SwitzerlandUnited Kingdom
0 20 40 60 80 100
2010 2011 2012 2013 2014 2015
mg/PCUSulfonamides

Sales of veterinary antimicrobial agents in 30 European countries in 2015Seventh ESVAC report 65
AustriaBelgiumBulgariaCroatiaCyprus
Czech RepublicDenmark
EstoniaFinlandFrance
GermanyGreece
HungaryIcelandIreland
ItalyLatvia
LithuaniaLuxembourgNetherlands
NorwayPoland
PortugalRomaniaSlovakiaSlovenia
SpainSweden
SwitzerlandUnited Kingdom
0.0 0.1 0.2 0.3 0.4 0.5 0.6 0.7 0.8
2010 2011 2012 2013 2014 2015
mg/PCU3rd- and 4th-generation cephalosporins
In Figures 53-57, critically important antimicrobials with the highest priority for humans, as defined by the WHO, and antimicrobial classes belonging to the AMEG Category 2 are highlighted. For more details, see Annex 5 and Table A16.
Figure 53. Sales of 3rd- and 4th-generation cephalosporins for food-producing species, in mg/PCU, by 30 European countries, from 2010 to 20151
1 For countries where the injectable 3rd- and 4th-generation cephalosporins are almost solely marketed for dogs and cats, the data provides a considerable overestimate for food-producing animals.

Sales of veterinary antimicrobial agents in 30 European countries in 2015Seventh ESVAC report66
Figure 54. Sales of fluoroquinolones for food-producing species, in mg/PCU, by 30 European countries, from 2010 to 20151
1 Negligible amounts sold in Denmark, Iceland, Norway and Sweden, see Chapter 2.8.2.
AustriaBelgiumBulgariaCroatiaCyprus
Czech RepublicDenmark
EstoniaFinlandFrance
GermanyGreece
HungaryIcelandIreland
ItalyLatvia
LithuaniaLuxembourgNetherlands
NorwayPoland
PortugalRomaniaSlovakiaSlovenia
SpainSweden
SwitzerlandUnited Kingdom
0 2 4 6 8 10 12
2010 2011 2012 2013 2014 2015
mg/PCUFluoroquinolones

Sales of veterinary antimicrobial agents in 30 European countries in 2015Seventh ESVAC report 67
Figure 55. Sales of quinolones (fluoroquinolones and other quinolones) for food-producing species, in mg/PCU, by 30 European countries, from 2010 to 20151
Correction: 30/10/2017 – Figure 55 was updated with corresponding values for sales of quinolones.
AustriaBelgiumBulgariaCroatiaCyprus
Czech RepublicDenmark
EstoniaFinlandFrance
GermanyGreece
HungaryIcelandIreland
ItalyLatvia
LithuaniaLuxembourgNetherlands
NorwayPoland
PortugalRomaniaSlovakiaSlovenia
SpainSweden
SwitzerlandUnited Kingdom
0 2 4 6 8 10 12 14
2010 2011 2012 2013 2014 2015
mg/PCUQuinolones

Sales of veterinary antimicrobial agents in 30 European countries in 2015Seventh ESVAC report68
Figure 56. Sales of polymyxins for food-producing species, in mg/PCU, by 30 European countries, from 2010 to 20151
1 No sales of polymyxins in Finland, Iceland and Norway for any of the years.
Austria
Belgium
Bulgaria
Croatia
Cyprus
Czech Republic
Denmark
Estonia
France
Germany
Greece
Hungary
Ireland
Italy
Latvia
Lithuania
Luxembourg
Netherlands
Poland
Portugal
Romania
Slovakia
Slovenia
Spain
Sweden
Switzerland
United Kingdom
0 5 10 15 20 25 30 35 40 45
2010 2011 2012 2013 2014 2015
mg/PCUPolymyxins

Sales of veterinary antimicrobial agents in 30 European countries in 2015Seventh ESVAC report 69
Figure 57. Sales of macrolides for food-producing species, in mg/PCU, by 30 European countries, from 2010 to 20151
1 No sales in Iceland; negligible sales in Norway; see Chapter 2.8.2.
2.8.1.4. Changes in the denominator (PCU) by country
From 2010 to 2015, the PCU (estimated weight at treatment of livestock and slaughtered animals) was relatively stable for most countries (Figure 58).
For two of the 25 countries (Estonia and Norway) that delivered data for these five years (2011-2015), an increase of more than 10 % was observed in the PCU, while for two countries (Cyprus and Italy) a decrease of more than 10 % was seen (see Chapter 2.8.2 for more detailed information).
Austria
Belgium
Bulgaria
Croatia
Cyprus
Czech Republic
Denmark
Estonia
Finland
France
Germany
Greece
Hungary
Ireland
Italy
Latvia
Lithuania
Luxembourg
Netherlands
Norway
Poland
Portugal
Romania
Slovakia
Slovenia
Spain
Sweden
Switzerland
United Kingdom
0 5 10 15 20 25 30 35
2010 2011 2012 2013 2014 2015
mg/PCUMacrolides

Sales of veterinary antimicrobial agents in 30 European countries in 2015Seventh ESVAC report70
Figure 58. Changes in the denominator (PCU) for food-producing animals, in 1000 tonnes, by country, between 2010 to 2015, in 30 European countries
AustriaBelgiumBulgariaCroatiaCyprus
Czech RepublicDenmark
EstoniaFinlandFrance
GermanyGreece
HungaryIcelandIreland
ItalyLatvia
LithuaniaLuxembourgNetherlands
NorwayPoland
PortugalRomaniaSlovakiaSlovenia
SpainSweden
SwitzerlandUnited Kingdom
0 1,000 2,000 3,000 4,000 5,000 6,000 7,000 8,000 9,000
2010 2011 2012 2013 2014 2015
PCU (1,000 tonnes)

Sales of veterinary antimicrobial agents in 30 European countries in 2015Seventh ESVAC report 71
2.8.2. Changes in sales (mg/PCU) across years, by countryThis chapter addresses sales per country per antimicrobial classes over the years. The second graph for each country highlights classes included under AMEG Category 2 which are common to the highest priority WHO CIAs (Table A16).
Austria
Figure 59. Sales (mg/PCU) by antimicrobial class in Austria, from 2010 to 20151
1 No sales of other quinolones during any of the years.* Other antibacterials (classified as such in the ATCvet system).
Overall, a drop of 19 % was observed in the total annual sales, in mg/PCU, between 2010 and 2015. This reduction is mainly due to a smaller amount of sold ingredients, as there were only minor changes in the PCU over the last years (Figure 58). The sales were dominated by tetracyclines, which accounted for 55 % of the total sales in 2015. Penicillins were the second highest sold antimicrobial class, sales of which were relatively stable over the last years. However, as the total amount decreased, the proportion of penicillins increased from 12 % to 17 % during the period 2010 to 2015. The overall reduction is mainly due to the withdrawal of tetracycline-sulfonamide combination products (the data did not show any compensation by other products).
Tetracyclines
Amphenicols
Penicillins
1st- and 2nd-gen.cephalosporins
3rd- and 4th-gen.cephalosporins
Sulfonamides
Trimethoprim
Macrolides
Lincosamides
Fluoroquinolones
Aminoglycosides
Polymyxins
Pleuromutilins
Others*
0 5 10 15 20 25 30 35 40
2010 2011 2012 2013 2014 2015
mg/PCUAustria0.0 0.5 1.0 1.5 2.0
3rd- and 4th-gen.cephalosporins
Fluoroquinolones
Polymyxins
2010 2011 2012 2013 2014 2015
mg/PCUAustria

Sales of veterinary antimicrobial agents in 30 European countries in 2015Seventh ESVAC report72
Figure 60. Sales (mg/PCU) of 3rd- and 4th-generation cephalosporins, fluoroquinolones and polymyxins in Austria, from 2010 to 2015
From 2010 to 2015, a drop in the sales (mg/PCU) of 3rd- and 4th-generation cephalosporins was observed. In addition, the proportion attributed to this subclass decreased from 0.5 % of the total sales in 2010 to 0.4 % in 2015. In the same year, the sales of 3rd- and 4th-generation cephalosporins were 0.21 mg/PCU, and average sales across the 25 countries were 0.24 mg/PCU (Figure 48).
The sales of fluoroquinolones were relatively stable over the years with a reduction of 12 % in 2015 compared to 2010. In 2015, the sales of fluoroquinolones in Austria were 0.53 mg/PCU, and the average sales for the countries were 2.75 mg/PCU (Figure 48).
Sales of polymyxins increased in 2015 by 69 % compared to the year 2010. In 2015, sales of polymyxins in Austria were 1.62 mg/PCU and the average sales of polymyxins for the 25 countries were 9.54 mg/PCU (Figure 48). The sales of zinc oxide (an alternative to colistin, which is the main group in the class of polymyxins) had yet to be reported in Austria; and only one product is currently on the market.
In Austria, a national action plan for the reduction of antimicrobial resistance was implemented in 2013. One of the main goals was to improve the monitoring system of antimicrobial consumption in veterinary medicines. Therefore, a new method for sales data collection was implemented in 2014. Wholesalers and MAHs are required to upload their sales data directly into a database, which lead to an improvement in data quality. In addition, VET-pharmacies must also report their sales to livestock holdings (including the species information).
Furthermore, different research projects concerning antimicrobial usage in poultry, pigs and cattle are in progress and prudent use campaigns have been implemented in conjunction with the animal health services.
Tetracyclines
Amphenicols
Penicillins
1st- and 2nd-gen.cephalosporins
3rd- and 4th-gen.cephalosporins
Sulfonamides
Trimethoprim
Macrolides
Lincosamides
Fluoroquinolones
Aminoglycosides
Polymyxins
Pleuromutilins
Others*
0 5 10 15 20 25 30 35 40
2010 2011 2012 2013 2014 2015
mg/PCUAustria0.0 0.5 1.0 1.5 2.0
3rd- and 4th-gen.cephalosporins
Fluoroquinolones
Polymyxins
2010 2011 2012 2013 2014 2015
mg/PCUAustria

Sales of veterinary antimicrobial agents in 30 European countries in 2015Seventh ESVAC report 73
Belgium
Figure 61. Sales (mg/PCU) by antimicrobial class in Belgium, from 2010 to 2015
* Other antibacterials (classified as such in the ATCvet system).
Correction:30/10/2017 - Sales values for aminoglycosides were added to Figure 61 to correspond to correct data.
After two consecutive years of a decreasing use of veterinary antibiotics (2012-2013) and an increase in antibiotic consumption of 1 % during 2014, a reduction of sales was observed again in 2015: -5.2 % versus the previous year. From 2010 (180 mg/PCU) to 2015 (150 mg/PCU), the use of veterinary antimicrobial agents in Belgium decreased by 17 %. Given the limited changes in the biomass (PCU) over this period, this merely reflects a reduction in sales of antibiotics, most notably in the classes of the most-used substances such as sulphonamides, tetracyclines and certain penicillins (amoxicillin and ampicillin). Otherwise, the proportion of different classes of substances used remains relatively stable.
A slight rise can be observed for macrolides, increasing from 5 % in 2010 (8.3 mg/PCU) to 6.5 % in 2015 (9.8 mg/PCU). A quite substantial increase (37 %) can be observed for other quinolones (flumequine) for 2015 (1.3 mg/PCU) versus 2014 (0.9 mg/PCU). Products based on this substance were mainly used in poultry.
Awareness campaigns addressing the prudent use of antibiotics and resistance are based primarily on the national monitoring programme ‘BelVet-SAC’ on which the Federal Agency for Medicines and Health Products (FAMHP)22 collaborates with the Faculty of Veterinary Medicine in Ghent University to collect and analyse data.
22 https://www.fagg-afmps.be/nl/DIERGENEESKUNDIG_gebruik/geneesmiddelen/geneesmiddelen/goed_gebruik/Antibiotica_0
Tetracyclines
Amphenicols
Penicillins
1st- and 2nd-gen.cephalosporins
3rd- and 4th-gen.cephalosporins
Sulfonamides
Trimethoprim
Macrolides
Lincosamides
Fluoroquinolones
Other quinolones
Aminoglycosides
Polymyxins
Pleuromutilins
Others*
mg/PCUBelgium0.0 0.5 1.0 1.5 2.0
3rd- and 4th-gen.cephalosporins
Fluoroquinolones
Polymyxins
mg/PCUBelgium
2010 2011 2012 2013 2014 2015
2010 2011 2012 2013 2014 2015
0 10 20 30 40 50 60

Sales of veterinary antimicrobial agents in 30 European countries in 2015Seventh ESVAC report74
Considering the upturn in the declining trend in 2015 versus the rather disappointing figures for 2014, the designation of actions by the Centre of Expertise on Antimicrobial Consumption and Resistance in Animals (AMCRA) and partners must continue. This positive but slowly declining trend was the basis for the preparation of additional legal measures during 2015 (centralised official data-collection system, restricted use of critically important antibiotics for human medicine) which should lead stakeholders towards a more substantial and quicker reduction in antibiotic use in the coming years.
Figure 62. Sales (mg/PCU) of 3rd- and 4th-generation cephalosporins, fluoroquinolones and polymyxins in Belgium, from 2010 to 2015
The fraction of sales (mg/PCU) accounted for by 3rd- and 4th-gen. cephalosporins has remained relatively stable since 2010, representing approximately 0.3 % of the total sales (0.43 mg/PCU in 2015). The portion of sales for the fluoroquinolones in 2015 was 0.7 % (1.04 mg/PCU). It should be noted that the steady increase since 2010 was reversed for the first time in 2015 (slight decrease versus 2014 (1.1 mg/PCU)).
In 2015, sales of 3rd- and 4th-generation cephalosporins were 0.43 mg/PCU while average sales for 25 countries accounted for 0.24 mg/PCU (Figure 48); sales of fluoroquinolones were 1.04 mg/PCU while the average sales of fluoroquinolones for 25 countries was 2.75 mg/PCU (Figure 48).
In September 2013, premixes of zinc oxide (ZnO) to be applied in therapeutic doses in weaned piglets were authorised for the first time. Use of ZnO increased slightly in 2015 up to 87.2 tonnes (+6.5 % compared to 2014), corresponding to treatment of approximately 7.5 million piglets. As ZnO replaces particularly colistin, polymyxin sales overall dropped further in 2015 (2.8 mg/PCU) compared to 2012 (5.8 mg/PCU), which was the year before ZnO premixes became available; this represents a decrease of 52 %.
Tetracyclines
Amphenicols
Penicillins
1st- and 2nd-gen.cephalosporins
3rd- and 4th-gen.cephalosporins
Sulfonamides
Trimethoprim
Macrolides
Lincosamides
Fluoroquinolones
Other quinolones
Aminoglycosides
Polymyxins
Pleuromutilins
Others*
mg/PCUBelgium
3rd- and 4th-gen.cephalosporins
Fluoroquinolones
Polymyxins
mg/PCUBelgium
2010 2011 2012 2013 2014 2015
2010 2011 2012 2013 2014 2015
0 10 20 30 40 50 60 0 1 2 3 4 5 6
Correction:17/01/2018 - Values were updated to correspond to correct data.

Sales of veterinary antimicrobial agents in 30 European countries in 2015Seventh ESVAC report 75
Bulgaria
Figure 63. Sales (mg/PCU) by antimicrobial class in Bulgaria, from 2011 to 2015
* Other antibacterials (classified as such in the ATCvet system).
During the collection of data on sales of antimicrobial veterinary medicinal products in Bulgaria it was established that the most-selling classes of antimicrobial VMPs in descending order were tetracyclines, penicillins, macrolides, sulfonamides, fluoroquinolones, aminoglycosides, amphenicols, lincosamides and polymyxins.
Tetracyclines were the most-selling antimicrobial VMPs class in Bulgaria during the last years, which might be related to their very wide range of action, applicable to treatment of conditions directly on farms.
Penicillins also accounted for a significant proportion of the sales of antimicrobial VMPs in Bulgaria.
The sulphonamides belonged to those classes with an important part of the sales volume of antimicrobial products for use in animals in Bulgaria. The dominant proportion of sulphonamides-containing medicines sold in Bulgaria was in combination with trimethoprim.
Tetracyclines
Amphenicols
Penicillins
1st- and 2nd-gen.cephalosporins
3rd- and 4th-gen.cephalosporins
Sulfonamides
Trimethoprim
Macrolides
Lincosamides
Fluoroquinolones
Other quinolones
Aminoglycosides
Polymyxins
Pleuromutilins
Others*
2011 2012 2013 2014 2015
mg/PCUBulgaria
3rd- and 4th-gen.cephalosporins
Fluoroquinolones
Polymyxins
2011 2012 2013 2014 2015
mg/PCUBulgaria
0 10 20 30 40 50 60 700 1 2 3 4 5 6 7 8

Sales of veterinary antimicrobial agents in 30 European countries in 2015Seventh ESVAC report76
Figure 64. Sales (mg/PCU) of 3rd- and 4th-generation cephalosporins, fluoroquinolones and polymyxins in Bulgaria, from 2011 to 2015
Sales of 3rd- and 4th-generation cephalosporins were relatively low during the study period.
Fluoroquinolones and polymyxins were sold in much greater quantities compared to 3rd- and 4th-generation cephalosporins, presumably due to the frequent occurrence of certain respiratory and urinary infections, when agents from these two antimicrobial classes were widely used due to their efficacy.
The national data collection system for sales of VMPs is currently being developed in Bulgaria and with supportive legislation this system implies that all veterinarians will be obliged to report any prescription and administration of medicines to animals.
The annual volume of sales of antimicrobial VMPs indicated the distribution of antimicrobial products from wholesalers and retailers to registered veterinarians and owners of animals. As the reporting of antimicrobial sales has been voluntary, the 2014 data probably presented an under-reporting of sales of antimicrobial VMPs. The sales detailed for 2013 and 2015 were considered to be close to actual antimicrobial sales in Bulgaria, as better feedback was received from wholesalers. Taking into account the complications experienced in collecting sales data, observed changes over the years should be interpreted with caution.
In the fight against the antimicrobial resistance, an addendum was made to the legislation regulating the control of use of VMPs and, in particular, to the prescription of VMPs - the maximum number of VMPs that can be included in one prescription, the maximum amount of each VMP that can be purchased, and the duration of the administration of the VMP.
Tetracyclines
Amphenicols
Penicillins
1st- and 2nd-gen.cephalosporins
3rd- and 4th-gen.cephalosporins
Sulfonamides
Trimethoprim
Macrolides
Lincosamides
Fluoroquinolones
Other quinolones
Aminoglycosides
Polymyxins
Pleuromutilins
Others*
2011 2012 2013 2014 2015
mg/PCUBulgaria
3rd- and 4th-gen.cephalosporins
Fluoroquinolones
Polymyxins
2011 2012 2013 2014 2015
mg/PCUBulgaria
0 10 20 30 40 50 60 700 1 2 3 4 5 6 7 8

Sales of veterinary antimicrobial agents in 30 European countries in 2015Seventh ESVAC report 77
Croatia
Figure 65. Sales (mg/PCU) by antimicrobial class in Croatia, from 2014 to 2015
* Other antibacterials (classified as such in the ATCvet system).
In 2015, tetracyclines, penicillins and sulfonamides were the most-sold classes accounting for 41 %, 21 % and 14 %, respectively, of the total sales of antimicrobials (mg/PCU) for food-producing species, including horses.
An apparent 11.5 % decrease in sales (mg/PCU) was observed in Croatia from 2014 to 2015. This decrease should be interpreted with caution as it was the result of the first two years of collecting data following the ESVAC common template, bearing in mind that the overall sales, in tonnes, can fluctuate from year to year. The denominator (PCU) for Croatia remained relatively stable (+0.3 %) across the two years of observation.
Tetracyclines
Amphenicols
Penicillins
1st- and 2nd-gen.cephalosporins
3rd- and 4th-gen.cephalosporins
Sulfonamides
Trimethoprim
Macrolides
Lincosamides
Fluoroquinolones
Other quinolones
Aminoglycosides
Polymyxins
Pleuromutilins
Others*
mg/PCUCroatia
3rd- and 4th-gen.cephalosporins
Fluoroquinolones
Polymyxins
2014 2015
mg/PCUCroatia0 10 20 30 40 50
0.0 0.5 1.0 1.5 2.0 2.5 3.0 3.5 4.0 4.5
2014 2015

Sales of veterinary antimicrobial agents in 30 European countries in 2015Seventh ESVAC report78
Figure 66. Sales (mg/PCU) of 3rd- and 4th-generation cephalosporins, fluoroquinolones and polymyxins in Croatia, from 2014 to 2015
In Croatia, sales (mg/PCU) of 3rd- and 4th-generation cephalosporins, fluoroquinolones and polymyxins represented 0.2 %, 3.4 % and 2.5 %, respectively, of total sales in 2015. In the same year, sales of 3rd- and 4th-generation cephalosporins were 0.21 mg/PCU; the average sales for 25 countries were 0.24 mg/PCU (Figure 48). Sales of fluoroquinolones were 3.49 mg/PCU; the average sales for 25 countries were 2.75 mg/PCU (Figure 48). Sales of polymyxins were 2.56 mg/PCU; the average sales for 25 countries were 9.54 mg/PCU (Figure 48).
Tetracyclines
Amphenicols
Penicillins
1st- and 2nd-gen.cephalosporins
3rd- and 4th-gen.cephalosporins
Sulfonamides
Trimethoprim
Macrolides
Lincosamides
Fluoroquinolones
Other quinolones
Aminoglycosides
Polymyxins
Pleuromutilins
Others*
mg/PCUCroatia
3rd- and 4th-gen.cephalosporins
Fluoroquinolones
Polymyxins
2014 2015
mg/PCUCroatia0 10 20 30 40 50
0.0 0.5 1.0 1.5 2.0 2.5 3.0 3.5 4.0 4.5
2014 2015

Sales of veterinary antimicrobial agents in 30 European countries in 2015Seventh ESVAC report 79
Cyprus
Figure 67. Sales (mg/PCU) by antimicrobial class in Cyprus, from 2011 to 2015
* Other antibacterials (classified as such in the ATCvet system).
The annual sales, in mg/PCU, of veterinary antimicrobials in Cyprus fluctuated during the period 2011 to 2015, with an increase of 6.5 % being observed. Note that the proportion of goats in Cyprus is relatively high compared to other countries participating in the ESVAC. This has a significant effect on the magnitude of PCU for Cyprus since living goats are not included in the PCU calculation for the ESVAC. Based on national statistics for the number of goats in Cyprus and an average treatment weight of about 45 kg, the living goat PCU would have added 11.6 thousand tonnes to the PCU. If goats had been included in the PCU, the total annual sales, in mg/PCU, would have been approximately 10 % lower.
Prescribing patterns have changed considerably from 2011 to 2015; in particular, sales of penicillins and sulfonamides have decreased while a substantial increase has been observed for tetracyclines (Figure 66). Sales of lincosamides also increased during this period, although a decline can be seen from 2013 to 2015.
A National Strategic Plan to combat AMR was published in December 2012 by the Ministry of Health under the ‘One Health’ approach. This plan is managed by the National Committee on Antibiotics, which includes representatives from both the human and veterinary medicine fields. Activities introduced by the National Strategic Plan focus mainly on human health although there are some actions in the veterinary field, too – for instance, improving diagnosing and the use of antibiotics in animals; and more specific measures to be taken to encourage the prudent use of antimicrobials in the veterinary field.
Tetracyclines
Amphenicols
Penicillins
1st- and 2nd-gen.cephalosporins
3rd- and 4th-gen.cephalosporins
Sulfonamides
Trimethoprim
Macrolides
Lincosamides
Fluoroquinolones
Other quinolones
Aminoglycosides
Polymyxins
Pleuromutilins
Others*
2011 2012 2013 2014 2015
mg/PCUCyprus
3rd- and 4th-gen.cephalosporins
Fluoroquinolones
Polymyxins
2011 2012 2013 2014 2015
mg/PCUCyprus
0 50 100 150 2000 2 4 6 8 10 12 14

Sales of veterinary antimicrobial agents in 30 European countries in 2015Seventh ESVAC report80
Moreover, a separate and specific action plan was considered to be the right tool to address the high level of veterinary antimicrobial sales in Cyprus over the last few years. To that end, a five-year Action Plan to combat AMR is currently being drafted by the Veterinary Services and will be subject to political agreement. The plan is expected to be adopted by the end of 2017. The draft plan contains several types of measures, including awareness-raising campaigns, strengthening the prevention of infections in food-producing animals, controls on the use of highest priority CIAs for human medicine, and recommendations on the prudent use of antimicrobials which are in line with the Commission’s published guidance.
Figure 68. Sales (mg/PCU) of 3rd- and 4th-generation cephalosporins, fluoroquinolones and polymyxins in Cyprus, from 2011 to 2015
In 2011, the 3rd- and 4th-generation cephalosporins accounted for 0.04 % of total sales; in 2015, this figure was 0.1 %. In the same year (2015), sales of 3rd- and 4th-generation cephalosporins were 0.35 mg/PCU, while the average sales for 25 countries were 0.24 mg/PCU (Figure 48).
For fluoroquinolones, the sales accounted for 0.13 % and 0.26 % of total sales in 2011 and 2015, respectively. In 2015, sales of fluoroquinolones were 1.11 mg/PCU, while the average sales for 25 countries were 2.75 mg/PCU (Figure 48).
Sales of polymyxins increased from 2.0 % of total sales in 2011 to 2.8 % in 2015. In 2015, sales of polymyxins, particularly colistin, were 12.37 mg/PCU, while the average sales for 25 countries were 9.54 mg/PCU (Figure 48).
Tetracyclines
Amphenicols
Penicillins
1st- and 2nd-gen.cephalosporins
3rd- and 4th-gen.cephalosporins
Sulfonamides
Trimethoprim
Macrolides
Lincosamides
Fluoroquinolones
Other quinolones
Aminoglycosides
Polymyxins
Pleuromutilins
Others*
2011 2012 2013 2014 2015
mg/PCUCyprus
3rd- and 4th-gen.cephalosporins
Fluoroquinolones
Polymyxins
2011 2012 2013 2014 2015
mg/PCUCyprus
0 50 100 150 2000 2 4 6 8 10 12 14

Sales of veterinary antimicrobial agents in 30 European countries in 2015Seventh ESVAC report 81
Czech Republic
From 2010 to 2015, total sales (mg/PCU) fell by 28 % in the Czech Republic (in tonnes, by 33 %), the largest decreases (in mg/PCU) were observed for tetracyclines (by 35 %) as the most-sold class; however, for other most frequently used classes also – penicillins, sulphonamides, pleuromutilins and macrolides – the decrease was quite significant (25 %, 18%, 32 % and 35 %, respectively).
Figure 69. Sales (mg/PCU) by antimicrobial class in the Czech Republic, from 2010 to 2015
* Other antibacterials (classified as such in the ATCvet system).
In 3rd- and 4th-generation cephalosporins: during the period 2010-2015, there were slight fluctuations in consumption (mean 0.37 mg/PCU, min 0.28 mg/PCU, max 0.41 mg/PCU). For fluoroquinolones (mean 1.63 mg/PCU), a trend towards a decrease started in 2012 (decrease by 7 % in 2012-2015) and in polymyxins, where consumption is traditionally low in the Czech Republic (mean 0.92 mg/PCU), the trend towards a decrease started in 2013 (decreasing by 10 % in 2013-2015).
Tetracyclines
Amphenicols
Penicillins
1st- and 2nd-gen.cephalosporins
3rd- and 4th-gen.cephalosporins
Sulfonamides
Trimethoprim
Macrolides
Lincosamides
Fluoroquinolones
Other quinolones
Aminoglycosides
Polymyxins
Pleuromutilins
Others*
0 5 10 15 20 25 30 35 40
mg/PCUCzech Republic0.0 0.5 1.0 1.5 2.0
3rd- and 4th-gen.cephalosporins
Fluoroquinolones
Polymyxins
mg/PCUCzech Republic
2010 2011 2012 2013 2014 2015
2010 2011 2012 2013 2014 2015

Sales of veterinary antimicrobial agents in 30 European countries in 2015Seventh ESVAC report82
Figure 70. Sales (mg/PCU) of 3rd- and 4th-generation cephalosporins, fluoroquinolones and polymyxins in the Czech Republic, from 2010 to 2015
The above-mentioned data show some remarkable changes in sales which indicate that more in-depth analyses are needed to identify the real changes in sales patterns, as well as real background on these. Explanation for the decrease could be partly due to a reduction in the use of herd/flock medication (with a significant decrease (by 66 %) in use within the group of medicated of premixes (2010 – 2015)). A decrease in sales of premixes was also caused by the switch to the use of medicines administered in drinking water, and at the same time to a change towards the treatment of individual animals and targeting the treatment (individuals as well as smaller groups of animals, where possible). All these changes are connected with the step-wise, but continuous improvement of herd/flock management measures leading to the better health status, especially in those farms introducing new technologies and also repopulation (pigs), in-house microbiological tests and selective use of antimicrobials at drying off (dairy cows), and improving biosecurity and care of parent flocks and one-day-old chicks, possibly influencing the decrease in sales of fluoroquinolones.
It should be noted, that for 2011 and 2012, the amount of actives for the major part of the antimicrobials VMP were provided as the base. To ensure complete harmonisation with the data from the other countries participating in the ESVAC, which typically provide the strength of the actives, as it appears on the VMP label, the strength of active ingredients in the VMP presentations for the Czech Republic has been reported to ESVAC according to the label since 2013.
Responsible and more targeted use of antimicrobials in 2015 can also be linked to the pilot programme on monitoring of the susceptibility/resistance of target veterinary pathogens. This project started in March 2015, based on the activity of a working group on antimicrobials lead by the Ministry of Agriculture. Such activity is connected not only with providing veterinarians with the results of MICs, but at the same time to raising awareness via the performance of trainings and publication of the results of this monitoring made available for veterinarians in practice.
Tetracyclines
Amphenicols
Penicillins
1st- and 2nd-gen.cephalosporins
3rd- and 4th-gen.cephalosporins
Sulfonamides
Trimethoprim
Macrolides
Lincosamides
Fluoroquinolones
Other quinolones
Aminoglycosides
Polymyxins
Pleuromutilins
Others*
0 5 10 15 20 25 30 35 40
mg/PCUCzech Republic0.0 0.5 1.0 1.5 2.0
3rd- and 4th-gen.cephalosporins
Fluoroquinolones
Polymyxins
mg/PCUCzech Republic
2010 2011 2012 2013 2014 2015
2010 2011 2012 2013 2014 2015

Sales of veterinary antimicrobial agents in 30 European countries in 2015Seventh ESVAC report 83
Denmark
Figure 71. Sales (mg/PCU) by antimicrobial class in Denmark, from 2010 to 2015
* Other antibacterials (classified as such in the ATCvet system).
From 2010 to 2015, overall sales (mg/PCU) of veterinary antimicrobial agents fell by 11 %. However, the sales from 2011 to 2015 fell by 1 %. This is mainly due to regulations in 2010 (the ‘Yellow card’ initiative) directed towards the 5-10 % of pig producers using most of the antimicrobial agents. In 2015, a new political target for reducing the antimicrobial consumption in pigs was set, aiming at 15 % reduction by the end of 2018, compared to the 2014 level.
The most-sold classes of antimicrobial VMPs in Denmark were tetracyclines and penicillins; in 2015, these classes accounted for 28 % and 28 %, respectively, of total sales.
The sales of macrolides accounted for approximately 11 % of total sales in 2015. From 2011 to 2015, the consumption of macrolides in food-producing animals increased by 1 %, but in comparison to 2010, sales of macrolides decreased by 19 %. Approximately 90 % of the macrolides (mostly tylosin) were used in pigs.
Tetracyclines
Amphenicols
Penicillins
1st- and 2nd-gen.cephalosporins
3rd- and 4th-gen.cephalosporins
Sulfonamides
Trimethoprim
Macrolides
Lincosamides
Fluoroquinolones
Other quinolones
Aminoglycosides
Polymyxins
Pleuromutilins
Others*
0 5 10 15 20
mg/PCUDenmark0.0 0.1 0.2 0.3 0.4 0.5 0.6
3rd- and 4th-gen.cephalosporins
Fluoroquinolones
Polymyxins
mg/PCUDenmark
2010 2011 2012 2013 2014 2015
2010 2011 2012 2013 2014 2015

Sales of veterinary antimicrobial agents in 30 European countries in 2015Seventh ESVAC report84
Figure 72. Sales (mg/PCU) of 3rd- and 4th-generation cephalosporins, fluoroquinolones and polymyxins in Denmark, from 2010 to 2015
In 2011 and in 2010, the 3rd- and 4th-generation cephalosporins accounted for 0.1 % of total sales; in 2015, this figure was 0.02 %, which is relatively low. From 2010 to 2015, the total sales (mg/PCU) of 3rd- and 4th-generations fell by 83 %, which is mainly due to a voluntary initiative by the pig industry to stop the use of 3rd- and 4th-generation cephalosporins in 2010.
Sales of fluoroquinolones for food-producing animals are generally low in Denmark, accounting for just 0.007 % of total sales in 2015. From 2010 to 2015, the total sales (mg/PCU) of fluoroquinolones fell by approximately 20 %. The reason for these rather low figures is strict regulation on the use of fluoroquinolones in food-producing animals which has been in force since 2002.
Sales of polymyxins for food-producing animals are generally low in Denmark, accounting for just 1.3 % of total sales in 2015. From 2010 to 2015, the total sales (mg/PCU) of polymyxins increased by approximately 102 %. The reason for this development has been the increasing use of polymyxins (colistin) in pigs.
There is focus on prudent use of antimicrobials in the pig production. In 2014, new legislation on antimicrobial treatment of groups of pigs was issued. The legislation introduced the following limitations: antimicrobials for group treatment may only be prescribed in connection with a consultation on the farm, and the veterinarian must verify the clinical diagnosis by laboratory testing.
Tetracyclines
Amphenicols
Penicillins
1st- and 2nd-gen.cephalosporins
3rd- and 4th-gen.cephalosporins
Sulfonamides
Trimethoprim
Macrolides
Lincosamides
Fluoroquinolones
Other quinolones
Aminoglycosides
Polymyxins
Pleuromutilins
Others*
0 5 10 15 20
mg/PCUDenmark0.0 0.1 0.2 0.3 0.4 0.5 0.6
3rd- and 4th-gen.cephalosporins
Fluoroquinolones
Polymyxins
mg/PCUDenmark
2010 2011 2012 2013 2014 2015
2010 2011 2012 2013 2014 2015

Sales of veterinary antimicrobial agents in 30 European countries in 2015Seventh ESVAC report 85
Estonia
Figure 73. Sales (mg/PCU) by antimicrobial class in Estonia, from 2010 to 2015
* Other antibacterials (classified as such in the ATCvet system).
The sales of veterinary antimicrobial agents (mg/PCU) in Estonia fluctuated slightly during the period 2010 to 2015, with an increase of 9 % from 2010 to 2014 and a decrease of 15 % from 2014 to 2015. The main reason for the decrease in 2015 is that there were notable changes in the total population of some species of food-producing animals. In 2015, the total number of pigs decreased significantly (~15 %) compared to 2014, and the number of sows fell by 26 %. During 2015, the number of slaughtered pigs increased by 4.4 %, but the import of pigs for slaughter increased, and the export of pigs for slaughter decreased. The number of dairy cows decreased by 5 % in 2015 compared to 2014.
As is apparent from Figure 73, sales patterns changed during the period. Penicillins and tetracyclines were the most-sold classes. In both, 2010 and 2015 the proportion accounted for by penicillins was close to 45 %, while an increase, from 13 % to 24 %, was observed for tetracyclines. The fall in sales of sulfonamides combined with trimethoprim may be related to an increase in sales of tetracyclines during this period — which are all authorised products — while sulfonamides and trimethoprim combination products for oral use are not, so special permission is required for their use.
In 2014, the sales of pleuromutilins (mg/PCU) increased almost six times compared to 2010. The observed increase in sales of pleuromutilins in 2014 compared to previous years is explained by extensive outbreaks of swine dysentery and higher morbidity of unknown aetiology in many large pig farms in Estonia during that year. Notably, since the second quarter of 2015, sales of tiamulin have stayed at almost the same level as in 2012.
As Estonia is a small country, changes in the treatment strategy on one or two major farms or outbreaks such as that described above may significantly influence sales patterns.
Tetracyclines
Amphenicols
Penicillins
1st- and 2nd-gen.cephalosporins
3rd- and 4th-gen.cephalosporins
Sulfonamides
Trimethoprim
Macrolides
Lincosamides
Fluoroquinolones
Other quinolones
Aminoglycosides
Polymyxins
Pleuromutilins
Others*
0 5 10 15 20 25 30 35
mg/PCUEstonia0 1 2 3 4 5 6
3rd- and 4th-gen.cephalosporins
Fluoroquinolones
Polymyxins
mg/PCUEstonia
2010 2011 2012 2013 2014 2015
2010 2011 2012 2013 2014 2015

Sales of veterinary antimicrobial agents in 30 European countries in 2015Seventh ESVAC report86
Figure 74. Sales (mg/PCU) of 3rd- and 4th-generation cephalosporins, fluoroquinolones and polymyxins in Estonia, from 2010 to 2015
From 2010 to 2015, overall sales (mg/PCU) of 3rd- and 4th-generation cephalosporins were relatively stable. In 2010 and 2015, the 3rd- and 4th-generation cephalosporins accounted for 0.5 % and 0.9 %, respectively, of total sales. In 2015, sales of 3rd- and 4th-generation cephalosporins were 0.61 mg/PCU, while the average sales for 25 countries were 0.24 mg/PCU (Figure 48).
Sales of fluoroquinolones decreased between 2010 and 2015, although fluctuations in sales were also observed. In 2010, fluoroquinolones accounted for 3.6 % of the total sales; in 2015, this figure was 2.8 %. In 2015, sales of fluoroquinolones were 1.80 mg/PCU; the average sales for 25 countries were 2.75 mg/PCU that year (Figure 48).
The sales of polymyxins fluctuated significantly during the period 2010 to 2015, rising by 64 % from 2010 to 2013, and falling considerably compared to previous year in 2014 (46 %) and in 2015 (57 %).
Tetracyclines
Amphenicols
Penicillins
1st- and 2nd-gen.cephalosporins
3rd- and 4th-gen.cephalosporins
Sulfonamides
Trimethoprim
Macrolides
Lincosamides
Fluoroquinolones
Other quinolones
Aminoglycosides
Polymyxins
Pleuromutilins
Others*
0 5 10 15 20 25 30 35
mg/PCUEstonia0 1 2 3 4 5 6
3rd- and 4th-gen.cephalosporins
Fluoroquinolones
Polymyxins
mg/PCUEstonia
2010 2011 2012 2013 2014 2015
2010 2011 2012 2013 2014 2015

Sales of veterinary antimicrobial agents in 30 European countries in 2015Seventh ESVAC report 87
Finland
Figure 75. Sales (mg/PCU) by antimicrobial class in Finland, from 2010 to 20151
1 No sales of other quinolones and polymyxins in any of the years.
Overall sales of veterinary antimicrobials during the period 2010-2014 were stable (approximately 22.2 mg/PCU per year) while a marked decrease was seen in 2015, with sales falling by 1.9 mg/PCU (-10 %) from the previous year. The highest decrease was seen in the sulfonamide-trimethoprim combination, tetracyclines and penicillins. At the same time, sales of macrolides increased slightly. Penicillins continued to be the most-sold antimicrobial class (47 % in 2015) followed by tetracyclines (21 %) and sulfonamides (19 %). The proportion of beta-lactamase-sensitive penicillins accounted for more than 86 % of the sales of all penicillins (Figure 7) and 90 % of penicillins sold were injectable preparations (Figure 18). In the longer term (from 2010), the most significant changes were the decrease in sales of penicillins and the sulfonamide-trimethoprim combination. In contrast, sales of tetracyclines were higher in 2015 than in 2010.
The reasons for decreased sales in 2015 are unknown. The next few years will tell whether this is a permanent trend. The total population of food-producing animals (measured as PCU) has remained relatively stable. Finland has a long history of promoting the health and welfare of food-producing animals and is free of several strategically important animal diseases. Although the animal disease situation in general is good, new infectious diseases have emerged; for example, Mycoplasma bovis was first isolated in 2012. It has since spread to larger areas and has caused multiple infections in cattle, especially in young animals. Finland’s prudent use recommendations lists injectable oxytetracycline as the first choice in treatment for respiratory infections caused by M. bovis, and macrolides, as the second. Sales of both these classes have increased.
Tetracyclines
Amphenicols
Penicillins
1st- and 2nd-gen.cephalosporins
3rd- and 4th-gen.cephalosporins
Sulfonamides
Trimethoprim
Macrolides
Lincosamides
Fluoroquinolones
Aminoglycosides
Pleuromutilins
0 2 4 6 8 10 12
mg/PCUFinland0.00 0.05 0.10 0.15 0.20
3rd- and 4th-gen.cephalosporins
Fluoroquinolones
mg/PCUFinland
2010 2011 2012 2013 2014 2015
2010 2011 2012 2013 2014 2015

Sales of veterinary antimicrobial agents in 30 European countries in 2015Seventh ESVAC report88
Figure 76. Sales (mg/PCU) of 3rd- and 4th-generation cephalosporins, fluoroquinolones and polymyxins in Finland, from 2010 to 20151
1 No sales of polymyxins in any of the years.
Sales of 3rd-generation cephalosporins and fluoroquinolones (in mg/PCU) in Finland have been low, and in 2015 decreased even further. Both antimicrobial classes are only available as injections. This decrease may be partially explained by the new national legislation that took effect in December 2014. It requires susceptibility testing before using CIA, for example. The use of 3rd- and 4th-generation cephalosporins is also restricted to the target species and indications approved in the summary of product characteristics (i.e. use under the cascade is not allowed). In addition, prudent use guidelines have been available since 1996 and were updated in spring 201623. Specific guidance on outbreaks is also given, for example, by the Animal Health ETT (a national association promoting the health and welfare of food-producing animals).
23 https://www.evira.fi/tietoa-evirasta/julkaisut/elaimet/oppaat/mikrobilaakkeiden-kayttosuositukset-elainten-tarkeimpiin-tulehdus-ja-tartuntatauteihin/ (in Finnish)
Tetracyclines
Amphenicols
Penicillins
1st- and 2nd-gen.cephalosporins
3rd- and 4th-gen.cephalosporins
Sulfonamides
Trimethoprim
Macrolides
Lincosamides
Fluoroquinolones
Aminoglycosides
Pleuromutilins
0 2 4 6 8 10 12
mg/PCUFinland0.00 0.05 0.10 0.15 0.20
3rd- and 4th-gen.cephalosporins
Fluoroquinolones
mg/PCUFinland
2010 2011 2012 2013 2014 2015
2010 2011 2012 2013 2014 2015

Sales of veterinary antimicrobial agents in 30 European countries in 2015Seventh ESVAC report 89
France
Figure 77. Sales (mg/PCU) by antimicrobial class in France, from 2010 to 2015
* Other antibacterials (classified as such in the ATCvet system).
In France, the total sales (mg/PCU) of antimicrobial agents fell by 48 % between 2010 and 2015.
The declining trends were observed for all antimicrobial classes.
Tetracyclines
Amphenicols
Penicillins
1st- and 2nd-gen.cephalosporins
3rd- and 4th-gen.cephalosporins
Sulfonamides
Trimethoprim
Macrolides
Lincosamides
Fluoroquinolones
Other quinolones
Aminoglycosides
Polymyxins
Pleuromutilins
Others*
0 10 20 30 40 50 60 70
mg/PCUFrance0 2 4 6 8 10
3rd- and 4th-gen.cephalosporins
Fluoroquinolones
Polymyxins
mg/PCUFrance
2010 2011 2012 2013 2014 2015
2010 2011 2012 2013 2014 2015

Sales of veterinary antimicrobial agents in 30 European countries in 2015Seventh ESVAC report90
Figure 78. Sales (mg/PCU) of 3rd- and 4th-generation cephalosporins, fluoroquinolones and polymyxins in France, from 2010 to 2015
The sales of 3rd- and 4th-generation cephalosporins (mg/PCU) fell by 33 % between 2010 and 2015. The sales (mg/ PCU) of fluoroquinolones fell by 47 % between 2010 and 2015. The sales (mg/PCU) of polymyxins fell by 53 % between 2010 and 2015.
The important decrease in antimicrobials used in animals seen in France is the result of a collective action by all stakeholders to implement the French Action Plan EcoAntibio 2012-2017.
The EcoAntibio Plan, launched on 18 November 2011, covered a five-year period, from 2012 to 2016, inclusive. Its main objective was to reduce the exposure of animals to antibiotics by 25 % in five years.
The decrease observed can also be linked to the publication of a new law in 2014 on the future of agriculture which includes a number of measures for antimicrobials. In 2014, this led to an increase in sales due to stocks created by stakeholders involved in the sales/delivery of antimicrobials. This was followed by an important decrease in 2015.
The law on the future of agriculture, food and forestry sets a target of 25 % reduction in three years (compared to 2013) in the use of 3rd- and 4th-generation cephalosporins and fluoroquinolones. Specific measures have been undertaken on critically important antimicrobials through a decree limiting the use of 3rd- and 4th-generation cephalosporins and fluoroquinolones. These elements can explain the important decrease in these antimicrobial classes.
Tetracyclines
Amphenicols
Penicillins
1st- and 2nd-gen.cephalosporins
3rd- and 4th-gen.cephalosporins
Sulfonamides
Trimethoprim
Macrolides
Lincosamides
Fluoroquinolones
Other quinolones
Aminoglycosides
Polymyxins
Pleuromutilins
Others*
0 10 20 30 40 50 60 70
mg/PCUFrance0 2 4 6 8 10
3rd- and 4th-gen.cephalosporins
Fluoroquinolones
Polymyxins
mg/PCUFrance
2010 2011 2012 2013 2014 2015
2010 2011 2012 2013 2014 2015

Sales of veterinary antimicrobial agents in 30 European countries in 2015Seventh ESVAC report 91
Germany
Figure 79. Sales (mg/PCU) by antimicrobial class in Germany, from 2011 to 20151
1 No sales of other quinolones in any of the years.* Other antibacterials (classified as such in the ATCvet system).
In Germany, a 54 % decrease in the overall sales (mg/PCU) of veterinary antimicrobial agents was observed between 2011 and 2015. The greatest reduction was noted for trimethoprim (-72 %), macrolides (-69 %), tetracyclines (-62 %), sulphonamides (-62 %), and aminoglycosides (-60 %).
Overall sales (mg/PCU) decreased every year, with the largest fall observed from 2014 to 2015 (-34 %).
In Germany, the antibiotic minimising concept of the 16th amendment of the Medicines Act came into force in the second half of 2014. Farmers who keep cattle, pigs, chicken or turkeys for fattening purposes have to report the frequency of antimicrobial treatment on their farm. German farms are compared with one another every half-year. If the frequency of therapy is above the third quartile of all farms, a management plan is issued and sent to the supervisory authority. This antibiotic minimising concept cannot be set in direct numeric relation to the decrease in sales data for veterinary antimicrobial agents, but it appears to be having an effect.
Tetracyclines
Amphenicols
Penicillins
1st- and 2nd-gen.cephalosporins
3rd- and 4th-gen.cephalosporins
Sulfonamides
Trimethoprim
Macrolides
Lincosamides
Fluoroquinolones
Aminoglycosides
Polymyxins
Pleuromutilins
Others*
2011 2012 2013 2014 2015
mg/PCUGermany
3rd- and 4th-gen.cephalosporins
Fluoroquinolones
Polymyxins
2011 2012 2013 2014 2015
mg/PCUGermany
0 20 40 60 80 0 5 10 15 20

Sales of veterinary antimicrobial agents in 30 European countries in 2015Seventh ESVAC report92
Figure 80. Sales (mg/PCU) of 3rd- and 4th-generation cephalosporins, fluoroquinolones and polymyxins in Germany, from 2011 to 2015
Sales, in mg/PCU, of 3rd- and 4th-generation cephalosporins were relatively stable during the period 2011 to 2015. In 2011, sales of 3rd- and 4th-generation cephalosporins were 0.40 mg/PCU, while in 2015, they were 0.41 mg/PCU.
Sales of fluoroquinolones rose by around 50 % from 2011 to 2014, but decreased by 16 % from 2014 to 2015. In 2011, sales of fluoroquinolones were 0.91 mg/PCU, while in 2015, they were 1.14 mg/PCU.
Sales of polymyxins were 14.84 mg/PCU in 2011 and 9.20 mg/PCU in 2015, which is a decrease of 38 %.
Tetracyclines
Amphenicols
Penicillins
1st- and 2nd-gen.cephalosporins
3rd- and 4th-gen.cephalosporins
Sulfonamides
Trimethoprim
Macrolides
Lincosamides
Fluoroquinolones
Aminoglycosides
Polymyxins
Pleuromutilins
Others*
2011 2012 2013 2014 2015
mg/PCUGermany
3rd- and 4th-gen.cephalosporins
Fluoroquinolones
Polymyxins
2011 2012 2013 2014 2015
mg/PCUGermany
0 20 40 60 80 0 5 10 15 20

Sales of veterinary antimicrobial agents in 30 European countries in 2015Seventh ESVAC report 93
Greece
Figure 81. Sales (mg/PCU) by antimicrobial class in Greece, in 2015
In 2015, sales for veterinary antimicrobial agents were reported to the ESVAC for the first time. Data were provided by 39 marketing authorisation holders (MAHs). Negligible sales from a few MAHs with a very small market share, and who do not have local representatives in the country, were not included in the 2015 dataset.
In the same year, the total sales of antimicrobial VMPs in Greece were 57 mg/PCU. Tetracyclines, penicillins and sulfonamides were the most-sold classes accounting for 42 %, 20 % and 12 %, respectively, of the total sales of antimicrobials (mg/PCU) for food-producing species, including horses.
The vast majority of the denominator (PCU) for Greece was accounted for by caprine animals (63 %), which is currently the highest proportion among other ESVAC participating countries.
Tetracyclines
Amphenicols
Penicillins
3rd- and 4th-gen.cephalosporins
Sulfonamides
Trimethoprim
Macrolides
Lincosamides
Fluoroquinolones
Other quinolones
Aminoglycosides
Polymyxins
Pleuromutilins
2015
mg/PCUGreece
3rd- and 4th-gen.cephalosporins
Fluoroquinolones
Polymyxins
2015
mg/PCUGreece
0 2 4 6 8 10 12 14 16 18 20 22 24 26 0 1 2 3 4

Sales of veterinary antimicrobial agents in 30 European countries in 2015Seventh ESVAC report94
Figure 82. Sales (mg/PCU) of 3rd- and 4th-generation cephalosporins, fluoroquinolones and polymyxins in Greece, in 2015
In Greece, the sales (mg/PCU) of 3rd- and 4th-generation cephalosporins, fluoroquinolones and polymyxins represented 0.2 %, 3 % and 6 %, respectively, of total sales in 2015. In the same year, the sales of 3rd- and 4th-generation cephalosporins were 0.09 mg/PCU, while the average figure for 25 countries was 0.24 mg/PCU in 2015 (Figure 48). Sales of fluoroquinolones were 1.69 mg/PCU, while the average sales for 25 countries in 2015 accounted for 2.75 mg/ PCU (Figure 48). In the same year sales of polymyxins were 3.37 mg/PCU, while the average figure for 25 countries was 9.54 mg/PCU (Figure 48).
Tetracyclines
Amphenicols
Penicillins
3rd- and 4th-gen.cephalosporins
Sulfonamides
Trimethoprim
Macrolides
Lincosamides
Fluoroquinolones
Other quinolones
Aminoglycosides
Polymyxins
Pleuromutilins
2015
mg/PCUGreece
3rd- and 4th-gen.cephalosporins
Fluoroquinolones
Polymyxins
2015
mg/PCUGreece
0 2 4 6 8 10 12 14 16 18 20 22 24 26 0 1 2 3 4

Sales of veterinary antimicrobial agents in 30 European countries in 2015Seventh ESVAC report 95
Hungary
Figure 83. Sales (mg/PCU) by antimicrobial class for Hungary, from 2010 to 2015
* Other antibacterials (classified as such in the ATCvet system).
Total sales (mg/PCU) fluctuated during 2010 to 2015; the observed sales were 269.9 mg/PCU, 192.5 mg/PCU, 245.8 mg/ PCU, 230.7 mg/PCU, 193.1 mg/PCU and 211.4 mg/PCU, respectively for each year. In 2010, the system for collecting data was different, wholesalers reported the amounts sold to each other as well, so the data from this year have probably been overestimated. From 2011 to 2015 a 9.8 % total increase was observed. The most-sold classes were tetracyclines and penicillins across all five years. From 2011 to 2015, the proportion of tetracycline sales increased slightly, as did the proportion of penicillin sales. The annual sale of macrolides remained stable, with a transient decrease in 2014. The proportion accounted for by sulphonamides increased during 2011 to 2015 but remains below average.
Tetracyclines
Amphenicols
Penicillins
1st- and 2nd-gen.cephalosporins
3rd- and 4th-gen.cephalosporins
Sulfonamides
Trimethoprim
Macrolides
Lincosamides
Fluoroquinolones
Other quinolones
Aminoglycosides
Polymyxins
Pleuromutilins
Others*
0 25 50 75 100 125 150
mg/PCUHungary0 2 4 6 8 10 12
3rd- and 4th-gen.cephalosporins
Fluoroquinolones
Polymyxins
mg/PCUHungary
2010 2011 2012 2013 2014 2015
2010 2011 2012 2013 2014 2015

Sales of veterinary antimicrobial agents in 30 European countries in 2015Seventh ESVAC report96
Figure 84. Sales (mg/PCU) of 3rd- and 4th-generation cephalosporins, fluoroquinolones and polymyxins in Hungary, from 2010 to 2015
Sales (mg/PCU) of 3rd- and 4th-generation cephalosporins increased during the period 2011 to 2015, from 0.14 mg/PCU (2011) to 0.38 mg/PCU (2015). Sales of fluoroquinolones fluctuated during this period, between 6.74 mg/PCU (2011) and 10.98 mg/PCU (2012). In 2015, sales of fluoroquinolones were 9.46 mg/PCU, while average sales for 25 countries were 2.75 mg/PCU (Figure 48).
Sales (mg/PCU) of polymyxins also fluctuated, with a slight increase in 2013. In 2015, sales of polymyxins were 9.61 mg/PCU, while the average sales for the 25 countries which delivered data from 2011 to 2015 were 9.54 mg/PCU (Figure 48).
Tetracyclines
Amphenicols
Penicillins
1st- and 2nd-gen.cephalosporins
3rd- and 4th-gen.cephalosporins
Sulfonamides
Trimethoprim
Macrolides
Lincosamides
Fluoroquinolones
Other quinolones
Aminoglycosides
Polymyxins
Pleuromutilins
Others*
0 25 50 75 100 125 150
mg/PCUHungary0 2 4 6 8 10 12
3rd- and 4th-gen.cephalosporins
Fluoroquinolones
Polymyxins
mg/PCUHungary
2010 2011 2012 2013 2014 2015
2010 2011 2012 2013 2014 2015

Sales of veterinary antimicrobial agents in 30 European countries in 2015Seventh ESVAC report 97
Iceland
Figure 85. Sales (mg/PCU) by antimicrobial class in Iceland, from 2010 to 20151
1 No sales of amphenicols, macrolides and polymyxins in any of the years.* Other antibacterials (classified as such in the ATCvet system).
A gradual decline of 31 % in sales, in mg/PCU, was observed from 2010 to 2015 (Table 8). The decrease from 2010 was caused by a reduction in the sales of several products, in particular aminoglycosides and tetracyclines. However, no definite conclusion can be reached for the time being as to what caused these changes, although there has been increased general awareness of the importance of the responsible use of antimicrobials.
Tetracyclines
Penicillins
3rd- and 4th-gen.cephalosporins
Sulfonamides
Trimethoprim
Lincosamides
Fluoroquinolones
Other quinolones
Aminoglycosides
Pleuromutilins
Others*
0 1 2 3 4 5
mg/PCUIceland0.000 0.002 0.004 0.006 0.008 0.010 0.012
3rd- and 4th-gen.cephalosporins
Fluoroquinolones
mg/PCUIceland
2010 2011 2012 2013 2014 2015
2010 2011 2012 2013 2014 2015

Sales of veterinary antimicrobial agents in 30 European countries in 2015Seventh ESVAC report98
Figure 86. Sales (mg/PCU) of 3rd- and 4th-generation cephalosporins and fluoroquinolones in Iceland, from 2010 to 20151
1 No sales of polymyxins in any of the years.
Sales (mg/PCU) of 3rd- and 4th-generation cephalosporins and fluoroquinolones in Iceland are very low.
The sales, in mg/PCU, of 3rd- and 4th-generation cephalosporins declined by 41 % from 2010 to 2015. In 2010, the 3rd- and 4th-generation cephalosporins accounted for 0.1 % of total sales; for 2015, this figure was also 0.1 %. In 2015, sales of 3rd- and 4th-generation cephalosporins were 0.004 mg/PCU, while average sales for 25 countries were 0.24 mg/PCU (Figure 48).
Sales of fluoroquinolones fell by 32 % from 2010 to 2015. In 2010, fluoroquinolones accounted for 0.06 % of total sales in 2010 and 2015. In 2015, sales of fluoroquinolones were 0.003 mg/PCU, while the average sales for 25 countries were 2.75 mg/PCU (Figure 48).
Tetracyclines
Penicillins
3rd- and 4th-gen.cephalosporins
Sulfonamides
Trimethoprim
Lincosamides
Fluoroquinolones
Other quinolones
Aminoglycosides
Pleuromutilins
Others*
0 1 2 3 4 5
mg/PCUIceland0.000 0.002 0.004 0.006 0.008 0.010 0.012
3rd- and 4th-gen.cephalosporins
Fluoroquinolones
mg/PCUIceland
2010 2011 2012 2013 2014 2015
2010 2011 2012 2013 2014 2015

Sales of veterinary antimicrobial agents in 30 European countries in 2015Seventh ESVAC report 99
Ireland
Figure 87. Sales (mg/PCU) by antimicrobial class in Ireland, from 2010 to 20151
1 For reasons of commercial confidentiality, polymyxins and pleuromutilins are aggregated with ‘others’. * Other antibacterials (classified as such in the ATCvet system).
Total sales of veterinary antimicrobial agents for food-producing species (mg/PCU) in Ireland have fluctuated marginally from year to year. Between 2014 and 2015, a minor change from 47.6 mg/PCU to 51.0 mg/PCU was recorded, compared to a low of 46.5 mg/PCU in 2011 and a high of 55.9 mg/PCU in 2013. An increase of 8.5 % in tonnes of active ingredients sold was observed between 2014 and 2015.
Sales of tetracyclines, penicillins and sulphonamides (in mg/PCU) were the largest contributors to the increases observed, accounting for approximately 43 %, 20 % and 20 %, respectively, of all sales in 2015.
Tetracyclines
Amphenicols
Penicillins
1st- and 2nd-gen.cephalosporins
3rd- and 4th-gen.cephalosporins
Sulfonamides
Trimethoprim
Macrolides
Lincosamides
Fluoroquinolones
Other quinolones
Aminoglycosides
Others*
0 5 10 15 20 25
mg/PCUIreland0.0 0.1 0.2 0.3 0.4 0.5 0.6 0.7
3rd- and 4th-gen.cephalosporins
Fluoroquinolones
mg/PCUIreland
2010 2011 2012 2013 2014 2015
2010 2011 2012 2013 2014 2015
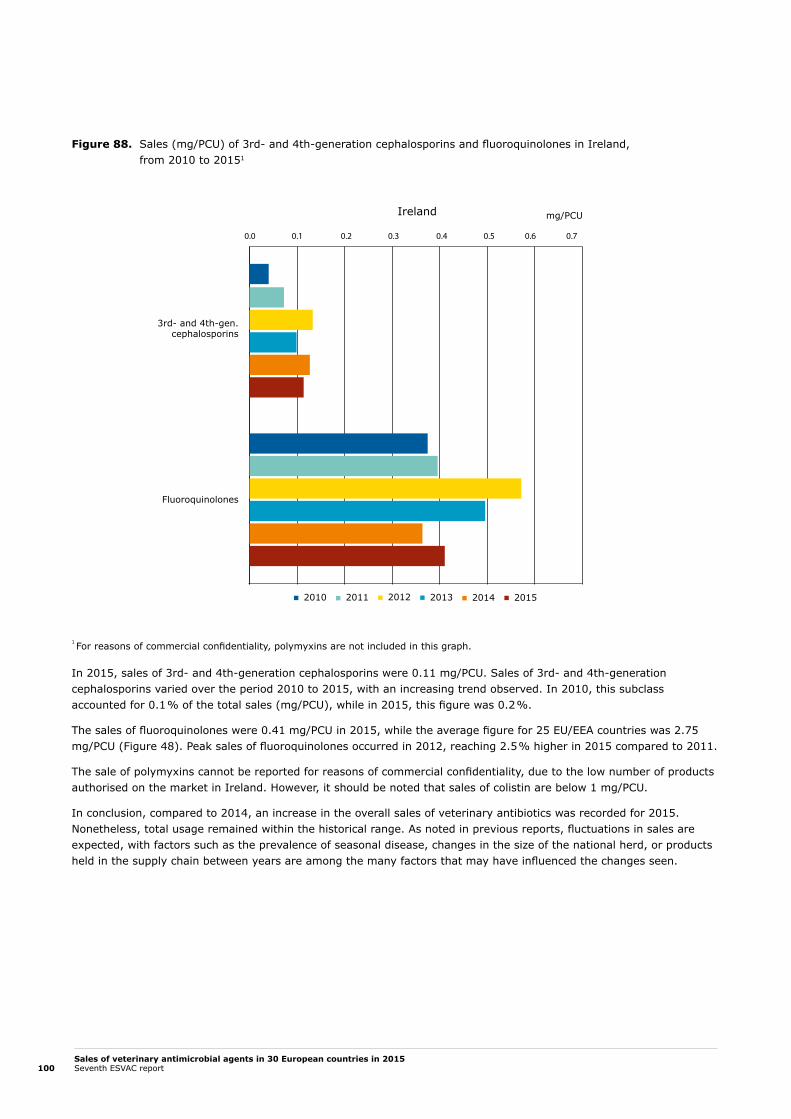
Sales of veterinary antimicrobial agents in 30 European countries in 2015Seventh ESVAC report100
Figure 88. Sales (mg/PCU) of 3rd- and 4th-generation cephalosporins and fluoroquinolones in Ireland, from 2010 to 20151
1 For reasons of commercial confidentiality, polymyxins are not included in this graph.
In 2015, sales of 3rd- and 4th-generation cephalosporins were 0.11 mg/PCU. Sales of 3rd- and 4th-generation cephalosporins varied over the period 2010 to 2015, with an increasing trend observed. In 2010, this subclass accounted for 0.1 % of the total sales (mg/PCU), while in 2015, this figure was 0.2 %.
The sales of fluoroquinolones were 0.41 mg/PCU in 2015, while the average figure for 25 EU/EEA countries was 2.75 mg/PCU (Figure 48). Peak sales of fluoroquinolones occurred in 2012, reaching 2.5 % higher in 2015 compared to 2011.
The sale of polymyxins cannot be reported for reasons of commercial confidentiality, due to the low number of products authorised on the market in Ireland. However, it should be noted that sales of colistin are below 1 mg/PCU.
In conclusion, compared to 2014, an increase in the overall sales of veterinary antibiotics was recorded for 2015. Nonetheless, total usage remained within the historical range. As noted in previous reports, fluctuations in sales are expected, with factors such as the prevalence of seasonal disease, changes in the size of the national herd, or products held in the supply chain between years are among the many factors that may have influenced the changes seen.
Tetracyclines
Amphenicols
Penicillins
1st- and 2nd-gen.cephalosporins
3rd- and 4th-gen.cephalosporins
Sulfonamides
Trimethoprim
Macrolides
Lincosamides
Fluoroquinolones
Other quinolones
Aminoglycosides
Others*
0 5 10 15 20 25
mg/PCUIreland0.0 0.1 0.2 0.3 0.4 0.5 0.6 0.7
3rd- and 4th-gen.cephalosporins
Fluoroquinolones
mg/PCUIreland
2010 2011 2012 2013 2014 2015
2010 2011 2012 2013 2014 2015

Sales of veterinary antimicrobial agents in 30 European countries in 2015Seventh ESVAC report 101
Italy
Figure 89. Sales (mg/PCU) by antimicrobial class in Italy, from 2010 to 2015
* Other antibacterials (classified as such in the ATCvet system).
A reduction in the consumption of antimicrobials was observed in 2015, with a 24 % drop in sales (mg/PCU) during the period 2010-2015. This fall appears to be mainly correlated with a reduction in sales of tetracyclines, sulphonamides and polymyxins. The most-sold antimicrobial classes were tetracyclines and penicillins, accounting for 29 % and 27 % of total sales in 2015.
Italy initiated a process of the complete digitalisation of data collection for veterinary medicines sales and use, including data on prescription, distribution and administration. This project was launched in 2015 as an experiment in three of 20 Italian administrative-geographical areas (regions). As part of the experiment, training was provided for veterinarians, farmers and pharmacists. Trained professionals helped to disseminate the knowledge and put the digitalisation of monitoring veterinary drugs sales and use in practice nationwide. This system is based on the direct collection of sales and use data which enables improvements in data quality.
Furthermore, the development of a separate computerised and integrated monitoring system of veterinary data collection is ongoing. This system allows various aspects of the veterinary data to be collected and analysed, such as animal health and welfare, injuries and diseases at slaughterhouses, as well as various levels of veterinary medicine consumption (per animal category, active ingredient, therapy target). The system enables the identification of those farms which may be exposed to the risk of developing and spreading resistant bacteria. Consequently, farms can be classified according to the level of risk. Such an approach represents a starting point for producing a manual with instructions on how to improve antimicrobial use and thus how to improve animal health, taking into consideration as many particularities and needs as possible.
Tetracyclines
Amphenicols
Penicillins
1st- and 2nd-gen.cephalosporins
3rd- and 4th-gen.cephalosporins
Sulfonamides
Trimethoprim
Macrolides
Lincosamides
Fluoroquinolones
Other quinolones
Aminoglycosides
Polymyxins
Pleuromutilins
Others*
0 20 40 60 80 100 120 140 160
mg/PCUItaly0 10 20 30 40 50
3rd- and 4th-gen.cephalosporins
Fluoroquinolones
Polymyxins
mg/PCUItaly
2010 2011 2012 2013 2014 2015
2010 2011 2012 2013 2014 2015

Sales of veterinary antimicrobial agents in 30 European countries in 2015Seventh ESVAC report102
In 2016, guidelines for the management of livestock in order to reduce the quantity of antibiotics prescriptions and prevent the risk of resistance via biosecurity, hygiene and animal welfare indicators were drafted in 2015 and submitted to the Committee for Veterinary Medicinal Products Surveillance.
Figure 90. Sales (mg/PCU) of 3rd- and 4th-generation cephalosporins, fluoroquinolones and polymyxins in Italy, from 2010 to 2015
Sales of 3rd- and 4th-generation cephalosporins were relatively stable during the period 2010 to 2015, accounting for approximately 0.1 % of total sales each year. In 2015, the sales of 3rd- and 4th-generation cephalosporins were 0.40 mg/PCU, while the average figure for 25 countries was 0.24 mg/PCU in the same year (Figure 48).
In 2015, sales of fluoroquinolones were 2.90 mg/PCU which is close to the average sales for the 25 countries in that year (2.75 mg/PCU). This sub-class accounted for 0.4 % of total sales in 2010, while in 2015, the corresponding figure was 0.9 %.
Sales of polymyxins fell by 35 % in 2015 compared to sales in 2010. In 2015, sales of polymyxins in Italy were 26.13 mg/PCU, while average sales for the 25 countries were 9.54 mg/PCU in the same year (Figure 48). This sub-class represented 8 % of total sales in 2015.
Tetracyclines
Amphenicols
Penicillins
1st- and 2nd-gen.cephalosporins
3rd- and 4th-gen.cephalosporins
Sulfonamides
Trimethoprim
Macrolides
Lincosamides
Fluoroquinolones
Other quinolones
Aminoglycosides
Polymyxins
Pleuromutilins
Others*
0 20 40 60 80 100 120 140 160
mg/PCUItaly0 10 20 30 40 50
3rd- and 4th-gen.cephalosporins
Fluoroquinolones
Polymyxins
mg/PCUItaly
2010 2011 2012 2013 2014 2015
2010 2011 2012 2013 2014 2015

Sales of veterinary antimicrobial agents in 30 European countries in 2015Seventh ESVAC report 103
Latvia
Figure 91. Sales (mg/PCU) by antimicrobial class in Latvia, from 2010 to 2015
* Other antibacterials (classified as such in the ATCvet system).
Annual sales (mg/PCU) of antimicrobial VMPs were stable during the period 2010 to 2015. Overall sales declined by 5 % from 2010 to 2015, while the proportion accounted for by most of the various antimicrobial classes fluctuated.
Tetracyclines and penicillins are the most-sold classes for all the study years. A peak in sales of tetracyclines was observed for 2012; overall, a drop of 16 % in sales of this class was observed from 2010 to 2015. Sales of penicillin VMPs were relatively stable in Latvia, except for 2010 and 2013 when peaks were observed. The most-sold VMPs in this antimicrobial class were oral powder presentations with amoxicillin.
Sales of macrolides increased from 0.95 mg/PCU to 3.83 mg/PCU from 2010 to 2015, which is double the sales of this class during the period.
To improve the situation regarding the consumption of veterinary antimicrobial agents in Latvia, a number of activities have been carried out to inform farmers, animal owners and food manufacturers, and to give additional information to veterinarians about the prudent use of antimicrobial agents in animals. For example, in 2015, at the Riga FOOD 2015 exhibition, the Institute of Food Safety, Animal Health and Environment BIOR presented project ‘Resistance of microorganisms and preparing a procedure for research of other biological and chemical risks and using it in the food chain’.
Tetracyclines
Amphenicols
Penicillins
1st- and 2nd-gen.cephalosporins
3rd- and 4th-gen.cephalosporins
Sulfonamides
Trimethoprim
Macrolides
Lincosamides
Fluoroquinolones
Other quinolones
Aminoglycosides
Polymyxins
Pleuromutilins
Others*
0 5 10 15 20
mg/PCULatvia0 1 2 3 4 5
3rd- and 4th-gen.cephalosporins
Fluoroquinolones
Polymyxins
mg/PCULatvia
2010 2011 2012 2013 2014 2015
2010 2011 2012 2013 2014 2015

Sales of veterinary antimicrobial agents in 30 European countries in 2015Seventh ESVAC report104
Figure 92. Sales (mg/PCU) of 3rd- and 4th-generation cephalosporins, fluoroquinolones and polymyxins in Latvia, from 2010 to 2015
The sales of 3rd- and 4th-generation cephalosporins rose from 0.22 mg/PCU in 2010 to 0.36 mg/PCU in 2015; the average figure for 25 countries was 0.24 mg/PCU in 2015 (Figure 48).
In Latvia, sales of fluoroquinolones fluctuated during 2010 to 2015; however, a decline from 4.12 mg/PCU to 1.10 mg/ PCU is evident during this period. In comparison, average sales in 25 countries were 2.75 mg/PCU in 2015 (Figure 48).
Sales of polymyxins fluctuated during the period 2010 to 2015. A peak in these sales was observed for 2012; overall, a decrease of 4 % in sales of this class was observed from 2010 to 2015. In 2015, sales of polymyxins were 0.94 mg/ PCU, while average sales in 25 countries were 9.54 mg/PCU in 2015 (Figure 48).
Tetracyclines
Amphenicols
Penicillins
1st- and 2nd-gen.cephalosporins
3rd- and 4th-gen.cephalosporins
Sulfonamides
Trimethoprim
Macrolides
Lincosamides
Fluoroquinolones
Other quinolones
Aminoglycosides
Polymyxins
Pleuromutilins
Others*
0 5 10 15 20
mg/PCULatvia0 1 2 3 4 5
3rd- and 4th-gen.cephalosporins
Fluoroquinolones
Polymyxins
mg/PCULatvia
2010 2011 2012 2013 2014 2015
2010 2011 2012 2013 2014 2015

Sales of veterinary antimicrobial agents in 30 European countries in 2015Seventh ESVAC report 105
Lithuania
Figure 93. Sales (mg/PCU) by antimicrobial class in Lithuania, from 2010 to 2015
* Other antibacterials (classified as such in the ATCvet system).
From 2010 to 2015, a 27 % drop in sales (in mg/PCU) was seen in Lithuania, accounted for by almost all antimicrobial classes. The exceptions are sulfonamides and trimethoprim and fluoroquinolones for which a substantial increase was observed. Currently, there is no precise data available that can explain the observed increase in changes in the sales patterns of veterinary antimicrobial agents in Lithuania.
State food and veterinary service (SFVS) together with the Ministry of Health developed the 2017-2020 national action plan against AMR. Moreover, SFVS adopted its own 2015-2020 action plan against AMR in the veterinary and agriculture sectors. Spearheading the AMR action plan was prudent use of antibiotics in animals, restricting off-label use, reducing overall antibiotics sales in animals, and organising training for veterinarians, farmers, animal owners and feed manufacturers on the prudent use of antimicrobial agents in animals.
The decline during 2010 to 2015 is mainly accounted for by a reduction in the reported sales of tetracyclines and penicillins. In 2010, sales of penicillins accounted for 34 % of the total sales of antimicrobial VMPs while this figure was 29 % in 2015. The corresponding figures for tetracyclines were 20 % and 13 %.
Tetracyclines
Amphenicols
Penicillins
1st- and 2nd-gen.cephalosporins
3rd- and 4th-gen.cephalosporins
Sulfonamides
Trimethoprim
Macrolides
Lincosamides
Fluoroquinolones
Other quinolones
Aminoglycosides
Polymyxins
Pleuromutilins
Others*
0 5 10 15 20
mg/PCULithuania0 1 2 3 4 5
3rd- and 4th-gen.cephalosporins
Fluoroquinolones
Polymyxins
mg/PCULithuania
2010 2011 2012 2013 2014 2015
2010 2011 2012 2013 2014 2015

Sales of veterinary antimicrobial agents in 30 European countries in 2015Seventh ESVAC report106
Figure 94. Sales (mg/PCU) of 3rd- and 4th-generation cephalosporins, fluoroquinolones and polymyxins in Lithuania, from 2010 to 2015
Sales (mg/PCU) of 3rd- and 4th-generation cephalosporins increased from 0.02 mg/PCU to 0.05 mg/PCU from 2010 to 2015. In 2015, the average sales of 3rd- and 4th-generation cephalosporins VMPs were 0.24 mg/PCU across 25 countries (Figure 48.). In 2010, sales of this subclass accounted for 0.05 % of total sales, while in 2015, this figure was 0.15 %.
Sales of fluoroquinolones rose during the study period, in particular in 2014. In 2015, sales of fluoroquinolones in Lithuania were 1.7 mg/PCU, while the average sales in 25 countries were 2.75 mg/PCU in 2015 (Figure 48).
The sales of polymyxins accounted for 3.6 % and 1.7 % of total sales in 2010 and 2015, respectively. In 2015, sales of polymyxins were 0.61 mg/PCU, while the average sales for 25 countries were 9.54 mg/PCU (Figure 48).
Tetracyclines
Amphenicols
Penicillins
1st- and 2nd-gen.cephalosporins
3rd- and 4th-gen.cephalosporins
Sulfonamides
Trimethoprim
Macrolides
Lincosamides
Fluoroquinolones
Other quinolones
Aminoglycosides
Polymyxins
Pleuromutilins
Others*
0 5 10 15 20
mg/PCULithuania0 1 2 3 4 5
3rd- and 4th-gen.cephalosporins
Fluoroquinolones
Polymyxins
mg/PCULithuania
2010 2011 2012 2013 2014 2015
2010 2011 2012 2013 2014 2015

Sales of veterinary antimicrobial agents in 30 European countries in 2015Seventh ESVAC report 107
Luxembourg
Figure 95. Sales (mg/PCU) by antimicrobial class in Luxembourg, from 2012 to 2015
* Other antibacterials (classified as such in the ATCvet system).
From 2014 to 2015, a 15 % fall in reported sales (mg/PCU) of antimicrobial VMPs was observed in Luxembourg. The proportion for the most-sold classes — tetracyclines, penicillins and sulfonamides — accounted for 36 %, 20 % and 15 %, respectively, of total sales in 2015.
Tetracyclines are the most-sold class for all the study years. A peak in sales of tetracyclines was observed in 2013, while a gradual drop was observed in 2014 and 2015, with an overall a drop of 25 % in sales of this class from 2012 to 2015. The reasons for lower sales are not known and the coming years will indicate whether the trend is sustainable.
Compared to 2012, the overall sales of antimicrobial VMPs (in mg/PCU) declined by 20 % in 2015. The fall during 2012 to 2015 is mainly accounted for by a reduction in the reported sales of tetracyclines, penicillins and sulfonamides. However, the data must be interpreted with caution as Luxembourg is a small country with a small animal population where sales may fluctuate due to external reasons.
Tetracyclines
Amphenicols
Penicillins
1st- and 2nd-gen.cephalosporins
3rd- and 4th-gen.cephalosporins
Sulfonamides
Trimethoprim
Macrolides
Lincosamides
Fluoroquinolones
Other quinolones
Aminoglycosides
Polymyxins
Pleuromutilins
Others*
mg/PCULuxembourg
3rd- and 4th-gen.cephalosporins
Fluoroquinolones
Polymyxins
mg/PCULuxembourg
2012 2013 2014 20152012 2013 2014 2015
0 5 10 15 20 250.0 0.5 1.0 1.5 2.0 2.5 3.0 3.5

Sales of veterinary antimicrobial agents in 30 European countries in 2015Seventh ESVAC report108
Figure 96. Sales (mg/PCU) of 3rd- and 4th-generation cephalosporins and fluoroquinolones in Luxembourg, from 2012 to 2015
Sales (mg/PCU) of 3rd- and 4th-generation cephalosporins were stable over the period 2012 to 2015. In 2012, this subclass accounted for 1.6 % of total sales, while in 2015, this figure was 1.8 %. In 2015, the sales of 3rd- and 4th-generation cephalosporins VMPs were 0.62 mg/PCU, while average sales for 25 countries in that year were 0.24 mg/ PCU (Figure 48).
Sales of fluoroquinolones fluctuated during the study years. A slight drop was observed in 2015 when sales of this class were 0.74 mg/PCU and accounted for 2.1 % of total sales.
A peak in sales of polymyxins was observed in 2013, at 3.1 mg/PCU. A gradual decline was observed from 2013 to 2015, when sales of polymyxins in 2015 fell to 1.5 mg/PCU.
Tetracyclines
Amphenicols
Penicillins
1st- and 2nd-gen.cephalosporins
3rd- and 4th-gen.cephalosporins
Sulfonamides
Trimethoprim
Macrolides
Lincosamides
Fluoroquinolones
Other quinolones
Aminoglycosides
Polymyxins
Pleuromutilins
Others*
mg/PCULuxembourg
3rd- and 4th-gen.cephalosporins
Fluoroquinolones
Polymyxins
mg/PCULuxembourg
2012 2013 2014 20152012 2013 2014 2015
0 5 10 15 20 250.0 0.5 1.0 1.5 2.0 2.5 3.0 3.5

Sales of veterinary antimicrobial agents in 30 European countries in 2015Seventh ESVAC report 109
Netherlands
Figure 97. Sales (mg/PCU) by antimicrobial class for food-producing species, in the Netherlands, from 2010 to 2015
* Other antibacterials (classified as such in the ATCvet system).
A 43 % drop in sales (in mg/PCU) of veterinary antimicrobial agents was observed from 2011 to 2015; compared to 2010, sales declined by 61 % in 2015. This is the result of efforts by the major production sectors and veterinarians which agreed with the government to set reduction targets in 2010 for the use of antimicrobial agents in food-producing animals.
From 2009 to 2015, sales of veterinary antimicrobials (active substances) were reduced by 58.4 %; the Dutch government is maintaining the reduction target of 70 % which was set in 2012.
As from 2013, antimicrobial susceptibility testing is mandatory for veterinarians before using 3rd- and 4th-generation cephalosporins and fluoroquinolones. Since 2015, this obligation is also monitored for a follow-up in companion animals.
Relatively speaking, the reduction in sales of 3rd- and 4th-generation cephalosporins (-98 %), fluoroquinolones (-75 %) and colistin (-69 %) are the biggest, while a major decline in sales is accounted for by tetracyclines, where a 50 % reduction in the sales (mg/PCU) is seen during the period 2011 to 2015. In 2015, with reference to 2014, an increase was noted for tetracyclines, which was both unexpected and unexplained.
The sales (mg/PCU) of 3rd- and 4th-generation cephalosporins fell by 98 % from 2011 to 2015; in 2011, this subclass accounted for 0.16 % of total sales, while for 2015, the figure was 0.005 %. This result was achieved thanks to efforts within private quality-production systems. Private quality systems in the pig sector banned the use of 3rd- and 4th-generation cephalosporins, while in the dairy sector the systems banned the use of 3rd- and 4th-generation cephalosporins for drying off cows. In 2015, the sales of 3rd- and 4th-generation cephalosporins VMPs were 0.003 mg/ PCU, while the average sales for 25 countries in 2015 were 0.24 mg/PCU (Figure 48).
Tetracyclines
Amphenicols
Penicillins
1st- and 2nd-gen.cephalosporins
3rd- and 4th-gen.cephalosporins
Sulfonamides
Trimethoprim
Macrolides
Lincosamides
Fluoroquinolones
Other quinolones
Aminoglycosides
Polymyxins
Pleuromutilins
Others*
0 10 20 30 40 50 60 70 80
mg/PCUNetherlands0.0 0.5 1.0 1.5 2.0 2.5
3rd- and 4th-gen.cephalosporins
Fluoroquinolones
Polymyxins
mg/PCUNetherlands
2010 2011 2012 2013 2014 2015
2010 2011 2012 2013 2014 2015

Sales of veterinary antimicrobial agents in 30 European countries in 2015Seventh ESVAC report110
Figure 98. Sales (mg/PCU) of 3rd- and 4th-generation cephalosporins, fluoroquinolones and polymyxins in the Netherlands, from 2010 to 2015
Sales (mg/PCU) of fluoroquinolones fell by 75 % from 2011 to 2015; in 2011, this subclass accounted for 0.4 % of the total sales, while in 2015 this figure was 0.17 %. In 2015, sales of fluoroquinolones were 0.11 mg/PCU, while the ave-rage sales for 25 countries in that year were 2.75 mg/PCU (Figure 48).
Sales (mg/PCU) of polymyxins (>99 % colistin) decreased by 79 % from 2010 to 2015; in 2010, this subclass accounted for 1.4 % of the total sales, while in 2015, this figure was nearly halved, at 0.75 %. In 2015, sales of polymyxins were 0.48 mg/PCU, while the average sales for 25 countries in that year were 9.54 mg/PCU (Figure 48).
The sales (mg/PCU) of aminoglycosides also fell by 78 % from 2010 to 2015, while the use of quinolones and macro-lides/lincosamides in 2015 was very comparable to that in 2010. In the Netherlands, antibiotic policy focused on the use of 3rd- and 4th-generation cephalosporins, fluoroquinolones, polymyxins and aminoglycosides, while the use of macro-lides was only restricted in poultry. Amphenicols is a preferred class, with sales increasing by 85 % between 2010 and 2015. The use of 1st- and 2nd-generation cephalosporins appears to have more than tripled, although this is due to un-der-reporting of some companion animal products until 2013. For cattle veterinarians, a guideline for dry cow treatment was introduced in 2014, which resulted in a shift of antimicrobials applied and an overall reduction in dry cow treatment.
Since 2011, antibiotic use by livestock farms in the Netherlands has been monitored by benchmark indicators. In addition to this, in 2013, the Netherlands Veterinary Medicines Authority developed a framework for monitoring antibiotic prescrip-tion patterns of veterinarians and defined associated benchmark values. This benchmark method for veterinarians was introduced in 2014. Since 2015, veterinarians working in every livestock sector monitored had access to their Veterinary Benchmark Indicator (VBI). Veterinarians with a high VBI have to take action to change their prescription patterns.
Tetracyclines
Amphenicols
Penicillins
1st- and 2nd-gen.cephalosporins
3rd- and 4th-gen.cephalosporins
Sulfonamides
Trimethoprim
Macrolides
Lincosamides
Fluoroquinolones
Other quinolones
Aminoglycosides
Polymyxins
Pleuromutilins
Others*
0 10 20 30 40 50 60 70 80
mg/PCUNetherlands0.0 0.5 1.0 1.5 2.0 2.5
3rd- and 4th-gen.cephalosporins
Fluoroquinolones
Polymyxins
mg/PCUNetherlands
2010 2011 2012 2013 2014 2015
2010 2011 2012 2013 2014 2015
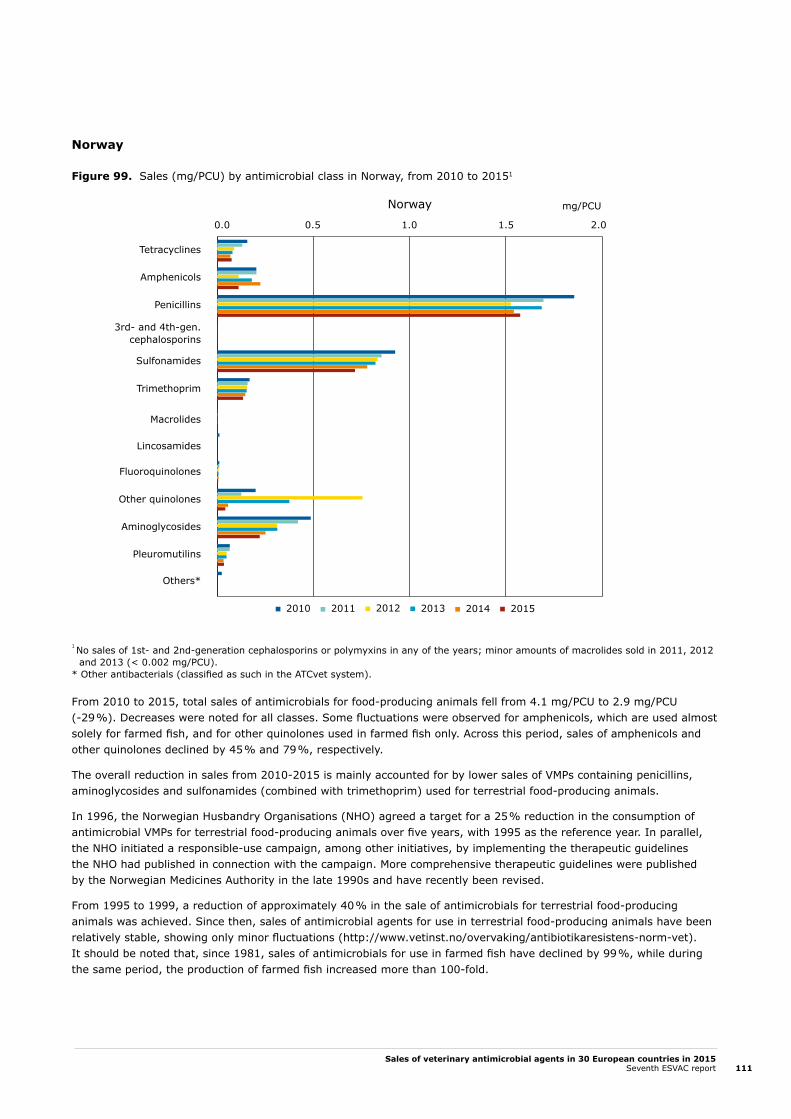
Sales of veterinary antimicrobial agents in 30 European countries in 2015Seventh ESVAC report 111
Norway
Figure 99. Sales (mg/PCU) by antimicrobial class in Norway, from 2010 to 20151
1 No sales of 1st- and 2nd-generation cephalosporins or polymyxins in any of the years; minor amounts of macrolides sold in 2011, 2012 and 2013 (< 0.002 mg/PCU).
* Other antibacterials (classified as such in the ATCvet system).
From 2010 to 2015, total sales of antimicrobials for food-producing animals fell from 4.1 mg/PCU to 2.9 mg/PCU (-29 %). Decreases were noted for all classes. Some fluctuations were observed for amphenicols, which are used almost solely for farmed fish, and for other quinolones used in farmed fish only. Across this period, sales of amphenicols and other quinolones declined by 45 % and 79 %, respectively.
The overall reduction in sales from 2010-2015 is mainly accounted for by lower sales of VMPs containing penicillins, aminoglycosides and sulfonamides (combined with trimethoprim) used for terrestrial food-producing animals.
In 1996, the Norwegian Husbandry Organisations (NHO) agreed a target for a 25 % reduction in the consumption of antimicrobial VMPs for terrestrial food-producing animals over five years, with 1995 as the reference year. In parallel, the NHO initiated a responsible-use campaign, among other initiatives, by implementing the therapeutic guidelines the NHO had published in connection with the campaign. More comprehensive therapeutic guidelines were published by the Norwegian Medicines Authority in the late 1990s and have recently been revised.
From 1995 to 1999, a reduction of approximately 40 % in the sale of antimicrobials for terrestrial food-producing animals was achieved. Since then, sales of antimicrobial agents for use in terrestrial food-producing animals have been relatively stable, showing only minor fluctuations (http://www.vetinst.no/overvaking/antibiotikaresistens-norm-vet). It should be noted that, since 1981, sales of antimicrobials for use in farmed fish have declined by 99 %, while during the same period, the production of farmed fish increased more than 100-fold.
Tetracyclines
Amphenicols
Penicillins
3rd- and 4th-gen.cephalosporins
Sulfonamides
Trimethoprim
Macrolides
Lincosamides
Fluoroquinolones
Other quinolones
Aminoglycosides
Pleuromutilins
Others*
mg/PCUNorway
3rd- and 4th-gen.cephalosporins
Fluoroquinolones
mg/PCUNorway
2010 2011 2012 2013 2014 2015 2010 2011 2012 2013 2014 2015
0.0 0.5 1.0 1.5 2.0 0.000 0.002 0.004 0.006 0.008 0.010 0.012 0.014

Sales of veterinary antimicrobial agents in 30 European countries in 2015Seventh ESVAC report112
The National Strategy against Antibiotic Resistance (2015–2020) sets a target to reduce the usage of antimicrobials for terrestrial food-producing animals by 10 % by 2020, with 2013 as the reference year. In the period 2013-2016, sales for this animal category were reduced by 4 % when measured in kg, while the reduction was 2 % when measured in mg/PCU (NORM/NORM-VET 2016).
Figure 100. Sales (mg/PCU) of 3rd- and 4th-generation cephalosporins and fluoroquinolones in Norway, from 2010 to 20151
1 No sales of polymyxins in any of the years.
In 2015, the sales of 3rd- and 4th-generation cephalosporins and fluoroquinolones were 0.003 and 0.01 mg/PCU, respectively. The average sales for 25 countries in 2015 were 0.24 mg/PCU and 2.75 mg/PCU, respectively (Figure 48). Since 2010, sales of 3rd- and 4th-generation cephalosporins and fluoroquinolones have decreased by 55 % and 51 %, respectively.
It should be noted that intramammary preparations containing 3rd- and 4th-generation cephalosporins are not marketed in Norway.
Tetracyclines
Amphenicols
Penicillins
3rd- and 4th-gen.cephalosporins
Sulfonamides
Trimethoprim
Macrolides
Lincosamides
Fluoroquinolones
Other quinolones
Aminoglycosides
Pleuromutilins
Others*
mg/PCUNorway
3rd- and 4th-gen.cephalosporins
Fluoroquinolones
mg/PCUNorway
2010 2011 2012 2013 2014 2015 2010 2011 2012 2013 2014 2015
0.0 0.5 1.0 1.5 2.0 0.000 0.002 0.004 0.006 0.008 0.010 0.012 0.014

Sales of veterinary antimicrobial agents in 30 European countries in 2015Seventh ESVAC report 113
Poland
Figure 101. Sales (mg/PCU) by antimicrobial class in Poland, from 2011 to 2015
* Other antibacterials (classified as such in the ATCvet system).
There was a 9 % increase in the sales (mg/PCU) of veterinary antimicrobial agents from 2011 to 2015, mainly related to an increase in sales of penicillins, as well as macrolides.
The two most-sold classes were tetracyclines and penicillins. Sales for tetracyclines accounted for 36 % of total sales in 2011, whereas in 2015 this figure was 31 %. The corresponding figures for penicillins were 23 % and 32 %, indicating a shift in prescribing from tetracyclines to penicillins.
Currently, there is no data available that can explain the observed increase in sales or changes in the sales patterns of veterinary antimicrobial agents in Poland.
In 2015, the Ministry of Agriculture and Rural Development of the Republic of Poland developed a strategy to combat antimicrobial resistance. The implementation of the strategy involved five different parties to cover different areas of responsibility, ranging from the prudent use of veterinary medicinal products by veterinarians to conducting research on monitoring the rise of antimicrobial resistance.
To improve the system of collecting data on sales of veterinary medicines, the Ministry of Agriculture and Rural Development initiated work on amending corresponding regulations in order to specify the scope and process of gathering sales details.
mg/PCUPoland
3rd- and 4th-gen.cephalosporins
Polymyxins
mg/PCUPoland
2011 2012 2013 2014 2015 2011 2012 2013 2014 2015
Tetracyclines
Amphenicols
Penicillins
1st- and 2nd-gen. cephalosporins
3rd- and 4th-gen. cephalosporins
Sulfonamides
Trimethoprim
Macrolides
Lincosamides
Fluoroquinolones
Other quinolones
Aminoglycosides
Polymyxins
Pleuromutilins
Others*
0 10 20 30 40 50 60 70 0 2 4 6 8 10
Fluoroquinolones

Sales of veterinary antimicrobial agents in 30 European countries in 2015Seventh ESVAC report114
Figure 102. Sales (mg/PCU) of 3rd- and 4th-generation cephalosporins, fluoroquinolones and polymyxins in Poland, from 2011 to 2015
The sales (mg/PCU) of 3rd- and 4th-generation cephalosporins increased slightly from 2011 to 2015; in 2011, this subclass accounted for 0.07 % of total sales, while in 2015, this figure was 0.10 %. In 2015, the sales of 3rd- and 4th-generation cephalosporins VMPs were 0.14 mg/PCU, while the average sales for 25 countries in that year were 0.24 mg/ PCU (Figure 48).
From 2011 to 2015, an increase was observed in sales (mg/PCU) of fluoroquinolones. In 2011, the proportion of total sales for fluoroquinolones was 5.7 %, and in 2015, this figure was 6.2 %. In 2015, the sales of fluoroquinolones were 8.56 mg/PCU, while average sales for 25 countries in that year were 2.75 mg/PCU (Figure 48).
Sales (mg/PCU) of polymyxins increased by 43 % from 2011 to 2015; in 2011, this class accounted for 3.3 % of total sales; in 2015, this figure was 4.3 %. In the same year, sales of polymyxins were 5.94 mg/PCU, while the average sales for 25 countries in 2015 were 9.54 mg/PCU (Figure 48).
mg/PCUPoland
3rd- and 4th-gen.cephalosporins
Polymyxins
mg/PCUPoland
2011 2012 2013 2014 2015 2011 2012 2013 2014 2015
Tetracyclines
Amphenicols
Penicillins
1st- and 2nd-gen. cephalosporins
3rd- and 4th-gen. cephalosporins
Sulfonamides
Trimethoprim
Macrolides
Lincosamides
Fluoroquinolones
Other quinolones
Aminoglycosides
Polymyxins
Pleuromutilins
Others*
0 10 20 30 40 50 60 70 0 2 4 6 8 10
Fluoroquinolones

Sales of veterinary antimicrobial agents in 30 European countries in 2015Seventh ESVAC report 115
Portugal
Figure 103. Sales (mg/PCU) by antimicrobial class in Portugal, from 2010 to 2015
* Other antibacterials (classified as such in the ATCvet system).
In Portugal, overall sales (mg/PCU) fluctuated during the period 2011 to 2015. An overall decrease in sales (mg/PCU) of 17 % was observed for this period; sales also decreased by 24 % from 2010 to 2015. The decrease in sales from 2011 to 2015 was mainly achieved by all classes (33 % compared to the previous year).
Analysis of the national situation suggests that this general decrease could be due to implementation of the national plan (National Action Plan for the Reduction of Use of Antibiotics in Animals) in January 2014.
0 20 40 60 80
mg/PCUPortugal0 5 10 15 20
3rd- and 4th-gen.cephalosporins
Fluoroquinolones
Polymyxins
mg/PCUPortugal
2010 2011 2012 2013 2014 2015
2010 2011 2012 2013 2014 2015
Tetracyclines
Amphenicols
Penicillins
1st- and 2nd-gen.cephalosporins
3rd- and 4th-gen.cephalosporins
Sulfonamides
Trimethoprim
Macrolides
Lincosamides
Fluoroquinolones
Other quinolones
Aminoglycosides
Polymyxins
Pleuromutilins
Others*

Sales of veterinary antimicrobial agents in 30 European countries in 2015Seventh ESVAC report116
Figure 104. Sales (mg/PCU) of 3rd- and 4th-generation cephalosporins, fluoroquinolones and polymyxins in Portugal, from 2010 to 2015
Sales (in mg/PCU) of 3rd- and 4th-generation cephalosporins remained relatively stable from 2010 to 2015. In 2015, sales of 3rd- and 4th-generation cephalosporin VMPs were 0.41 mg/PCU, while the average sales for 25 countries in that year were 0.24 mg/PCU (Figure 48).
From 2010 to 2014, an increase was observed in the sales (mg/PCU) of fluoroquinolones, peaking in 2014. In 2010, the proportion of total sales of fluoroquinolones was 3.1 %, rising to 5.6 % in 2014. This was mainly attributed to the availability of several wide spectrum generic VMPs, particularly those containing enrofloxacin. In 2014, the sales of fluoroquinolones were 11.38 mg/PCU, while the average sales for 25 countries in that year were 2.99 mg/ PCU (Figure 48). In 2015, following the general decline observed in antimicrobial sales, the sales of fluoroquinolones dropped to 7.93 mg/PCU, while the average sales for 25 countries in that year were 2.75 mg/PCU (Figure 48).
Since 2013, there has been a decrease in sales (mg/PCU) of polymyxins, namely colistin. Polymyxins, as highlighted, are becoming a last-resort antimicrobial for use in humans which means that sales of VMPs containing antimicrobial agents from this class is an issue requiring further attention. In 2015, the sales of polymyxins dropped to 12.13 mg/PCU (-31 % compared to the previous year).
A five-year National Action Plan for the Reduction of Use of Antibiotics in Animals was initiated on 1 January 2014 to promote the prudent use of antimicrobials and to raise awareness about antimicrobial resistance. Although the latest results are positive, conclusions on the plan’s performance cannot be drawn conclusively. However, sales data from 2015 will be applied to further refine the measures currently being undertaken by the various stakeholders and as an indicator for a strategy on elaborating the new National Plan which is being drafted under the ‘One Health’ approach, with national measures for human health, animal health and environmental sectors foreseen for implementation next year.
0 20 40 60 80
mg/PCUPortugal0 5 10 15 20
3rd- and 4th-gen.cephalosporins
Fluoroquinolones
Polymyxins
mg/PCUPortugal
2010 2011 2012 2013 2014 2015
2010 2011 2012 2013 2014 2015
Tetracyclines
Amphenicols
Penicillins
1st- and 2nd-gen.cephalosporins
3rd- and 4th-gen.cephalosporins
Sulfonamides
Trimethoprim
Macrolides
Lincosamides
Fluoroquinolones
Other quinolones
Aminoglycosides
Polymyxins
Pleuromutilins
Others*

Sales of veterinary antimicrobial agents in 30 European countries in 2015Seventh ESVAC report 117
Romania
Figure 105. Sales (mg/PCU) by antimicrobial class in Romania, from 2014 to 2015
* Other antibacterials (classified as such in the ATCvet system).
It should be noted that 2014 antimicrobial sales data has been updated since publication of the previous ESVAC report. Initially, sales for a considerable amount of antimicrobial VMPs were not included in the dataset submitted for 2014.
Data provided by MAHs include sales to distributors, veterinarians, farms and pharmacies.
In 2015, the most-sold classes for food-producing animals expressed in mg/PCU were tetracyclines (27 %), penicillins (18 %), macrolides (13 %) and aminoglycosides (10 %).
Tetracyclines
Amphenicols
Penicillins
1st- and 2nd-gen.cephalosporins
3rd- and 4th-gen.cephalosporins
Sulfonamides
Trimethoprim
Macrolides
Lincosamides
Fluoroquinolones
Other quinolones
Aminoglycosides
Polymyxins
Pleuromutilins
Others*
mg/PCURomania
3rd- and 4th-gen.cephalosporins
Fluoroquinolones
Polymyxins
2014 2015
mg/PCURomania0 5 10 15 20 25 30 35
0 2 4 6 8
2014 2015

Sales of veterinary antimicrobial agents in 30 European countries in 2015Seventh ESVAC report118
Figure 106. Sales (mg/PCU) of 3rd- and 4th-generation cephalosporins, fluoroquinolones and polymyxins in Romania, from 2014 to 2015
Sales of 3rd- and 4th-generation cephalosporins, fluoroquinolones and polymyxins in tonnes of active ingredient, of veterinary antimicrobial agents applicable mainly for food-producing animals accounted for 0.04 %, 6.1 % and 7.4 %, respectively, of total sales.
In 2015, the sales of 3rd- and 4th-generation cephalosporins VMPs were 0.04 mg/PCU; average sales for 25 countries in that year were 0.24 mg/PCU (Figure 48). Sales for fluoroquinolones in Romania were 6.14 mg/PCU, while the average sales for 25 countries in that year were 2.75 mg/PCU (Figure 48). Sales of polymyxin VMPs were 7.44 mg/PCU, while the average sales for 25 countries in 2015 were 9.54 mg/PCU (Figure 48).
In 2016, to reduce the consumption of antimicrobials and prevent antimicrobial resistance, the National Sanitary Veterinary and Food Safety Authority developed a strategy plan plus supporting guidelines.
Tetracyclines
Amphenicols
Penicillins
1st- and 2nd-gen.cephalosporins
3rd- and 4th-gen.cephalosporins
Sulfonamides
Trimethoprim
Macrolides
Lincosamides
Fluoroquinolones
Other quinolones
Aminoglycosides
Polymyxins
Pleuromutilins
Others*
mg/PCURomania
3rd- and 4th-gen.cephalosporins
Fluoroquinolones
Polymyxins
2014 2015
mg/PCURomania0 5 10 15 20 25 30 35
0 2 4 6 8
2014 2015

Sales of veterinary antimicrobial agents in 30 European countries in 2015Seventh ESVAC report 119
Slovakia
Figure 107. Import data by wholesalers (2011 and 2012) and sales to end-users (2013-2015) (mg/PCU) by antimicrobial class for food-producing species, in Slovakia
* Other antibacterials (classified as such in the ATCvet system).
Data for 2011 and 2012 only included data for antimicrobial VMPs imported by wholesalers, and thus sales of antimicrobial VMPs to end-users by national manufacturers were not accounted for. Since 2013, antimicrobial VMPs produced by national manufacturers have also been dispensed by wholesalers. Thus, for the years 2013 to 2015 the data include sales from wholesalers to end-users (veterinarians, pharmacies, producers of medicated feeding stuffs and farmers) — covering both import data and antimicrobial VMPs produced by national manufacturers. This difference in coverage is thought to be the main explanation for differences in sales between 2011 and 2012 and 2013 and 2015. Thus, data for the period 2012-2013 are not comparable with data for 2013-2015. For the period 2013-2015, which has the same data coverage, a 15 % reduction in sales can be seen. Slovak manufacturers of veterinary medicinal products mainly produce products with tetracyclines, pleuromutilins, macrolides and sulphonamides which are the most-selling classes. Thus, as is apparent from Figure 107, sales of these classes account for the largest difference in consumption data for the years 2013 to 2015, when compared to previous years.
mg/PCUSlovakia
3rd- and 4th-gen.cephalosporins
Polymyxins
mg/PCUSlovakia
2011 2012 2013 2014 2015 2011 2012 2013 2014 2015
Tetracyclines
Amphenicols
Penicillins
1st- and 2nd-gen. cephalosporins
3rd- and 4th-gen. cephalosporins
Sulfonamides
Trimethoprim
Macrolides
Lincosamides
Fluoroquinolones
Other quinolones
Aminoglycosides
Polymyxins
Pleuromutilins
Others*
0 5 10 15 20 25 0 1 2 3 4 5
Fluoroquinolones

Sales of veterinary antimicrobial agents in 30 European countries in 2015Seventh ESVAC report120
Figure 108. Import data by wholesalers (2011 and 2012) and sales to end-users (2013-2015) (mg/PCU) of 3rd- and 4th-generation cephalosporins, fluoroquinolones and polymyxins for food-producing species, in Slovakia
Sales (imports in 2011 and 2012), in mg/PCU, of 3rd- and 4th-generation cephalosporins declined from 2011 to 2015; in 2011, this subclass accounted for 1.5 % of total sales; in 2015, this figure was 0.6 %. In 2015, the sales of 3rd- and 4th-generation cephalosporins VMPs were 0.35 mg/PCU, while the average sales for 25 countries in that year were 0.24 mg/PCU (Figure 48).
In Slovakia, sales of fluoroquinolones decreased from 2011 to 2015; in 2011 and 2015, the proportion of the total sales for this subclass accounted for 6.8 % and 5.4 %, respectively. In 2015, sales of fluoroquinolone VMPs were 2.93 mg/PCU; the average sales for 25 countries in that year were 2.75 mg/PCU (Figure 48).
Sales (mg/PCU) of polymyxins fluctuated during the study period. In 2015, they were 1.14 mg/PCU, while the average sales for 25 countries in that year were 9.54 mg/PCU (Figure 48).
mg/PCUSlovakia
3rd- and 4th-gen.cephalosporins
Polymyxins
mg/PCUSlovakia
2011 2012 2013 2014 2015 2011 2012 2013 2014 2015
Tetracyclines
Amphenicols
Penicillins
1st- and 2nd-gen. cephalosporins
3rd- and 4th-gen. cephalosporins
Sulfonamides
Trimethoprim
Macrolides
Lincosamides
Fluoroquinolones
Other quinolones
Aminoglycosides
Polymyxins
Pleuromutilins
Others*
0 5 10 15 20 25 0 1 2 3 4 5
Fluoroquinolones
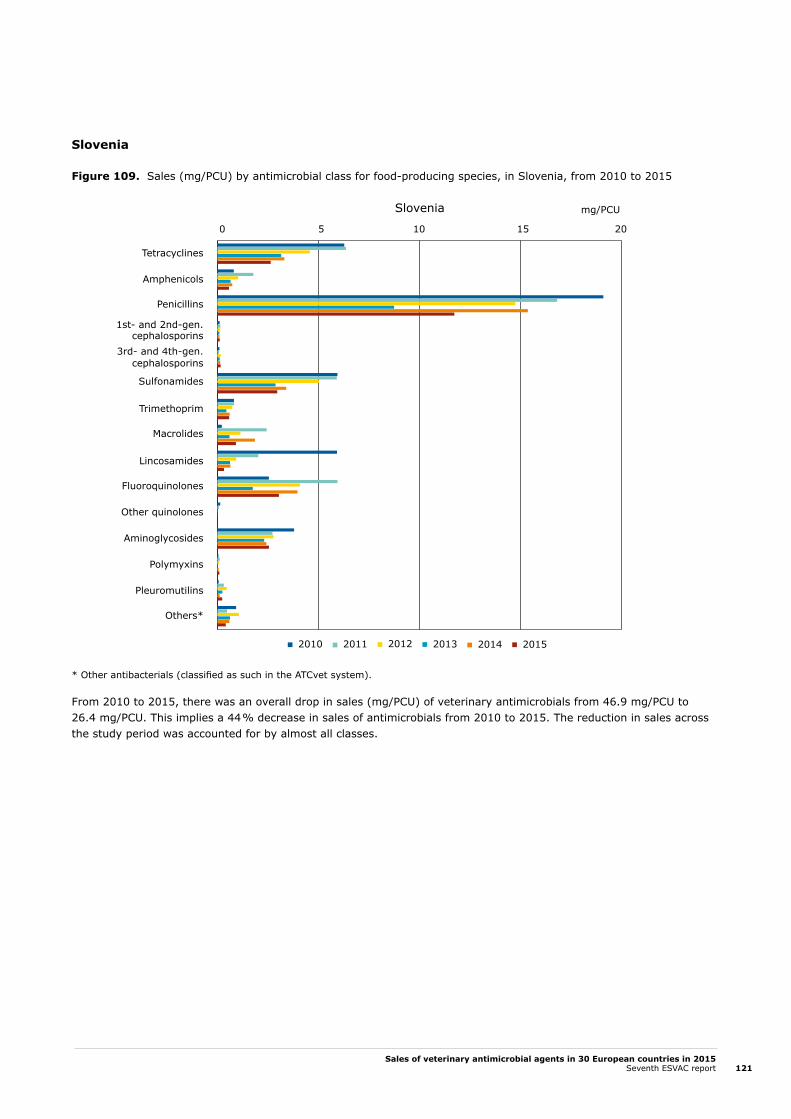
Sales of veterinary antimicrobial agents in 30 European countries in 2015Seventh ESVAC report 121
Slovenia
Figure 109. Sales (mg/PCU) by antimicrobial class for food-producing species, in Slovenia, from 2010 to 2015
* Other antibacterials (classified as such in the ATCvet system).
From 2010 to 2015, there was an overall drop in sales (mg/PCU) of veterinary antimicrobials from 46.9 mg/PCU to 26.4 mg/PCU. This implies a 44 % decrease in sales of antimicrobials from 2010 to 2015. The reduction in sales across the study period was accounted for by almost all classes.
Tetracyclines
Amphenicols
Penicillins
1st- and 2nd-gen.cephalosporins
3rd- and 4th-gen.cephalosporins
Sulfonamides
Trimethoprim
Macrolides
Lincosamides
Fluoroquinolones
Other quinolones
Aminoglycosides
Polymyxins
Pleuromutilins
Others*
0 5 10 15 20
mg/PCUSlovenia0 1 2 3 4 5 6
3rd- and 4th-gen.cephalosporins
Fluoroquinolones
Polymyxins
mg/PCUSlovenia
2010 2011 2012 2013 2014 2015
2010 2011 2012 2013 2014 2015

Sales of veterinary antimicrobial agents in 30 European countries in 2015Seventh ESVAC report122
Figure 110. Sales (mg/PCU) of 3rd- and 4th-generation cephalosporins, fluoroquinolones and polymyxins for food-producing species, in Slovenia, from 2010 to 2015
Sales (mg/PCU) of 3rd- and 4th-generation cephalosporins were relatively stable from 2010 to 2015. In 2010, this subclass accounted for 0.2 % of total sales, while for 2015, this figure was 0.6 %. In 2015, sales of 3rd- and 4th-generation cephalosporins VMPs were 0.17 mg/PCU, while the average sales for 25 countries in that year were 0.24 mg/ PCU (Figure 48).
In Slovenia, throughout the observation period, greater fluctuations were noted for sales of fluoroquinolones, ranging between 1.8 and 5.9 mg/PCU, compared to the other classes presented in Figure 110. In 2013, sales of fluoroquinolones were significantly lower, as compared to the other years. In 2010, fluoroquinolones accounted for 5.4 % of total sales; the corresponding figure for 2015 was 11.5 %. In 2015, sales of fluoroquinolone VMPs were 3 mg/PCU, while average sales for 25 countries in that year were 2.75 mg/PCU (Figure 48).
Sales (mg/PCU) of polymyxins were relatively stable from 2010 to 2015. In 2010, this subclass accounted for 0.1 % of total sales, while for 2015, this figure was 0.4 %. In 2015, sales of polymyxin VMPs were 0.1 mg/PCU, while the average sales for 25 countries in that year were 9.54 mg/PCU (Figure 48).
Tetracyclines
Amphenicols
Penicillins
1st- and 2nd-gen.cephalosporins
3rd- and 4th-gen.cephalosporins
Sulfonamides
Trimethoprim
Macrolides
Lincosamides
Fluoroquinolones
Other quinolones
Aminoglycosides
Polymyxins
Pleuromutilins
Others*
0 5 10 15 20
mg/PCUSlovenia0 1 2 3 4 5 6
3rd- and 4th-gen.cephalosporins
Fluoroquinolones
Polymyxins
mg/PCUSlovenia
2010 2011 2012 2013 2014 2015
2010 2011 2012 2013 2014 2015

Sales of veterinary antimicrobial agents in 30 European countries in 2015Seventh ESVAC report 123
Spain
Figure 111. Sales (mg/PCU) by antimicrobial class in Spain, from 2010 to 20151
1 Sales of 1st- and 2nd-generation cephalosporins were low each year (<0.05 % of total sales).* Other antibacterials (classified as such in the ATCvet system).
For the period 2010 to 2015, sales (mg/PCU) and sales patterns varied. An overall increase in sales of 55 % was observed. The major part of this increase in the sales was accounted for by tetracyclines, penicillins, sulfonamides and polymyxins. The observed change should be interpreted with great care as Spain changed its system for collecting sales data as from 2014. Among others, under-reporting was identified for the years 2010 to 2013 which means the data for these years represent underestimates. Therefore, data for 2010-2013 are not directly comparable with data for the years 2014 and 2015.
In June 2014, Spain adopted a national five-year plan to combat antimicrobial resistance. Six strategies are included in this common plan for the veterinary and human sectors, aimed at promoting appropriate use, ensuring effective surveillance systems, promoting research and innovation, and the development of a communication and education plan (http://www.aemps.gob.es/publicaciones/publica/home.htm). Different activities have been carried out focusing on prudent use of antimicrobials in animals, including a plan to voluntarily reduce the use of colistin in porcine and to organise training courses for veterinarians. Moreover, similar initiatives in other animal species are currently ongoing. Although the results of the national action plan cannot be completely assessed at the moment, data reported in 2015 showed a change in the sales (mg/PCU) trend. In general terms, there is a minor decrease of 4 % compared to the reported data in 2014.
Tetracyclines
Amphenicols
Penicillins
1st- and 2nd-gen.cephalosporins
3rd- and 4th-gen.cephalosporins
Sulfonamides
Trimethoprim
Macrolides
Lincosamides
Fluoroquinolones
Other quinolones
Aminoglycosides
Polymyxins
Pleuromutilins
Others*
0 20 40 60 80 100 120 140 160
mg/PCUSpain0 10 20 30 40
3rd- and 4th-gen.cephalosporins
Fluoroquinolones
Polymyxins
mg/PCUSpain
2010 2011 2012 2013 2014 2015
2010 2011 2012 2013 2014 2015

Sales of veterinary antimicrobial agents in 30 European countries in 2015Seventh ESVAC report124
Figure 112. Sales (mg/PCU) of 3rd- and 4th-generation cephalosporins, fluoroquinolones and polymyxins in Spain, from 2010 to 2015
Sales (mg/PCU) of 3rd- and 4th-generation cephalosporins were stable from 2011 to 2015, with considerably higher sales in 2010 accounting for 0.3 % of the total sales, but for just 0.1 % in any other years. In 2015, sales of 3rd- and 4th-generation cephalosporins VMPs were 0.31 mg/PCU, while the average sales for 25 countries in that year were 0.24 mg/PCU (Figure 48).
The sales of fluoroquinolones were relatively stable from 2010 to 2015. In 2010, the sales of fluoroquinolones accounted for 3.4 % of total sales, while in 2015, this figure was 2.2 %. In 2015, the sales of fluoroquinolones VMPs were 8.96 mg/ PCU, while the average sales for 25 countries in that year were 2.75 mg/PCU (Figure 48).
For polymyxins, sales accounted for 12.7 % and 8.7 % of total sales in 2010 and 2015, respectively. In 2015, sales of polymyxins were 34.9 mg/PCU, while average sales for 25 countries in that year were 9.54 mg/PCU (Figure 48). Activities within the plan to voluntarily reduce the use of colistin in pigs are likely to reduce the sales of colistin and to reach the recommended target of 5 mg/PCU, as advised by the AMEG (EMA/CVMP/CHMP/231573/201624).
24 Available via www.ema.europa.eu/ Veterinary regulatory/ Overview/ Antimicrobial resistance/ Use of antibiotics in animals: http://www.ema.europa.eu/docs/en_GB/document_library/Scientific_guideline/2016/07/WC500211080.pdf
Tetracyclines
Amphenicols
Penicillins
1st- and 2nd-gen.cephalosporins
3rd- and 4th-gen.cephalosporins
Sulfonamides
Trimethoprim
Macrolides
Lincosamides
Fluoroquinolones
Other quinolones
Aminoglycosides
Polymyxins
Pleuromutilins
Others*
0 20 40 60 80 100 120 140 160
mg/PCUSpain0 10 20 30 40
3rd- and 4th-gen.cephalosporins
Fluoroquinolones
Polymyxins
mg/PCUSpain
2010 2011 2012 2013 2014 2015
2010 2011 2012 2013 2014 2015

Sales of veterinary antimicrobial agents in 30 European countries in 2015Seventh ESVAC report 125
Sweden
Figure 113. Sales (mg/PCU) by antimicrobial class in Sweden, from 2010 to 20151
1 No sales of 1st- and 2nd-generation cephalosporins in any of the years; minor amounts of lincosamides sold in 2012(not shown in the graph); no sales of other quinolones in 2012 because sales for fish were not available.
From 2010 to 2015, the total sales of antimicrobials for food-producing animals fell from 15.2 mg/PCU to 11.8 mg/PCU (-22 %). Decreases were noted for most classes. Sales of polymyxins have remained relatively unchanged at 0.09 – 0.11 mg/PCU. In 2015, sales of 3rd- and 4th-generation cephalosporins and fluoroquinolones were 0.003 and 0.02 mg/PCU, respectively. Since 2010, the sales of these classes have decreased by 85 % and 81 %, respectively.
In 2011, products sold under special licence were not fully covered, leading to a slight underestimate. Furthermore, concerns have been raised about a lack of completeness in the statistics on sales of products with marketing authorisation from 2010. This problem is likely to affect products for injection but not the other pharmaceutical forms (see Swedres-Svarm 2015 for more information: www.sva.se). Since 2016, this problem seems to have been solved.
Tetracyclines
Amphenicols
Penicillins
1st- and 2nd-gen.cephalosporins
3rd- and 4th-gen.cephalosporins
Sulfonamides
Trimethoprim
Macrolides
Lincosamides
Fluoroquinolones
Other quinolones
Aminoglycosides
Polymyxins
Pleuromutilins
0 2 4 6 8 10
mg/PCUSweden0.00 0.02 0.04 0.06 0.08 0.10 0.12 0.14
3rd- and 4th-gen.cephalosporins
Fluoroquinolones
Polymyxins
mg/PCUSweden
2010 2011 2012 2013 2014 2015
2010 2011 2012 2013 2014 2015

Sales of veterinary antimicrobial agents in 30 European countries in 2015Seventh ESVAC report126
Figure 114. Sales (mg/PCU) of 3rd- and 4th-generation cephalosporins, fluoroquinolones and polymyxins in Sweden, from 2010 to 2015
The decrease in overall sales (mg/PCU) from 2010 to 2015 was 22 % and thus larger than the estimated lack of completeness, described above. During the same period, sales of products for the medication of individual animals fell by 20 % and products for group medication by 37 %.
In Sweden polymyxins (colistin) are only authorised for use in pigs with weaning diarrhoea as the sole indication. The pig population has decreased during the study period. Measured as DDDvet/biomass of pigs, there was an 11 % increase from 2010 to 2015. During 2016, recent findings of transferrable resistance to colistin were communicated to stakeholders, such as organisations working with prevention of contagious diseases and animal health. In 2016, the sales of polymyxins decreased by 26 % (measured as DDDvet) compared to 2015 (Swedres-Svarm 2016, www.sva.se).
The notable decrease in sales of 3rd- and 4th-generation cephalosporins and fluoroquinolones can probably be explained by increased adherence to the guidance for prudent use of antibiotics in the treatment of animals and by a regulation limiting veterinarians’ rights to prescribe this type of antimicrobials (SJVFS 2013:42), which came into force on 1 January 2013.
These trends reflect a long-term strategy whereby the core element is to reduce the need for antimicrobials through, for example, biosecurity, disease-control programmes, and optimised management and husbandry. When antimicrobials are needed, guidance on their prudent use is available and should be followed. Authorities, academia, professional advisors, veterinarians and farmers all collaborate with the aim of continuously improving animal health and the prudent use of antimicrobials.
Tetracyclines
Amphenicols
Penicillins
1st- and 2nd-gen.cephalosporins
3rd- and 4th-gen.cephalosporins
Sulfonamides
Trimethoprim
Macrolides
Lincosamides
Fluoroquinolones
Other quinolones
Aminoglycosides
Polymyxins
Pleuromutilins
0 2 4 6 8 10
mg/PCUSweden0.00 0.02 0.04 0.06 0.08 0.10 0.12 0.14
3rd- and 4th-gen.cephalosporins
Fluoroquinolones
Polymyxins
mg/PCUSweden
2010 2011 2012 2013 2014 2015
2010 2011 2012 2013 2014 2015

Sales of veterinary antimicrobial agents in 30 European countries in 2015Seventh ESVAC report 127
Switzerland
Figure 115. Sales (mg/PCU) by antimicrobial class in Switzerland, from 2011 to 20151,2
1 From 2011 to 2013, for reasons of confidentiality, amphenicols, other quinolones and pleuromutilins are grouped with ‘Others’ and lincosamides are grouped with macrolides.
2 Data for 2011–2013 have not been submitted to the ESVAC database but have been retrieved from Annex 9 in previous ESVAC reports.* Other antimicrobials (classified as such in the ATCvet system).
From 2011 to 2015, total sales in mg/PCU fell by 32.5 %. This is due to decreases in the top three sellers sulfonamides (-35.2 %), penicillins (-31.5 %) and tetracyclines (-33.9 %).
Total PCU showed fluctuations of 1-2 % in the period under investigation with a net result of no variation (-0.07 %) between the year 2011 and the year 2015. The observed fluctuations in the years 2013-2014 were mainly due to fewer slaughtered pigs or veal calves, together with a significant increase in the number of slaughtered broilers, a production type using comparatively low quantities of antimicrobials. This resulted in a net reduction in mg/PCU.
mg/PCUSwitzerland
3rd- and 4th-gen.cephalosporins
Polymyxins
mg/PCUSwitzerland
2011 2012 2013 2014 2015 2011 2012 2013 2014 2015
Tetracyclines
Amphenicols
Penicillins
1st- and 2nd-gen. cephalosporins
3rd- and 4th-gen. cephalosporins
Sulfonamides
Trimethoprim
Macrolides
Lincosamides
Fluoroquinolones
Other quinolones
Aminoglycosides
Polymyxins
Pleuromutilins
Others*
0 5 10 15 20 25 30 0.0 0.5 1.0 1.5 2.0
Fluoroquinolones

Sales of veterinary antimicrobial agents in 30 European countries in 2015Seventh ESVAC report128
Figure 116. Sales (mg/PCU) of 3rd- and 4th-generation cephalosporins, fluoroquinolones and polymyxins in Switzerland, from 2011 to 20151
1 Data for 2011–2013 were not submitted at package level but have been retrieved from Annex 9 in previous ESVAC reports.
The sales of 3rd- and 4th-generation cephalosporins remained stable from 0.23 mg/PCU in 2011 to 0.20 mg/PCU in 2015. However, if this amount is related to total mg/PCU, an increase from 0.3 % of the total mg/PCU in 2011 to 0.4 % in 2015 can be observed. As mentioned above, this is primarily due to a reduction in the total mg/PCU itself related to reduction in top sellers and polymyxins (see below).
The same applies to sales of fluoroquinolones, with absolute numbers of 0.45 mg/PCU in 2011 and 0.47 mg/PCU in 2015. For the same reason (decrease in total mg/PCU), the proportional sales of this class increased from 0.6 % of the total mg/PCU in 2010 to 0.9 % in 2015.
Polymyxins, exclusively as colistin, achieved the highest reduction in those antibiotics considered critical. There is a decrease in absolute numbers (1.78 mg/PCU in 2011 to 0.62 mg/PCU in 2015) as well as in the proportion of the total mg/PCU from 2.38 % in the year 2010 to 1.2 % in 2015.
Considering all three classes of critical antimicrobials, the biggest change has been achieved for polymyxins, i.e. colistin, an antimicrobial used almost exclusively to treat diarrhoea in young pigs. This reduction can be linked to the introduction of vaccines against both porcine circovirus and Lawsonia infections, thereby reducing the occurrence of diarrhoea and hence the need to treat for bacterial secondary infections.
Of note, sales of antimicrobials for veterinary use reported by Switzerland are considered to be slightly overestimated, as data also contain trade in Liechtenstein, although no animal data characterising Liechtenstein are covered in the denominator currently used for analysis. Consumption of antimicrobials for veterinary use in Lichtenstein is considered to be very low.
mg/PCUSwitzerland
3rd- and 4th-gen.cephalosporins
Polymyxins
mg/PCUSwitzerland
2011 2012 2013 2014 2015 2011 2012 2013 2014 2015
Tetracyclines
Amphenicols
Penicillins
1st- and 2nd-gen. cephalosporins
3rd- and 4th-gen. cephalosporins
Sulfonamides
Trimethoprim
Macrolides
Lincosamides
Fluoroquinolones
Other quinolones
Aminoglycosides
Polymyxins
Pleuromutilins
Others*
0 5 10 15 20 25 30 0.0 0.5 1.0 1.5 2.0
Fluoroquinolones

Sales of veterinary antimicrobial agents in 30 European countries in 2015Seventh ESVAC report 129
United Kingdom
Figure 117. Sales (mg/PCU) by antimicrobial class in the United Kingdom, from 2010 to 20151
1 No sales of other quinolones in any of the years.* Other antimicrobials (classified as such in the ATCvet system).
Overall sales of antibiotics for use in food-producing species in 2015 declined by 16 % compared to 2010 and were the second lowest figure reported over the five-year period. Sales were at their lowest level in 2011, although this is thought to be artificially low (and 2010 sales artificially high) due to altered product-purchasing behaviour in anticipation of a change in marketing authorisation holder(s) for certain tetracycline-containing products between 2010 and 2011. This led to an increase in sales prior to the change and a subsequent reduction in sales in early 2011. However, it should be noted that over the period 2012 to 2015, a 14 % decline in sales was observed.
The decrease in sales between 2012 and 2015 is accounted for by most of the antimicrobial classes although, in particular, there was a substantial decrease in sales of tetracyclines as well as penicillins.
Tetracyclines are the most-sold class, accounting for 44 % of total sales in 2012; the corresponding figure was 42 % in 2015. In parallel, the proportion of penicillins sold was stable, accounting for 18 % in both 2012 and 2015.
A programme for the surveillance of antibiotic usage continues to be developed in the UK. In 2016, a review of progress and some accompanying data were published in UK-VARSS 201525. The British Poultry Council (BPC) provided data collected from their members, representing 90 % of the commercial meat poultry industry. These data indicated that commercial meat poultry flocks had reduced their use of antibiotics by 27 % between 2014 and 2015, which included a 52 % reduction in the use of fluoroquinolones. This reduction has been driven by the BPC’s Antibiotic Stewardship Scheme, a programme established in 2011 and designed to promote the responsible use of antibiotics and reduce the use of Highest Priority Critically Important Antibiotics for human medicine.
25 https://www.gov.uk/government/publications/veterinary-antimicrobial-resistance-and-sales-surveillance-2015
Tetracyclines
Amphenicols
Penicillins
1st- and 2nd-gen.cephalosporins
3rd- and 4th-gen.cephalosporins
Sulfonamides
Trimethoprim
Macrolides
Lincosamides
Fluoroquinolones
Aminoglycosides
Polymyxins
Pleuromutilins
Others*
0 5 10 15 20 25 30 35
2010 2011 2012 2013 2014 2015
mg/PCUUnited Kingdom
0.0 0.1 0.2 0.3 0.4
3rd- and 4th-gen.cephalosporins
Fluoroquinolones
Polymyxins
2010 2011 2012 2013 2014 2015
mg/PCUUnited Kingdom

Sales of veterinary antimicrobial agents in 30 European countries in 2015Seventh ESVAC report130
Progress has also been made in collecting antibiotic usage data from UK pig farms, following the launch of an elec-tronic medicines book (eMB-Pigs) by the Animal Health and Development Board for pigs (AHDB Pork) in April 2016. This software allows farmers to record on-farm antibiotic usage data; preliminary aggregate figures for 2015 and 2016 are expected to be published in UK-VARSS 2016.
Figure 118. Sales (mg/PCU) of 3rd- and 4th-generation cephalosporins, fluoroquinolones and polymyxins in the United Kingdom, from 2011 to 2015
Sales of 3rd- and 4th-generation cephalosporins were relatively stable from 2010 to 2015, accounting for 0.3 % of total sales in 2015.
Sales of fluoroquinolones were also relatively stable during the study period, accounting for 0.6 % of the total sales in 2015.
Sales of polymyxins were low in 2015 and have remained stable, consistently below 0.15 mg/PCU for the five-year reporting period, and accounting for 0.2 % of total sales in 2015.
Tetracyclines
Amphenicols
Penicillins
1st- and 2nd-gen.cephalosporins
3rd- and 4th-gen.cephalosporins
Sulfonamides
Trimethoprim
Macrolides
Lincosamides
Fluoroquinolones
Aminoglycosides
Polymyxins
Pleuromutilins
Others*
0 5 10 15 20 25 30 35
2010 2011 2012 2013 2014 2015
mg/PCUUnited Kingdom
0.0 0.1 0.2 0.3 0.4
3rd- and 4th-gen.cephalosporins
Fluoroquinolones
Polymyxins
2010 2011 2012 2013 2014 2015
mg/PCUUnited Kingdom

Sales of veterinary antimicrobial agents in 30 European countries in 2015Seventh ESVAC report 131
3. Discussion3.1. Materials and methodsIt is important to note that the results presented in this report may differ from those presented in national reports because of differences in inclusion criteria for veterinary antimicrobial agents, for example, and in the reporting of data in the national surveillance systems, e.g. reporting of data as the base, while for the ESVAC the strength is reported as given in the summary of product characteristics/labelling of the VMP, which typically is the salt (see references to national reports in Annex 7).
The data sets provided for the ESVAC represent exclusively the sales of antimicrobial agents sold as veterinary medicinal products, since antimicrobials for growth promotion are not allowed in the ESVAC participating countries.
Dermatological preparations (ATCvet group QD) and preparations for sensory organs (ATCvet group QS) were not included in the data sets. Since, in 2011, these pharmaceutical forms represented, for example, only 0.13 % in Denmark, (E. Jacobsen, unpublished data), 0.2 % in the Czech Republic (Lucie Pokludová, unpublished data), 0.35 % in France (G. Moulin, unpublished data), 0.002 % in Norway (www.vetinst.no/eng/Publications/Norm-Norm-Vet-Report) and 0.49 % in the United Kingdom (Hannah Reeves, unpublished data) of the total tonnes sold, the annual contribution from these groups of antimicrobial agents, in tonnes of active ingredients, to the total amounts is thought to be minimal, and therefore the effect of the deviation is negligible.
Injectable antimicrobial agents are used both in food-producing and in companion animals. With the exception of some long-acting products, injection of antimicrobial agents in companion animals is generally limited to hospitalised animals or perioperative treatments. Data from Denmark and France for 2011 showed that approximately 0.1 % and 1.2 %, respectively, of the injectable antimicrobial VMPs sold were used for dogs and cats (E. Jacobsen and G. Moulin, unpublished data). Therefore, sales of injectable antimicrobials are assumed to be for use in food-producing species. For countries where the injectable 3rd- and 4th-generation cephalosporins are almost solely marketed for dogs and cats, the data provides a considerable overestimate for food-producing animals.
For 2015, nine countries (Table 2) included veterinary antimicrobial agents obtained on special licence (use on exemption from marketing authorisation, i.e. obtained from another Member State and permitted to be marketed for specific animal species, although this type of procedure might differ among MSs) in the data sets; these are all countries with a comparatively low number of antimicrobial veterinary medicinal products (VMPs) on the market (Annex 1 – Table A7) Five of these countries — Denmark, Estonia, Luxembourg, Slovenia and Sweden — reported that the proportion of sales of antimicrobial VMPs on special licence accounted for approximately 0.1 %, 0.5 %, 60 %, 12 % and 5 %, of the total sales, respectively26. The countries not reporting any sales of products allowed to be marketed according to special agreements is thought to have no or insignificant sales of such products, as they have a relatively high number of authorised antimicrobial VMPs on the market.
Depending on the source of the data, countries had requested data on sales to end-users, or had asked the national data providers to exclude sales among data sources, for example, between wholesalers, and consequently it is assumed that double reporting has been avoided.
In 2015, all countries provided sales data except for Denmark and Sweden which submitted prescription data.
As regards the material and methods, it should be noted that in all the participating countries, antimicrobial agents have a ‘prescription only’ status. According to Directive 2001/82/EC, as amended, of the European Parliament, all veterinary medicinal products, including veterinary antimicrobial agents, have to be sold through distributors authorised by the competent authority in each country. This made it possible for all the participating countries to identify all distributors of antimicrobial VMPs in their country, and consequently 100 % data-source coverage could be obtained. It is therefore reasonable to assume that the data presented in this report provide a good picture of the total sales of antimicrobial agents in the 30 countries.
26 EMA/ESVAC. 2011. European Medicines Agency, European Surveillance of Veterinary Antimicrobial Consumption (ESVAC). Sales of veterinary antimicrobial agents in 25 EU/EEA countries in 2011: http://www.ema.europa.eu/docs/en_GB/document_library/Report/2013/10/WC500152311.pdf

Sales of veterinary antimicrobial agents in 30 European countries in 2015Seventh ESVAC report132
In the current report, data presented on sales of veterinary antimicrobial agents for companion animals are based solely on the sales of tablets. For countries with a relatively low number of dogs and cats, the market for antimicrobial VMPs as tablets is typically low, and thus the proportion of human antimicrobial agents used according to the cascade could account for a higher proportion than in those countries with a high number of dogs and cats. Furthermore, injectable antimicrobial VMPs are used in both food-producing animals, including horses, and companion animals. Therefore, the data on sales of veterinary antimicrobial agents for companion animals presented in this report are likely to be underestimated, while data on sales for food-producing animals are slightly overestimated. The national sales data (nominator) cover all food-producing species, including horses, which are considered as food-producing species according to EU legislation. Thus, the animal population ‘at risk’ of being treated with antimicrobial agents (denominator) includes all food-producing species. However, the use of antimicrobial agents in the various animal species varies considerably; for example, use in sheep is relatively low, due to the generally extensive production system. Therefore, interpretation of the data should take into account distribution of the PCU value between the species in the various countries. It should also be emphasised that the PCU only represents a technical unit of measurement and not a real value for the animal population that could potentially be treated with antimicrobial agents.
Dosing of the various antimicrobial agents between and within classes, as well as between animal species, varies substantially, sometimes by several orders, as reflected by the DDDvet and DCDvet values published by EMA in 201627. For example, the dose for a whole treatment (DCDvet) with an oral fluoroquinolone VMP may be 10–40 mg/kg between cattle, pigs and poultry, while with an oral tetracycline VMP this may vary between 110 and 280 mg/kg. This implies that a given weight of active ingredient of fluoroquinolone sold can be used to treat several times as many animals with the same weight of active ingredient of a tetracycline. Furthermore, within an antimicrobial class there may be different dosages for different substances; for example, the dosage of doxycycline is about one-quarter of that of oxytetracycline. Another consideration is that the treatment dosage may differ significantly according to species; for fish, a typical tetracycline dosage for the whole treatment is 800 mg/kg, or some six times higher than that for terrestrial animals. The data in this report cover all food-producing animals together, therefore it was not possible to take into account differences in dosing when reporting the data. Since the sales patterns and animal demographics vary substantially between countries, comparison of the sales data across the countries should be done with great care.
The proportion of sales of small packages of oral powders and oral solutions sufficient for treatment of only a single or a few animals is very low compared to those applicable for group treatment, and oral solutions and oral powders are typically used for group treatment. Thus, the data presented in this report on sales of oral powder and oral sales are considered to be a reasonable estimate of sales of these forms for group treatment.
Product information requested in the ESVAC template includes the marketing authorisation number. However, not all countries provided these numbers, thus the numbers of different antimicrobial products reported by country are reported as product presentations (product name, form, strength and pack size), which overestimates the number of antimicrobial VMPs available to treat animals.
3.2. ResultsIn 25 countries reporting sales data to ESVAC for the years 2011–2015, there was an overall decrease in the sales (mg/PCU) of 13.4 %. The sales were 163 mg/PCU, 154 mg/PCU, 148 mg/PCU, 158 mg/PCU and 141 mg/PCU in 2011, 2012, 2013, 2014 and 2015, respectively (Figure 48).
The PCU was stable over these years; only 0.8 % reduction of PCU was observed for the 25 countries, while the reduction in tonnes sold was 14.5 %.
The sales (mg/PCU) of 3rd- and 4th-generation cephalosporins in the 25 countries, that provided data for the years 2011-2015, remained stable within the study period, while an increase of 8 % was observed for the fluoroquinolones. The sales (mg/PCU) of polymyxins (mostly colistin; from 2013 no sales of polymyxin B reported) in these 25 countries decreased by 13 % (Figure 48).
From 2011 to 2015, a drop of more than 5 % (range 7 % to 54 %) in the sales (mg/PCU) was observed for 15 countries (Table 8). An increase of more than 5 % was observed (range 6.5 % to 32 %) for eight countries.
27 Available on the European Medicines Agency website (www.ema.europa.eu) via Home > Veterinary regulatory >Antimicrobial resistance (http://www.ema.europa.eu/ema/index.jsp?curl=pages/regulation/general/general_content_001493.jsp&mid=WC0b01ac0580a2fcf5)

Sales of veterinary antimicrobial agents in 30 European countries in 2015Seventh ESVAC report 133
Tentative explanations provided by some of the countries (see Chapter 2.8.2) for the decline in sales include, among others, the implementation of responsible-use campaigns, changes in animal demographics, restrictions on use, increased awareness of the threat of antimicrobial resistance, and/or the setting of targets. The reduced sales of veterinary antimicrobials in some countries indicate that there is potential for a reduction in other countries, too.
However, Spain changed its system for collecting data in 2014, when it was identified that for certain MAHs, sales of some VMPs identified as high-selling (tonnes) VMPs in 2014 had not been reported for some MAHs for the previous years (2011–2013), although they were marketed during these years. Therefore, the suggestion is that the sales data for Spain for 2011 to 2013 represent substantial underestimates. The consumption of antimicrobials in Spain is one of the highest among the European countries participating in the ESVAC; sales aggregated by the 25 countries for 2011 and 2015, for example, are therefore not directly comparable.
A large difference in the sales, expressed as mg/PCU, was observed between the most- and least-selling countries. This is partially due to differences in the composition of the animal population in the various countries (e.g. more pigs than cattle). Furthermore, differences in the production system may play an important role. Amongst other factors, there is also considerable variation in terms of daily dosage and length of treatment between the various antimicrobial agents and formulations used, while other factors must also be considered. Differences in the selection of data source — i.e. prescriptions, sales data or purchase data — may have an impact, although this is considered to be low.
In 2015, prescribing patterns for the various veterinary antimicrobial classes, expressed as mg/PCU, varied substantially between the countries. Notable variations were observed between different countries in the proportion of sales accounted for by the CIAs with the highest priority for human medicine — 3rd- and 4th-generation cephalosporins, fluoroquinolones, other quinolones, polymyxins and macrolides.
Overall, in the 30 countries, the sales (mg/PCU) of 3rd- and 4th-generation cephalosporins, fluoroquinolones, other quinolones, polymyxins (only colistin) and macrolides accounted for 0.2 %, 2.1 %, 0.4 %, 6.8 % and 7.2 %, respectively, of the total sales of antimicrobial VMPs in 2015.
Variations in both the sales patterns and magnitudes of sales may be due to differences between the countries in the relative proportion of the various food-producing animal species, the availability of veterinary antimicrobial products on the market, prices, animal-production systems, and the general situation with regard to infectious diseases. However, these factors cannot fully explain the differences. Other influences, such as the focus on disease prevention by management, vaccines, or implementation of responsible-use campaigns in some countries may also have impacted sales patterns.
Another important finding was that total sales, both in tonnes and in mg/PCU, of veterinary antimicrobial agents in the 30 European countries were mainly accounted for by pharmaceutical forms that can be used for mass treatment (premixes) or group treatment (oral powder and oral solution). However, this varies significantly between the countries.
Of the total number of product presentations (i.e. product name, form, strength and pack size) of antimicrobial VMPs applicable to food-producing animals (tablets excluded) sold in 2015, 80.9 % contained only one active ingredient, 16.7 % contained two active ingredients, and 2.1 % contained three active ingredients; in addition, 0.2 % (n=21) of the product presentations contained four active ingredients. Sales of products with three active ingredients were almost solely accounted for by products for individual treatment (intramammary and intrauterine preparations), and sales of products containing four ingredients were only accounted for by intramammary preparations.
Considerable variations were observed between the sales and sales patterns, expressed in tonnes, of veterinary antimicrobial agents as tablets used assigned as sold for use in (for companion animals). This is particularly the case for the sales of tablets containing combinations of penicillins + beta-lactamase inhibitors (sales of clavulanic acid are not included in the data), which varied between 0 % and 100 % of the total sales of penicillin tablets. It must be noted that human medicinal products and injectable veterinary products can also be used in companion animals, thus the data on sales of tablets should be interpreted with great care.

Sales of veterinary antimicrobial agents in 30 European countries in 2015Seventh ESVAC report134
Annex 1. Additional tables and chartsC
oun
try
Tetracyclines
Amphenicols
Penicillins
1st- and 2nd-gen. cephalosporins
3rd- and 4th-gen. cephalosporins1
Sulfonamides
Trimethoprim
Macrolides
Lincosamides
Fluoroquinolones
Other quinolones
Aminoglycosides
Polymyxins
Pleuromutilins
Others2
Total tonnes
Aus
tria
26.5
0.4
8.2
0.05
0.2
4.1
0.7
3.9
0.3
0.5
01.
31.
50.
40.
448
.5Bel
gium
59.9
2.1
79.6
0.2
0.7
61.7
12.4
16.8
5.6
1.8
2.2
0.6
4.7
1.0
8.9
258.
1Bul
garia
22.9
1.4
5.9
0.01
0.1
3.7
0.4
5.2
0.5
2.0
0.1
1.9
1.4
0.6
0.3
46.3
Cro
atia
11.3
1.2
5.9
0.2
0.1
3.8
0.6
0.6
0.1
1.0
0.2
1.8
0.7
0.4
0.1
27.9
Cyp
rus
19.8
0.4
4.9
<0.
001
0.04
6.4
1.2
2.3
7.0
0.1
0.04
0.5
1.3
2.6
0.3
46.9
Cze
ch R
epub
lic16
.80.
312
.10.
20.
37.
80.
92.
40.
11.
20.
031.
70.
72.
70.
347
.5D
enm
ark
28.6
1.2
28.6
0.1
0.02
10.3
1.7
10.8
2.3
0.01
1.0
3.4
1.3
9.8
2.8
101.
9Es
toni
a1.
90.
043.
50.
030.
10.
10.
020.
30.
10.
20
0.4
0.2
0.9
0.2
8.1
Finl
and
2.3
0.1
5.0
0.02
0.01
2.0
0.4
0.6
0.1
0.1
00.
030
0.03
010
.6Fr
ance
187.
33.
859
.51.
11.
510
5.0
15.5
35.6
2.8
2.5
2.8
44.5
29.1
5.4
5.1
501.
5G
erm
any
232.
74.
933
7.4
0.5
3.5
71.4
8.4
53.4
10.9
9.9
015
.479
.914
.08.
685
1.1
Gre
ece
30.3
0.2
14.5
00.
18.
61.
53.
90.
52.
13.
32.
44.
30.
30.
772
.6H
unga
ry81
.42.
239
.00.
10.
39.
72.
05.
94.
67.
90.
21.
98.
010
.32.
417
6.0
Icel
and
0.05
00.
40
0.00
10.
040.
010
0<
0.00
10
0.1
00
00.
6Ir
elan
d341
.02.
018
.90.
60.
219
.21.
75.
60.
30.
80
5.6
0.6
96.4
Ital
y37
5.5
18.8
352.
40.
71.
614
7.3
18.6
117.
760
.411
.713
.218
.610
5.5
38.8
19.2
1,30
0.0
Latv
ia2.
00.
011.
90.
030.
10.
30.
10.
70.
020.
20.
002
0.6
0.2
0.7
0.1
6.8
Lith
uani
a1.
50.
13.
50.
10.
022.
70.
60.
70.
20.
60.
10.
70.
20.
90.
111
.9Lu
xem
bour
g0.
60.
10.
40.
005
0.03
0.3
0.1
0.1
0.03
0.04
0.01
0.1
0.1
0.01
0.1
1.8
Net
herlan
ds89
.64.
544
.00.
10.
0135
.56.
723
.00.
40.
43.
82.
31.
61.
00.
821
3.7
Nor
way
0.1
0.2
3.0
00.
001
1.4
0.3
0.00
20
0.01
0.1
0.4
00.
10
5.6
Pola
nd17
9.8
6.4
186.
61.
70.
644
.25.
036
.43.
635
.90.
123
.024
.930
.43.
958
2.5
Port
ugal
47.2
1.2
25.1
0.1
0.4
4.6
0.9
17.1
2.8
7.9
0.1
3.8
12.1
9.2
1.5
134.
0Ro
man
ia68
.88.
145
.40.
030.
111
.62.
234
.416
.415
.70.
526
.619
.06.
41.
925
7.1
Slo
vaki
a3.
70.
12.
00.
10.
11.
60.
21.
00.
10.
70.
010.
50.
32.
30.
713
.3Slo
veni
a0.
50.
12.
00.
020.
030.
50.
10.
20.
10.
50.
002
0.4
0.02
0.04
0.1
4.6
Spa
in1,
015.
934
.369
7.8
0.5
2.3
342.
166
.517
8.6
140.
167
.45.
911
3.8
262.
974
.325
.33,
027.
8Sw
eden
0.7
0.05
6.1
0.00
10.
002
1.6
0.3
0.3
0.01
0.02
00.
30.
10.
10
9.6
Switz
erla
nd4
8.9
0.2
9.2
0.1
0.2
14.9
0.9
2.6
0.4
03.
10.
50.
241
.2U
nite
d Ki
ngdo
m16
5.4
3.1
69.5
0.8
1.2
56.2
11.1
38.1
6.5
2.4
013
.60.
916
.49.
939
4.9
Tota
l 30
cou
ntr
ies
2,72
2.8
97
.52
,07
2.2
7.2
13
.99
78
.41
61
.05
98
.02
65
.91
74
.03
3.8
28
9.3
56
1.4
22
9.0
94
.38
,29
8.7
1 Fo
r th
e co
untr
ies
whe
re in
ject
able
3rd
- an
d 4t
h-ge
n. c
epha
losp
orin
s ar
e al
mos
t so
lely
mar
kete
d fo
r do
gs a
nd c
ats,
the
dat
a pr
ovid
es a
con
side
rabl
e ov
eres
timat
e
for
food
-pro
duci
ng a
nim
als.
2
Bac
itrac
in,
fosf
omyc
in,
fura
ltado
ne,
met
roni
dazo
le,
novo
bioc
in,
paro
mom
ycin
, rifa
xim
in a
nd s
pect
inom
ycin
(cl
assi
fied
as ‘O
ther
ant
ibac
terial
s’ in
the
ATC
vet
syst
em).
3 Po
lym
yxin
s an
d pl
euro
mut
ilins
are
agg
rega
ted
with
‘Oth
ers’
for
com
mer
cial
con
fiden
tialit
y re
ason
s.
4 Fo
r re
ason
s of
con
fiden
tialit
y, p
leur
omut
ilins
are
gro
uped
with
oth
ers
and
linco
sam
ides
are
gro
uped
with
mac
rolid
es.
Tab
le A
1.
Sale
s, in
ton
nes
of a
ctiv
e in
gred
ient
, of
vet
erin
ary
antim
icro
bial
age
nts
appl
icab
le m
ainl
y fo
r fo
od-p
rodu
cing
ani
mal
s by
ant
imic
robi
al c
lass
(p
rese
nted
acc
ordi
ng t
o th
e AT
Cve
t hi
erar
chic
al s
yste
m)
by c
ount
ry,
for
2015
(ta
blet
s no
t in
clud
ed)
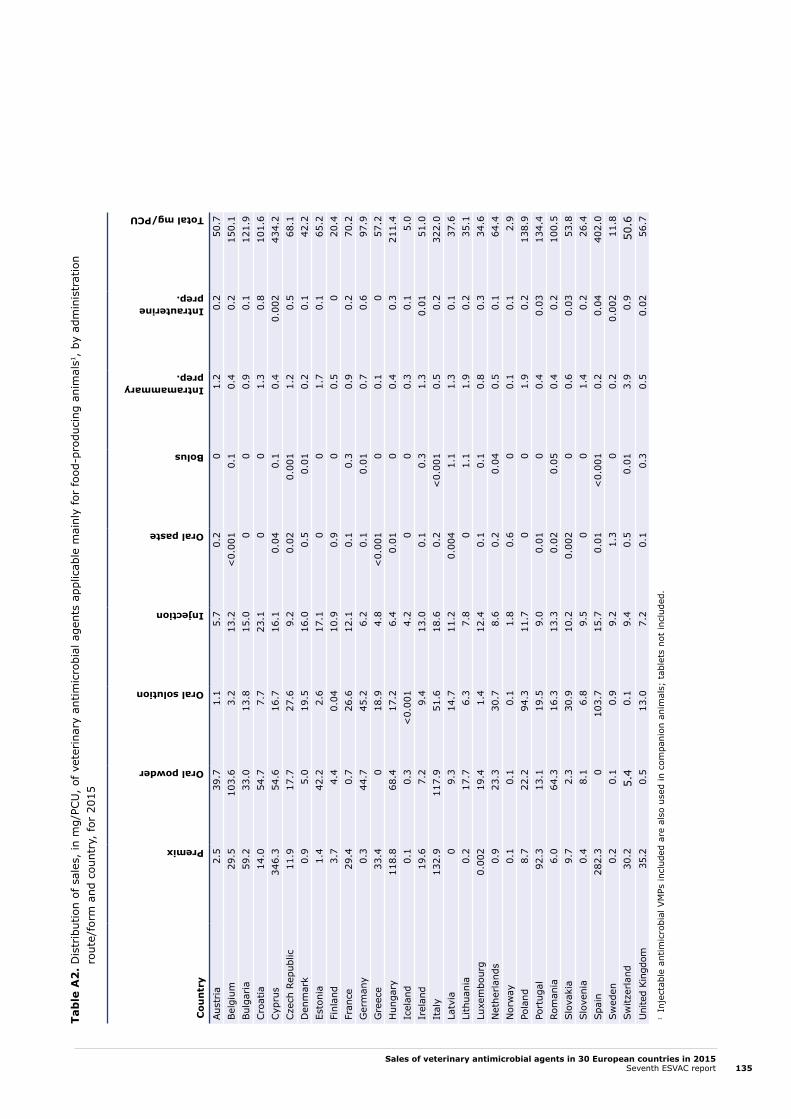
Sales of veterinary antimicrobial agents in 30 European countries in 2015Seventh ESVAC report 135
Cou
ntr
y
Tetracyclines
Amphenicols
Penicillins
1st- and 2nd-gen. cephalosporins
3rd- and 4th-gen. cephalosporins1
Sulfonamides
Trimethoprim
Macrolides
Lincosamides
Fluoroquinolones
Other quinolones
Aminoglycosides
Polymyxins
Pleuromutilins
Others2
Total tonnes
Aus
tria
26.5
0.4
8.2
0.05
0.2
4.1
0.7
3.9
0.3
0.5
01.
31.
50.
40.
448
.5Bel
gium
59.9
2.1
79.6
0.2
0.7
61.7
12.4
16.8
5.6
1.8
2.2
0.6
4.7
1.0
8.9
258.
1Bul
garia
22.9
1.4
5.9
0.01
0.1
3.7
0.4
5.2
0.5
2.0
0.1
1.9
1.4
0.6
0.3
46.3
Cro
atia
11.3
1.2
5.9
0.2
0.1
3.8
0.6
0.6
0.1
1.0
0.2
1.8
0.7
0.4
0.1
27.9
Cyp
rus
19.8
0.4
4.9
<0.
001
0.04
6.4
1.2
2.3
7.0
0.1
0.04
0.5
1.3
2.6
0.3
46.9
Cze
ch R
epub
lic16
.80.
312
.10.
20.
37.
80.
92.
40.
11.
20.
031.
70.
72.
70.
347
.5D
enm
ark
28.6
1.2
28.6
0.1
0.02
10.3
1.7
10.8
2.3
0.01
1.0
3.4
1.3
9.8
2.8
101.
9Es
toni
a1.
90.
043.
50.
030.
10.
10.
020.
30.
10.
20
0.4
0.2
0.9
0.2
8.1
Finl
and
2.3
0.1
5.0
0.02
0.01
2.0
0.4
0.6
0.1
0.1
00.
030
0.03
010
.6Fr
ance
187.
33.
859
.51.
11.
510
5.0
15.5
35.6
2.8
2.5
2.8
44.5
29.1
5.4
5.1
501.
5G
erm
any
232.
74.
933
7.4
0.5
3.5
71.4
8.4
53.4
10.9
9.9
015
.479
.914
.08.
685
1.1
Gre
ece
30.3
0.2
14.5
00.
18.
61.
53.
90.
52.
13.
32.
44.
30.
30.
772
.6H
unga
ry81
.42.
239
.00.
10.
39.
72.
05.
94.
67.
90.
21.
98.
010
.32.
417
6.0
Icel
and
0.05
00.
40
0.00
10.
040.
010
0<
0.00
10
0.1
00
00.
6Ir
elan
d341
.02.
018
.90.
60.
219
.21.
75.
60.
30.
80
5.6
0.6
96.4
Ital
y37
5.5
18.8
352.
40.
71.
614
7.3
18.6
117.
760
.411
.713
.218
.610
5.5
38.8
19.2
1,30
0.0
Latv
ia2.
00.
011.
90.
030.
10.
30.
10.
70.
020.
20.
002
0.6
0.2
0.7
0.1
6.8
Lith
uani
a1.
50.
13.
50.
10.
022.
70.
60.
70.
20.
60.
10.
70.
20.
90.
111
.9Lu
xem
bour
g0.
60.
10.
40.
005
0.03
0.3
0.1
0.1
0.03
0.04
0.01
0.1
0.1
0.01
0.1
1.8
Net
herlan
ds89
.64.
544
.00.
10.
0135
.56.
723
.00.
40.
43.
82.
31.
61.
00.
821
3.7
Nor
way
0.1
0.2
3.0
00.
001
1.4
0.3
0.00
20
0.01
0.1
0.4
00.
10
5.6
Pola
nd17
9.8
6.4
186.
61.
70.
644
.25.
036
.43.
635
.90.
123
.024
.930
.43.
958
2.5
Port
ugal
47.2
1.2
25.1
0.1
0.4
4.6
0.9
17.1
2.8
7.9
0.1
3.8
12.1
9.2
1.5
134.
0Ro
man
ia68
.88.
145
.40.
030.
111
.62.
234
.416
.415
.70.
526
.619
.06.
41.
925
7.1
Slo
vaki
a3.
70.
12.
00.
10.
11.
60.
21.
00.
10.
70.
010.
50.
32.
30.
713
.3Slo
veni
a0.
50.
12.
00.
020.
030.
50.
10.
20.
10.
50.
002
0.4
0.02
0.04
0.1
4.6
Spa
in1,
015.
934
.369
7.8
0.5
2.3
342.
166
.517
8.6
140.
167
.45.
911
3.8
262.
974
.325
.33,
027.
8Sw
eden
0.7
0.05
6.1
0.00
10.
002
1.6
0.3
0.3
0.01
0.02
00.
30.
10.
10
9.6
Switz
erla
nd4
8.9
0.2
9.2
0.1
0.2
14.9
0.9
2.6
0.4
03.
10.
50.
241
.2U
nite
d Ki
ngdo
m16
5.4
3.1
69.5
0.8
1.2
56.2
11.1
38.1
6.5
2.4
013
.60.
916
.49.
939
4.9
Tota
l 30
cou
ntr
ies
2,72
2.8
97
.52
,07
2.2
7.2
13
.99
78
.41
61
.05
98
.02
65
.91
74
.03
3.8
28
9.3
56
1.4
22
9.0
94
.38
,29
8.7
1 Fo
r th
e co
untr
ies
whe
re in
ject
able
3rd
- an
d 4t
h-ge
n. c
epha
losp
orin
s ar
e al
mos
t so
lely
mar
kete
d fo
r do
gs a
nd c
ats,
the
dat
a pr
ovid
es a
con
side
rabl
e ov
eres
timat
e
for
food
-pro
duci
ng a
nim
als.
2
Bac
itrac
in,
fosf
omyc
in,
fura
ltado
ne,
met
roni
dazo
le,
novo
bioc
in,
paro
mom
ycin
, rifa
xim
in a
nd s
pect
inom
ycin
(cl
assi
fied
as ‘O
ther
ant
ibac
terial
s’ in
the
ATC
vet
syst
em).
3 Po
lym
yxin
s an
d pl
euro
mut
ilins
are
agg
rega
ted
with
‘Oth
ers’
for
com
mer
cial
con
fiden
tialit
y re
ason
s.
4 Fo
r re
ason
s of
con
fiden
tialit
y, p
leur
omut
ilins
are
gro
uped
with
oth
ers
and
linco
sam
ides
are
gro
uped
with
mac
rolid
es.
Cou
ntr
y
Premix
Oral powder
Oral solution
Injection
Oral paste
Bolus
Intramammary prep.
Intrauterine prep.
Total mg/PCU
Aus
tria
2.5
39.7
1.1
5.7
0.2
01.
20.
250
.7Bel
gium
29.5
103.
63.
213
.2<
0.00
10.
10.
40.
215
0.1
Bul
garia
59.2
33.0
13.8
15.0
00
0.9
0.1
121.
9Cro
atia
14.0
54.7
7.7
23.1
00
1.3
0.8
101.
6Cyp
rus
346.
354
.616
.716
.10.
040.
10.
40.
002
434.
2Cze
ch R
epub
lic11
.917
.727
.69.
20.
020.
001
1.2
0.5
68.1
Den
mar
k0.
95.
019
.516
.00.
50.
010.
20.
142
.2Es
toni
a1.
442
.22.
617
.10
01.
70.
165
.2Fi
nlan
d3.
74.
40.
0410
.90.
90
0.5
020
.4Fr
ance
29.4
0.7
26.6
12.1
0.1
0.3
0.9
0.2
70.2
Ger
man
y0.
344
.745
.26.
20.
10.
010.
70.
697
.9G
reec
e33
.40
18.9
4.8
<0.
001
00.
10
57.2
Hun
gary
118.
868
.417
.26.
40.
010
0.4
0.3
211.
4Ic
elan
d0.
10.
3<
0.00
14.
20
00.
30.
15.
0Ir
elan
d19
.67.
29.
413
.00.
10.
31.
30.
0151
.0It
aly
132.
911
7.9
51.6
18.6
0.2
<0.
001
0.5
0.2
322.
0La
tvia
09.
314
.711
.20.
004
1.1
1.3
0.1
37.6
Lith
uani
a0.
217
.76.
37.
80
1.1
1.9
0.2
35.1
Luxe
mbo
urg
0.00
219
.41.
412
.40.
10.
10.
80.
334
.6N
ethe
rlan
ds0.
923
.330
.78.
60.
20.
040.
50.
164
.4N
orw
ay0.
10.
10.
11.
80.
60
0.1
0.1
2.9
Pola
nd8.
722
.294
.311
.70
01.
90.
213
8.9
Port
ugal
92.3
13.1
19.5
9.0
0.01
00.
40.
0313
4.4
Rom
ania
6.0
64.3
16.3
13.3
0.02
0.05
0.4
0.2
100.
5Slo
vaki
a9.
72.
330
.910
.20.
002
00.
60.
0353
.8Slo
veni
a0.
48.
16.
89.
50
01.
40.
226
.4Spa
in28
2.3
010
3.7
15.7
0.01
<0.
001
0.2
0.04
402.
0Sw
eden
0.2
0.1
0.9
9.2
1.3
00.
20.
002
11.8
Switz
erla
nd30
.25.
40.
19.
40.
50.
013.
90.
950
.6U
nite
d Ki
ngdo
m35
.20.
513
.07.
20.
10.
30.
50.
0256
.71
Inje
ctab
le a
ntim
icro
bial
VM
Ps in
clud
ed a
re a
lso
used
in c
ompa
nion
ani
mal
s; t
able
ts n
ot in
clud
ed.
Tab
le A
2.
Dis
trib
utio
n of
sal
es,
in m
g/PC
U,
of v
eter
inar
y an
timic
robi
al a
gent
s ap
plic
able
mai
nly
for
food
-pro
duci
ng a
nim
als1
, by
adm
inis
trat
ion
ro
ute/
form
and
cou
ntry
, fo
r 20
15

Sales of veterinary antimicrobial agents in 30 European countries in 2015Seventh ESVAC report136
Cou
ntr
y
Tetracyclines
Amphenicols
Penicillins
Sulfonamides
Trimethoprim
Macrolides
Lincosamides
Quinolones
Aminoglycosides
Polymyxins
Pleuromutilins
Others3
Total mg/PCU premixes
Aus
tria
21.7
%0%
0%0%
0%51
.9%
11.8
%0%
0%1.
4%1.
3%11
.8%
2.5
Bel
gium
13.8
%0.
2%26
.8%
42.4
%8.
5%4.
9%0.
5%0%
0.1%
1.4%
1.0%
0.5%
29.5
Bul
garia
73.6
%3.
1%0%
2.7%
0%14
.4%
0%0%
0.04
%5.
1%1.
2%0%
59.2
Cro
atia
35.6
%10
.1%
0%34
.3%
2.1%
2.2%
0.9%
0.01
%13
.1%
0%0.
7%0.
9%14
.0Cyp
rus
39.7
%0.
8%8.
9%14
.0%
2.8%
5.0%
18.4
%0%
0%3.
2%6.
9%0.
3%34
6.3
Cze
ch R
epub
lic33
.4%
1.0%
21.5
%14
.4%
2.6%
15.8
%0.
6%0%
0%1.
8%7.
9%1.
0%11
.9D
enm
ark
0%0%
2.2%
49.2
%9.
9%0%
3.1%
33.3
%0%
0%0%
2.4%
0.9
Esto
nia
0%0%
0%0%
0%93
.6%
3.2%
0%0%
0%0%
3.2%
1.4
Finl
and
60.7
%3.
8%0%
5.3%
1.1%
24.4
%4.
7%0%
0%0%
0%0%
3.7
Fran
ce47
.2%
0%4.
8%26
.1%
4.0%
5.4%
0.5%
0.2%
4.1%
6.1%
1.4%
0.2%
29.4
Ger
man
y27
.8%
0%6.
1%18
.9%
3.8%
36.5
%0%
0%0%
1.5%
5.4%
0%0.
3G
reec
e59
.6%
0.2%
19.3
%14
.9%
2.2%
1.9%
0.4%
0.1%
0.1%
0.5%
0.6%
0.1%
33.4
Hun
gary
63.4
%0.
3%9.
5%5.
2%1.
0%3.
1%2.
9%0%
0%6.
0%6.
6%2.
0%11
8.8
Icel
and
100.
0%0%
0%0%
0%0%
0%0%
0%0%
0%0%
0.1
Irel
and4
71.1
%0.
1%0.
7%16
.7%
3.3%
7.4%
0%0%
0.5%
0.1%
19.6
Ital
y39
.3%
0.6%
23.3
%11
.6%
0.8%
4.5%
4.8%
0.7%
0.6%
8.4%
4.9%
0.5%
132.
9Li
thua
nia
0%2.
3%0%
0%0%
0%0%
0%0%
0%97
.7%
0%0.
2Lu
xem
bour
g0%
0%0%
0%0%
0%50
.0%
0%0%
0%0%
50.0
%0.
002
Net
herlan
ds60
.4%
0%0%
31.4
%6.
3%1.
5%0%
0%0%
0%0.
4%0%
0.9
Nor
way
0%70
.3%
0%0%
0%0%
0%29
.7%
0%0%
0%0%
0.1
Pola
nd26
.6%
0.1%
6.9%
52.3
%0%
8.4%
0.5%
0%0%
2.7%
2.4%
0%8.
7Po
rtug
al44
.6%
0.5%
12.3
%2.
3%0.
5%16
.1%
0.2%
0%1.
8%11
.8%
9.0%
0.9%
92.3
Rom
ania
42.8
%2.
5%1.
6%6.
4%1.
3%3.
9%0.
1%7.
1%0%
1.2%
32.9
%0.
1%6.
0Slo
vaki
a82
.0%
0.3%
0.1%
0.2%
0%2.
6%2.
0%0%
0%1.
5%11
.3%
0.04
%9.
7Slo
veni
a10
.5%
21.0
%0%
6.3%
0%0%
30.7
%0.
9%0%
0%0%
30.7
%0.
4Spa
in37
.1%
0.7%
21.0
%13
.7%
2.7%
5.8%
2.7%
0.01
%2.
6%10
.0%
3.0%
0.6%
282.
3Sw
eden
0.1%
20.2
%0%
0%0%
62.3
%0%
0%0%
0%17
.4%
0%0.
2Sw
itzer
land
30.4
%0%
15.2
%40
.8%
1.8%
9.2%
0.04
%0%
0%2.
0%0.
6%0.
04%
30.2
Uni
ted
Kin
gdom
52.7
%0.
3%4.
4%21
.0%
4.2%
10.9
%0.
4%0%
0.7%
0%5.
2%0.
2%35
.21 N
eglig
ible
am
ount
of flu
oroq
uino
lone
s is
incl
uded
in t
he t
able
tog
ethe
r w
ith o
ther
qui
nolo
nes.
2 N
o sa
les
of p
rem
ixes
wer
e re
port
ed in
Lat
via.
3 Bac
itrac
in,
paro
mom
ycin
and
spe
ctin
omyc
in (
clas
sifie
d as
‘Oth
er a
ntib
acte
rial
s’ in
the
ATC
vet
syst
em).
4 Po
lym
yxin
s an
d pl
euro
mut
ilins
are
agg
rega
ted
with
‘Oth
ers’
for
com
mer
cial
con
fiden
tialit
y re
ason
s.
Tab
le A
3. Pe
rcen
tage
of sa
les,
in m
g/PC
U,
of p
rem
ixes
by
vete
rina
ry a
ntim
icro
bial
cla
ss (
acco
rdin
g to
ATC
vet
syst
em)
by c
ount
ry,
for
2015
1,2

Sales of veterinary antimicrobial agents in 30 European countries in 2015Seventh ESVAC report 137
Cou
ntr
y
Tetracyclines
Penicillins
Sulfonamides
Trimethoprim
Macrolides
Lincosamides
Other quinolones
Aminoglycosides
Polymyxins
Pleuromutilins
Others3
Total mg/PCU oral powders
Aus
tria
66.2
%13
.5%
8.1%
1.4%
5.6%
0.00
1%0%
0.4%
3.8%
0.9%
0.1%
39.7
Bel
gium
28.9
%29
.0%
20.8
%4.
2%6.
4%2.
6%1.
2%0.
02%
2.2%
0.3%
4.1%
103.
6Bul
garia
35.6
%38
.4%
5.4%
0.1%
11.0
%3.
1%1.
1%0.
7%1.
6%1.
9%1.
2%33
.0Cro
atia
61.0
%28
.7%
2.8%
1.0%
0.8%
0.1%
1.2%
0%4.
3%0%
0.2%
54.7
Cyp
rus
77.3
%13
.5%
0%0%
4.3%
0.8%
0.5%
0%1.
6%0%
2.0%
54.6
Cze
ch R
epub
lic71
.2%
2.0%
14.8
%2.
3%2.
3%0%
0%1.
5%0.
1%5.
8%0.
1%17
.7D
enm
ark
47.5
%0.
4%18
.8%
3.8%
10.5
%0%
2.6%
0.4%
0.00
1%15
.5%
0%5.
0Es
toni
a31
.0%
44.0
%0.
6%0.
1%2.
6%0.
9%0%
0%2.
2%16
.4%
2.0%
42.2
Finl
and
19.3
%11
.8%
52.4
%10
.5%
4.9%
0%0%
0%0%
1.0%
0%4.
4Fr
ance
37.0
%36
.9%
0%0%
0.1%
0%0%
0%0%
0%26
.0%
0.7
Ger
man
y26
.0%
51.5
%14
.1%
1.6%
1.2%
0.5%
0%0.
3%2.
6%2.
1%0.
04%
44.7
Hun
gary
30.9
%48
.4%
5.2%
1.2%
3.1%
2.9%
0.4%
1.5%
1.8%
4.2%
0.5%
68.4
Icel
and
0%52
.9%
30.3
%6.
1%0%
0%0%
10.6
%0%
0%0%
0.3
Irel
and
70.7
%5.
0%22
.8%
0.4%
0.05
%0.
9%0%
0%0%
0%0%
7.2
Ital
y31
.4%
42.0
%1.
4%0%
14.4
%4.
4%0.
8%0.
3%2.
4%1.
1%0.
9%11
7.9
Latv
ia23
.4%
55.7
%6.
8%1.
4%7.
6%0%
0%0%
2.6%
2.4%
0%9.
3Li
thua
nia
18.5
%32
.9%
29.3
%7.
3%0%
2.6%
0%0%
3.4%
5.4%
0.5%
17.7
Luxe
mbo
urg
54.4
%2.
7%17
.7%
3.6%
0.8%
2.2%
0.7%
0%7.
3%0.
7%9.
9%19
.4N
ethe
rlan
ds39
.9%
24.0
%12
.3%
1.8%
15.2
%0.
2%4.
6%0.
5%1.
6%0%
0%23
.3N
orw
ay36
.4%
0%52
.9%
10.6
%0%
0%0%
0%0%
0%0%
0.1
Pola
nd51
.1%
17.7
%1.
6%0.
3%4.
7%0.
8%0%
0%8.
6%15
.0%
0.2%
22.2
Port
ugal
12.5
%54
.8%
2.2%
0.6%
6.5%
19.3
%0%
0.02
%2.
4%0.
5%1.
1%13
.1Ro
man
ia33
.7%
20.4
%0.
8%0.
02%
17.3
%9.
4%0.
3%9.
2%7.
7%0.
3%0.
7%64
.2Slo
vaki
a48
.3%
0.02
%20
.1%
0.4%
0%0%
0%23
.6%
7.1%
0.4%
0%2.
3Slo
veni
a5.
0%74
.9%
10.2
%3.
1%6.
6%0%
0%0.
1%0%
0%0%
8.1
Swed
en38
.9%
0%50
.9%
10.2
%0%
0%0%
0%0%
0%0%
0.1
Switz
erla
nd0.
1%0%
90.9
%6.
8%0%
0%0%
2.2%
0%0%
0%5.
4U
nite
d Kin
gdom
79.9
%5.
9%11
.8%
2.4%
0%0%
0%0%
0%0%
0%0.
51
Neg
ligib
le a
mou
nt o
f am
phen
icol
s, fl
uoro
quin
olon
es a
nd c
epha
losp
orin
s so
ld is
not
incl
uded
in t
he t
able
. 2
No
sale
s of
ora
l pow
ders
wer
e re
port
ed in
Gre
ece
and
Spa
in.
3
Bac
itrac
in,
fosf
omyc
in,
fura
ltado
ne,
met
roni
dazo
le,
paro
mom
ycin
and
spe
ctin
omyc
in (
clas
sifie
d as
‘Oth
er a
ntib
acte
rial
s’ in
the
ATC
vet
syst
em).
Tab
le A
4. Pe
rcen
tage
s of
sal
es,
in m
g/PC
U,
of o
ral p
owde
rs b
y an
timic
robi
al c
lass
(ac
cord
ing
to A
TCve
t sy
stem
) by
cou
ntry
, fo
r 20
151,
2

Sales of veterinary antimicrobial agents in 30 European countries in 2015Seventh ESVAC report138
Cou
ntr
y
Tetracyclines
Amphenicols
Penicillins
Sulfonamides
Trimethoprim
Macrolides
Lincosamides
Fluoroquinolones
Other quinolones
Aminoglycosides
Polymyxins
Pleuromutilins
Others1
Total mg/PCU oral solutions
Aus
tria
24.8
%2.
1%0%
33.2
%6.
6%0%
2.4%
18.1
%0%
0%4.
8%3.
3%4.
8%1.
1Bel
gium
0.01
%0.
1%0.
2%43
.0%
8.6%
32.8
%0.
04%
14.4
%0%
0%0.
6%0%
0.3%
3.2
Bul
garia
0%12
.2%
0%42
.0%
7.4%
0.9%
0%36
.7%
0%0%
0.5%
0%0.
3%13
.8Cro
atia
0%3.
1%0%
33.6
%6.
7%14
.1%
0%19
.9%
1.5%
0%2.
5%18
.7%
0%7.
7Cyp
rus
9.8%
0%7.
4%55
.4%
8.8%
6.6%
0%5.
2%0.
7%1.
0%1.
8%3.
4%0%
16.7
Cze
ch R
epub
lic20
.2%
0.4%
35.3
%23
.4%
1.7%
3.3%
0.2%
5.1%
0.2%
0.04
%2.
8%7.
0%0.
4%27
.6D
enm
ark
37.2
%0.
1%15
.4%
2.5%
0%18
.7%
2.2%
0.01
%0%
0.7%
2.7%
15.5
%5.
0%19
.5Es
toni
a36
.5%
6.9%
0%0.
05%
0.01
%6.
2%0%
35.3
%0%
0%15
.1%
0%0%
2.6
Finl
and
5.0%
0%0%
48.0
%9.
6%0%
0%0.
8%0%
0%0%
36.6
%0%
0.04
Fran
ce39
.4%
0.1%
9.3%
23.9
%3.
4%8.
2%0.
5%0.
5%1.
3%2.
8%8.
2%1.
3%1.
1%26
.6G
erm
any
31.7
%0.
1%27
.1%
2.3%
0.2%
11.5
%2.
0%1.
1%0%
2.9%
17.8
%1.
4%1.
9%45
.2G
reec
e11
.4%
0.3%
19.8
%7.
8%2.
1%10
.9%
0.4%
8.4%
13.7
%7.
1%16
.8%
0.1%
1.1%
18.9
Hun
gary
2.5%
10.5
%0.
7%10
.2%
2.1%
5.6%
0%52
.1%
0%0%
6.9%
9.0%
0.3%
17.2
Icel
and
0%0%
0%0%
0%0%
0%10
0.0%
0%0%
0%0%
0%<
0.00
1Ir
elan
d21.
7%0.
2%39
.1%
45.2
%0.
3%7.
5%0.
6%1.
0%0%
2.0%
2.3%
9.4
Ital
y3.
6%2.
0%1.
2%33
.4%
6.5%
9.6%
5.5%
4.1%
2.8%
0.7%
23.5
%3.
5%3.
6%51
.6La
tvia
47.0
%0.
1%0%
1.7%
0.3%
18.2
%0.
03%
4.7%
0.1%
0.4%
4.8%
22.7
%0.
1%14
.7Li
thua
nia
0%0.
1%4.
5%17
.2%
4.3%
30.5
%0%
23.0
%3.
2%0%
0%17
.3%
0%6.
3Lu
xem
bour
g38.
5%0.
1%18
.3%
21.1
%0.
3%38
.8%
2.8%
2.9%
0%0%
1.7%
0%5.
5%1.
4N
ethe
rlan
ds51
.0%
0.00
3%12
.6%
19.1
%4.
0%10
.1%
0.1%
0.3%
0.3%
0.5%
0.3%
0.9%
0.7%
30.7
Nor
way
1.3%
0%46
.9%
0%0%
0%0%
0.3%
0%20
.9%
0%30
.6%
0%0.
1Po
land
29.5
%0.
5%37
.5%
5.7%
1.2%
7.2%
0.4%
7.9%
0.02
%1.
5%4.
0%3.
8%0.
7%94
.3Po
rtug
al14
.1%
0.1%
21.6
%8.
4%1.
4%4.
6%0.
01%
38.5
%0.
7%0.
1%4.
5%4.
3%1.
6%19
.5Ro
man
ia3.
3%10
.2%
5.9%
19.1
%4.
1%10
.7%
0%30
.3%
0.1%
0.02
%14
.7%
1.5%
0%16
.3Slo
vaki
a15
.2%
0.3%
14.4
%18
.0%
2.0%
12.0
%0.
8%8.
8%0.
1%0.
7%2.
7%16
.6%
8.5%
30.9
Slo
veni
a9.
5%1.
4%29
.9%
12.8
%2.
6%2.
4%2.
7%31
.5%
0.2%
0%1.
4%3.
6%2.
0%6.
8Spa
in28
.0%
0.4%
28.6
%6.
1%1.
1%5.
8%10
.0%
5.9%
0.7%
4.9%
6.3%
1.2%
1.0%
103.
7Sw
eden
41.2
%0%
3.0%
4.9%
1.0%
18.5
%0.
1%0.
1%0%
7.1%
12.9
%11
.2%
0%0.
9Sw
itzer
land
0%0%
0%0%
0%6.
0%0%
92.2
%0%
0%1.
8%0%
0%0.
1U
nite
d Kin
gdom
18.0
%0.
2%47
.5%
1.5%
0.2%
8.6%
5.9%
1.5%
0%1.
5%1.
0%3.
9%10
.2%
13.0
1 Bac
itrac
in,
fura
ltado
ne,
met
roni
dazo
le a
nd s
pect
inom
ycin
(cl
assi
fied
as ‘O
ther
ant
ibac
terial
s’ in
the
ATC
vet
syst
em).
2 Po
lym
yxin
s an
d pl
euro
mut
ilins
are
agg
rega
ted
with
‘Oth
ers’
for
rea
sons
of co
mm
erci
al c
onfid
entia
lity.
3 In
sign
ifica
nt a
mou
nts
of c
epha
losp
orin
s w
ere
sold
as
oral
sol
utio
ns.
Tab
le A
5. Pe
rcen
tage
of sa
les,
in m
g/PC
U,
of o
ral s
olut
ions
by
antim
icro
bial
cla
ss (
acco
rdin
g to
ATC
vet
syst
em)
by c
ount
ry,
for
2015

Sales of veterinary antimicrobial agents in 30 European countries in 2015Seventh ESVAC report 139
Cou
ntr
y
Tetracyclines
Amphenicols
Penicillins
1st- and 2nd-gen. cephalosporins2
3rd- and 4th-gen. cephalosporins
Sulfonamides
Trimethoprim
Macrolides
Lincosamides
Fluoroquinolones
Aminoglycosides
Polymyxins
Pleuromutilins
Other3
Total mg/PCU injection prep.
Aus
tria
7.9%
6.2%
35.8
%0%
3.0%
8.6%
1.7%
9.4%
0.5%
5.7%
20.1
%0%
0%1.
1%5.
7Bel
gium
4.7%
7.8%
61.0
%0.
2%2.
9%3.
2%0.
6%4.
7%2.
8%4.
3%1.
9%0.
1%0.
02%
5.8%
13.2
Bul
garia
30.9
%1.
8%18
.0%
0.1%
0.4%
3.3%
0.7%
9.0%
1.1%
1.6%
30.0
%0.
01%
0.8%
2.2%
15.0
Cro
atia
9.4%
11.7
%20
.7%
2.5%
0.8%
21.3
%3.
3%1.
6%0.
1%8.
4%19
.4%
0.00
4%0.
3%0.
2%23
.1Cyp
rus
12.2
%4.
3%34
.7%
0%1.
5%8.
6%0.
9%2.
5%1.
4%1.
5%28
.1%
0.2%
1.1%
3.0%
16.1
Cze
ch R
epub
lic16
.9%
2.6%
41.5
%2.
2%4.
2%3.
7%0.
7%2.
7%0.
2%3.
0%21
.6%
0%0.
5%0.
3%9.
2D
enm
ark
13.6
%2.
9%52
.1%
0%0.
05%
13.3
%2.
7%1.
8%3.
2%0.
01%
7.8%
0%1.
5%1.
1%16
.0Es
toni
a9.
3%0.
8%51
.5%
0.7%
3.3%
3.0%
0.6%
1.1%
1.0%
5.1%
18.0
%0%
3.5%
2.0%
17.1
Finl
and
11.3
%0.
1%79
.7%
0.00
1%0.
1%5.
5%1.
1%0.
3%0.
5%1.
3%0.
2%0%
0%0%
10.9
Fran
ce11
.0%
4.2%
31.4
%0.
04%
1.5%
3.6%
0.6%
10.0
%0.
8%1.
6%33
.4%
0.5%
0.02
%1.
4%12
.1G
erm
any
4.2%
8.2%
46.4
%0%
5.5%
10.7
%2.
0%4.
6%1.
8%10
.3%
4.5%
0.01
%0.
2%1.
7%6.
2G
reec
e36
.5%
1.5%
24.1
%0%
1.4%
7.0%
0.4%
7.1%
2.9%
2.2%
10.3
%0.
02%
0%6.
5%4.
8H
unga
ry9.
7%9.
1%35
.6%
1.4%
5.6%
1.9%
0.5%
4.3%
1.2%
8.3%
19.0
%0.
3%1.
4%1.
8%6.
4Ic
elan
d7.
9%0%
68.0
%0%
0.03
%3.
9%0.
8%0%
0%0.
1%19
.3%
0%0%
0%4.
2Ir
elan
d418
.9%
7.8%
36.6
%0.
4%0.
7%5.
9%1.
2%6.
0%0.
3%2.
4%19
.5%
0.3%
13.0
Ital
y9.
0%8.
3%31
.9%
0%1.
8%10
.9%
0.8%
7.1%
2.7%
4.2%
16.2
%0.
4%0.
4%6.
2%18
.6La
tvia
6.4%
0.2%
41.2
%0.
3%3.
1%8.
2%1.
6%4.
0%0.
5%3.
7%28
.8%
0%0.
7%1.
0%11
.2Li
thua
nia
14.5
%4.
2%36
.8%
1.6%
0.7%
11.0
%1.
9%1.
9%0.
3%3.
4%19
.4%
0%3.
6%0.
7%7.
8Lu
xem
bour
g9.
4%9.
3%45
.4%
0.00
2%4.
5%10
.1%
2.0%
2.2%
1.1%
5.6%
8.1%
0.3%
0%2.
1%12
.4N
ethe
rlan
ds16
.3%
15.9
%39
.0%
0%0.
04%
16.8
%3.
4%3.
2%0.
2%0.
2%4.
5%0.
1%0.
1%0.
4%8.
6N
orw
ay2.
6%0.
6%82
.6%
0%0.
02%
6.4%
1.3%
0.1%
0%0.
3%6.
0%0%
0.2%
0%1.
8Po
land
9.9%
8.8%
33.6
%0.
3%1.
1%2.
6%0.
3%0.
8%2.
2%9.
4%28
.9%
0.1%
0.9%
1.1%
11.7
Port
ugal
20.2
%7.
8%23
.9%
0.8%
3.8%
5.4%
1.1%
5.6%
0.6%
4.8%
23.6
%0.
1%0.
5%1.
8%9.
0Ro
man
ia14
.1%
9.9%
26.3
%0.
1%0.
2%3.
4%0.
7%2.
2%2.
8%5.
8%32
.0%
0.1%
0.4%
2.0%
13.3
Slo
vaki
a11
.2%
1.6%
33.3
%2.
6%3.
3%2.
5%0.
5%1.
7%0.
4%2.
1%10
.9%
0%29
.4%
0.7%
10.2
Slo
veni
a12
.3%
4.1%
31.0
%0.
9%1.
5%13
.1%
1.7%
2.4%
0.2%
9.4%
23.2
%0.
1%0%
0.2%
9.5
Spa
in7.
3%14
.4%
23.2
%0.
1%1.
9%2.
3%0.
4%8.
3%3.
0%17
.8%
17.3
%0.
2%0.
3%3.
4%15
.7Sw
eden
4.5%
0.1%
80.6
%0.
02%
0.03
%9.
3%1.
9%1.
2%0.
1%0.
3%1.
9%0%
0.1%
0%9.
2Sw
itzer
land
8.8%
2.6%
37.8
%0%
1.9%
7.3%
1.1%
4.0%
0.1%
4.2%
31.6
%0.
01%
0.3%
0.2%
9.4
Uni
ted
Kin
gdom
30.7
%4.
5%27
.5%
0.4%
1.9%
4.6%
0.7%
7.4%
0.5%
2.0%
19.8
%0%
0.1%
0.1%
7.2
1 N
eglig
ible
am
ount
of ot
her
quin
olon
es is
not
incl
uded
in t
he t
able
. 2 Fo
r th
e co
untr
ies
whe
re t
he in
ject
able
3rd
- an
d 4t
h-ge
n. c
epha
losp
orin
s ar
e al
mos
t so
lely
mar
kete
d fo
r do
gs a
nd c
ats
the
data
pro
vide
s a
cons
ider
able
ove
rest
imat
e fo
r fo
od-p
rodu
cing
ani
mal
s.3 Pa
rom
omyc
in a
nd s
pect
inom
ycin
(cl
assi
fied
as ‘O
ther
ant
ibac
terial
s’ in
the
ATC
vet
syst
em).
4 Po
lym
yxin
s an
d pl
euro
mut
ilins
are
agg
rega
ted
with
‘Oth
ers’
for
rea
sons
of co
mm
erci
al c
onfid
entia
lity.
Tab
le A
6. Pe
rcen
tage
of sa
les,
in m
g/PC
U,
of in
ject
ion
prep
arat
ions
by
antim
icro
bial
cla
ss (
acco
rdin
g to
ATC
vet
syst
em)
by c
ount
ry,
for
2015
1

Sales of veterinary antimicrobial agents in 30 European countries in 2015Seventh ESVAC report140
Table A7. Number of product presentations (product name, form, strength and pack size) containing 1, 2 and 3 antimicrobial agents sold, by country, for 2015 (tablets excluded from the data)
Country 1 ingredient 2 ingredients 3 ingredients Total number1
Austria 212 35 6 253
Belgium 319 47 4 370
Bulgaria 176 51 8 235
Croatia 134 29 5 173
Cyprus 114 33 3 150
Czech Republic 385 71 10 470
Denmark 230 55 6 291
Estonia 119 26 6 151
Finland 68 18 1 87
France 554 163 6 723
Germany 540 65 3 608
Greece 171 48 2 221
Hungary 308 51 7 366
Iceland 22 7 2 31
Ireland 230 43 4 278
Italy 608 137 12 758
Latvia 143 36 10 191
Lithuania 97 29 5 131
Luxembourg 182 51 5 238
Netherlands 204 56 3 263
Norway 57 17 2 76
Poland 398 72 8 479
Portugal 466 71 13 550
Romania 375 85 9 471
Slovakia 259 45 11 318
Slovenia 101 29 2 133
Spain 588 84 4 676
Sweden 87 23 1 111
Switzerland 131 54 36 221
United Kingdom 304 37 5 347
Total 30 countries 7,582 1,568 199 9,3701 In addition, 21 presentations contained 4 active ingredients, accounting for 0.2% of the product presentations in the 30 countries.

Sales of veterinary antimicrobial agents in 30 European countries in 2015Seventh ESVAC report 141
Table A8. Number of product presentations (product name, form, strength and pack size) of premixes, oral powders and oral solutions sold containing 1, 2 and 3 antimicrobial agents sold, by country, for 20151
Country 1 ingredient 2 ingredients 3 ingredients Total number of product presenta-
tions for premixes, oral powders and
oral solutions
Austria 74 11 2 87
Belgium 119 23 142
Bulgaria 106 23 129
Croatia 45 12 1 61
Cyprus 50 17 67
Czech Republic 181 43 3 227
Denmark 90 13 1 104
Estonia 27 4 31
Finland 22 5 27
France 287 85 372
Germany 228 31 259
Greece 92 26 118
Hungary 171 23 194
Iceland 4 1 5
Ireland 58 11 69
Italy 332 71 6 410
Latvia 32 6 38
Lithuania 33 5 38
Luxembourg 59 21 80
Netherlands 81 22 103
Norway 22 2 24
Poland 210 25 235
Portugal 188 25 5 218
Romania 216 31 1 249
Slovakia 110 24 5 139
Slovenia 31 13 44
Spain 311 21 332
Sweden 21 3 24
Switzerland 41 13 27 81
United Kingdom 118 14 132
Total 30 countries 3,359 624 51 4,0391 In addition, 5 preparations contained 4 active ingredients, accounting for 0.1% of the product presentations for premixes, oral powders and oral
solutions in the 30 countries.

Sales of veterinary antimicrobial agents in 30 European countries in 2015Seventh ESVAC report142
Table A9. Sales, in tonnes of active ingredient, of antimicrobial agents sold as premixes, oral powders and oral solutions containing 1, 2 and 3 active ingredients, by country, for 20151
Country 1 ingredient 2 ingredients 3 ingredients Tonnes (premixes,
oral powders and oral
solutions)
Tonnes % Tonnes % Tonnes %
Austria 36.8 89% 3.7 9% 1.1 3% 41.5
Belgium 153.0 65% 81.3 35% 0 0% 234.3
Bulgaria 34.8 86% 5.4 14% 0 0% 40.3
Croatia 15.8 75% 2.1 10% 0.7 4% 21.0
Cyprus 33.3 74% 11.8 26% 0 0% 45.1
Czech Republic 31.8 80% 7.8 20% 0.3 1% 39.9
Denmark 54.3 88% 7.1 12% <0.001 <0.001% 61.3
Estonia 5.5 97% 0.2 3% 0 0% 5.7
Finland 2.7 63% 1.6 37% 0 0% 4.2
France 301.5 74% 103.5 26% 0 0% 405.0
Germany 730.4 93% 54.5 7% 0 0% 784.8
Greece 55.9 84% 10.4 16% 0 0% 66.4
Hungary 148.8 87% 21.3 13% 0 0% 170.1
Iceland 0.03 72% 0.01 28% 0 0% 0.04
Ireland 58.9 86% 9.8 14% 0 0% 68.6
Italy 817.5 67% 382.9 31% 20.5 2% 1,221.1
Latvia 4.1 95% 0.2 5% 0 0% 4.3
Lithuania 5.5 67% 2.7 33% 0 0% 8.2
Luxembourg 0.9 77% 0.2 23% 0 0% 1.1
Netherlands 148.9 82% 33.3 18% 0 0% 182.2
Norway 0.5 85% 0.1 15% 0 0% 0.6
Poland 485.7 93% 39.1 7% 0 0% 524.8
Portugal 117.2 94% 7.0 6% 0.3 0.2% 124.5
Romania 204.8 92% 15.7 7% 0.9 0.4% 221.5
Slovakia 8.7 82% 1.7 16% 0.2 2% 10.6
Slovenia 2.1 80% 0.5 20% 0 0% 2.7
Spain 2,469.0 85% 438.5 15% 0 0% 2,907.5
Sweden 0.9 92% 0.1 8% 0 0% 1.0
Switzerland 6.7 23% 6.7 23% 15.7 54% 29.1
United Kingdom 260.8 77% 78.5 23% 0 0% 339.2
Total 30 countries 6,196.9 82% 1,327.5 18% 39.7 0.5% 7,566.6
1 In addition, 0.03% of the total sales of premixes, oral powders and oral solutions preparations contained 4 active ingredients, accounting for 2.5 tonnes.
Correction: 30/10/2017 – Note to Table A9 was updated to correspond to correct data.

Sales of veterinary antimicrobial agents in 30 European countries in 2015Seventh ESVAC report 143
Figure A1. Distribution of sales of tetracyclines, penicillins and sulfonamides for food-producing animals, in mg/PCU, by the major pharmaceutical forms sold, aggregated by the 30 European countries, for 2015
* Other forms include boluses, oral pastes, intramammary and intrauterine preparations.
* Other forms include boluses, oral pastes, intramammary and intrauterine preparations.
* Other forms include boluses, oral pastes, intramammary and intrauterine preparations.
Correction:30/10/2017 – The proportion of oral powders and oral solutions for tetracyclines, penicillins and sulfonamides on page 143 was corrected.
Tetracyclines
Premix
Oral solution
Oral powder
Injection prep.
Other*
0.5%
53.4%
23.6%
19.5%
2.9%
Penicillins
Premix
Oral powder
Oral solution
Injection prep.
Other*
1.3%
31.2%
28.0%
28.4%
11.1%
Sulfonamides
Premix
Oral powder
Oral solution
Injection prep.
Other*
0.9%
55.5%
13.7%
25.6%
4.4%
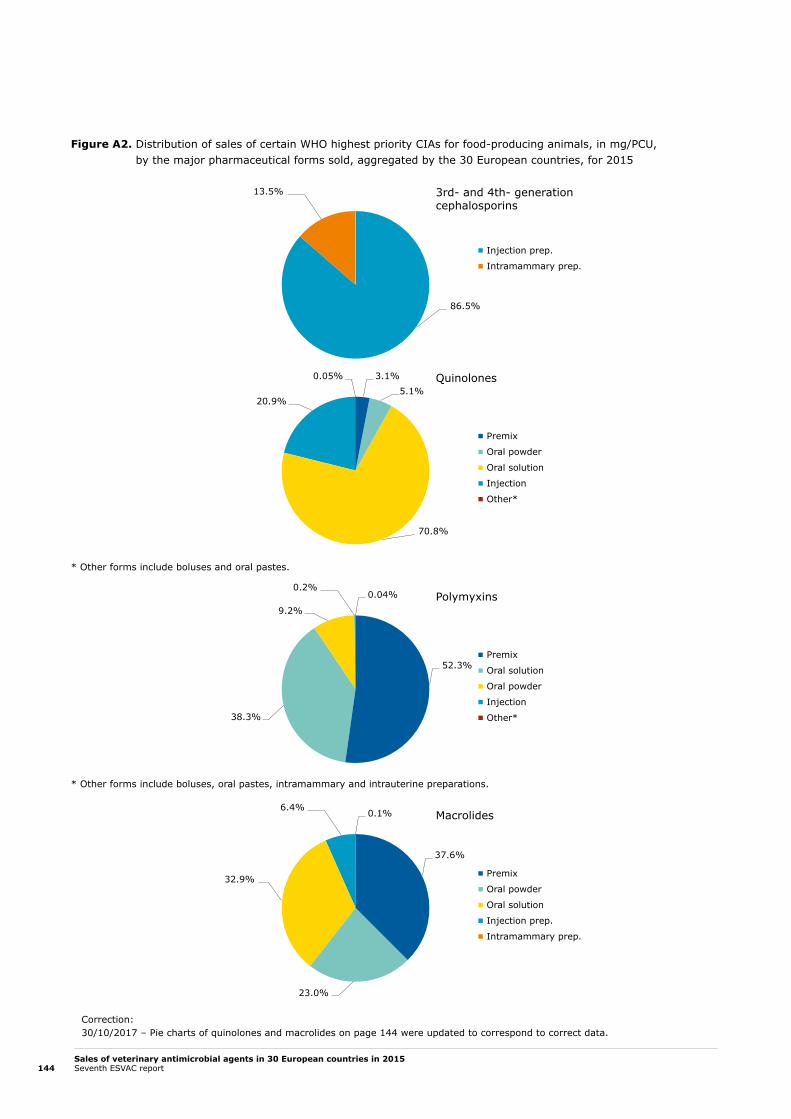
Sales of veterinary antimicrobial agents in 30 European countries in 2015Seventh ESVAC report144
Figure A2. Distribution of sales of certain WHO highest priority CIAs for food-producing animals, in mg/PCU, by the major pharmaceutical forms sold, aggregated by the 30 European countries, for 2015
* Other forms include boluses and oral pastes.
* Other forms include boluses, oral pastes, intramammary and intrauterine preparations.
Correction: 30/10/2017 – Pie charts of quinolones and macrolides on page 144 were updated to correspond to correct data.
3rd- and 4th- generation cephalosporins
Injection prep.
Intramammary prep.
86.5%
13.5%
Polymyxins
Premix
Oral solution
Oral powder
Injection
Other*
0.04%
52.3%
9.2%
0.2%
38.3%
Quinolones
Premix
Oral powder
Oral solution
Injection
Other*
3.1%0.05%
70.8%
20.9%5.1%
Macrolides
Premix
Oral powder
Oral solution
Injection prep.
Intramammary prep.
0.1%
37.6%
32.9%
6.4%
23.0%

Sales of veterinary antimicrobial agents in 30 European countries in 2015Seventh ESVAC report 145
Annex 2. Variables to be reported for each antimicrobial veterinary medicinal product; standardisation of the dataTable A10. Variables reported to ESVAC for each antimicrobial veterinary medicinal product, for 2015
Variable Description of variable Justification
COUNTRY ISO code (http://www.iso.org/iso/country_codes)
To identify place of collected sales data.
YEAR To identify time period for collected sales data.
MA Marketing authorisation number To allow for the unique identification of the veterinary medicinal product (VMP) and enable a link with other databases.To allow for market analysis if all the products are available.
PR
OD
UC
T IN
FOR
MA
TIO
N
ID Medicinal product package code value Digit code is a unique identifier for each package size, strength and formulation of the VMP. Because it is a key variable in many databases, it must be stable over time, i.e. so that VMPs no longer available on the market or that are no longer registered can still be identified to allow for analysis of historical data.
To allow for analysis of historical data.To allow for identification of duplicate reporting of sales.
NAME Medicinal product name (in national language) e.g. Harmony vet tablets 2 × 30; Harmony vet long-acting injection 10 ml.
For validation purposes.To allow, for example, for analysis of use of, for example, long-acting preparations and antimicrobial resistance.
FORM Pharmaceutical formBolus (BOLUS), Injection (INJ), Intramammary preparation (INTRAMAM), Intramammary preparation dry cow (INTRAMAM-DC), Oral solution (ORAL SOLU), Oral paste (ORAL PASTE), Oral powder (ORAL POWD), Premix (PREMIX), Capsules and Tablets, etc. (TABL), Intrauterine preparation (INTRAUT).
Important to avoid misinterpretation of pharmaceutical form if given in a language other than English.Allows for reporting of data as individual or group treatment.
LONG ACTING Long-acting injectable preparations This refers to injectable preparations that, once injected, maintain their antimicrobial activity over a long period of time.
Optional.
PACKSIZE Content quantity in package: pack size (numerical only)e.g. 100 for 100 tablets or 100 intramammary prep.; 10 for 10 ml injection; Package of 2 kg premix: 2; Box of 10 blisters of 30 tablets: 300; Box of 12 injectors: 12.
To allow for calculation of the amount of active ingredient in each package/product.
PACKSIZEU Content unit of measuremente.g. ML, L, G, KG, PIECE (for example, for tablets, capsules, boluses and intramammary prep.).
To allow for calculation of amount of active ingredient in each package/product.
ATCvet - 5th LEVEL
ATCvet: Anatomical Therapeutic Chemical (Classification) VeterinaryWHO ATCvet code last version to be used.
Generally, a classification system needs to have a common language when reporting use and analysing data with data on AMR, e.g. for 3rd- and 4th-generation cephalosporins.To have a common language for defining confidentiality of the data (can be converted into ATCvet 3rd level).

Sales of veterinary antimicrobial agents in 30 European countries in 2015Seventh ESVAC report146
Variable Description of variable Justification
SPECIES Animal speciesAll the animal species for which the VMP is approved, e.g. cattle (CA), poultry (POU).
Optional.
NO SOLD Number of packages sold/year/country To calculate weight of active ingredient sold.
ING
RED
IEN
T
INGR Active ingredient name (ATCvet name)In case of multi-ingredient VMP, the ATCvet names of all the ingredients must be given.
Important to avoid misinterpretation of ingredient name if given in a language other than English.Use of ATCvet names facilitates the identification of active ingredients as well as standardised reporting.
SALT Salt of active ingrediente.g. colistin sulfate and colistin methanesulfonate.
Only in cases when the strength is given in IU, IU/ML or IU/UNIT and when different salts exist, to allow for conversion to weight of active ingredient.
PRODRUG Prodrug name (ATCvet name)e.g. procaine penicillin which is a prodrug for benzylpenicillin.
Only in cases when a product contains a prodrug.
STRENGTH Quantity of the active ingredient in each unit as declared in SPC/label: strength (numerical only)e.g. 10 for 10 MG/TABLET, 10 IU/TABLET, 10 MG/ML, 10 IU/ML, 10 MG/PIECE or 10 IU/PIECE.In case of a multi-ingredient VMP, strength must be given for each ingredient separately.
To allow for calculation of amount of active ingredient in each package/product and to validate INGR CONTENT.
STRENGTHU Unit of measurement for strengthe.g. IU, IU/G, IU/ML, IU/PIECE, G, G/KG, G/L, MG, MG/ML, MG/PIECE.In case of a multi-ingredient VMP, unit of measurement strength has to be given for each ingredient on a separate line.
To allow for calculation of the amount of active ingredient in each package/product and to validate INGR CONTENT.
CONV FACT IU Conversion factor IUWhen strength is given as IU, IU/ML or IU/PIECE.
When strength is only given as IU, IU/ML or IU/PIECE. To allow for calculation of weight of the active ingredient in the package.
CONV FACT PRODR
Conversion factor prodrugOnly when strength is given for the prodrug and not for the active ingredient (e.g. procaine penicillin that is prodrug for benzylpenicillin).
To allow for calculation of weight of the active ingredient in the package.
INGR CONTENT Content of active ingredient in packageIn case of a multi-ingredient VMP, the content in the package has to be given separately for each ingredient on a separate line.
Optional: to allow for validation of the ESVAC calculations.
CONT UNIT (G) Unit of active ingredient in packageTo be given in grams (g) for all substances.In case of a multi-ingredient VMP, the content unit has to be given separately for each ingredient on a separate line.
Optional: to allow for validation of the ESVAC calculations.
TONNES SOLD Tonnes sold of active ingredient
For antimicrobial veterinary medicinal products containing more than one active ingredient, information on the active ingredient name, strength and strength unit must be given for each ingredient separately.

Sales of veterinary antimicrobial agents in 30 European countries in 2015Seventh ESVAC report 147
Table A11. Conversion factors used to convert from International Units (IU) to weight (mg) of active ingredient, based on WHO standards1
Active ingredient IU/mg Conversion factor (mg/IU)
Bacitracin 74 0.01351
Benzylpenicillin (and prodrugs to benzylpenicillin)2 1,667 0.00060
Chlortetracycline3 900 0.00111
Colistin sulphate 20,500 0.00005
Colistin methane sulphonate4 12,700 0.00008
Dihydrostreptomycin 820 0.00122
Erythromycin 920 0.00109
Gentamicin 620 0.00161
Kanamycin 796 0.00126
Neomycin 755 0.00133
Framycetin 670 0.00149
Oxytetracycline 870 0.00115
Paromomycin2 675 0.00148
Polymyxin B 8,403 0.00012
Spiramycin 3,200 0.00031
Streptomycin 785 0.00127
Tetracycline 982 0.00102
Tobramycin 875 0.00114
Tylosin 1,000 0.001001 WHO standards (http://crs.pheur.org/db/4DCGI/search?vSelectName=4&vContains=1&vtUserName=ISA&OK=Search).2 Martindale (http://www.medicinescomplete.com/mc/martindale/current/141-b.htm?q=procain%20penicillin&t= search&ss=text&p=2#_hit).3 WHO Pharmacopoeia (http://apps.who.int/phint/en/p/docf/).4 WHO International Biological Reference Preparations (http://www.who.int/bloodproducts/catalogue/AntiJan10.pdf).
Table A12. Conversion factors used to convert from prodrug content to content of active ingredient1
Prodrug Conversion factor Active ingredient
Benethamine benzylpenicillin 0.65 Benzylpenicillin
Benzathine benzylpenicillin2 0.74 Benzylpenicillin
Cefapirin benzathine 0.41 Cefapirin
Cefalexin benzathine 0.36 Cefalexin
Cloxacillin benzathine 0.43 Cloxacillin
Oxacillin benzathine 0.69 Oxacilline
Penethamate hydriodide 0.63 Benzylpenicillin
Procaine penicillin 0.61 Benzylpenicillin1 Martindale (http://www.medicinescomplete.com/mc/martindale/current/141-b.htm?q=procain %20penicillin&t= search&ss=text&p=2#_hit). 2 Revised (previously 0.39) as an error was identified.

Sales of veterinary antimicrobial agents in 30 European countries in 2015Seventh ESVAC report148
Annex 3. Population correction unit (PCU)
Table A13. Animal categories included in the calculation of the population correction unit (PCU) and data types to be reported
Animal category Numbers/tonnes
Cattle (heads)
Slaughtered cows
Slaughtered heifers
Slaughtered bullocks and bulls
Slaughtered calves and young cattle
Import slaughter
Export slaughter
Import fatteners
Export fatteners
Living dairy cows
Pigs (heads)
Slaughtered pigs
Import slaughter
Export slaughter
Import fatteners
Export fatteners
Living sows
Poultry (heads)
Slaughtered broilers
Slaughtered turkeys
Import slaughter
Export slaughter
Caprinae (heads)
Slaughtered sheep and goats
Import sheep slaughter
Export sheep slaughter
Import sheep fatteners
Export sheep fatteners
Living sheep
Import goats slaughter
Export goats slaughter
Import goats fatteners
Export goats fatteners
Equidae (heads)
Living horses
Rabbits (heads)
Slaughtered rabbits
Fish (tonnes)
Biomass slaughter weight

Sales of veterinary antimicrobial agents in 30 European countries in 2015Seventh ESVAC report 149
Table A14. Weights used to calculate the population correction unit
Animal category Weight in kg
Slaughtered or livestock (Eurostat)
Slaughtered cow 425
Slaughtered heifer 200
Slaughtered bullocks and bulls 425
Slaughtered calves and young cattle 140
Dairy cow 425
Slaughtered pig 65
Living sow 240
Broiler 1
Turkey 6.5
Slaughtered sheep and goats 20
Living sheep 75
Horse 400
Rabbit 1.4
Imported/exported for fattening or slaughter (TRACES data)
Slaughtered bovine 425
Fattening bovine 140
Slaughtered pig 65
Fattening pig 25
Slaughtered poultry 1
Slaughtered sheep 20
Fattening sheep 20
Slaughtered goat 20
Fattening goat 20

Sales of veterinary antimicrobial agents in 30 European countries in 2015Seventh ESVAC report150
Annex 4. List of antimicrobial classes/active ingredients reported in ESVACTable A15 includes all the substances for which sales have been reported, divided by class or subclass. Note that in the ESVAC, sales are reported by classes/subclasses independent of whether or not this refers to a single or a combination product — i.e. not by ATCvet classes. An exception to this is combinations of penicillins, including beta-lactamase inhibitors, which are included as the combination penicillins + beta-lactamase inhibitors reported as such in Figures 7 and 45.
Pharmacologically active substances that may be used in food-producing animals must be listed in Table 1 of the Annex to Commission Regulation (EU) No 37/2010. The table details, among others, the food-producing animal species for which those substances can be used. Table 2 of that annex contains substances that are prohibited for use in any food-producing species; some of these are included in Table A15 below, because they are used in companion animals for which no maximum residue limits (MRLs) are required.
Table A15. List of substances reported sold in ESVAC 2010-2015
Class/subclass Substances
Tetracyclines
Chlortetracycline Doxycycline Oxytetracycline
Tetracycline
Amphenicols
Chloramphenicol1 Florfenicol Thiamphenicol
Penicillins
Beta-lactamase-sensitive penicillins
Benzathine benzylpenicillin Benzathine phenoxymethylpenicillin
Benzylpenicillin
Penethamate hydriodide Phenoxymethylpenicillin Pheneticillin
Procaine benzylpenicillin
Beta-lactamase-resistant penicillins
Cloxacillin Dicloxacillin Nafcillin
Oxacillin
Penicillins with extended spectrum
Amoxicillin Ampicillin Metampicillin2
Combinations of penicil-lins, incl. beta-lactamase inhibitors
Amoxicillin Ampicillin
Cephalosporins
First-generation cephalosporins
Cefacetrile Cefadroxil2 Cefalexin
Cefalonium Cefapirin Cefazolin
Cefalotin

Sales of veterinary antimicrobial agents in 30 European countries in 2015Seventh ESVAC report 151
Class/subclass Substances
Third-generation cephalosporins
Cefoperazone Cefovecin2 Ceftiofur
Fourth-generation cephalosporins
Cefquinome
Sulfonamides and trimethoprim
Sulfonamides
Formosulfathiazole Phthalylsulfathiazole Sulfacetamide
Sulfachlorpyridazine Sulfaclozine Sulfadiazine
Sulfamonomethoxine Sulfadimethoxine Sulfadimidine
Sulfadoxine Sulfafurazole Sulfaguanidine
Sulfalene Sulfamerazine Sulfamethizole
Sulfamethoxazole Sulfamethoxypyridazine Sulfanilamide
Sulfapyridine Sulfaquinoxaline Sulfathiazole
Sulfazuinoxaline
Trimethoprim and derivatives
Trimethoprim
Macrolides and lincosamides
Macrolides
Erythromycin Gamithromycin Oleandomycin
Spiramycin Tildipirosin Tilmicosin
Tulathromycin Tylosin Tylvalosin
Lincosamides
Clindamycin2 Lincomycin Pirlimycin
Aminoglycosides
Amikacin2 Apramycin Dihydrostreptomycin
Framycetin Gentamicin Kanamycin
Neomycin Streptomycin
Quinolones
Fluoroquinolones
Danofloxacin Difloxacin Enrofloxacin
Ibafloxacin2 Marbofloxacin Norfloxacin2
Orbifloxacin2 Pradofloxacin2
Other quinolones
Cinoxacin2 Flumequine Oxolinic acid
Imidazole derivatives
Metronidazole1

Sales of veterinary antimicrobial agents in 30 European countries in 2015Seventh ESVAC report152
Class/subclass Substances
Pleuromutilins
Tiamulin Valnemulin
Polymyxins
Colistin Polymyxin B2
Nitrofuran derivatives
Furazolidone1
Other antibacterials
Bacitracin Fosfomycin Furaltadone1
Natamycin Nitroxoline Novobiocin
Paromomycin Rifaximin Spectinomycin
1 Included in Table 2 (prohibited substances) of the Annex to Commission Regulation (EU) No 37/2010.2 MRLs not established for any food-producing species.3 MRLs not established for poultry (not allowed to be used).

Sales of veterinary antimicrobial agents in 30 European countries in 2015Seventh ESVAC report 153
Annex 5. Criteria of WHO CIAs and AMEG Category 2The WHO list of critically important antimicrobials28 and the EU Antimicrobial Advice ad hoc Expert Group (AMEG) list29,30 were used to select classes that are highlighted in the report. The classes/subclasses highlighted are those that are categorised as highest priority CIA in human medicine and also belong to AMEG Category 2 (Table A16).
Table A16. Antimicrobial classes highlighted in the report and its classification
Antimicrobial class AMEG classification WHO classification
3rd- and 4th-generation cephalosporins
Category 2 Highest priority CIAs (3rd- and higher-generation cephalosporins)
Fluoroquinolones and other quinolones
Category 2 (other quinolones not included)
Highest priority CIAs
Macrolides (including ketolides) Category 1 Highest priority CIAs
Polymyxins Category 2 Highest priority CIAs
Aminoglycosides Provisionally included in Category 2 (but no risk profiling has been provided)
CIAs
Certain penicillins (amoxicillin, ampicillin, metampicillin)
Provisionally included in Category 2 (but no risk profiling has been provided)
CIAs
WHO highest priority critically important antimicrobials
The classes of antimicrobials included in the highest priority critically important antimicrobials include those within the WHO critically important category that are prioritised to assist in allocating resources to agents for which risk-management strategies are needed most urgently.
The WHO criteria for including substances in the highest priority critically important antimicrobials require that three parameters are fulfilled (WHO, 2017):
1. High absolute number of people, or high proportion of use in patients with serious infections in health-care settings affected by bacterial diseases for which the antimicrobial class is the sole or one of few alternatives to treat serious infections in humans.
2. High frequency of use of the antimicrobial class for any indication in human medicine, or high proportion of use in patients with serious infections in health-care settings, since use may favour selection of resistance in both settings.
3. The antimicrobial class is used to treat infections in people for whom there is evidence of transmission of resistant bacteria (e.g. non-typhoidal Salmonella and Campylobacter spp.) or resistance genes (high for E. coli and Enterococcus spp.) from non-human sources.
28 WHO Critically important antimicrobials for human medicine, 5th revision. (http://www.who.int/foodsafety/publications/antimicrobials-fifth/en/)
29 EMA/AMEG 2014. Answers to the request for scientific advice on the impact on public health and animal health of the use of antibiotics in animals (http://www.ema.europa.eu/docs/en_GB/document_library/Other/2014/07/WC500170253.pdf)
30 EMA/AMEG 2016. Updated advice on the use of colistin products in animals within the European Union: development of resistance and possible impact on human and animal health (http://www.ema.europa.eu/docs/en_GB/document_library/Scientific_guideline/2016/07/WC500211080.pdf)

Sales of veterinary antimicrobial agents in 30 European countries in 2015Seventh ESVAC report154
AMEG Category 2
The AMEG categorisation is based on the WHO list of CIAs, and on the need for the class of antimicrobials in human medicine and the risk of spreading resistance from animals to humans.
Different criteria defining the risk of spreading resistance were considered by AMEG; they are:
1. The presence of a chromosomal mutation contributing to the development of resistance to a clinically-relevant antimicrobial.
2. Organisation of non-chromosomal resistance genes into horizontally-transferable elements.
3. The presence of a cluster of resistance genes facilitating co-selection.
4. Other factors, such as the incorporation of plasmid- or transposon/integron-mediated resistance into the bacterial chromosome in discrete ‘resistance islands’ or the presence of plasmid addiction systems.
5. The potential for transmission of resistance through zoonotic and commensal food-borne bacteria.
In its Category 2, AMEG includes antimicrobials used in veterinary medicine where the risk for public health is estimated to be higher. Category 2 includes those antimicrobial classes listed as CIAs by WHO for which the risk to public health from veterinary use is only considered acceptable provided that specific restrictions are placed on their use. These reserved antimicrobials should be used only when no alternative antimicrobials are authorised for the respective target species and indication.
The two factors mentioned above (the need in human medicine and risk of spreading resistance from animals to humans) apply over the whole of the EU, independently of the animal health situation, and of the availability of antimicrobial products for animals in individual Member States.

Sales of veterinary antimicrobial agents in 30 European countries in 2015Seventh ESVAC report 155
Annex 6. Distribution of veterinary medicines; legal framework and data sources by country
Austria
Distribution of veterinary medicines
In Austria, all veterinary medicinal products (VMPs) are prescription-only medicines. VMPs are dispensed by pharmaceutical companies or wholesalers to veterinarians. Only veterinarians are allowed to sell VMPs to farmers. Veterinarians have to confirm the distribution of veterinary drugs to owners of food-producing animals and horses if used for food production. Distribution of VMPs to farmers is restricted to VMPs registered for topical or oral use. Distribution of VMPs for intramammary use or for systemic use (injection) and premixes is restricted to farms that are members of the Austrian Animal Health Service. Sales of VMPs by public pharmacies must be prescribed by a veterinarian; such sales account for a negligible amount of sales for farm animals.
Legal basis for the monitoring of sales
The collection of sales data by pharmaceutical companies and wholesalers is based on the national law on animal drug control: BGBl. II Nr. 83/2014 Veterinär-Antibiotika-MengenströmeVO.
Data sources
Sales data have to be uploaded into the national database by pharmaceutical companies either producing or importing VMPs, and by wholesalers which are assigned by the industry to distribute a product.
Belgium
Distribution of veterinary medicines
In Belgium, all VMPs containing antimicrobial agents are prescription-only medicines. This includes medicated premixes containing pharmaceutically active substances, like antimicrobial agents.
VMPs (pharmaceutical formulation) are distributed through wholesaler-distributors to veterinarians and pharmacists; the wholesaler-distributor obtains the VMPs from a wholesaler or the authorised producer. Antimicrobial VMPs are only available to animal owners via delivery from a pharmacy, on veterinary prescription, or directly from the veterinarian.
Premixes are distributed through wholesalers or wholesaler-distributors directly to feed mills. Only farmers are receivers from feed mills. Medicated feed is always on veterinary prescription.
Note: since 1 June 2014, the Federal Agency of Medicines and Health Products (FAHMP) has imposed a fee per package, according to the active ingredient content, for all veterinary antibiotics on the Belgian market on behalf of the MAHs. A higher fee is imposed if it concerns critically important antibiotics such as cephalosporins, quinolones or macrolides.
Legal basis for the monitoring of sales
The collection of sales data is based on the national law on medicines of 25 March 1964 (Art. 12) and on the Royal Decree of 14 December 2006 on medicines for human and veterinary use (Arts. 221 and 228). Wholesaler-distributors and feed mills are obliged to keep records of all sales and to deliver these records to the FAHMP on a yearly basis.
Data sources
To avoid double counting, all wholesaler-distributors are asked to provide sales data for the antimicrobial VMPs delivered to pharmacies and veterinarians, while sales data for antimicrobial premixes are provided by the Belgian feed mills licensed to produce medicated feed and to deliver it to Belgian farmers.

Sales of veterinary antimicrobial agents in 30 European countries in 2015Seventh ESVAC report156
Data collection for both concerned parties is organised via a secure web application with a login and password delivered by letter.
Import data on medicated feed produced in another EU country and delivered to Belgian farmers are not included in the material.
Bulgaria
Distribution of veterinary medicines
In Bulgaria, all VMPs containing antimicrobial agents are prescription-only medicines. This includes medicated premixes containing pharmaceutically active substances like antimicrobial agents. VMPs are distributed through wholesalers to veterinarians, farms and pharmacists; the wholesalers acquire the VMPs from another wholesaler or the authorised manufacturer. Antimicrobial VMPs are only available to animal owners by delivery from a pharmacy or wholesaler, on veterinary prescription, or directly from the veterinarian. Premixes are distributed through wholesalers directly to feed mills. Only farmers receive feed from feed mills. Medicated feed is always on veterinary prescription.
Legal basis for the monitoring of sales
The collection of sales data is based on the national law on veterinary activities, promulgated in the State Gazette (SG), Issue №7/25.01.2013. At the request of the Executive Director of BFSA, in view of pharmacovigilance, the holder of a marketing authorisation for VMP shall provide data on the volume of sales of VMPs. Wholesalers, pharmacies and farmers are obliged to keep records of all sales and purchases, and to deliver these records to the Bulgarian Food Safety Agency on request.
Data sources
Sales data are collected from all manufacturers, importers and wholesalers, which are also either MAHs or official representatives of MAHs in Bulgaria (to avoid double counting, sales of other wholesalers are excluded). The data include the sales to veterinarians, farms and pharmacies.
Croatia
Distribution of veterinary medicines
In Croatia, all antimicrobial veterinary medicinal products (VMPs) are prescription-only medicines. VMPs are dispensed by pharmaceutical companies or wholesalers of VMPs to veterinary practices (surgery, station, and hospital), veterinary pharmacies and feed mills. Animal owners can only buy antimicrobial VMPs on veterinary prescription in a veterinary pharmacy.
Large farms have authorised their own veterinary practices for their animals and they can buy premixes on veterinary prescription from a veterinary pharmacy and use them in feed mills. Feed mills should have a record of veterinary prescriptions covering each amount of antimicrobial VMP used.
Legal basis for the monitoring of sales
The collection of sales data by wholesalers is based on the national law, published in the Official Gazette of the Republic of Croatia No: 84/08, 56/13, 94/13 & 15/15.
Data sources
The veterinary antimicrobial agents’ sales data are obtained each year from the authorised wholesalers.

Sales of veterinary antimicrobial agents in 30 European countries in 2015Seventh ESVAC report 157
Cyprus
Distribution of veterinary medicines
In Cyprus, all VMPs containing antimicrobials are prescription-only medicines. They are dispensed either by pharmacies or veterinary clinics. Veterinarians are only allowed to administer VMPs to animals under their direct personal responsibility. The supply of VMPs to pharmacies and veterinary clinics is conducted by authorised wholesalers.
Medicated feeding stuffs containing antimicrobials are manufactured on a prescription basis, and only by authorised feed mills. Feeding stuffs manufactured in or imported into Cyprus are distributed by authorised suppliers, and only administered on prescription by a veterinarian.
Legal basis for the monitoring of sales
The data are provided under legal requirements for the wholesaler/veterinarian/pharmacist to give any information requested.
Data sources
The data on sales of the veterinary antimicrobial agents included are obtained each year from the authorised wholesalers.
Czech Republic
Distribution of veterinary medicines
In the Czech Republic, all VMPs containing antimicrobial agents are prescription-only medicines. This includes medicated feeding stuffs manufactured from medicated premixes containing antimicrobials. There are five categories of receiver of antimicrobial VMPs from wholesalers: wholesalers (when selling to each other), veterinarians, pharmacies, farmers and feed mills, while only farmers are receivers from feed mills. Medicated feed has to be prescribed by veterinarians and produced by feed mills authorised by the Institute for State Control of Veterinary Biologicals and Medicaments.
Legal basis for the monitoring of sales
The collection of sales data is based on a national law on pharmaceuticals, Act No. 378/2007 Coll.
Data sources
Sales data are collected from all wholesalers and feed mills licensed in the Czech Republic.
Brief description of data collection
Manufacturers/wholesalers fill in the template with their quarterly sales data, divided into five categories (no data about customers); only sales for veterinarians, pharmacies and farmers are used to calculate consumption.
In the case of medicated premixes, the data reported by manufacturers of medicated feeding stuffs are used for calculation. Sales to wholesalers and manufacturers of medicated feeding stuffs are used for the verification of VMP sales.
Denmark
Distribution of veterinary medicines
In Denmark, all VMPs are prescription-only medicines, and can only be dispensed either through pharmacies or via a small number of dispensing companies approved by the Danish Medicines Agency to dispense VMPs on the same legal terms as those to which the pharmacies are subject. Both pharmacies and dispensing companies are supplied by pharmaceutical companies and wholesalers. An exemption from the pharmacy/dispensing-company monopoly has been granted for medicated feeds, i.e. feeds into which VMPs formulated as premix are mixed prior to sale. Medicated feed has to be prescribed by veterinarians and produced by feed mills authorised by the Danish Medicines Agency.

Sales of veterinary antimicrobial agents in 30 European countries in 2015Seventh ESVAC report158
Legal basis for the monitoring of sales
All sales of prescription medicines by pharmacies, dispensing companies and feed mills are mandated to be reported to the VetStat database, owned by the Ministry of Environment and Food of Denmark. The pharmacy/dispensing-company sales records include sales of all prescription medicines to animal owners, as well as medicines purchased by veterinary practitioners for use in their practice. Furthermore, it is mandatory for the veterinarians to report to the VetStat medicines used in their own practices for food-production animals. Antimicrobial sales for companion animals are gathered from sales reported by pharmacies to veterinarians.
Data sources
Data on sales of all prescription medicines at package level from pharmacies, dispensing companies, veterinarians and feed mills are retrieved from the VetStat database.
Estonia
Distribution of veterinary medicines
In Estonia, antimicrobial VMPs are prescription-only medicines. VMPs have to be dispensed through pharmacies (general and veterinary) and veterinarians, who are supplied by wholesalers.
Legal basis for the monitoring of sales
Wholesalers are obliged to report the sales of VMPs to the State Agency of Medicines according to the Medicinal Products Act of 2005.
Data source
The State Agency of Medicines collects sales data at package level from wholesalers. Only sales to pharmacies (general and veterinary) and veterinarians are accounted for, to avoid double reporting by including sales to other wholesalers.
Finland
Distribution of veterinary medicines
In Finland, all VMPs that contain antimicrobials are prescription-only medicines. They are available either from pharmacies on veterinarian’s prescription or directly from veterinarians. Veterinarians are allowed to dispense medicines for the treatment of animals under their care, but are not allowed to profit from the sales. Pharmacies and veterinarians are supplied by wholesalers. Medicated feeds may either be produced by feed mills or imported to Finland, but always require a prescription from a veterinarian.
Legal basis for the monitoring of sales
Wholesalers are obliged to provide information on the sales of VMPs to the Finnish Medicines Agency in accordance with the Medicines Act (375/1987). Production and imports of medicated feeds have to be reported to the Finnish Food Safety Authority in accordance with the Decree on Medicated Feeds (10/EEO/2008).
Data source
The sales data are obtained at package level from wholesalers by the Finnish Medicines Agency, which monitors the sales of VMPs. Sales of antimicrobial agents in medicated feed are monitored by the Finnish Food Authority which collects data from feed mills and other importers.

Sales of veterinary antimicrobial agents in 30 European countries in 2015Seventh ESVAC report 159
France
Distribution of veterinary medicines
In France, all VMPs are available on prescription only. VMPs are distributed mainly through wholesalers to veterinarians and pharmacists; wholesalers obtain the VMPs from marketing authorisation holders.
Legal basis for the monitoring of sales
A new law published at the end of 2014 makes the provision of data on antimicrobial sales to the competent authority mandatory.
Data sources
The sales data are collected from marketing authorisation holders at package level by Anses-ANMV (French Agency for Veterinary Medicinal Products), in collaboration with the French Veterinary Medicine Industry Association. Double reporting is avoided because the data are not provided by the wholesalers but directly by the MAHs, which do not trade among one another.
Germany
Distribution of veterinary medicines
In Germany, all VMPs containing antimicrobial agents are prescription-only medicines. Veterinarians are allowed to dispense drugs directly to the farmer for the treatment of animals in their care. Veterinarians are supplied with VMPs directly from pharmaceutical companies or wholesalers. Very few animal owners acquire VMPs from pharmacies.
Premixes have to be prescribed by veterinarians, and medicated feed is produced by officially authorised feed mills thereafter.
Legal basis for the monitoring of sales
The collection of sales data from pharmaceutical companies and wholesalers is based on German medicines law. This is further specified in a specific regulation.
Data sources
Data on sales to veterinarians are collected by pharmaceutical companies and wholesalers which dispense antimicrobial agents to veterinarians located in Germany. In the case of premixes, sales data are taken from periodic safety update reports (PSURs), because premixes are provided to feed mills on prescription and thus are not included in the data on sales to veterinarians.
Greece
Distribution of veterinary medicines
In Greece, all antimicrobial veterinary medicinal products are prescription-only medicines. MAHs or local representatives provide VMPs to wholesalers and retailers. Wholesalers can also provide VMPs to retailers. Only retailers can provide VMPs to the customer with a valid prescription.
Legal basis for the monitoring of sales
The collection of sales data by MAHs is based on the joint ministerial law: ΚΥΑ 282371/16-06-2006.
Data sources
For 2015, the sales data have been obtained from 39 MAHs. Negligible sales from a few MAHs with a very small market share and which do not have local representatives in Greece are not included in the dataset.

Sales of veterinary antimicrobial agents in 30 European countries in 2015Seventh ESVAC report160
Hungary
Distribution of veterinary medicines
In Hungary, all VMPs that contain antimicrobials are prescription-only medicines. All VMPs have to be dispensed through authorised retailers, which are only supplied by authorised wholesalers. Wholesalers are authorised by the National Food Chain Safety Office, and the retailers are authorised by the local government office.
Antimicrobial VMPs can be bought from a wholesaler by other wholesalers, retailers, veterinarians, farmers or feed mills. The route of VMPs must be documented as it must be possible to control the journey of each batch from the manufacturer to the farmer.
According to EU rules, medicated feeds are classified as feed and not as VMPs. They have to be prescribed by veterinarians, and produced by feed mills authorised by the government office. Medicated feeds may be imported into Hungary, but require a prescription by a veterinarian, like other medicated feeds. Importation of medicated feeds is supervised by the office which authorises importers and distributors.
Legal basis for the monitoring of sales
There is no legal basis for mandatory reporting of sales data; monitoring of sales takes place voluntarily.
Data sources
Data are collected from wholesalers in Hungary. These wholesalers only submit data for those products they have sold to veterinarians, feed mills, farmers and retailers, but not to other wholesalers (i.e. there is no double reporting).
Iceland
Distribution of veterinary medicines
In Iceland, all antimicrobial VMPs and almost all other VMPs are prescription-only medicines. They have to be dispensed to animal owners by veterinarians (or used by the veterinarians in their practices), or pharmacies, i.e. veterinarians are allowed to dispense VMPs in the same way as pharmacies. Veterinarians and pharmacies can only purchase VMPs from licensed wholesalers. No medicated feeding stuffs for livestock are produced by feed mills in Iceland.
Legal basis for the monitoring of sales
Wholesalers in Iceland are mandated to provide sales statistics for both human and veterinary medicinal products, as well as for medicated feeding stuffs, to the Icelandic Medicines Agency.
Data sources
The data on sales of the included veterinary antimicrobial agents at package level are provided by wholesalers in Iceland, of which there are only two.
Ireland
Distribution of veterinary medicines
In Ireland, antimicrobial veterinary medicinal products may only be supplied on prescription. The products are supplied to the trade by wholesalers authorised by the Department of Agriculture, Food and the Marine. In accordance with the prescription of the prescribing veterinarian, the prescribed products can be dispensed either by the veterinarian or by a pharmacist. By way of exception to this rule, intramammary antimicrobial substances can also be dispensed by licensed agricultural merchants. Medicated feeds containing antimicrobials are prepared from authorised premixes, again under veterinary prescription. They are incorporated into the feed under a special authorisation granted by the Department of Agriculture, Food and the Marine. The licences for incorporation are granted either to feed mills or to farms that have the appropriate facilities for inclusion. It should be noted that the sale, supply, or possession of any unauthorised veterinary medicine in Ireland is a criminal offence.

Sales of veterinary antimicrobial agents in 30 European countries in 2015Seventh ESVAC report 161
Legal basis for the monitoring of sales
There is currently no legal basis requiring wholesalers to supply data relating to the volume of sales of authorised veterinary medicinal products. However, marketing authorisation holders are obliged to report sales data.
Data sources
Each year, the Health Products Regulatory Authority (HPRA) collects data from veterinary pharmaceutical manufacturers holding current Irish marketing authorisations. These holders are requested by the HPRA to only report sales in Ireland. The HPRA checks the information provided against data collected for previous years. Fluctuations in the data from year to year are followed up with the individual company to guard against data errors. The importation of medicated feed is permitted. However, in practice, given the logistics involved, this is not seen as a major route of supply into the country.
Italy
Distribution of veterinary medicines
In Italy, antimicrobial agents for use in animals are prescription-only medicines. Therefore, their sale to the end-user can only take place upon presentation of a veterinary prescription. The sale of veterinary medicines (including antimicrobial agents) on the Italian territory may take place as in listed below:
Wholesale of veterinary medicines
This type of sale includes all forms of business transaction except sales to the end-user. It can only be done on storage premises authorised for the purpose by the local competent authority.
Wholesale of veterinary medicinal products includes transactions between:
• marketing authorisation holders or their representatives and wholesalers;
• marketing authorisation holders or their representatives and pharmacies;
• wholesalers;
• wholesalers and pharmacies;
• wholesalers and feed mills authorised to produce medicated feeds (premixes for medicated feed).
Direct sale of veterinary medicinal products
Holders of authorised wholesale veterinary medicines storage premises may, as a result of further authorisation by the local competent authority, also make direct sales of such products to breeders, pet owners, veterinarians and veterinary-care facilities. This type of transaction also includes the sale of premixes for medicated feed by wholesalers, pharmacies and manufacturers to farms authorised to produce medicated feed for self-consumption. This sale may take place only in the presence of a pharmacist and, in the case of antimicrobial agents, only under veterinary prescription.
Retail veterinary medicinal products
The retail sale of veterinary medicinal products containing antibiotics can only take place at pharmacies, under veterinary prescription, and only in the presence of a pharmacist.
Farmers, veterinarians, breeding and healthcare facilities may, on request, be authorised by the local competent authority to hold stocks of veterinary medicinal products. Stocks of veterinary drugs, including antibiotics, can only be purchased under veterinary prescription. Farms cannot hold stocks of antibiotics in the form of medicated feed or veterinary drugs administered in feed, water or liquid feed. Only small quantities can be held, not exceeding a treatment period of seven days.
Veterinarians cannot sell veterinary drugs (including antibiotics). When it is required by professional intervention, veterinarians are allowed to deliver open packages of veterinary medicines from their stocks to the breeder or the animal owner to start the therapy. For companion animals, the veterinarian may also deliver unopened packages.

Sales of veterinary antimicrobial agents in 30 European countries in 2015Seventh ESVAC report162
Legal basis for the monitoring of sales
The collection of sales data by pharmaceutical companies is based on the national law 193/2006 (art. 32(3)) transposing EC Directive 2004/28.
Data sources
Sales data are collected from pharmaceutical companies producing or importing VMPs.
Latvia
Distribution of veterinary medicines
In Latvia, all VMPs containing antimicrobial agents are prescription-only medicines. This includes medicated feed manufactured from medicated premixes containing antimicrobial agents. VMPs are distributed through wholesalers to pharmacies, veterinarians and animal owners.
Legal basis for the monitoring of sales
Sales data are collected by the Food and Veterinary Service. This task is mandated by the Law of Pharmacy and the related Regulation of the Cabinet of Ministers.
Data sources
Sales data are collected from all wholesalers in Latvia at package level by the Food and Veterinary Service. The wholesalers are asked to report in detail what medicines are sold, to determine real consumption of VMPs and avoid double reporting or export of VMPs.
Lithuania
Distribution of veterinary medicines
In Lithuania, all VMPs that contain antimicrobial agents are prescription-only medicines. All VMPs have to be dispensed to veterinarians or farmers through wholesalers or pharmacies. Medicated feed is also subject to prescription by a veterinarian.
Legal basis for the monitoring of sales
Wholesalers are obliged to provide information on sales of VMPs to the State Food and Veterinary Service of the Republic of Lithuania, in accordance with national law.
Data sources
Data on sales of antimicrobial VMPs at package level are obtained from wholesalers by the State Food and Veterinary Service of the Republic of Lithuania.
Luxembourg
Distribution of veterinary medicines
In Luxembourg, all veterinary medicinal products (VMPs) containing antimicrobial agents are prescription-only medicines. This includes medicated premixes containing pharmaceutical agents.
VMPs containing antimicrobial agents are distributed through wholesalers to pharmacies or to veterinarians (via pharmacies’ records). Veterinarians are allowed to keep VMPs in stock and to dispense them to the farmer for the treatment of animals in their care.

Sales of veterinary antimicrobial agents in 30 European countries in 2015Seventh ESVAC report 163
Legal basis for the monitoring
Wholesalers, pharmacies, veterinarians and farmers are legally obliged to keep records of all sales. They are legally bound to provide any data or information they are asked for.
Data sources
The data on sales of veterinary antimicrobial agents at package level are obtained from the authorised wholesalers on a yearly basis.
Netherlands
Distribution of veterinary medicines
In the Netherlands, antimicrobial VMPs are available on prescription only. Veterinarians purchase approximately 40 % of their VMPs directly from the manufacturers and approximately 60 % through wholesalers. About 98 % of the total volume of antimicrobial VMPs are dispensed by marketing authorisation holders who are either direct members of the Dutch federation of the veterinary pharmaceutical industry (FIDIN) or represented by members of FIDIN. An estimated 2 % are sold by authorisation holders not associated with FIDIN. Veterinarians sell the products directly to animal owners. Pharmacies dispense only minor quantities of VMPs.
Legal basis for the monitoring of sales
Currently, there is no legal basis for mandatory reporting of sales data; monitoring of sales takes place voluntarily.
Data sources
The sales data are obtained at package level from the MAHs who are (represented by) members of FIDIN. Since sales data are obtained from marketing authorisation holders only, including both their sales to wholesalers and their direct sales to veterinarians, there is no double reporting of wholesalers’ sales.
Norway
Distribution of veterinary medicines
In Norway, all VMPs are prescription-only medicines, and are generally dispensed through pharmacies, which are supplied by drug wholesalers. Veterinarians are not allowed to dispense VMPs except in emergency situations in the field, in which case they have to be sold at cost price. Medicated feeds are not used for food-producing animals except for farmed fish; this is due to the small size of livestock herds compared to those in most other European countries. However, group/flock treatment of livestock with antimicrobial agents is possible, again subject to veterinary prescription, through drinking water or as top dressing on feed.
Legal basis for the monitoring of sales
Wholesalers and feed mills in Norway are mandated to provide sales statistics for both human and veterinary medicinal products, as well as for medicated feedstuffs, to the Norwegian Institute of Public Health (NIPH).
Data sources
Data on the sales of the included veterinary antimicrobial agents at package level are obtained from the NIPH, which collects its data from authorised wholesalers and feed mills (only relevant for aquaculture). To avoid double reporting by including sales among the wholesalers, the wholesalers and feed mills are asked by the NIPH to only report sales to pharmacies and animal owners in Norway.

Sales of veterinary antimicrobial agents in 30 European countries in 2015Seventh ESVAC report164
Poland
Distribution of veterinary medicines
Most VMPs, including antimicrobial VMPs, are prescription-only medicines. VMPs are distributed by wholesalers to veterinarians. Antimicrobial VMPs are available to animal owners only if the veterinarian delivers them. Veterinarians and medicated-feed producers are allowed to buy medicated premixes from wholesalers. However, before purchase, medicated-feed producers need to obtain the district veterinary officer’s confirmation.
Legal basis for the monitoring of sales
In accordance with national pharmaceutical law, wholesalers are obliged to provide data on sales of VMPs.
Data sources
Sales data are collected from wholesalers who deliver VMPs directly to veterinarians. Wholesalers fill in the template with their quarterly sales data.
Portugal
Distribution of veterinary medicines
In Portugal, all VMPs containing antimicrobial agents are prescription-only medicines. This includes medicated premixes containing pharmaceutically active substances, like antimicrobial agents. VMPs containing antimicrobial agents are provided by wholesaler-distributors to retailers of veterinary medicinal products (both human and animal pharmacies), farmers, veterinarians, producers’ organisations, veterinary clinics and hospitals, and feed mills.
Wholesaler-distributors obtain the VMPs from a wholesaler or from the MAH/manufacturer. Antimicrobial VMPs are only available to animal owners/farmers by means of an official veterinary prescription. Veterinarians do not sell VMPs, and they may only charge for those they use for treatment of animals in their care. Premixes are distributed through wholesalers or wholesaler-distributors directly to feed mills. Only farmers are receivers from feed mills. Medicated feeds containing antimicrobial premixes also have to be prescribed by a veterinarian and can only be manufactured by officially authorised feed mills.
Legal basis for the monitoring of sales
The collection of sales data is based on the national law no. 148/2008, dated 29 July (Art. 120), amended and reprinted by national law no. 314/2009, dated 28 October.
Data sources
Data are provided by wholesalers who are authorised to sell veterinary medicinal products containing antibiotics.
Romania
Distribution of veterinary medicines
In Romania, all VMPs containing antimicrobial agents are prescription-only medicines.
Wholesalers must supply medicinal products only to those authorised to provide retail activities or those who are legally allowed to purchase medicinal products from wholesalers. Retail distribution of the veterinary medicinal products is performed only by those authorised to carry out such operations in accordance with the national legislation.
Marketing of veterinary medicinal products is carried out according to the veterinary legislation in force, i.e. only through veterinary pharmaceutical establishments which are authorised by the National Sanitary Veterinary and Food Safety Directorate.

Sales of veterinary antimicrobial agents in 30 European countries in 2015Seventh ESVAC report 165
Legal basis for the monitoring of sales
The collection of sales data is based on the national law on veterinary activities - Order of the National Sanitary Veterinary and Food Safety President - promulgated in the Official Monitor from 15 October 2015.
The MAHs are obliged to report the sales of the antimicrobials each year before 15 March, and to deliver these records to the Institute for Control of Biological Products and Veterinary Medicines, which reports the data to the ESVAC.
Data sources
For 2014, the sales data were collected from 37 wholesalers and those 11 MAHs, which distributed their own products. The data include the sales to veterinarians, farmers and pharmacies. From 2015, according to the updated veterinary law, the sales are collected from MAHs only.
Slovakia
Distribution of veterinary medicines
In Slovakia, all VMPs containing antimicrobial agents are prescription-only medicines. This includes medicated feeding stuffs manufactured from medicated premixes containing antimicrobial agents. There are four categories of receiver of antimicrobial VMPs from wholesalers to wholesalers (when selling to each other), veterinarians, pharmacies and feed mills, while from feed mills, farmers and wholesalers (very seldom) are receivers. Medicated feed has to be prescribed by veterinarians and produced by feed mills authorised by the Institute for State Control of Veterinary Biologicals and Medicaments.
Legal basis for the monitoring of sales
The collection of import data is based on a national law on pharmaceuticals, Act No. 362/2011 Coll.
Data sources
For 2011 and 2012, import data were collected from all wholesalers licensed in the Slovak Republic; from 2013, data represent sales from wholesalers to end-users.
Brief description of data collection
Wholesalers send their quarterly import data (number of packs, name of the product, batch number, etc.) and manufacturers send their monthly production data to the Institute for State Control of Veterinary Biologicals and Medicaments.
Slovenia
Distribution of veterinary medicines
In accordance with applicable legislation, antimicrobial VMPs are dispensed in the Republic of Slovenia on the basis of a veterinary prescription only. Wholesalers deliver antimicrobial VMPs to retailers, i.e. pharmacies and veterinary organisations, and to approved medicated-feed mills.
Legal basis for the monitoring of sales
Wholesalers are required by law to report to the competent authority on the turnover (sales) of all medicinal products.
Data sources
Data on sales of veterinary antimicrobial agents at package level were obtained from the wholesalers.
Sales of veterinary antimicrobial agents in 30 European countries in 2015Seventh ESVAC report166
Spain
Distribution of veterinary medicines
In Spain, all VMPs that contain antimicrobials are prescription-only medicines, so they can only be dispensed under veterinary prescription. All suppliers to final users of VMPs (wholesalers, retailers, pharmacies and farmers’ co-operatives) are authorised according to national law and have a mandatory pharmacist control service. Dispensing is most frequently done by retailers. Veterinarians in Spain are allowed to use VMPs in their daily practice, but they cannot sell VMPs to animal owners.
Medicated feeds containing antimicrobial premixes also have to be prescribed by a veterinarian, and can only be manufactured by feed mills authorised by regional competent authorities according to the specific legislation and to the feed hygiene regulation (Hazard Analysis and Critical Control Point principles).
Legal basis for the monitoring of sales
There is a legal basis for mandatory reporting of sales data from the distributors of such products, while monitoring of sales from the MAHs takes place voluntarily.
Data sources
The sales data are collected from MAHs at package level by the Spanish Agency for Veterinary Medicinal Products (AEMPS), in collaboration with the Spanish veterinary medicine industry association (Veterindustria) and the Spanish business association of additives and premixes for animal health and nutrition (Adiprem).
Sweden
Distribution of veterinary medicines
In Sweden, antimicrobial VMPs may only be sold on prescription. VMPs have to be dispensed through pharmacies, which are supplied by drug wholesalers or MAHs. Feed mills may only mix antimicrobial VMPs in feed if they are controlled and authorised by the Swedish Board of Agriculture. Sales of medicated feed to farmers are only allowed on prescription (i.e. the farmer presents the prescription to the feed mill). Mixing of antimicrobials in feed may also take place on farms, providing the Swedish Board of Agriculture has controlled and authorised the establishment for this purpose. In such cases, the premix is purchased on prescription and dispensed by a pharmacy.
Legal basis for the monitoring of sales
All pharmacies in Sweden are required to provide sales statistics on a daily basis to a central database. Until and including 2013, this was an infrastructure company owned by the state, Apotekens Service AB. From 1 January 2014, all activities within that company have been transferred to the Swedish eHealth Agency. All feed mills and farms authorised to mix medicated feed are requested to report their purchases and sales on a yearly basis to the Swedish Board of Agriculture.
Data sources
Pharmacy data on dispensation of prescriptions to animal owners or requisitions by a veterinarian (e.g. sales from pharmacies to animal owners or to veterinarians for use in practice) at package level have been obtained from Apotekens Service AB/the Swedish eHealth Agency.

Sales of veterinary antimicrobial agents in 30 European countries in 2015Seventh ESVAC report 167
Switzerland
Distribution of veterinary medicines
In Switzerland, all VMPs are prescription-only medicines, and have to be dispensed by either the treating veterinarian or a pharmacy. Medicated feeds for livestock (terrestrial animals) are either produced in feed mills using authorised premixes, or incorporated on-site following prescription and dispensing by veterinarians. Group treatment of livestock with antimicrobial agents is possible, subject to veterinary prescription and supervision, through medicated feed, drinking water or as top dressing.
Legal basis for the monitoring of sales
The legal basis for data collection is Art. 35 of the Federal Ordinance on Veterinary Medicines, enacted in September 2004. Art. 36 requests the Federal Office of Food Safety and Veterinary Affairs to “specifically establish a statistic about usage of veterinary antimicrobials for the purpose of monitoring resistances”. Sales of veterinary antimicrobials are published yearly in the ARCH-VET report31, covering sales and resistances to veterinary antimicrobials. Note that figures published in the national ARCH-VET report differ from figures in the present report since all ATCvet groups are included in the national report.
Data sources
Data are obtained at package level from the MAHs. They are requested by the Swiss Agency for Therapeutic Products (Swissmedic) and processed and analysed by the Federal Office of Food Safety and Veterinary Affairs.
Data coverage
Coverage is assumed to be nearly 100 % for the sales of authorised antimicrobial agents. No prescription figures are currently available at national level, meaning that sales figures cannot be further validated. Veterinarians may import VMPs for companion and food-producing animals, including products containing antimicrobial agents, based on a single authorisation valid for one year and delivered by Swissmedic. As these products are not sold by marketing authorisation holders or wholesalers in Switzerland, and since these single authorisations are not delivered for a defined quantity, these products cannot be monitored and are therefore not included in the statistics.
United Kingdom
Distribution of veterinary medicines
In the United Kingdom, antimicrobial veterinary medicinal products may only be supplied on prescription. The products can be dispensed either by the veterinarian or by a veterinary pharmacist and, in turn, can only be supplied by a wholesale dealer authorised by the United Kingdom Veterinary Medicines Directorate. Medicated feeds have to be prescribed by veterinarians, and manufactured either by authorised feed mills or by authorised farms. Medicated feeds are used primarily for pig and poultry production.
Legal basis for the monitoring of sales
Manufacturers are legally required to supply data relating to the volume of sales of authorised veterinary medicinal products at the request of the Veterinary Medicines Directorate.
Data sources
The United Kingdom Veterinary Medicines Directorate collects data from those veterinary pharmaceutical manufacturers that hold current United Kingdom marketing authorisations.
31 ARCH-VET report 2015 (in German only): https://www.blv.admin.ch/dam/blv/de/dokumente/tiere/tierkrankheiten-und-arzneimittel/tierarzneimittel/arch-vet-kurzversion.pdf.download.pdf/arch-vet-kurzversion.pdf

Sales of veterinary antimicrobial agents in 30 European countries in 2015Seventh ESVAC report168
Annex 7. References to national reportsAustria. European Surveillance of Veterinary Antimicrobial Consumption (ESVAC) — the Austrian Results. Resistenzbericht Österreich — AURES 2015 (https://www.ages.at/download/0/0/6cda1df8e6c0989678c50354d2b6654ee9fcd238/fileadmin/AGES2015/Themen/Arzneimittel_Medizinprodukte_Dateien/AURES/aures_2015.pdf, pp.285-291, in German).
Belgium. Belgian Veterinary Surveillance of Antimicrobial Consumption. National Consumption Report 2015 (http://www.fagg-afmps.be/nl/DIERGENEESKUNDIG_gebruik/geneesmiddelen/geneesmiddelen/goed_gebruik/Antibiotica_0).
Czech Republic. Spotřeba antibiotik ve veterinární medicíně v ČR (www.uskvbl.cz/cs/informace/tiskove-centrum/tiskprohl, in Czech).
Cyprus. Sales of veterinary antimicrobial products in Cyprus (http://www.moa.gov.cy/moa/vs/vs.nsf/All/8F96A980392828A3C2257F47003865E9?OpenDocument).
Denmark. DANMAP 2015. Use of antimicrobial agents and occurrence of antimicrobial resistance in bacteria from food animals, food and humans in Denmark. ISSN 1600-2032 (www.danmap.org).
Finland. FINRES-Vet 2010-2012. Finnish Veterinary Antimicrobial Resistance Monitoring and Consumption of Antimicrobial Agents, Evira publications 2/2015 (http://www.evira.fi/portal/en/about+evira/publications/?a=view&productId=412).
France. Moulin, G., Chevance, A., Meheust, D., 2016. Sales Survey of Veterinary Medicinal Products Containing Antimicrobials in France — 2015, October 2016, Anses-ANMV, Fougères (https://www.anses.fr/en/system/files/ANMV-Ra-Antibiotiques2015EN.pdf).
Germany. Wallmann, J., Reimer, I., Heberer, T., Abgabemengenerfassung antimikrobiell wirksamer Stoffe in Deutschland 2015 (Sales data of antimicrobial substances in Germany in 2014), Deutsches Tierärzteblatt November 2016 (http://www.bundestieraerztekammer.de/index_dtbl_presse_details_gs.php?X=20161208100930, in German).
Iceland. Sýklalyfjanotkun og sýklalyfjanæmi baktería í mönnum og dýrum á Íslandi 2015. (http://www.landlaeknir.is/servlet/file/store93/item30672/Syklalyf_Notkun%20og%20n%C3%A6mi%20Skyrsla%202015_loka.pdf).
Ireland. Health Products Regulatory Authority, 2016. Report on consumption of veterinary antibiotics in Ireland during 2015 (http://www.hpra.ie/docs/default-source/default-document-library/report-on-consumption-of-veterinary-antibiotics-in-ireland-during-20159e69072697826eee9b55ff00008c97d0.pdf?sfvrsn=0).
Netherlands. Monitoring of Antimicrobial Resistance and Antibiotic Usage in Animals in the Netherlands in 2016, NETHMAP-MARAN 2017 (http://www.wur.nl/nl/Expertises-Dienstverlening/Onderzoeksinstituten/Bioveterinary-Research/Publicaties/MARAN-Rapporten.htm).

Sales of veterinary antimicrobial agents in 30 European countries in 2015Seventh ESVAC report 169
Netherlands. SDa, Veterinary Medicines Authority, Usage of antibiotics in agricultural livestock in the Netherlands in 2015 (http://www.autoriteitdiergeneesmiddelen.nl/en/publications).
Norway. NORM/NORM-VET, 2016. Usage of Antimicrobial Agents and Occurrence of Antimicrobial Resistance in Norway. ISSN 1502-2307 (http://www.vetinst.no/overvaking/antibiotikaresistens-norm-vet).
Poland. Chief Veterinary Inspectorate. Dane dotyczące sprzedaży produktów leczniczych weterynaryjnych przeciwbakteryjnych w Polsce (http://www.wetgiw.gov.pl/produkty-lecznicze-weterynaryjne, in Polish).
Romania. Raport privind consumul de produse medicinale veterinare antimicrobiene in Romania (http://www.icbmv.ro/ro/informatii-utile/raport-privind-consumul-de-produse-medicinale-veterinare-antimicrobiene).
Spain. News of veterinary medicines (http://www.aemps.gob.es/informa/notasInformativas/medicamentosVeterinarios/home.htm).
Sweden. SWEDRES-SVARM 2015. Use of antimicrobials and occurrence of antimicrobial resistance in Sweden. Solna/Uppsala ISSN 1650-6332 (www.sva.se/en/Antibiotika/SVARM-reports/).
Switzerland. ARCH-VET 2015: Kurzversion: Bericht über den Vertrieb von Antibiotika in der Veterinärmedizin und das Antibiotikaresistenzmonitoring bei Nutztieren in der Schweiz. (short version in German language only) (https://www.blv.admin.ch/dam/blv/de/dokumente/tiere/tierkrankheiten-und-arzneimittel/tierarzneimittel/arch-vet-kurzversion.pdf.download.pdf/arch-vet-kurzversion.pdf).
United Kingdom. VMD 2016. UK Veterinary Antimicrobial Resistance and Sales Surveillance (UK-VARSS) 2015 (https://www.gov.uk/government/publications/veterinary-antimicrobial-resistance-and-sales-surveillance-2015).

Sales of veterinary antimicrobial agents in 30 European countries in 2015Seventh ESVAC report170
Annex 8. Country and affiliation of the ESVAC national contact points/ alternates
Table A17. List of ESVAC national contact points/alternates 2017
Country Name and affiliation
Austria Klemens FuchsAustrian Agency for Health and Food SafetyBetriebsstätte GrazZinzendorfgasse 27/18010 GrazAUSTRIAE-mail: [email protected]
Reinhard Fuchs (Alternate)Austrian Agency for Health and Food SafetyBetriebsstätte GrazZinzendorfgasse 27/18010 GrazAUSTRIAE-mail: [email protected]
Belgium Bart HoetFederaal Agentschap voor Geneesmiddelen en Gezondheidsproducten – Agence Fédérale des Médicaments et des Produits de SantéBâtiment Eurostation, bloc 2place Victor Horta 40 / 40B-1060 Brussel - BruxellesBELGIUME-mail: [email protected]
Dries Minne (Alternate)Federaal Agentschap voor Geneesmiddelen en Gezondheidsproducten – Agence Fédérale des Médicaments et des Produits de SantéEurostation gebouw, blok 2Victor Hortaplein 40 / 40B-1060 Brussel - BruxellesBELGIUME-mail: [email protected]
Bulgaria Ivaylo IvanovBulgarian Food Safety AgencyБългарска агенция по безопасност на храните Directorate for control of veterinary medicinal productsShose Bankya 7 1331 SofiaBulgariaE-Mail: [email protected]
Antonio Radoev (Alternate)Bulgarian Food Safety AgencyБългарска агенция по безопасност на храните Directorate for control of veterinary medicinal productsShose Bankya 7 1331 SofiaBulgariaE-mail: [email protected]

Sales of veterinary antimicrobial agents in 30 European countries in 2015Seventh ESVAC report 171
Country Name and affiliation
Croatia Ana-Marija TurčićService for VMP, feed and animal by productsMinistarstvo PoljoprivredeUprava za veterinarstvo i sigurnost hranePlaninska ulica 2a10000 ZagrebCROATIAEmail: [email protected]
Bernard Jendrašinkin (Alternate)Service for VMP, feed and animal by productsMinistarstvo PoljoprivredeUprava za veterinarstvo i sigurnost hranePlaninska ulica 2a10000 ZagrebCROATIAE-mail: [email protected]
Cyprus Marios GenakritisVeterinary Services1417 AthalassaNicosiaCYPRUSE-mail: [email protected]
Czech Republic Lucie PokludováÚstav pro státní kontrolu veterinárních biopreparátů a léčivHudcova 56a621 00 Brno - MedlánkyCZECH REPUBLICE-mail: [email protected]
Jana Wojtylová (Alternate)Ústav pro státní kontrolu veterinárních biopreparátů a léčivHudcova 56a621 00 Brno – MedlánkyCZECH REPUBLICE-mail: [email protected]
Denmark Laura Mie Jensen Danish Veterinary and Food AdministrationStationsparken 31-332600 GlostrupDENMARKE-mail: [email protected]
Estonia Marju SammulState Agency of Medicines1, Nooruse Street50411 TartuESTONIAE-mail: [email protected]
Finland Katariina Kivilahti-MäntyläFinnish Medicines AgencyMannerheimintie 103B00280 HelsinkiFINLANDE-mail: [email protected]

Sales of veterinary antimicrobial agents in 30 European countries in 2015Seventh ESVAC report172
Country Name and affiliation
France Gérard Moulin8 rue Claude Bourgelat, Parc d’activité de la Grande MarcheCS 70611 Javené, F-35306 Fougères CedexFRANCEE-mail: [email protected]
Claire Chauvin (Alternate)Agence Nationale de Sécurité Sanitaire de l’alimentationAnses - Laboratoire de Ploufragan-PlouzanéUnité d’épidémiologieBP 53 - 22440 PloufraganFRANCEE-mail: [email protected]
Germany Inke Reimer Bundesamt für Verbraucherschutz und LebensmittelsicherheitMauerstraße 39-4210117 BerlinGERMANYE-mail: [email protected]
Jürgen Wallmann (Alternate)Bundesamt für Verbraucherschutz und LebensmittelsicherheitMauerstraße 39-4210117 BerlinGERMANYE-mail: [email protected]
Greece Farlopoulos Spyridon EOF, Greek National Organization for MedicinesVeterinary Medicines Assessment Section284, Mesogeion Ave. 155 62 Cholargos, Athens GREECEE-mail: [email protected]
Ioannis Malemis (Alternate)EOF, Greek National Organization for MedicinesVeterinary Medicines Assessment Section284, Mesogeion Ave. 155 62 Cholargos, AthensGREECEE-Mail: [email protected]
Hungary Edit Nagy Nemzeti Élelmiszerlánc-biztonsági Hivatal Állatgyógyászati Termékek IgazgatóságaSzállás utca 81107 BudapestHUNGARYE-mail: [email protected]
Ernő Horváth (Alternate)Nemzeti Élelmiszerlánc-biztonsági Hivatal Állatgyógyászati Termékek IgazgatóságaSzállás utca 81107 BudapestHUNGARYE-mail: [email protected]

Sales of veterinary antimicrobial agents in 30 European countries in 2015Seventh ESVAC report 173
Country Name and affiliation
Iceland Jóhann M. LenharðssonLyfjastofnunVínlandsleið 14IS-113 ReykjavíkICELANDE-mail: [email protected]
Ireland Jeremiah Gabriel BeechinorAn tÚdarás Rialála Táirgí SláinteKevin O’Malley HouseThe Earlsfort CentreEarlsfort TerraceDublin 2IRELANDE-mail: [email protected]
Gavin Ryan (Alternate)An tÚdarás Rialála Táirgí SláinteKevin O’Malley HouseThe Earlsfort CentreEarlsfort TerraceDublin 2IRELANDE-mail: [email protected]
Italy Loredana CandelaMinistero della SaluteDirezione generale della sanità animale e dei farmaci veterinariViale Giorgio Ribotta, 500144 RomaITALYE-mail: [email protected]
Latvia Inese PereverteņaPārtikas un Veterinārais DienestsPeldu iela 30LV-1050 RīgaLATVIAE-mail: [email protected]
Lithuania Sigitas SiriukaitisAnimal Health and Welfare DepartmentValstybinė maisto ir veterinarijos tarnybaSiesiku str. 19LT-07170 VilniusLITHUANIAE-mail: [email protected]
Luxembourg Marcel BruchMinistère de la Santé - Direction de la SantéAllée MarconiL-2120LUXEMBOURGE-mail: [email protected]
Netherlands Bart van den AssumMinistry of Economic AffairsDirectorate-General for Agro and NaturePostbus 204012500 EK Den HaagTHE NETHERLANDSE-mail: [email protected]
Inge van Geijlswijk (Alternate)On behalf of the Netherlands Veterinary Medicines Institute (SDa),Faculty of Veterinary Medicine, Utrecht UniversityPO Box 801553508 TD UtrechtThe NetherlandsE-mail: [email protected]

Sales of veterinary antimicrobial agents in 30 European countries in 2015Seventh ESVAC report174
Country Name and affiliation
Norway Kari GraveNorwegian Veterinary InstituteP.O. Box 750, 0106 OsloNORWAYE-mail: [email protected]
Kari Olli Helgesen (Alternate)Norwegian Veterinary InstituteP.O. Box 750, 0106 OsloNORWAYE-mail: [email protected]
Poland Nina PoraMinisterstwo Rolnictwa i Rozwoju Wsiul. Wspólna 3000-930 WarsawPOLANDE-mail: [email protected]
Agnieszka Dobrowolska – until January 2017Ministerstwo Rolnictwa i Rozwoju Wsiul. Wspólna 3000-930 WarsawPOLANDE-mail: [email protected]
Katarzyna Szymanek (Alternate)PAŃSTWOWY INSTYTUT WETERYNARYJNYal. Partyzantow 5724-100 PulawyPOLANDE-mail: [email protected]
Portugal Maria Azevedo Mendes Divisão de Gestão e Autorização de Medicamentos VeterináriosDireção-Geral de Alimentação e VeterináriaCampo Grande, n.º 501700-093 LisboaPORTUGALE-mail: [email protected]
Joao Pedro Duarte de Silva (Alternate) Divisão de Gestão e Autorização de Medicamentos VeterináriosDireção-Geral de Alimentação e VeterináriaCampo Grande, no. 501700-093 LisboaPORTUGALEmail: [email protected]
Romania Camelia VoicuInstitutul pentru Controlul Produselor Biologice si Medicamentelor de Uz Veterinar39 Dudului StreetSector 6060603 BucharestROMANIAE-mail: [email protected]

Sales of veterinary antimicrobial agents in 30 European countries in 2015Seventh ESVAC report 175
Country Name and affiliation
Slovakia Judita HederováInstitute for State Control of Veterinary Biologicals and MedicamentsÚstav štátnej kontroly veterinárnych biopreparátov a liečivBiovetská 34949 01 NitraSLOVAKIAE-mail: [email protected]
Martina Ihnátová (Alternate)Institute for State Control of Veterinary Biologicals and MedicamentsŠtátna veterinárna a potravinová správa Slovenskej republikyBotanick 17842 13 BratislavaSLOVAKIAE-mail: [email protected]
Slovenia Anton SvetlinUprava Republike Slovenije za varno hrano, veterinarstvo in varstvo rastlinAdministration of the Republic of Slovenia for Food Safety, Veterinary Sector and Plant Protection (AFSVSPP)Dunajska 22SI-1000 LjubljanaSLOVENIAE-mail: [email protected]
Spain Cristina Muñoz MaderoSpanish Agency of Medicines and Medical DevicesVeterinary DepartmentParque Empresarial Las MercedesEdificio 8C/Campezo 128022 MadridSPAINE-mail: [email protected]
Maria Concepción Porrero Calonge (Alternate)Spanish Agency of Medicines and Medical DevicesVeterinary DepartmentParque Empresarial Las MercedesEdificio 8C/Campezo 128022 MadridSPAINE-mail: [email protected]
Sweden Kinfe GirmaDepartment for Animal Welfare and Health, Division for International Affairs and Animal Health, Staff UnitSwedish Board of AgricultureSE-551 82 JönköpingSWEDENE-mail: [email protected]
Christina Greko (Alternate)Department of Animal Health and Antimicrobial Strategies, Strama VLStatens Veterinärmedicinska Anstalt, SVA (National Veterinary Institute)SE-751 89 UppsalaSWEDENE-mail: [email protected]

Sales of veterinary antimicrobial agents in 30 European countries in 2015Seventh ESVAC report176
Country Name and affiliation
Switzerland Cedric MüntenerInstitute of veterinary pharmacology and toxicologyWinterthurerstrasse 2608057 ZürichSWITZERLANDE-mail: [email protected]
United Kingdom Kitty HealeyVeterinary Medicines DirectorateWoodham LaneNew Haw, AddlestoneKT15 3LS SurreyUNITED KINGDOME-mail: [email protected]
Stacey Brown (Alternate)Veterinary Medicines DirectorateWoodham LaneNew Haw, AddlestoneKT15 3LS SurreyUNITED KINGDOME-mail: [email protected]

Sales of veterinary antimicrobial agents in 30 European countries in 2015Seventh ESVAC report 177
Annex 9. ESVAC sales advisory expert group members and observers
Table A18. List of ESVAC sales advisory expert group members
Name Address Country
Kari Grave (chair) Norwegian Veterinary InstituteP.O. Box 750, 0106 OsloNORWAYE-mail: [email protected]
Norway
Christina Greko Department of Animal Health and Antimicrobial Strategies, Strama VLStatens Veterinärmedicinska AnstaltSE-751 89 Uppsala SWEDENE-mail: [email protected]
Sweden
Katariina Kivilahti-Mäntylä Finnish Medicines AgencyMannerheimintie 103B00280 HelsinkiFINLANDE-mail: [email protected]
Finland
Gérard Moulin Agence Nationale du Médicament Vétérinaire - Agence Nationale de Sécurité Sanitaire de l’alimentation, de l’environnement et du travail8 rue Claude Bourgelat Parc d’activité de la Grande MarcheCS 70611Javené, F-35306 Fougères CedexFRANCEE-mail: [email protected]
France
Cristina Muñoz Madero Spanish Agency of Medicines and Medical DevicesVeterinary DepartmentParque Empresarial Las MercedesEdificio 8C/Campezo 128022 MadridSPAINE-mail: [email protected]
Spain
Jürgen Wallmann Bundesamt für Verbraucherschutz und LebensmittelsicherheitMauerstraße 39-4210117 BerlinGERMANYE-mail: [email protected]
Germany

Sales of veterinary antimicrobial agents in 30 European countries in 2015Seventh ESVAC report178
Table A19. List of ESVAC sales advisory expert group observers from the European Commission, ECDC and EFSA
Name Address Representing institution
Dean Bosnjak DG SANTE D6 – Medicinal Products – quality, safety and efficacyRue de Mot 241040 BrusselsBELGIUME-mail: [email protected]
European Commission
Klaus Weist European Centre for Disease Prevention and ControlTomtebodavägen 11 A171 83 StockholmSWEDENE-mail: [email protected]
European Centre for Disease Prevention and Control (ECDC)
Pierre-Alexandre Beloeil European Food Safety AuthorityLargo N. Palli 5/AI-43121 ParmaITALYE-mail: [email protected]
European Food Safety Authority (EFSA)


European Medicines Agency
30 Churchill Place Canary Wharf London E14 5EU United Kingdom
Telephone +44 (0)20 3660 6000 Facsimile +44 (0)20 3660 5555 Send a question www.ema.europa.eu/contact
www.ema.europa.eu
Sales of veterinary antimicrobial agents in 30 European countries in 2015Trends from 2010 to 2015Seventh ESVAC reportEMA/184855/2017
TC-AE-17-001-EN-NISBN 978-92-9155-058-6ISSN 2315-1455DOI 10.2809/283486
© European Medicines Agency, 2017. Reproduction is authorised provided the source is acknowledged.