sales and inventory planning with sap apo · suppliers have multiple customers, and most customers...
TRANSCRIPT
Bonn � Boston
Marc Hoppe
Sales and Inventory Planning with SAP® APO
www.sap-press.com

Contents at a Glance
1 Introduction ............................................................ 15
2 Overview of SAP APO ............................................. 21
3 Demand Planning with SAP APO-DP—Basic Principles ................................................... 41
4 Demand Planning with SAP APO-DP—Implementation ................................................... 77
5 Inventory Planning with SAP APO-SNP—Basic Principles ................................................... 199
6 Inventory Planning with SAP APO-SNP—Implementation ................................................... 231
7 SAP APO—Integration and Architecture ................ 383
8 Implementation Process ......................................... 393
A Literature ................................................................ 409
B List of Acronyms ..................................................... 411
C Glossary .................................................................. 415
D The Author .............................................................. 433
www.sap-press.com
9
Contents
1 Introduction ......................................................................... 15
1.1 Definition of Supply Chain Management (SCM) ....................... 151.2 Market Challenges Facing the Supply Chain ............................. 151.3 From Material Requirements Planning (MRP) to
Supply Chain Management ...................................................... 161.4 Planning as a Critical Process ................................................... 191.5 Target Group and Structure of this Book .................................. 19
2 Overview of SAP APO .......................................................... 21
2.1 Requirements of Supply Chain Networks ................................. 212.2 Key Functions of SAP SCM ...................................................... 22
2.2.1 Planning ..................................................................... 232.2.2 Execution .................................................................... 272.2.3 Coordination ............................................................... 292.2.4 Collaboration .............................................................. 29
2.3 Demand Planning (DP) ............................................................ 302.3.1 Multi-Level Planning ................................................... 312.3.2 Forecasts ..................................................................... 312.3.3 Lifecycle Management ................................................ 322.3.4 Promotion Planning .................................................... 33
2.4 Inventory Planning (in Supply Network Planning) .................... 332.4.1 Safety Stock Planning .................................................. 342.4.2 Inventory Planning ...................................................... 342.4.3 Distribution Resource Planning ................................... 36
2.5 Integrated Supply Chain Planning ............................................ 382.6 Summary ................................................................................. 40
3 Demand Planning with SAP APO-DP—Basic Principles ................................................................. 41
3.1 Overview of the Administration of Demand Planning .............. 413.2 Configuring the Administrator Workbench ............................... 43
3.2.1 Overview .................................................................... 433.2.2 InfoObjects and Other Relevant Terms from
SAP NetWeaver BI ...................................................... 453.2.3 InfoCubes ................................................................... 48
www.sap-press.com
Contents
10
3.2.4 Saving Key Figures and Characteristics in the InfoCube ............................................................... 51
3.3 Configuring the S&DP Administrator Workbench ..................... 523.3.1 Overview .................................................................... 523.3.2 Creating the Basic Planning Object Structure ............... 533.3.3 Creating Characteristic Value Combinations ................ 543.3.4 Configuring the Planning Area ..................................... 58
3.4 Planning Books ........................................................................ 643.4.1 Creating Planning Books ............................................. 663.4.2 Assigning Users to a Planning Book ............................. 70
3.5 Advanced Macros .................................................................... 713.6 Summary ................................................................................. 76
4 Demand Planning with SAP APO-DP—Implementation ................................................................ 77
4.1 Creating a Demand Forecast .................................................... 784.1.1 Interactive Demand Planning ...................................... 784.1.2 Carrying Out Demand Planning (Sample Case) ............ 84
4.2 Forecasts ................................................................................. 1034.2.1 Aggregation and Disaggregation ................................. 1034.2.2 Introduction to the Different Forecasting
Techniques ................................................................. 1084.2.3 Quantitative Forecasting Techniques in Detail ............. 112
4.3 Monitoring the Forecast Quality .............................................. 1454.3.1 Introduction ................................................................ 1464.3.2 Forecast Error ............................................................. 1474.3.3 Causal Forecast Errors (MLR) ....................................... 1554.3.4 Forecast Errors in SAP APO—Summary ....................... 1584.3.5 Alert Monitor .............................................................. 159
4.4 Lifecycle Planning .................................................................... 1614.4.1 Introduction ................................................................ 1614.4.2 Like Profiles ................................................................ 1644.4.3 Phase-In/Phase-Out Profiles ........................................ 1654.4.4 Product Interchangeability .......................................... 168
4.5 Promotion Planning ................................................................. 1754.5.1 Overview .................................................................... 1754.5.2 Creating a Promotion .................................................. 1764.5.3 Promotion Base ........................................................... 179
4.6 Collaborative Demand Planning ............................................... 1804.6.1 Overview .................................................................... 180
www.sap-press.com
Contents
11
4.6.2 CLP Architecture and Data Transfer ............................. 1814.6.3 Process Flow for Collaborative Demand Planning ........ 182
4.7 Forecasting with BOMs ........................................................... 1834.7.1 Overview .................................................................... 1834.7.2 Process Flow ............................................................... 184
4.8 Result of the Demand Planning ............................................... 1904.8.1 Transfer to Program Planning in SAP ERP .................... 1914.8.2 Transfer to Supply Network Planning .......................... 1924.8.3 Sample Results ............................................................ 192
4.9 Realignment ............................................................................ 1964.9.1 Areas of Use ................................................................ 1964.9.2 Realignment ............................................................... 1974.9.3 Copying Data .............................................................. 198
4.10 Summary ................................................................................. 198
5 Inventory Planning with SAP APO-SNP—Basic Principles ................................................................. 199
5.1 Supply Network Planning Process ............................................ 2005.2 Configuring the Supply and Demand Planning
Administration Workbench ...................................................... 2035.2.1 Overview .................................................................... 2035.2.2 Master Planning Object Structure ............................... 2045.2.3 Configuring the Planning Area ..................................... 205
5.3 Planning Books ........................................................................ 2075.3.1 Standard Planning Books ............................................. 2075.3.2 Individual Planning Books ........................................... 208
5.4 Advanced Macros .................................................................... 2085.5 SNP Master Data ..................................................................... 209
5.5.1 Locations .................................................................... 2095.5.2 Products ..................................................................... 2105.5.3 Resources ................................................................... 2155.5.4 Production Process Model (PPM) ................................ 2185.5.5 Production Data Structure (PDS) ................................. 2225.5.6 Transportation Lanes ................................................... 2235.5.7 Master Data for Hierarchical Planning ......................... 2275.5.8 Setting Up the SCM Model ......................................... 229
5.6 Summary ................................................................................. 230
www.sap-press.com
Contents
12
6 Inventory Planning with SAP APO-SNP—Implementation ................................................................ 231
6.1 Desktop for Interactive SNP Planning ...................................... 2316.1.1 Selection Area ............................................................. 2326.1.2 Work Area .................................................................. 234
6.2 Planning Method: Heuristic-Based Planning ............................. 2356.2.1 Operation of the Heuristic Run ................................... 2356.2.2 Heuristic Profiles ......................................................... 2376.2.3 Capacity Leveling ........................................................ 2386.2.4 Sample SNP Heuristic Planning with
Capacity Leveling ........................................................ 2406.2.5 Procurement Scheduling Agreements in the
Heuristic-Based SNP Planning ..................................... 2446.2.6 Direct Delivery from the Production Plant
to the Customer .......................................................... 2486.3 Planning Method: Optimization in the SNP Planning ............... 249
6.3.1 Introduction to SNP Optimization ............................... 2496.3.2 Processing the Optimization Run ................................ 2556.3.3 Finite Planning with the SNP Optimizer ...................... 2566.3.4 Determining the Supply Source with
the SNP Optimizer ...................................................... 2636.3.5 Lot-Size Planning with the SNP Optimizer ................... 2666.3.6 Inventory Planning ...................................................... 2736.3.7 Optimization Profiles .................................................. 2796.3.8 Executing the Optimizer in the Interactive
Planning (Example) ..................................................... 2816.4 Planning Method: Capable-to-Match (CTM) ............................ 288
6.4.1 Possible Applications of CTM Planning ........................ 2886.4.2 CTM Planning Process ................................................. 2906.4.3 Settings for the CTM Planning ..................................... 2916.4.4 Planning Algorithm ..................................................... 302
6.5 Analyzing Planning Results ...................................................... 3056.5.1 Technical Aspects of the CTM Planning Run ................ 3066.5.2 Evaluating the CTM Planning Results .......................... 307
6.6 Comparing the Planning Methods ............................................ 3096.7 Safety Stock Planning ............................................................... 311
6.7.1 Simple and Enhanced Safety Stock Methods ............... 3146.7.2 Standard Safety Stock Planning in SAP APO ................ 3156.7.3 Enhanced Safety Stock Planning in SAP APO ............... 3226.7.4 Conclusion .................................................................. 335
www.sap-press.com
Contents
13
6.8 Deployment/Replenishment .................................................... 3366.8.1 Deployment Heuristic ................................................. 3366.8.2 Real-Time Deployment ............................................... 3446.8.3 Deployment Optimization ........................................... 344
6.9 Transport Load Builder (TLB) ................................................... 3546.9.1 Grouping Transport Loads Using TLB ........................... 3556.9.2 Procedure for Remaining Quantities ............................ 3566.9.3 Setting Up the Master Data for TLB ............................. 357
6.10 Aggregated SNP Planning ........................................................ 3656.10.1 Prerequisites for Aggregated Planning ......................... 3656.10.2 Aggregated Safety Stock Planning ............................... 3676.10.3 Single-Level Assignment of Receipts and
Requirements .............................................................. 3686.10.4 SNP Disaggregation .................................................... 3696.10.5 SNP Aggregation ......................................................... 373
6.11 Product Interchangeability in SNP Planning ............................. 3766.11.1 Discontinuation of Products ........................................ 3776.11.2 Supersession Chain ..................................................... 3776.11.3 Form-Fit-Function Class (FFF Class) ............................. 3786.11.4 Special Features When Using the SNP Optimizer ......... 378
6.12 Transferring SNP Planning Results ............................................ 3796.12.1 Releasing SNP Planning to Demand Planning .............. 3796.12.2 Converting SNP Orders for Production Planning
and Procurement into PP/DS Orders ........................... 3796.13 Summary ................................................................................. 381
7 SAP APO—Integration and Architecture ............................. 383
7.1 Integration with ERP Systems .................................................. 3837.1.1 Plug-In (PI) ................................................................. 3857.1.2 Core Interface (CIF) ..................................................... 3867.1.3 Business Application Programming Interface (BAPI) .... 388
7.2 Integration with SAP NetWeaver BI ......................................... 3897.3 Architecture and System Landscape ......................................... 390
7.3.1 SAP Quick Sizer .......................................................... 3907.3.2 SAP liveCache ............................................................. 390
7.4 Summary ................................................................................. 391
8 Implementation Process ...................................................... 393
8.1 Project Methodology ............................................................... 3938.1.1 Project Preparation ..................................................... 394
www.sap-press.com
Contents
14
8.1.2 Business Blueprint ....................................................... 3948.1.3 Realization .................................................................. 3978.1.4 Final Preparation ......................................................... 3988.1.5 Go Live & Support ....................................................... 398
8.2 SAP Solution Manager ............................................................. 3988.3 Project Organization ................................................................ 401
8.3.1 Project Management ................................................... 4018.3.2 Steering Committee .................................................... 4028.3.3 Project Core Team ...................................................... 4028.3.4 Business Process Owner .............................................. 4038.3.5 Key Users .................................................................... 4038.3.6 Data Processing Team ................................................. 404
8.4 Summary ................................................................................. 405
Appendix .................................................................................... 407
A Literature ........................................................................................... 409B List of Acronyms ................................................................................ 411C Glossary ............................................................................................. 415D The Author ........................................................................................ 433
Index ......................................................................................................... 435
www.sap-press.com
15
Optimized supply chain management enables you to react flexibly and quickly on a global level to ever-changing market requirements. This chapter outlines the challenges and their solutions from the planning viewpoint, and also describes the structure of this book.
1 Introduction
1.1 Definition of Supply Chain Management (SCM)
The term supply chain management (SCM) refers to the inter-enterprise pro-cess of coordinating the flows of material and information along the entirelogistics chain (or supply chain), throughout the entire value creation pro-cess. The objective of SCM is to structure the whole process—from rawmaterials acquisition to end-customer sales—in a manner that optimizes timeand money. It ultimately involves intensified cooperation between all theparties involved in a supplier-customer relationship. The structure of thiskind of relationship is usually more complex than a supply chain, as mostsuppliers have multiple customers, and most customers have multiple sup-pliers. Therefore, the term supply networks is also used. Nevertheless, infor-mation-processing systems are required to manage this level of complexity.
1.2 Market Challenges Facing the Supply Chain
As you know, economic and technological environments are continuallychanging. The current pace of change in the economy and enterprises has itsroots in the ongoing process of globalization, the speed of development ofinformation and communications technologies, and intensifying customerrequirements.
These constant pressures are forcing enterprises to forge new paths: optimiz-ing the whole value creation process throughout the enterprise, reducingproduct lifecycles, and expanding their range of products. Increasingly,enterprises see themselves as using their specific core competencies todevelop new services on an ongoing basis to create optimal customer bene-fit, instead of belonging to one specific industry.
www.sap-press.com
Introduction1
16
In light of this trend, it is important for enterprises to be flexible and to beable to adapt internal company business processes to changing market con-ditions. At the same time, most innovations and new services cannot be cre-ated without integration and cooperation with business partners. Therefore,enterprises have to structure their supply chains in a global and flexible man-ner.
One business that reflects this kind of global and flexible supply chain per-fectly is the international automobile production industry. This industry isbased on a division of labor, and so, companies in different countries acquireparts from suppliers in their own country, and assemble these parts to formsubassemblies or full assembly groups. These assemblies are then sent to oneglobal location, where they are used to build the end product. This processrequires that an incredibly high number of variants, suppliers, productionprocesses, and procurement processes be coordinated and integrated. More-over, this complex structure has to be able to react quickly to new marketrequirements, quality problems, and other external factors. This is just oneof the many challenges that face enterprises today.
The primary goal of this supply chain (i.e., SCM) is to arrive at a global opti-mum. Ideally, this optimum maximizes the benefit to the customer in termsof price, service, and so on, while minimizing the costs to the enterprise.
There are still serious inefficiencies along the entire supply chain, especiallywithin the interfaces between enterprises and departments. The biggest ofthese inefficiencies is the total duration of the manufacturing process,known as the throughput time. Ninety percent of this time is consumed bystorage and transport. Another negative influence on cost is the so-calledbullwhip effect, which refers to the element of uncertainty in demand fore-casts that increases dramatically from one interface to the next when fore-casts are managed separately for each enterprise or department. This uncer-tainty about expected sales incurs increased costs, due to the need tomaintain safety stocks, delivery delays, poor capacity usage, and so on.
1.3 From Material Requirements Planning (MRP) to Supply Chain Management
The optimization potentials described in the previous section can beunlocked with a new information structure that enables the enterprise tomake and implement enterprise-level decisions in real time. However, the
www.sap-press.com
From Material Requirements Planning (MRP) to Supply Chain Management 1.3
17
ERP systems that are most commonly used today are suitable for mappingthese kinds of processes. This is where new technological solutions like SAPSCM come into play.
The first generation of material requirements planning (MRP) systems calcu-lated material requirements by exploding the relevant bills of material(BOM) using the bill of material processor for MRP. This approach plannedquantities and deadlines only. There was no resource allocation as such, andorder processing was either nonexistent or only partially existent.
In most cases, independent, individual plans were created at each separate,unsynchronized level of planning and execution. The individual planningsteps were carried out sequentially; that is, demand planning, followed byMRP, and then capacity requirements planning. Not only did this lead tolong processing times in the planning stage, it also meant that contradictorygoals existed concurrently, which made a unified and consultative approachto planning impossible. While the main goal of Production was to leveragecapacities, the Sales department focused on ensuring deliverability by main-taining stocks. Often, procurement or production orders that had alreadybeen placed were postponed by shop floor control staff in the last planningstage, in order to optimize the operation sequence of the orders in accor-dance with production criteria. From this, we can discern that availablecapacities were taken into account very late in the production process, andall prior planning steps were based on limitless production capacities. Exactplanning and production data from external suppliers and partners was like-wise absent from the planning process.
Additional production resources were subsequently included in the planningphase with the extension of the MRP concept that is known as MRP II. Asbefore, MRP was an important part of the approach, but now, this step wasfollowed by other, sequentially executed steps such as capacity requirementsplanning and scheduling. Besides customer requirements, the anonymousplanned independent requirements created in a production program werenow also considered in calculating independent requirements. Cross-plantrequirements planning and distribution planning were executed in otherplanning systems. It must be noted, however, that the MRP II planning con-cept has the following disadvantages:
� Long planning duration, because the planning steps are executed sequen-tially.
� Long planning cycles mean that planning results are out of date.
www.sap-press.com
Introduction1
18
� Static throughput times increase the overall throughput time and lead tothoughput time syndrome.
� Planning and scheduling is based on unlimited resource availability.
� Poor capacity utilization, resulting in no sensible way of resolving bottle-necks.
� Special production principles (such as workshop production) are not prop-erly supported.
Although the MRP II planning concept has been extended to include controlstations, third-party advanced planning and scheduling (APS) systems, andconcepts such as load-oriented order release, these new developments havenot solved its structural planning problems. The disadvantages outlinedabove have therefore led to the emergence of a new generation of planningsystems, known as supply chain management (SCM) systems. The concept ofSCM is to process information and make it available in real time, and to usethe Internet for information exchange.
The potential for success of SCM and SCM planning is based on the planningdeficits of the production planning and control (PPC) and MRP II concepts.These deficits created a demand for certain functions, the most important ofwhich are as follows:
� Cross-plant planning, including supplier and customer plants
� Simultaneous material and capacity requirements planning, i.e., capacityrestrictions should be considered simultaneously rather than sequentially
� Extended planning functions with optimization tools for better capacityutilization, especially in bottlenecks
� Aggregation option for hierarchical planning
SAP responded to these demands by developing SAP Supply Chain Manage-ment (SAP SCM). With its component SAP Advanced Planner and Optimizer(SAP APO), SAP SCM is a complete advanced planning and scheduling (APS)system that facilitates simultaneous material and capacity requirements plan-ning, and provides genuine optimization functions. Another of its benefits isthat it enables close real-time integration with the back-end system, SAPEnterprise Resource Planning (SAP ERP).
www.sap-press.com
Target Group and Structure of this Book 1.5
19
1.4 Planning as a Critical Process
This book deals in detail with one of the critical processes of the complexworld of supply chains: planning.
The planning phase is the one in which fundamental decisions are madeabout how and with what materials the challenges described in Section 1.2are to be tackled and solved. While planning will never be an exact science,as it usually deals with assumptions about the future, it still makes sense tooptimize it as much as possible, as the quality of the execution depends onthe quality of the planning. The better the planning, the better the executionphase can react to ever-changing requirements. Also, the more reliable datathere is about the future, the smaller the uncertainty factor.
A concept known as rolling planning is one answer to this need. Rolling plan-ning is a generic instrument that is used in almost all planning processes andon almost all planning levels. When it is used, the planning process isrepeated either at specific time intervals or when major data changes aremade. The result is that there is always a plan that contains the most up-to-date information, which means that scenarios can be simulated and decisionscan be made in advance. Because planning is repeated on an ongoing basis,the future is approached step by step, and new circumstances can thereforebe taken into account with every repetition. The planning horizon (long-term, medium-term, or short-term; see Section 2.2.1) is also used in this pro-cess to anticipate changes in the distant future. If particular circumstancesmake this necessary, within a rolling planning, it is possible to take action ona short time frame.
1.5 Target Group and Structure of this Book
The focus of this book is on processes in demand planning and inventoryplanning. The SAP SCM solution, and its SAP APO component in particular,are used in this book to illustrate these processes and to explain them indetail, with the goal of enabling all parties involved in the planning processesto evaluate and use this planning tool in their own planning processes. Spe-cifically, this book is aimed at department managers, MRP planners, demandplanners, consultants, project leaders, and IT managers who are interested inthe topic.
After this introductory chapter, Chapter 2 briefly describes the SAP SCMsolution and its SAP APO component.
www.sap-press.com
Introduction1
20
Chapter 3 deals with the basics of demand planning with SAP APO-DP(Demand Planning). It describes the technical structure, master data, andcomponents required to execute demand planning with SAP APO.
Chapter 4 describes the actual process of executing demand planning withSAP APO. This chapter explains the forecasting procedure, product lifecycleplanning, promotion planning, and the other planning functions of SAPAPO-DP.
Chapter 5 presents the basics of the SAP APO-SNP (Supply Network Plan-ning) component. Here, you will learn about the settings, master data, andbasic correlations between inventory, procurement, and distribution plan-ning.
Chapter 6 focuses on supply network planning in detail. It deals with plan-ning processes, the main planning procedures, safety stock planning, optimi-zation measures, and final planning for customer delivery.
The technological architecture and other integration issues are described inChapter 7 in the context of the SAP SCM components.
The book concludes with Chapter 8, which provides an overview of the mostimportant activities of implementation projects for the components SAPAPO-DP and SAP APO-SNP.
The appendices include a list of acronyms and a comprehensive glossary.
Marc HoppeHamburg, Germany, March 2007
www.sap-press.com
41
The configuration of demand planning and its planning books deter-mines the manageability, the flexibility, and the performance of demand planning. A well thought-out concept will ultimately save a lot of time and money during implementation. This chapter will show you how to build the optimal technical foundations.
3 Demand Planning with SAP APO-DP—Basic Principles
3.1 Overview of the Administration of Demand Planning
The Demand Planning (DP) component of SAP Advanced Planner and Opti-mizer (SAP APO) is a complex, high-performance, and flexible instrumentthat supports the sales/requirements planning process in your company.User-specific planning layouts and interactive planning books allow not onlythe inclusion of various departments, but also of other companies, in theforecast creation process.
The configuration of demand planning is an important factor for a successfulimplementation of the system. This is performed, as it is also done for theSupply Network Planning component (see Chapter 5, Inventory Planning withSAP APO-SNP—Basic Principles), with the Supply and Demand Planning(S&DP) Administration Workbench.
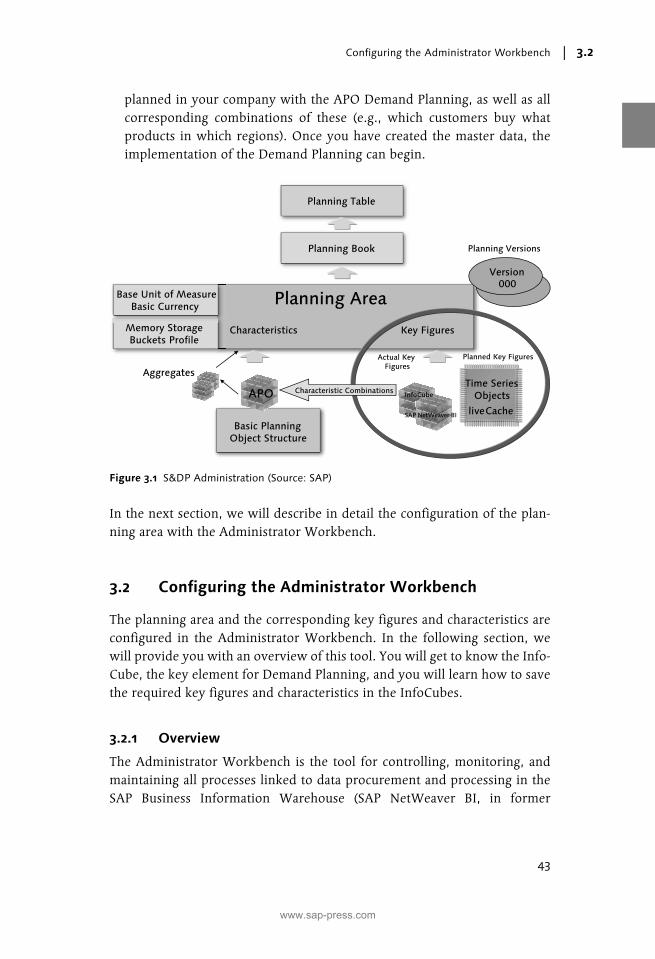
The entire administration of the demand planning component and the com-ponents required for configuring the planning area are summarized in Figure3.1.
First, we will give you a brief overview of the terms detailed in the figure andtheir relationships; then, they will be described in greater detail in the fol-lowing sections.
1. Before you can begin the planning process, you must decide what key fig-ures you want to use for demand planning. Key figures contain data that isshown as a numeric value—either a quantity or a monetary value. Exam-ples of key figures that are used in demand planning are planned demandand historical sales. You can save key figures both in an InfoCube and in
www.sap-press.com
Demand Planning with SAP APO-DP—Basic Principles3
42
the liveCache. You usually save key figures with historical data, that is,actual key figures, in the InfoCube. You save planning key figures in theliveCache. You also save those planning key figures that are to be firmed(i.e., fixed) in the InfoCube.
2. You must then decide what characteristics you want to use as planning lev-els and for selection. A characteristic is a planning object such as a product,location, brand, or region. The master data of the demand planning or thesupply network planning comprise the allowed values of the characteris-tics, known as the characteristic values. Characteristic values are actualnames. For example, the characteristic “Location” can have the valuesHamburg, London, and New York. As part of the administration forDemand Planning (DP) and the Supply Network Planning (short descrip-tion: S&DP Administration), you create a basic planning object structure forthe characteristics that you want to use. A basic planning object structurecontains all plannable characteristics for one or more planning areas. It isthe structure on which all other planning object structures are based. Thecharacteristics can be standard characteristics or those that you have cre-ated in the Administrator Workbench.
3. Once you have determined the key figures and characteristics, you muststore additional information in the planning area. This includes, for exam-ple, the storage buckets profile, in which you determine the periods inwhich data is saved for a given planning area in the Demand Planning orin the Supply Network Planning; or the planning versions, in which differ-ent datasets can be saved for simulation purposes. Furthermore, you mustensure that the base unit of measure and the basic currency are assignedfor the planning area.
4. You have defined the planning area when this information is assigned tothe planning area.
5. You can then create individual user or department planning books. Plan-ning books determine the content and layout of the interactive planningscreen. You can use them to design the planning screen so that it corre-sponds to your planning requirements. A planning folder is based on aplanning area.
6. Finally, you create the master data for Demand Planning (this cannot beseen in Figure 3.1). The master data of the Demand Planning determinesthe levels on which demand plans in your company are created, changed,aggregated, and disaggregated. For instance, your master data can com-prise all products, product families, regions, and customers that are to be
www.sap-press.com
Configuring the Administrator Workbench 3.2
43
planned in your company with the APO Demand Planning, as well as allcorresponding combinations of these (e.g., which customers buy whatproducts in which regions). Once you have created the master data, theimplementation of the Demand Planning can begin.
In the next section, we will describe in detail the configuration of the plan-ning area with the Administrator Workbench.
3.2 Configuring the Administrator Workbench
The planning area and the corresponding key figures and characteristics areconfigured in the Administrator Workbench. In the following section, wewill provide you with an overview of this tool. You will get to know the Info-Cube, the key element for Demand Planning, and you will learn how to savethe required key figures and characteristics in the InfoCubes.
3.2.1 Overview
The Administrator Workbench is the tool for controlling, monitoring, andmaintaining all processes linked to data procurement and processing in theSAP Business Information Warehouse (SAP NetWeaver BI, in former
Figure 3.1 S&DP Administration (Source: SAP)
Planning Book
Planning Area
Basic Planning Object Structure
Planning Table
Characteristics Key Figures
live Cache
Time Series Objects
Memory Storage Buckets Profile
Base Unit of Measure Basic Currency
Characteristic Combinations
Version 000
Actual Key Figures
Planned Key Figures
Aggregates
Planning Versions
SAP NetWeaver BI
InfoCube APO
www.sap-press.com
Demand Planning with SAP APO-DP—Basic Principles3
44
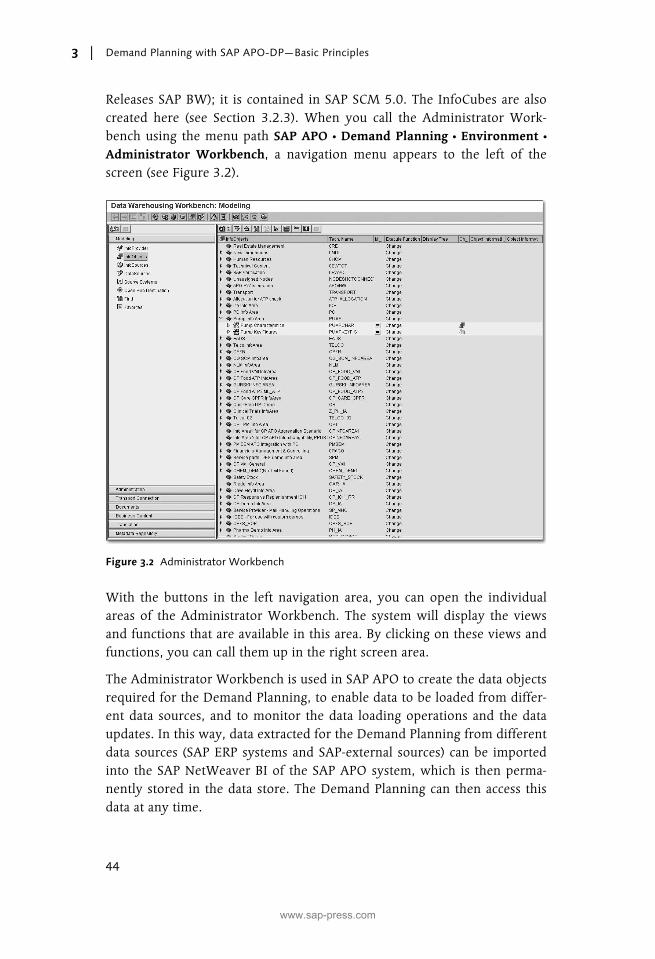
Releases SAP BW); it is contained in SAP SCM 5.0. The InfoCubes are alsocreated here (see Section 3.2.3). When you call the Administrator Work-bench using the menu path SAP APO � Demand Planning � Environment �
Administrator Workbench, a navigation menu appears to the left of thescreen (see Figure 3.2).
With the buttons in the left navigation area, you can open the individualareas of the Administrator Workbench. The system will display the viewsand functions that are available in this area. By clicking on these views andfunctions, you can call them up in the right screen area.
The Administrator Workbench is used in SAP APO to create the data objectsrequired for the Demand Planning, to enable data to be loaded from differ-ent data sources, and to monitor the data loading operations and the dataupdates. In this way, data extracted for the Demand Planning from differentdata sources (SAP ERP systems and SAP-external sources) can be importedinto the SAP NetWeaver BI of the SAP APO system, which is then perma-nently stored in the data store. The Demand Planning can then access thisdata at any time.
Figure 3.2 Administrator Workbench
www.sap-press.com
Configuring the Administrator Workbench 3.2
45
By using the Business Content delivered by SAP, you can dispense with thebulk of the configuration work inherent in a business intelligence (BI) sys-tem, and therefore also for SAP NetWeaver BI in the SAP APO system. TheAdministrator Workbench is used to activate the Business Content deliveredby SAP.
If it becomes necessary to create new SAP NetWeaver BI objects for specificrequirements, this task can be easily executed with the functions of theAdministrator Workbench. This may become necessary if special historicaldata from non-SAP systems is to be used for the Demand Planning. The inte-grated SAP NetWeaver BI component in SAP APO represents an importanttechnical basis for integrating the most varied data sources into SAP APO ina very flexible way.
3.2.2 InfoObjects and Other Relevant Terms from SAP NetWeaver BI
The basic data storage medium in SAP NetWeaver BI1 are the InfoObjects,which are business system evaluation objects (customers, sales, etc.). InfoOb-jects are divided into characteristics, key figures, units, time characteristics,and technical characteristics (such as request numbers, for example). Theymap the information necessary to build data targets in a structured form. Youshould therefore think of InfoObjects as a generic term for key figures andcharacteristics in SAP NetWeaver BI.
SAP NetWeaver BI InfoObjects (beginning with “0”) and APO InfoObjects(beginning with “9A”) are delivered in the standard SAP system. When youcreate your own InfoObjects, you can decide whether you want to createSAP NetWeaver BI or APO InfoObjects. While it is irrelevant whether youcreate SAP NetWeaver BI or APO InfoObjects for characteristics, this is notthe case with key figures (i.e., you should create APO InfoObjects). Other-wise, you won’t be able to fix any values or quantities for this key figure.
The characteristics of an InfoObject are reference objects (keys) whosedimensions generate relationships (e.g., “City” and “Country” are geographicdimensions of “Customer”). Characteristics can carry master data (texts,attributes, and hierarchies) that must be loaded from the source systems.Time characteristics are characteristics that are assigned to the dimension“Time”, so their dependencies are already known, because the time in thesystem is predefined. The technical characteristics of an InfoObject have only
1 See also Egger, Fiechter, Rohlf: SAP BW Data Modeling. SAP PRESS, 2005.
www.sap-press.com
Demand Planning with SAP APO-DP—Basic Principles3
46
an organizational significance within SAP NetWeaver BI. For example, therequest number is taken when requests are loaded, so it helps to find therequest again.
The key figures of an InfoObject form the data component, that is, they returnthe values to be evaluated. These are quantities, amounts, or numbers ofitems. We still require their units of measure, so that these values actually sig-nify something.
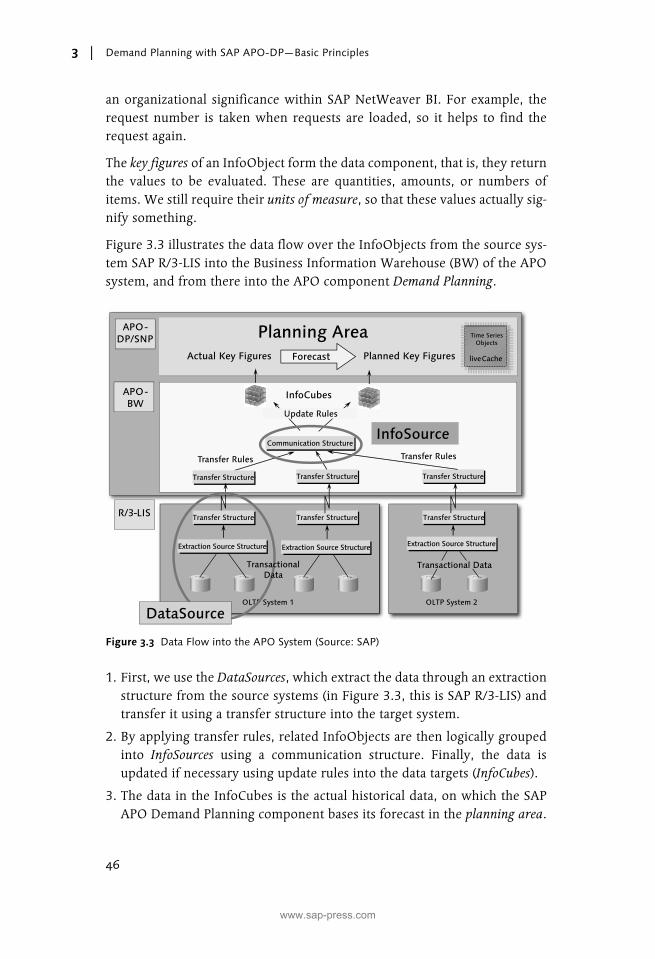
Figure 3.3 illustrates the data flow over the InfoObjects from the source sys-tem SAP R/3-LIS into the Business Information Warehouse (BW) of the APOsystem, and from there into the APO component Demand Planning.
1. First, we use the DataSources, which extract the data through an extractionstructure from the source systems (in Figure 3.3, this is SAP R/3-LIS) andtransfer it using a transfer structure into the target system.
2. By applying transfer rules, related InfoObjects are then logically groupedinto InfoSources using a communication structure. Finally, the data isupdated if necessary using update rules into the data targets (InfoCubes).
3. The data in the InfoCubes is the actual historical data, on which the SAPAPO Demand Planning component bases its forecast in the planning area.
Figure 3.3 Data Flow into the APO System (Source: SAP)
InfoCubes
Communication Structure
Transferstruktur Transfer Structure
Extraction Source Structure
Transferstruktur Transfer Structure
OLTP System 1 OLTP System 2
Extraction Source Structure
Transferstruktur Transfer Structure
Transfer struktur Transfer Structure Transfer struktur Transfer Structure
Extraction Source Structure
Transferstruktur Transfer Structure
DataSource
InfoSource
Transactional Data
Transactional Data
Update Rules
Transfer Rules
R/3 - LIS
APO - BW
APO - DP/SNP
Planned Key Figures live Cache
Time Series Objects
Actual Key Figures Forecast
Planning Area
Transfer Rules
www.sap-press.com
Configuring the Administrator Workbench 3.2
47
Other additional key terms are as follows:
� InfoCatalogs are user-definable and are used to organize characteristicsand key figures.
� Navigation attributes group and select actual and planned data. Typical nav-igation attributes include the Material Requirements Planning (MRP) con-troller or customer group, which don’t represent a separate planninglevel, but instead are used for the grouping. SAP NetWeaver BI navigationattributes can be used for the planning. You can only use SAP NetWeaverBI hierarchies for evaluation using SAP NetWeaver BI queries.
� Data target is a generic term for objects into which data is loaded. Datatargets are the physical objects that are necessary for modeling the datamodel and loading the data.
� InfoCubes are data targets. They are assigned to an InfoArea and describe(from a reporting perspective) what is a self-contained dataset for an oper-ational business area. They can also be InfoProviders, if reports and analy-ses are executed on them in SAP NetWeaver BI. InfoCubes are suppliedwith data from one or several InfoSources or Operational Data Store (ODS)objects (BasisCube), or from an external system (RemoteCube).
� InfoAreas help to organize the objects in the Business Information Ware-house.
� Every InfoCube is assigned to an InfoArea.
� InfoObjects can also be assigned to different InfoAreas via InfoObjectcatalogs.
� All systems that provide data for SAP NetWeaver BI are described as thesource system. They can include the following:
� SAP systems from Basis Release 3.0D
� SAP NetWeaver BI systems
� Flat files for which the metadata is maintained manually and the datais copied to SAP NetWeaver BI through a data interface
� Database system into which data is loaded from a database supportedby SAP without using an external extraction program through DB Con-nect
� External systems for which the data and metadata transfer is per-formed using staging Business Application Programming Interfaces(BAPIs)
You determine the type of source system in the Administrator Workbenchin the source system tree with the function Create.
www.sap-press.com
Demand Planning with SAP APO-DP—Basic Principles3
48
� An InfoSource in SAP NetWeaver BI describes the volume of all availabledata for a business transaction or a type of business transaction (e.g., costcenter accounting). An InfoSource is a set of logically related informationcombined into a unit. InfoSources can comprise either transaction data ormaster data (attributes, texts, and hierarchies).
An InfoSource is always a set of logically related InfoObjects. The struc-ture that stores these InfoObjects is called the communications structure.
When an InfoSource is activated, the transfer structure and the communi-cation structure are created in APO-BW. Transfer structures always existin pairs in a source system and the corresponding APO Data Mart system.Through the transfer structure, the data is transported from a source sys-tem in the format of the original application into an APO Data Mart and itis copied there using transformation rules to the communication structureof the InfoSource. The communication structure is source-system-inde-pendent and contains all fields of the InfoSource that it represents in theAPO Data Mart.
� The transaction data that is copied into InfoCubes using extractors cancome from very different modules. Because of the way the system hasdeveloped historically, very different extraction mechanisms are requiredfor copying this transaction data.
3.2.3 InfoCubes
You save the actual data and archive planned data in the database in the Info-Cubes. If you have an external data warehouse such as SAP NetWeaver BI,you transfer the planning-relevant data to the InfoCubes of the DemandPlanning (DP Data Mart). You can also extract the aggregated data from theSAP ERP system to import it from Excel, SAP NetWeaver BI, and legacy sys-tems.
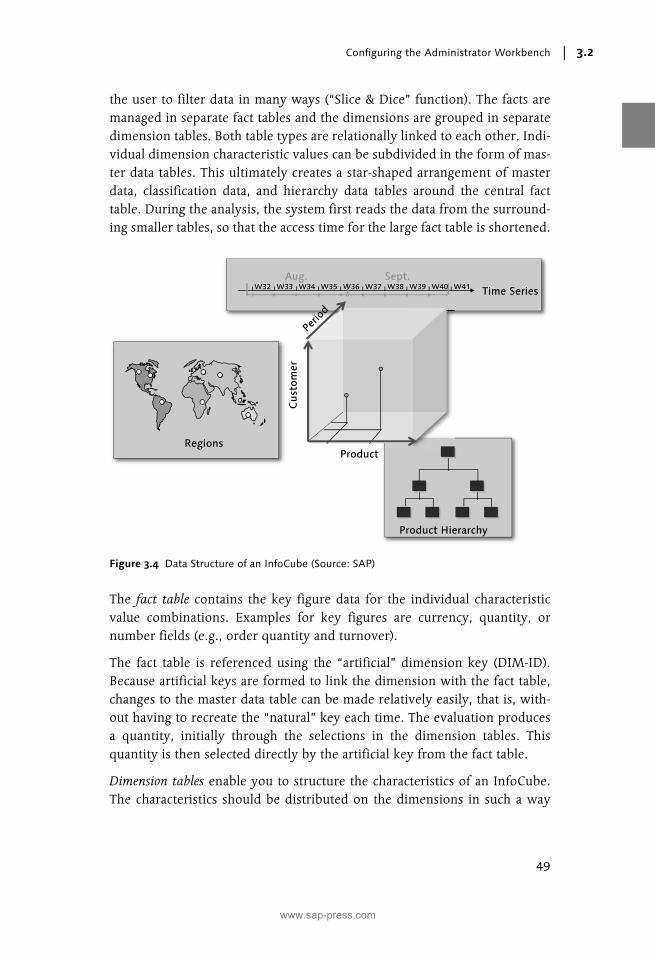
InfoCubes are essentially the data repository of the Demand Planning. Figure3.4 shows three dimensions (of a possible total of 256):
� Period
� Customer
� Product (a product or master data hierarchy was created for this dimen-sion)
InfoCubes create a multidimensional data model on the database server ofthe APO Data Mart. The multidimensional character of an InfoCube allows
www.sap-press.com
Configuring the Administrator Workbench 3.2
49
the user to filter data in many ways (“Slice & Dice” function). The facts aremanaged in separate fact tables and the dimensions are grouped in separatedimension tables. Both table types are relationally linked to each other. Indi-vidual dimension characteristic values can be subdivided in the form of mas-ter data tables. This ultimately creates a star-shaped arrangement of masterdata, classification data, and hierarchy data tables around the central facttable. During the analysis, the system first reads the data from the surround-ing smaller tables, so that the access time for the large fact table is shortened.
The fact table contains the key figure data for the individual characteristicvalue combinations. Examples for key figures are currency, quantity, ornumber fields (e.g., order quantity and turnover).
The fact table is referenced using the “artificial” dimension key (DIM-ID).Because artificial keys are formed to link the dimension with the fact table,changes to the master data table can be made relatively easily, that is, with-out having to recreate the “natural” key each time. The evaluation producesa quantity, initially through the selections in the dimension tables. Thisquantity is then selected directly by the artificial key from the fact table.
Dimension tables enable you to structure the characteristics of an InfoCube.The characteristics should be distributed on the dimensions in such a way
Figure 3.4 Data Structure of an InfoCube (Source: SAP)
Time Series Aug. Sept.
W32 W33 W34 W35 W36 W37 W38 W39 W40 W41
Product
Cus
tom
er
Perio
d
Product Hierarchy
Regions
www.sap-press.com
Demand Planning with SAP APO-DP—Basic Principles3
50
that the dimension tables are kept as small as possible and access to the facttable performs optimally (key reduction).
From a technical point of view, the characteristics of the dimension tableform the “edges” of the “data die,” which is saved as an InfoCube in the DataMart. The dimensions are linked with the fact table through dimension keys.The data of the fact table is accessed through the selection of the characteris-tics and their (characteristic) values from the dimension table and by the gen-eration of a corresponding SQL instruction, with which the fact table isaccessed.
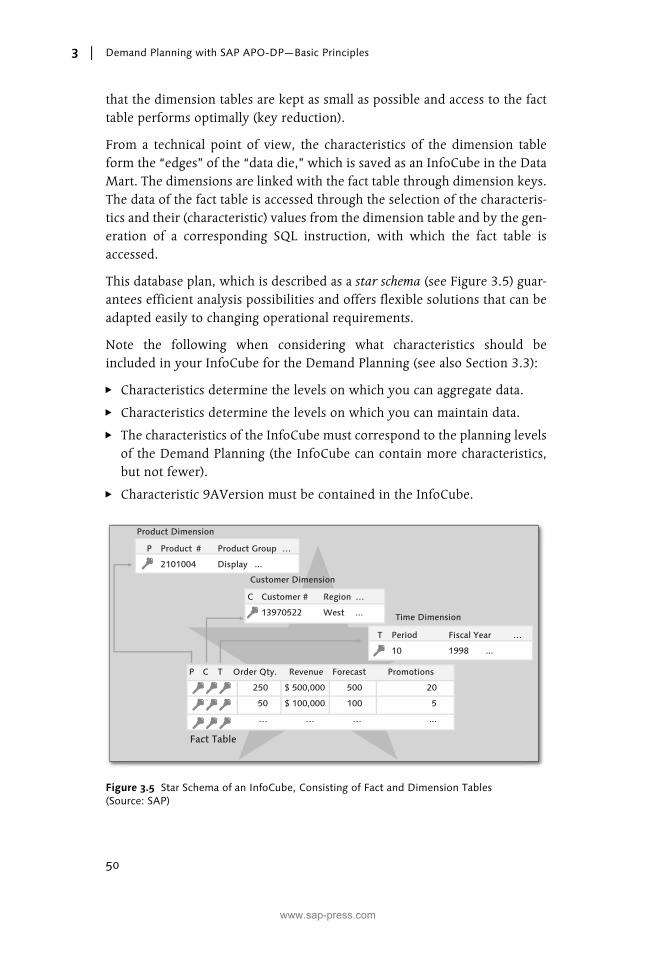
This database plan, which is described as a star schema (see Figure 3.5) guar-antees efficient analysis possibilities and offers flexible solutions that can beadapted easily to changing operational requirements.
Note the following when considering what characteristics should beincluded in your InfoCube for the Demand Planning (see also Section 3.3):
� Characteristics determine the levels on which you can aggregate data.
� Characteristics determine the levels on which you can maintain data.
� The characteristics of the InfoCube must correspond to the planning levelsof the Demand Planning (the InfoCube can contain more characteristics,but not fewer).
� Characteristic 9AVersion must be contained in the InfoCube.
Figure 3.5 Star Schema of an InfoCube, Consisting of Fact and Dimension Tables (Source: SAP)
Time Dimension
Product Dimension
Fact Table
Customer Dimension
C Customer # Region …
13970522 West ...
P C T Order Qty. Revenue Forecast Promotions
250 $ 500,000 500 20
50 $ 100,000 100 5
… … … ...
P Product # Product Group …
2101004 Display ...
T Period Fiscal Year …
10 1998 ...
www.sap-press.com
Configuring the Administrator Workbench 3.2
51
When you create an InfoCube, you must focus on the key figures and char-acteristics that you need for the planning. Then, you have to group yourcharacteristics in dimensions (time dimension and quantity dimension).According to your entries, the system automatically generates a star schemain the database.
3.2.4 Saving Key Figures and Characteristics in the InfoCube
Once you have created the InfoCube(s) in the Administrator Workbench,you can save key figures and characteristics.
First you need to decide which key figures should be saved in InfoCubes andwhich key figures should be saved in the liveCache. Generally, you save theactual data of the Demand Planning in an InfoCube (together with oldplanned data) and the current planned data in the liveCache.
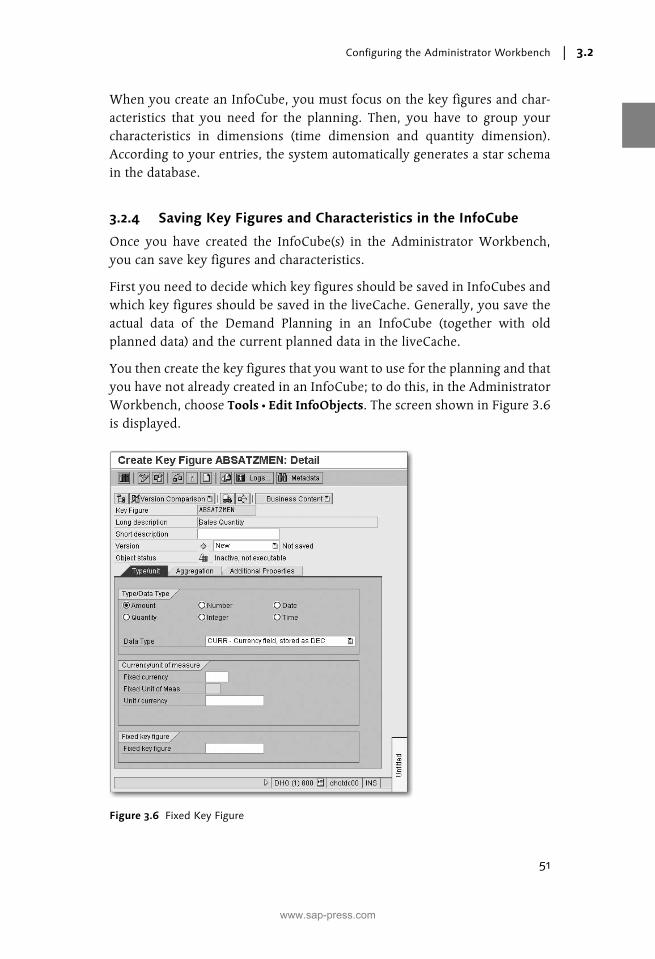
You then create the key figures that you want to use for the planning and thatyou have not already created in an InfoCube; to do this, in the AdministratorWorkbench, choose Tools � Edit InfoObjects. The screen shown in Figure 3.6is displayed.
Figure 3.6 Fixed Key Figure
www.sap-press.com
Demand Planning with SAP APO-DP—Basic Principles3
52
If you want to be able to fix the values of a key figure in the interactive plan-ning, enter the key figure in which the fixed values are to be saved in theFixed key figure field on the Type/unit tab.
The system is delivered with standard characteristics, for example:
� 9AMATNR for product
� 9ALOCNO for location
If you intend to use additional APO applications as well as the Demand Plan-ning, you must work with these standard characteristics. If the characteristicsthat are delivered are insufficient for your requirements, you can create yourown. To do this, in the Administrator Workbench, choose Tools � EditInfoObjects.
For characteristics that you want to use for selection and navigation, but notas planning levels, create attributes and assign these to a characteristic thatyou want to use for planning. This procedure allows you to plan several char-acteristics with optimal system performance. For example, you assign theattributes Sales Employee and Priority to the characteristic Customer.
3.3 Configuring the S&DP Administrator Workbench
Once you have defined the general characteristics and key figures in theAdministrator Workbench, you must now assign the characteristics in theSupply and Demand Planning (S&DP) Administration of SAP APO to thebasic planning object structure and then create the so-called planning area.The planning environment in which you can perform the demand andrequirement planning is then fixed.
3.3.1 Overview
You now configure the demand planning in the S&DP Administration. Firstyou create a basic planning object structure in which you define all charac-teristics that are relevant for the Demand Planning. You can later determineseveral planning areas (e.g., for different company departments) from a basicplanning object structure. You then assign key figures and other settings tothe planning area. Ultimately, you have created the technical foundation thatwill enable you to begin the process of demand planning.
www.sap-press.com
Configuring the S&DP Administrator Workbench 3.3
53
3.3.2 Creating the Basic Planning Object Structure
A basic planning object structure contains all plannable characteristics for oneor more planning areas. In the Demand Planning, the characteristics caneither be standard characteristics or characteristics that you have createdyourself in the Administrator Workbench. Characteristics determine the lev-els on which you can plan and store data. Special characteristics are requiredfor Supply Network Planning (SNP), for the characteristics planning, and forthe forecast of secondary requirements; these characteristics can be includedif required in the basic planning object structure.
The use of additional characteristics for SNP is not planned. The basic plan-ning object structure 9ASNPBAS is an example of such a structure with thecorrect characteristics for SNP and can be used as a template.
The basic planning object structure is the structure on which all other plan-ning object structures are based. Other planning object structures representaggregates and standard SNP planning levels.
A basic planning object structure is an element of the definition of a planningarea. The existence of a basic planning object structure is therefore a prereq-uisite for creating a planning area.
To edit basic planning object structures, you must branch into the adminis-tration for S&DP. To do this, choose Demand Planning or Supply NetworkPlanning � Environment � Current Settings � Administration Demand Plan-ning and Supply Network Planning. Here you can edit the planning areasand basic planning object structures.
To edit basic planning object structures, you must choose Planning ObjectStructures from the F4 input help of the selection button on the top-left ofthe screen (see Figure 3.7).
You must perform the following steps to create the basic planning objectstructure:
1. In the context menu, choose Create Basic Planning Object Structure (can-not be seen in the figure). Enter the name of the new basic planning objectstructure and some descriptive text (see Figure 3.8).
2. On the Configure Planning Object Structure screen, you assign character-istics from the Template table to the Planning Object Structure table.
3. Save your basic planning object structure.
www.sap-press.com

Demand Planning with SAP APO-DP—Basic Principles3
54
4. Finally, you must also activate the planning object structure using the con-text menu. The planning object structure is then available for your plan-ning.
3.3.3 Creating Characteristic Value Combinations
A characteristic value combination is a group of characteristic values withwhich you want to plan. We also use the shorter term characteristic combina-tion to describe this group of values. Data can only be planned if you havedefined such a combination.
Figure 3.7 Calling the Planning Object Structure
Figure 3.8 Configuring the Planning Object Structure
www.sap-press.com
Configuring the S&DP Administrator Workbench 3.3
55
Characteristic value combinations are planned for basic planning objectstructures. The combinations then apply to all planning areas based on thisplanning object structure.
Under Demand Planning or Supply Network Planning � Environment � Cur-rent Settings � Administration Demand Planning and Supply Network Plan-ning, you select the corresponding basic planning object structure and thenchoose from the context menu Create Characteristic Combination.
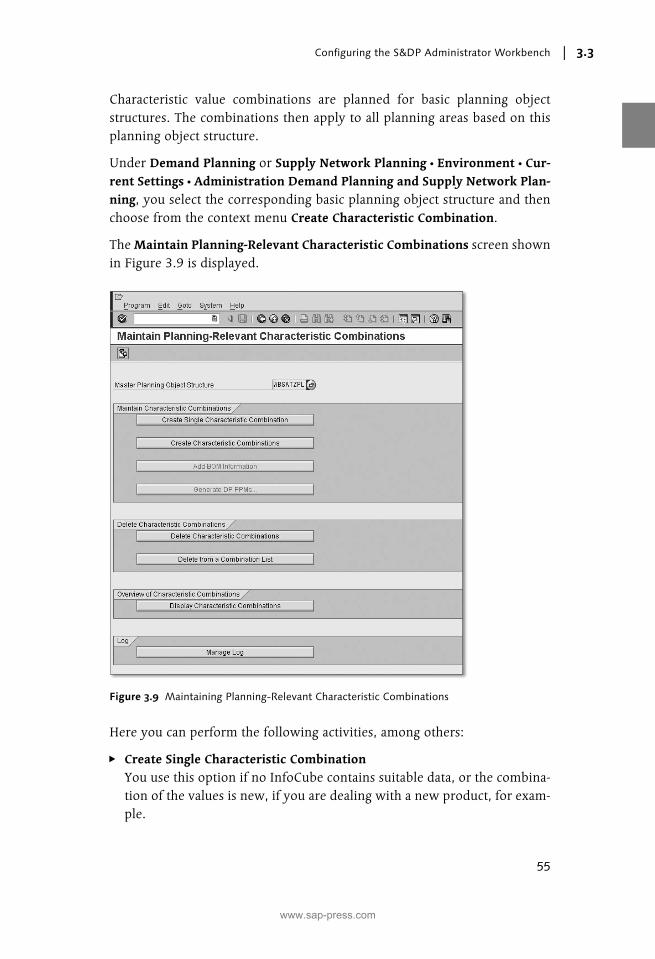
The Maintain Planning-Relevant Characteristic Combinations screen shownin Figure 3.9 is displayed.
Here you can perform the following activities, among others:
� Create Single Characteristic CombinationYou use this option if no InfoCube contains suitable data, or the combina-tion of the values is new, if you are dealing with a new product, for exam-ple.
Figure 3.9 Maintaining Planning-Relevant Characteristic Combinations
www.sap-press.com
Demand Planning with SAP APO-DP—Basic Principles3
56
� Create Characteristic CombinationsYou use this option to create characteristic combinations that are based onthe content of an InfoCube. The system checks what combinations of val-ues are contained in the InfoCube and generates them for the basic plan-ning object structure. What is important here is that the same characteris-tics are then finally contained in the InfoCube and in the basic planningobject structure. The InfoCube can contain more characteristics than thebasic planning object structure. Bearing in mind the aforementionedrestriction, you can use every InfoCube you like to create combinations.
� Delete Characteristic Combinations
� Display Characteristic Combinations
� Realignment (not shown in the figure)New characteristic value combinations can be formed during the course ofbusiness. For example, your company introduces new products, or prod-ucts are manufactured in another location. SAP provides a tool for reorga-nizing data (realignment) that you use to create the new characteristicvalue combinations automatically (see Section 4.4).
Another method for maintaining several characteristic value combinations isto edit the combinations in a flat file (e.g., a Microsoft Excel file), upload thisfile into an InfoCube, and then use this InfoCube to create the characteristicvalue combinations.
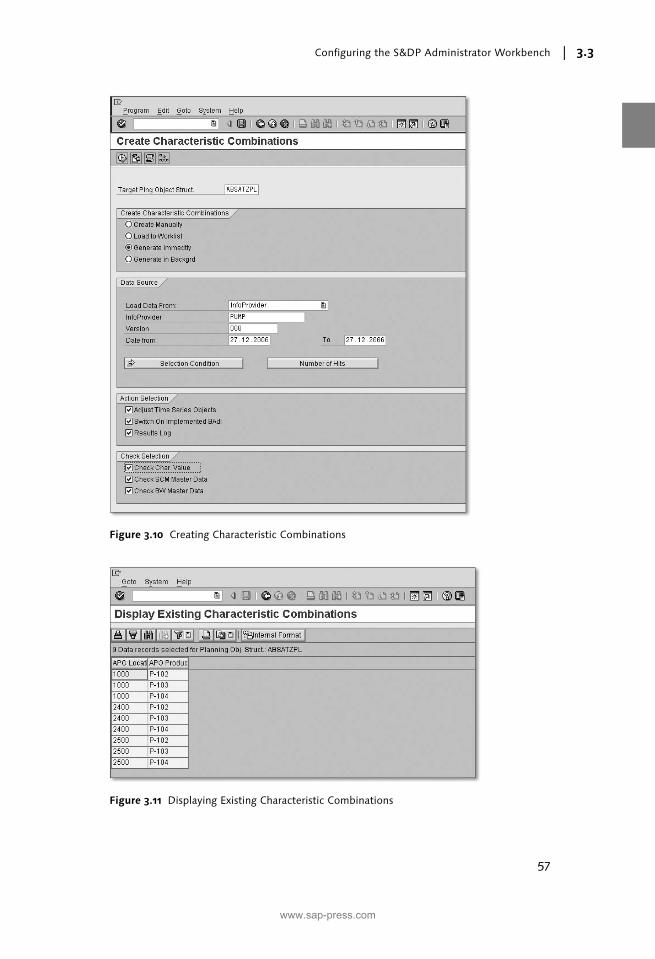
To create characteristic value combinations, proceed as follows:
1. Click on the Create Characteristic Value Combinations button and thescreen shown in Figure 3.10 opens.
2. In the Create Characteristic Combinations field group, select GenerateImmediately. The system generates the new characteristic value combina-tions directly from the data source specified in the field group DataSource.
3. When you click on Execute, the system generates the characteristic com-binations. You will then receive the message “Planning Object SuccessfullyCreated.”
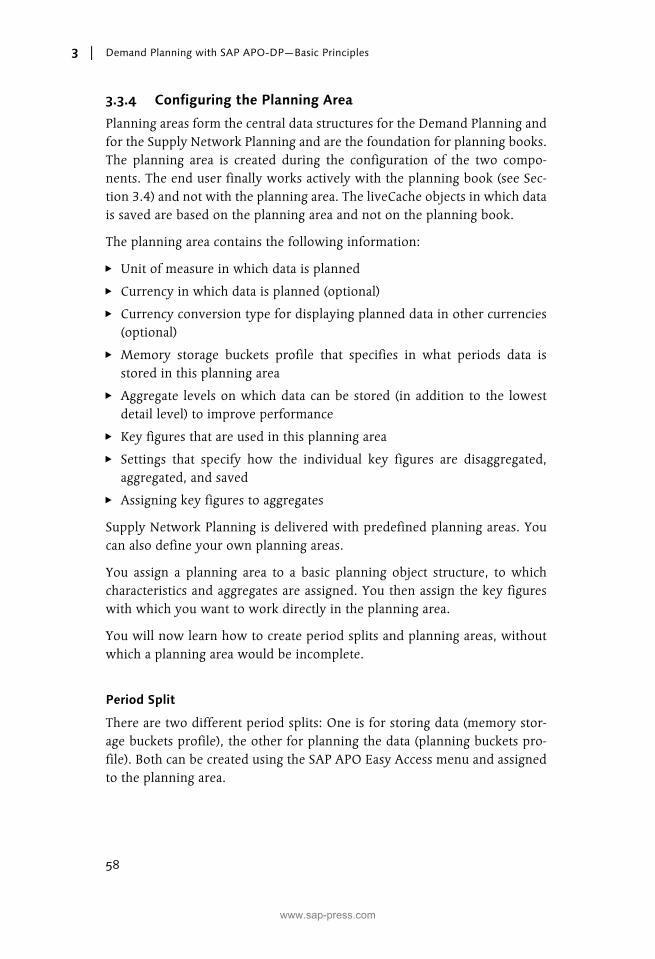
4. You can view the created characteristic combinations using the DisplayCharacteristic Combinations button (see Figure 3.9 and Figure 3.11).
www.sap-press.com
Configuring the S&DP Administrator Workbench 3.3
57
Figure 3.10 Creating Characteristic Combinations
Figure 3.11 Displaying Existing Characteristic Combinations
www.sap-press.com
Demand Planning with SAP APO-DP—Basic Principles3
58
3.3.4 Configuring the Planning Area
Planning areas form the central data structures for the Demand Planning andfor the Supply Network Planning and are the foundation for planning books.The planning area is created during the configuration of the two compo-nents. The end user finally works actively with the planning book (see Sec-tion 3.4) and not with the planning area. The liveCache objects in which datais saved are based on the planning area and not on the planning book.
The planning area contains the following information:
� Unit of measure in which data is planned
� Currency in which data is planned (optional)
� Currency conversion type for displaying planned data in other currencies(optional)
� Memory storage buckets profile that specifies in what periods data isstored in this planning area
� Aggregate levels on which data can be stored (in addition to the lowestdetail level) to improve performance
� Key figures that are used in this planning area
� Settings that specify how the individual key figures are disaggregated,aggregated, and saved
� Assigning key figures to aggregates
Supply Network Planning is delivered with predefined planning areas. Youcan also define your own planning areas.
You assign a planning area to a basic planning object structure, to whichcharacteristics and aggregates are assigned. You then assign the key figureswith which you want to work directly in the planning area.
You will now learn how to create period splits and planning areas, withoutwhich a planning area would be incomplete.
Period Split
There are two different period splits: One is for storing data (memory stor-age buckets profile), the other for planning the data (planning buckets pro-file). Both can be created using the SAP APO Easy Access menu and assignedto the planning area.
www.sap-press.com
Configuring the S&DP Administrator Workbench 3.3
59
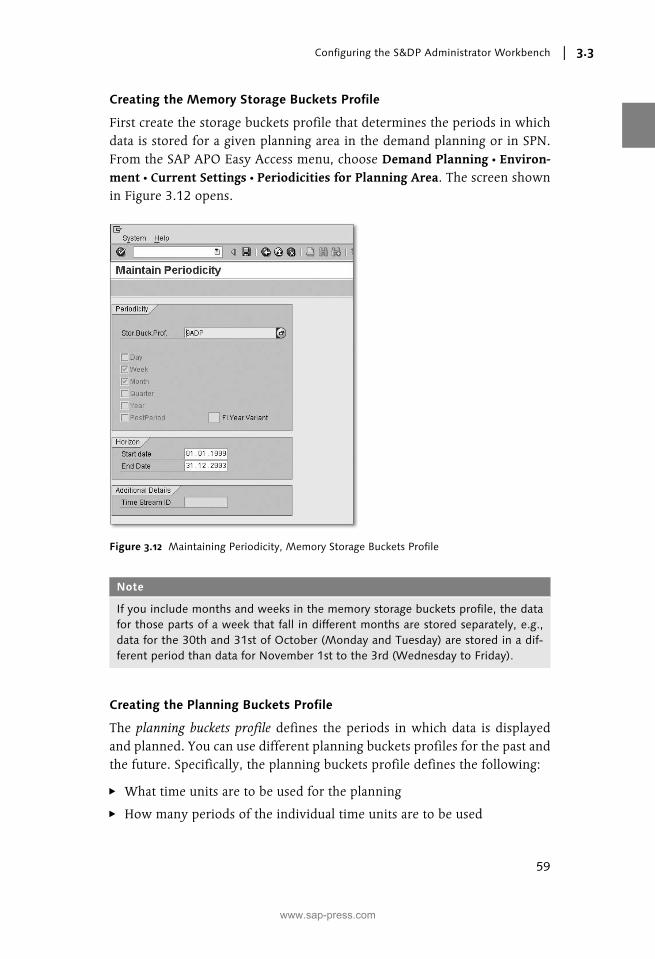
Creating the Memory Storage Buckets Profile
First create the storage buckets profile that determines the periods in whichdata is stored for a given planning area in the demand planning or in SPN.From the SAP APO Easy Access menu, choose Demand Planning � Environ-ment � Current Settings � Periodicities for Planning Area. The screen shownin Figure 3.12 opens.
Creating the Planning Buckets Profile
The planning buckets profile defines the periods in which data is displayedand planned. You can use different planning buckets profiles for the past andthe future. Specifically, the planning buckets profile defines the following:
� What time units are to be used for the planning
� How many periods of the individual time units are to be used
Figure 3.12 Maintaining Periodicity, Memory Storage Buckets Profile
Note
If you include months and weeks in the memory storage buckets profile, the datafor those parts of a week that fall in different months are stored separately, e.g.,data for the 30th and 31st of October (Monday and Tuesday) are stored in a dif-ferent period than data for November 1st to the 3rd (Wednesday to Friday).
www.sap-press.com
Demand Planning with SAP APO-DP—Basic Principles3
60
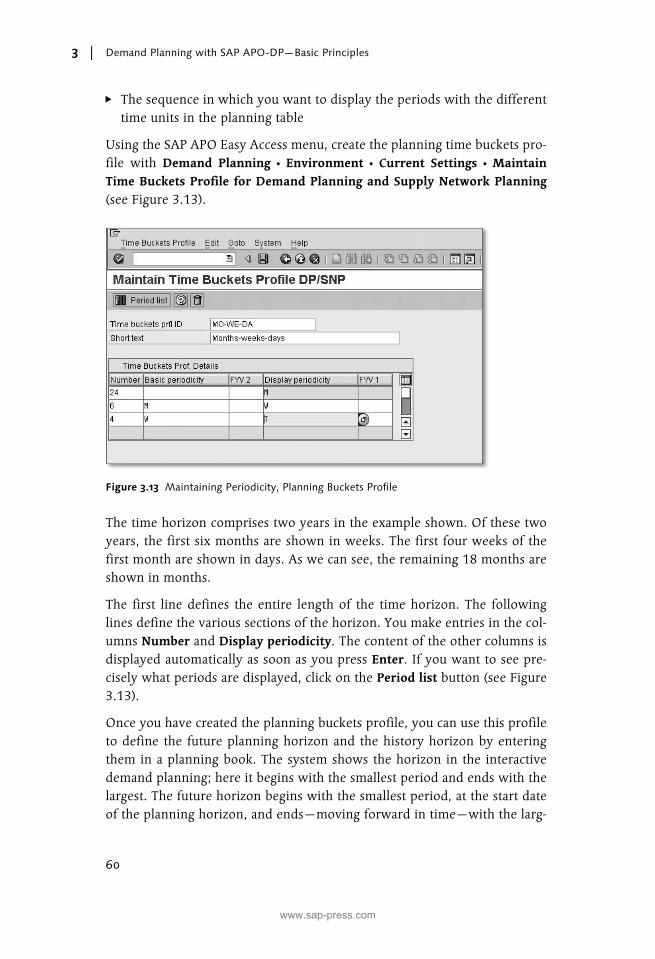
� The sequence in which you want to display the periods with the differenttime units in the planning table
Using the SAP APO Easy Access menu, create the planning time buckets pro-file with Demand Planning � Environment � Current Settings � MaintainTime Buckets Profile for Demand Planning and Supply Network Planning(see Figure 3.13).
The time horizon comprises two years in the example shown. Of these twoyears, the first six months are shown in weeks. The first four weeks of thefirst month are shown in days. As we can see, the remaining 18 months areshown in months.
The first line defines the entire length of the time horizon. The followinglines define the various sections of the horizon. You make entries in the col-umns Number and Display periodicity. The content of the other columns isdisplayed automatically as soon as you press Enter. If you want to see pre-cisely what periods are displayed, click on the Period list button (see Figure3.13).
Once you have created the planning buckets profile, you can use this profileto define the future planning horizon and the history horizon by enteringthem in a planning book. The system shows the horizon in the interactivedemand planning; here it begins with the smallest period and ends with thelargest. The future horizon begins with the smallest period, at the start dateof the planning horizon, and ends—moving forward in time—with the larg-
Figure 3.13 Maintaining Periodicity, Planning Buckets Profile
www.sap-press.com
Configuring the S&DP Administrator Workbench 3.3
61
est period. The history horizon begins with the smallest period on the daybefore the beginning of the future horizon and ends—moving backward intime—with the largest period.
For a single planning book you may have several planning buckets profilesand thus several planning horizons. The planning buckets profile is linked tothe data view within the planning book. You could for example have threedata views for three users, with a different planning buckets profile applyingfor each view: Marketing plans in months, sales in months and weeks andlogistics in weeks and days. To release the demand plan in daily periods toSupply Network Planning, you use a daily buckets profile, that is, a planningbuckets profile, that only contains periods with the time unit “Day”.
Creating the Planning Area
To now create the planning area, proceed as follows:
1. From the SAP APO Easy Access menu, choose Demand planning � Envi-ronment � Current settings � Administration Demand Planning and Sup-ply Network Planning.
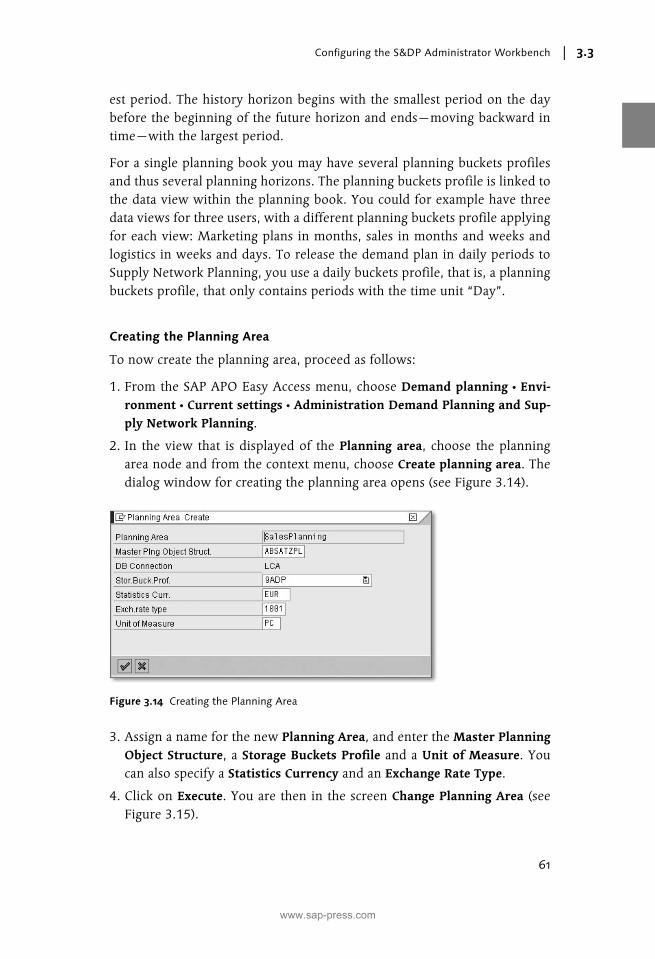
2. In the view that is displayed of the Planning area, choose the planningarea node and from the context menu, choose Create planning area. Thedialog window for creating the planning area opens (see Figure 3.14).
3. Assign a name for the new Planning Area, and enter the Master PlanningObject Structure, a Storage Buckets Profile and a Unit of Measure. Youcan also specify a Statistics Currency and an Exchange Rate Type.
4. Click on Execute. You are then in the screen Change Planning Area (seeFigure 3.15).
Figure 3.14 Creating the Planning Area
www.sap-press.com
Demand Planning with SAP APO-DP—Basic Principles3
62
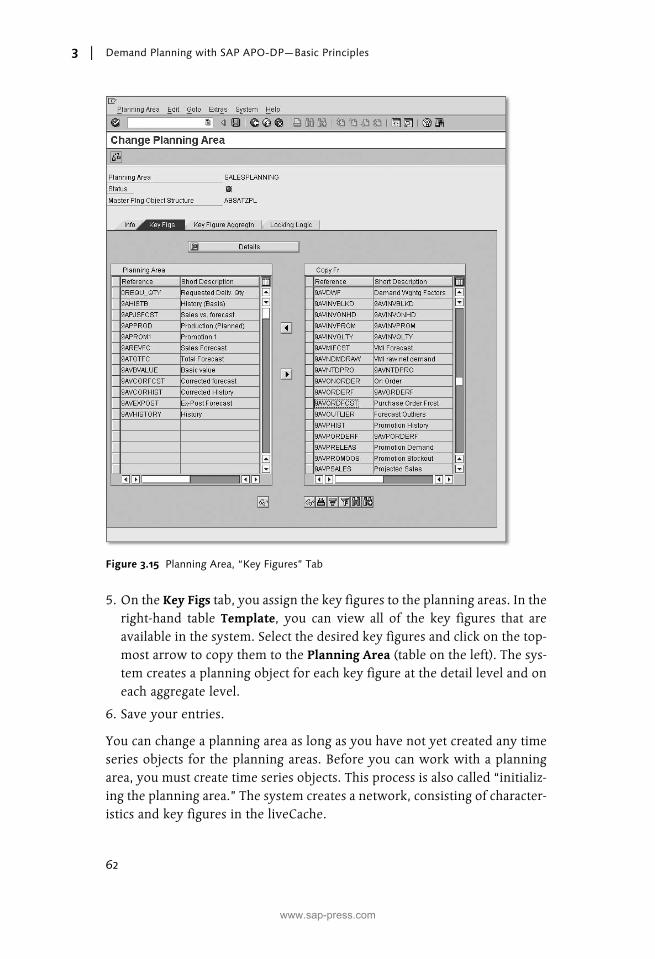
5. On the Key Figs tab, you assign the key figures to the planning areas. In theright-hand table Template, you can view all of the key figures that areavailable in the system. Select the desired key figures and click on the top-most arrow to copy them to the Planning Area (table on the left). The sys-tem creates a planning object for each key figure at the detail level and oneach aggregate level.
6. Save your entries.
You can change a planning area as long as you have not yet created any timeseries objects for the planning areas. Before you can work with a planningarea, you must create time series objects. This process is also called “initializ-ing the planning area.” The system creates a network, consisting of character-istics and key figures in the liveCache.
Figure 3.15 Planning Area, “Key Figures” Tab
www.sap-press.com
Configuring the S&DP Administrator Workbench 3.3
63
Creating Time Series Objects
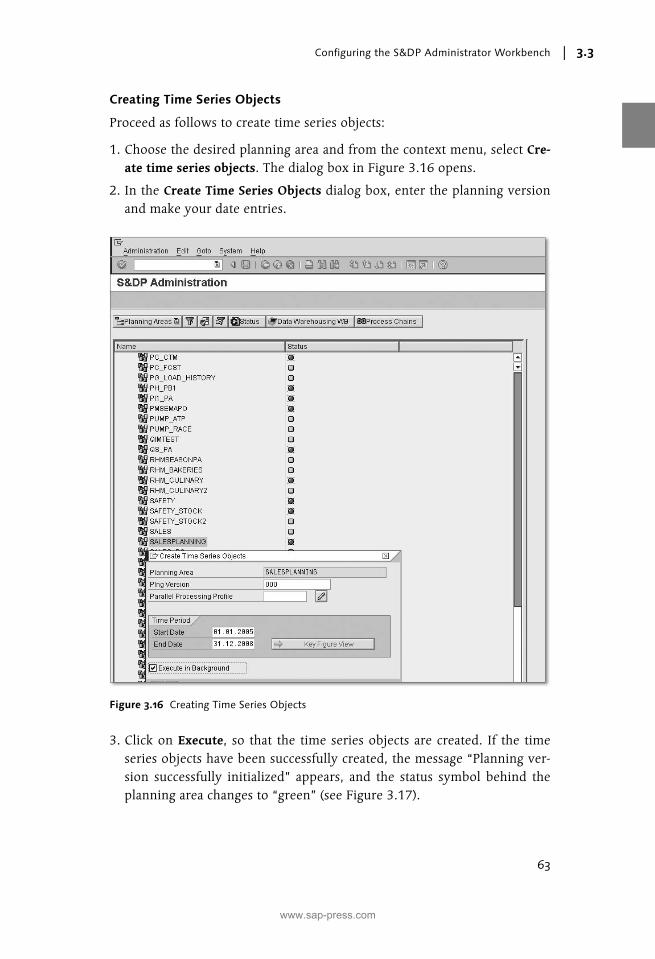
Proceed as follows to create time series objects:
1. Choose the desired planning area and from the context menu, select Cre-ate time series objects. The dialog box in Figure 3.16 opens.
2. In the Create Time Series Objects dialog box, enter the planning versionand make your date entries.
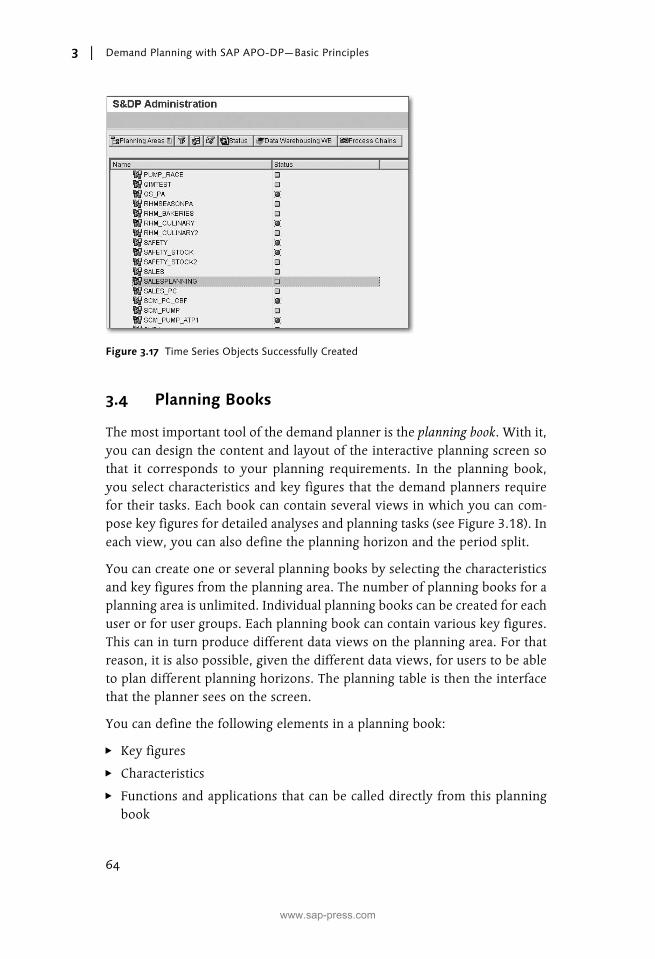
3. Click on Execute, so that the time series objects are created. If the timeseries objects have been successfully created, the message “Planning ver-sion successfully initialized” appears, and the status symbol behind theplanning area changes to “green” (see Figure 3.17).
Figure 3.16 Creating Time Series Objects
www.sap-press.com
Demand Planning with SAP APO-DP—Basic Principles3
64
3.4 Planning Books
The most important tool of the demand planner is the planning book. With it,you can design the content and layout of the interactive planning screen sothat it corresponds to your planning requirements. In the planning book,you select characteristics and key figures that the demand planners requirefor their tasks. Each book can contain several views in which you can com-pose key figures for detailed analyses and planning tasks (see Figure 3.18). Ineach view, you can also define the planning horizon and the period split.
You can create one or several planning books by selecting the characteristicsand key figures from the planning area. The number of planning books for aplanning area is unlimited. Individual planning books can be created for eachuser or for user groups. Each planning book can contain various key figures.This can in turn produce different data views on the planning area. For thatreason, it is also possible, given the different data views, for users to be ableto plan different planning horizons. The planning table is then the interfacethat the planner sees on the screen.
You can define the following elements in a planning book:
� Key figures
� Characteristics
� Functions and applications that can be called directly from this planningbook
Figure 3.17 Time Series Objects Successfully Created
www.sap-press.com
435
Index
A
Absolute percentage error (APE) 149AcceleratedSAP (ASAP) 393Adjusted absolute percent error (APE-A)
151Adjusted R square 141, 155, 416Administrator Workbench 43Advanced Macro 71, 415Advanced Planning & Scheduling (APS)
18, 415Aggregated SNP Planning 365Aggregation 66, 415Alert Monitor 24, 82, 159, 308, 416Alpha factor 118ASAP � AcceleratedSAPAutocorrelation 416Automatic cost generation 286Automatic forecast 88Automatic model selection 132, 133,
135, 137Available-to-Deploy quantity(ATD quan-
tity) 417Available-to-Promise (ATP) 417
B
BAPI 383, 388, 417Basic planning object structure 53BasisCube 47Bill of material (BOM) 417BOM 183Bottom-up planning 66Branch-and-bound procedure 417Bucket 371, 417Bullwhip Effect 417Business Application Programming Inter-
face � BABusiness blueprint 394Business Content 45Business Framework 418Business-to-Consumer (B2C) 29BW � SAP NetWeaver BI
C
Calculating the safety stock 327Cannibalization 167Cannibalization group 177Capable-to-Match (CTM) 35, 231, 288,
418Capacity leveling 238, 418Causal analysis 32, 65Causal forecast error 155
adjusted R square 155, 416Durbin-h 156, 421Durbin-Watson 156, 421mean elasticity 157R square 155, 427t-test 157, 430
Causal model 138Characteristic combination 54Characteristics 42Chart 418Client-server architecture 390Collaboration 23, 29, 97, 418Collaborative demand planning 78, 180Collaborative Planning (CLP) 180Collaborative Planning, Forecasting and
Replenishment (CPFR) 31, 418Components 81Composite forecast 32, 65Constraint 418Core Interface (CIF) 418Cost maintenance 287Croston method 127, 136, 419CTM messages 308
D
Data Mart 48, 419Data Views 65, 80Days' supply 419Days' supply planning 276Decomposition 252Delphi method 108Demand horizon 419
www.sap-press.com
436
Index
Demand plan 419Demand planning BOM 77Demand planning version 420Demand profile 420Deployment 37, 231, 336, 420Deployment heuristic 336Deployment optimization 344Determining the supply source 263Dimension key 49Dimension table 49, 50Disaggregation 66, 420Discrete Optimization 251Distribution center 420Distribution demand � SAP APO-SNPDistribution receipt 421Distribution Requirement Planning (DRP)
421Distribution Resource Planning 36Down-binning procedure 421Drill-down function 66Drill-up function 66Durbin-h 156, 421Durbin-Watson 156, 421Dynamic safety stock 319
E
Electronic Data Interchange (EDI) 29, 421
Enterprise Resource Planning (ERP) 421Error total 147Extended macro 31
F
Fact table 49, 50Fair share rules 337, 345Finite planning 256Forecast alert 146, 159Forecast error 147, 158, 326, 327, 328Forecast horizon 421Forecast method 422Forecast model 422Forecast procedures
aggregation and disaggregation 103Forecast quality 145, 312, 326Forecast view 82Forecasting technique 422
adjusted R square 416, 427
constant model with exponential smoo-thing 1 116
Croston method 419models with exponential smoothing 2nd
order 115moving average model 113qualitative forecasting technique 108time series analysis 109trend/seasonal model with exp. smoo-
thing 1. O 122univariate forecasting technique 109
Forecasting techniquesadjusted R square 141, 155automatic adjustment of the alpha factor
119automatic model selection 131causal models 111combined forecasting techniques 141composite methods 111Croston method 127, 136Ex-post forecast 143manual forecasts 112median method 129models with 2nd-order exponential smoo-
thing 121Multilinear regression 138naïve methods 111quantitative forecasting technique 109quantitative forecasting techniques 112seasonal linear regression 125weighted moving average model 114
Forecasts 31Form-Fit-Function class 378
G
Geometric mean relative absolute error (GMRAE) 153
Global Availability Check (G-ATP) 27
H
Heuristic profiles 237Heuristic with capacity leveling 35, 231,
235Historical sales 41Holt method 121Horizontal aggregated planning 254
www.sap-press.com

437
Index
I
Incremental optimization 254Individual planning book 208InfoArea 47InfoCube 41, 43, 48, 50, 389, 422InfoObject 45, 79, 232InfoSource 46Input component 279Integrated Supply Chain Planning 38Interactive demand planning 78Interactive SNP planning 231Interior point method 422In-transit 422Inventory Collaboration Hub (ICH) 383Inventory planning � SAP APO-DPInventory planning � SAP APO-SNPInventory policy 328
K
Key figures 41Key Performance Indicator (KPI) 422
L
Lifecycle management 32, 422Lifecycle planning 31, 77, 161Like modeling 170, 172, 422Like profiles 164Linear Optimization 250Linear regression 136Location 42, 422Lot-size planning 266Lot-size planning in procurement 273
fixed procurement costs 273minimum/maximum and integer 273
Lot-size planning in production 266discrete (integer) lot sz 271integration 268minimum/maximum lot sizes 268setup consumptions 266setup costs 268
Lot-size planning in transportation 272discrete (integer) transport 272fixed means of transport costs 272minimum/maximum lot sizes 272
M
Macro 423Macro Workbench 72MacroBuilder 74Master data 42, 209, 292Master planning object structure 204,
423Material requirements planning (MRP)
16Mean absolute deviation (MAD) 148Mean absolute percent error (MAPE)
151Mean elasticity 157Mean square error (MSE) 148Median absolute percent error (MdAPE)
152Median relative absolute error (MdRAE)
153Memory storage buckets profile 59Middle-out planning 66Missing part costs 311Missing part formula 153Multi-level planning 31
N
Negative binomial distribution 423Notes management 95
O
ODS object 47OLTP system 27, 246, 390, 423Optimization horizon 423Optimization methods
decomposition 252discrete optimization 251horizontal aggregated planning 254incremental optimization 254linear optimization 250prioritization 252vertical aggregated planning 253
Optimization profile 279Optimizer 35, 231, 249Order cycle policy 328Outlier correction 86, 87, 135Output component 279
www.sap-press.com
438
Index
P
Pegging 423Period split 58Phase-in/-out 163
Mechanisms 163modeling 170models 173profiles 165
Plan Monitor 308, 423Plan version 425Planning algorithm 302Planning area 42, 46, 58, 61, 424Planning book 41, 61, 64, 65, 424Planning bucket profile 61, 204, 425Planning horizon 61, 425Planning layout 425Planning level 42Planning object 42Planning object structure 425Planning time buckets profile 60Planning version 42Plug-in (PI) 385Poisson distribution 426Prioritization 252Process areas in SAP SCM 23
collaboration 29coordination 29execution 27planning 23
Product assignment 170, 173Product interchangeability 168Product lifecycle 162Production data structure (PDS) 263Production horizon 426Production Planning and Detailed
Scheduling (PP/DS) 379, 426Production process model (PPM) 263,
426Project methodology 393Project preparation 394Promotion base 179Promotion planning 33, 65, 77, 100,
175, 426Promotion planning view 84, 179Pull deployment horizon 426Pull distribution 37, 426Push deployment horizon 426
Push distribution 37, 426Push rule 426Push rules 337, 340, 345
Q
qRFC monitor 307
R
Realignment 56, 170, 172, 196Real-time deployment 344Regression analysis 132Relative absolute error (RAE) 153Remote function call (RFC) 386RemoteCube 47Reorder point policy 329Replenishment lead time 312, 324, 368Requirements categorization 297Requirements prioritization 294Resource 427Resource bottleneck 427Root of the mean square error (RMSE)
149
S
S&DP Administration Workbench 41, 52, 203
Safety range of coverage 316Safety stock 312Safety stock planning 34, 274, 311, 335
enhanced 322, 330Sales forecast 428SAP APO 21, 415, 419SAP APO Core Interface (CIF) 383, 386SAP APO-DP 25, 30, 77, 389, 393, 419SAP APO-SNP 25, 41, 199, 231, 393SAP APO-SNP process flow 200SAP Business Information Warehouse
(BW) � SAP NetWeaver BISAP Collaborative Planning, Forecasting
and Replenishment (CPFR) 30SAP ERP 191SAP liveCache 42, 51, 206, 368, 389,
390, 422SAP Materials Management (MM) 23,
27
www.sap-press.com
439
Index
SAP NetWeaver BI 25, 44, 48, 389, 418SAP Production Planning (PP) 28SAP Production Planning and Detailed
Scheduling (PP/DS) 26SAP Quick Sizer 390SAP Sales and Distribution (SD) 28SAP SCM 21, 22, 383SAP solution manager 398SAP Supply Chain Event Management
(SCEM) 29SAP Supply Chain Performance Manage-
ment (SCPM) 29SAP Transportation Management (TM)
28SAP Warehouse Management (WM) 28Scheduling 304Seasonal linear regression 136Selection profile 80Sequence of the search strategy
system-internal 299user-defined 300
Service level 311, 312, 325, 330Shuffler 79Simplex algorithm 428Simulation version 428Sizing 390SNP heuristics 428SNP horizon 372SNP Optimizer 263, 428SNP stock transfer 429Source determination 302Source of supply determination 264Source system 47Special sorting 294Sporadic demand 429Standard planning book 207Standard safety stock planning 315Standard view 82Star schema 50Stock transfer horizon 429Stockout formula
calculating the occurrence of a stockout 325
calculating the stockout 325Storage bucket profile 42, 203Storage costs 311Supplier-Managed Inventory 30Supply chain 15, 21, 383
Supply Chain Cockpit (SCC) 24, 85, 429Supply Chain Design (SCD) 24Supply Chain Engineer (SCE) 24, 429Supply Chain Event Management (EM)
383Supply Chain Management (SCM) 15,
22, 429Supply Chain Viewer 308Supply horizon 429Supply Network Planning (SNP) 429Supply shortage 430
T
Theil coefficient 154Time series object 63Top-down planning 66Total demand 430Total receipts 430Tracking signal 154Transaction data 48Transport Load Builder (TLB) 26, 38,
231, 336, 354, 430Trend dampening profile 430
U
Univariate forecast 65Univariate forecast error
absolute percent error (APE) 149adjusted absolute percent E 151error total 147geometric mean relative A 153Mean absolute deviation (MAD) 148mean absolute percent error 151Mean square error (MSE) 148median absolute P 152median relative A 153relative absolute error (RAE) 153root of the mean square error 149Theil coefficent 154tracking signal 154
Univariate forecasting methods 32Upper stock limit
dynamic 277static 277
www.sap-press.com

440
Index
V
Vendor-Managed Inventory (VMI) 30, 31, 431
Vertical aggregated planning 253
W
Winters' method 122, 431
X
XML 29, 180
www.sap-press.com