salary surveys - total reward group · 7 our automated role matching assistant (arma) uses...
TRANSCRIPT

SALARY SURVEYS

2
ContentsIntroduction
REMconnect - Your Salary Survey Platform4
4
4
Heli ViewRatings ViewRole ViewGender View
10111213
Individual ViewStructure View
1415
Job Positions
Survey Components
Role Matching
Survey Reports
REMview - Salary Comparison ReportsKey Features
System Tools
Benefits
9
9
9
Multi-Source Analyses and Reporting
Key Features
System Workflow
Benefits
3
5
6
7
8
10

3
Introduction
Salary Surveys with Total Reward Solutions
As our collective experience when working in-house was to answer a resounding ‘yes’ to these
questions, we have brought to market two exciting new offerings, built by reward professionals for reward
professionals:
• REMconnect – survey platform using intelligent Automated Role Matching Assistance
• REMview – a portal tool equipping reward professionals with the ability to interrogate multiple
surveysources,analysingandreportingfindingsinasingleview
Our surveys are designed to deliver:
• A trusted, high quality total reward benchmarking service
• Reliable and insightful job matching protocols
• Authoritative data mining and analysis
Are you dissatisfied with your current salary surveys or looking for a survey house to run a club survey?
Do the surveys you access use flawed job matching methodologies, lack rigour or prove poor value for money?
Do you struggle to aggregate multi-source data into a common format for analysis and reporting purposes?

4
REMconnect - Your Salary Survey PlatformKey Features
Built by reward professionals for reward professionals our platform manages the end-to-end survey process
and features:
• Innovative and intelligent functionality
• ARMA – our unique Automated Role Matching Assistant
•DatavalidationtestsdefinedbyclubsurveyparticipantsorTRSConsultants
•Rigorousinbuiltvalidationtools,matchedsamplesandaccesstoonlystatisticallysignificantdata
• Extensive, user friendly set-up and design supports survey participants and administrators alike
System Workflow
Data is delivered into REMconnect’s survey database(s) as follows:
Benefits
Online - no software to install, simply requires an internet connection
Time Saving - takes the grind out of job matching and reduces the real cost of data analysis
Engaging-ahighqualityuserexperienceincludingintelligentandefficientprocess
Powerful-customisereports,filterdataanddeployintuitiveageingtoolstoprovideyear-rounddatavisibility
Real Time-filterreportsandreceivelivefeedbackonthesamplesizeforeachjob
Live Database - data is submitted and viewed in real time, unlike a rear view mirror published survey
5
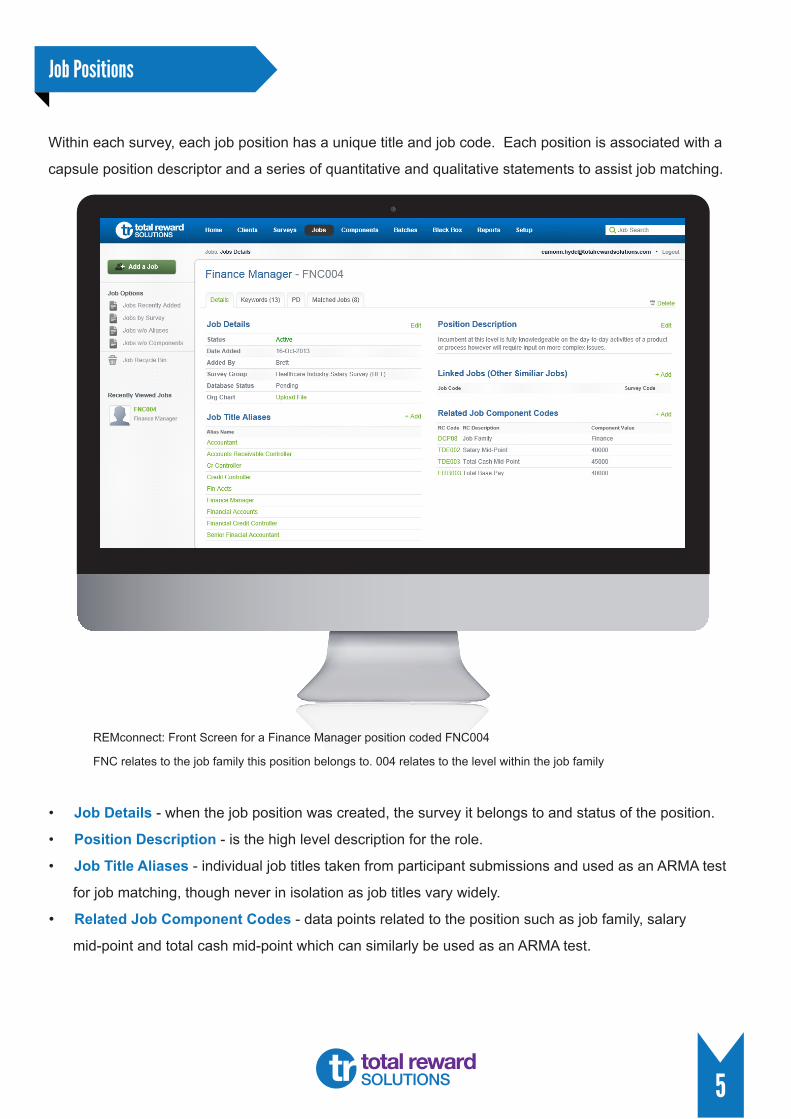
Within each survey, each job position has a unique title and job code. Each position is associated with a
capsule position descriptor and a series of quantitative and qualitative statements to assist job matching.
Job Positions
• Job Details - when the job position was created, the survey it belongs to and status of the position.
• Position Description - is the high level description for the role.
• Job Title Aliases - individual job titles taken from participant submissions and used as an ARMA test
for job matching, though never in isolation as job titles vary widely.
• Related Job Component Codes - data points related to the position such as job family, salary
mid-point and total cash mid-point which can similarly be used as an ARMA test.
REMconnect:FrontScreenforaFinanceManagerpositioncodedFNC004
FNCrelatestothejobfamilythispositionbelongsto.004relatestothelevelwithinthejobfamily

6
Componentsarealltheinformation‘fields’capturedonthesystemandlinkedtoaspecificsurvey.
Thecomponentsrangethrough:
• Participant information such as company name, industry, turnover
•Incumbentinformationsuchasuniqueidentifiercode,gender,D.O.B,positionstartdate,jobtitle
• Remuneration elements such as base salary, variable pay, allowances
•Additionalcomponents,basedoncollecteddatae.g.totalcash,totalfixedpay,totalvariablepayandin
accordancewithparticipantneedsforfilteringandreportingpurposes.
Benefitsdatacanbecollectedwhereverabenefitelementcanhaveavalueplaceduponitandincludedas
reportable items in the reporting tool. If no value can be attributed, data can be collected on a simple
‘yes/no’ basis, the reporting tool expressing the outcome as a percentage of the number of eligible
incumbents within a match.
Survey Components

7
Our Automated Role Matching Assistant (ARMA) uses algorithms to assign suggested job matches to the
incumbents in each survey participant’s data submission. ARMA then visually represents the relative
strength of each suggested job match through a series of tests displayed as ‘scoring bars’. Each survey
participant can view this information online via their user log-in.
Inthisexample,ARMAsuggeststwojobmatchesfollowingmatchingtests.Thegreen‘scoringbars’indicatethe strength of each match.
Participants can use this data to validate one of the suggested matches or manually select an additional
matchiftheproposedmatchseemsinappropriatetotheincumbent.Thismethodofjobmatchingdelivers
a consistent and rigorous approach for all participants. It also saves time otherwise spent reading through
survey job descriptions for each position.
Role Matching

8
Our salary survey reporting tool offers the following options before exporting a report to Excel:
•Selectappropriatejobstobeincludedinthereport
•Selectappropriatefilters,whichmayincludecompanysizee.g.basedonturnover,numberof
employees, location, specialism/product, industry sector etc
•Selectremunerationcomponentstobeincludedinthereport
Once the above selections have been made you are offered an ‘Output Option’:
• ‘Create Report (Excel)’ – a job by job report based on the selection criteria above
• ‘Data Dump (Excel)’ – a line by line data output based on the above selections
• ‘Quality Control’ –onlyrelevantandstatisticallysignificantdataisreported
Survey Reports
Example:Reportsoptionscreenallowsyoutoselectjobs,componentsandfilterstobeincludedinyourcustomised report’
9
REMview - Salary Comparison ReportsIfyouusemultiplesalarysurveysbutfindaggregating,analysingandreportingdatafromdifferentsurvey
houses a challenge, our REMview software may be the solution you have been looking for.
Key Features
System Tools
Benefits
Built by reward professionals for reward professionals, our reporting tool will equip you with easily accessi-
ble and insightful reports to support pay decisions, including:
•Company-widemarketpositioning
• Job-by-job package and salary comparisons
• Gender gap analysis
• Detailed individual market pay reviews
• Remuneration structure analysis compared to market rates
•Userdefinedperformance/talentassessmentsversusmarketrates
Surveydatafrommultiplesurveyhousesandanycombinationofproviders,canbeanalysedandpresented
in REMview via simple to use reports.
Online - no software to install, simply requires an internet connection
Time Saving – save time in data preparation and presentation
Intuitive – our system tools let you focus on analysis rather than building spreadsheets
High impact – visual impact of graphics is much greater than spreadsheets and written reports
Flexible–filterdatatoprovidebespokereportsordisplaystandardreports
Multi-source – analysis compares multi-source, multi-supplier survey data with ease

10
Heli View
• Assess your pay rates against different market positions
• View individuals and overall averages
• Grade-by-Grade comparisons
• Review your alignment to target market positioning
•Compa-ratiospresentedforfastandeffectiveanalysis
Multi-Source Analyses and Reporting

11
Ratings View
Analysethemarketandyourpositionbasedonyourpre-definedcriteriacategoriessuchasperformance
ratings or talent assessments and check for consistency of approach and objectivity of line manager
decision-making.
• Are your highest performers paid well compared to market?
• Is there correlation between your performance ratings and market pay?
• Has a consistent approach been adopted?
• How do performance ratings compare to pay outcomes?
• How do performance ratings differ by job level and grade?
• Do you need to apply a forced/guided performance rating distribution curve going forward?
12
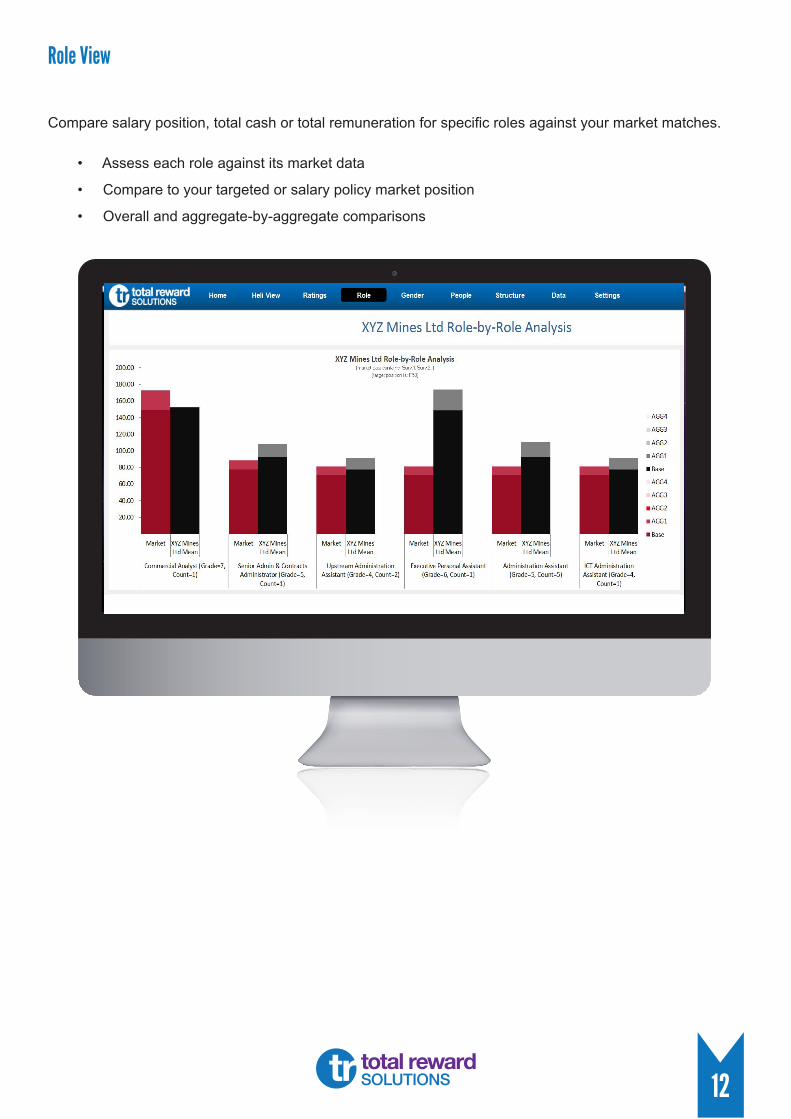
Role View
Comparesalaryposition,totalcashortotalremunerationforspecificrolesagainstyourmarketmatches.
• Assess each role against its market data
•Comparetoyourtargetedorsalarypolicymarketposition
• Overall and aggregate-by-aggregate comparisons
13
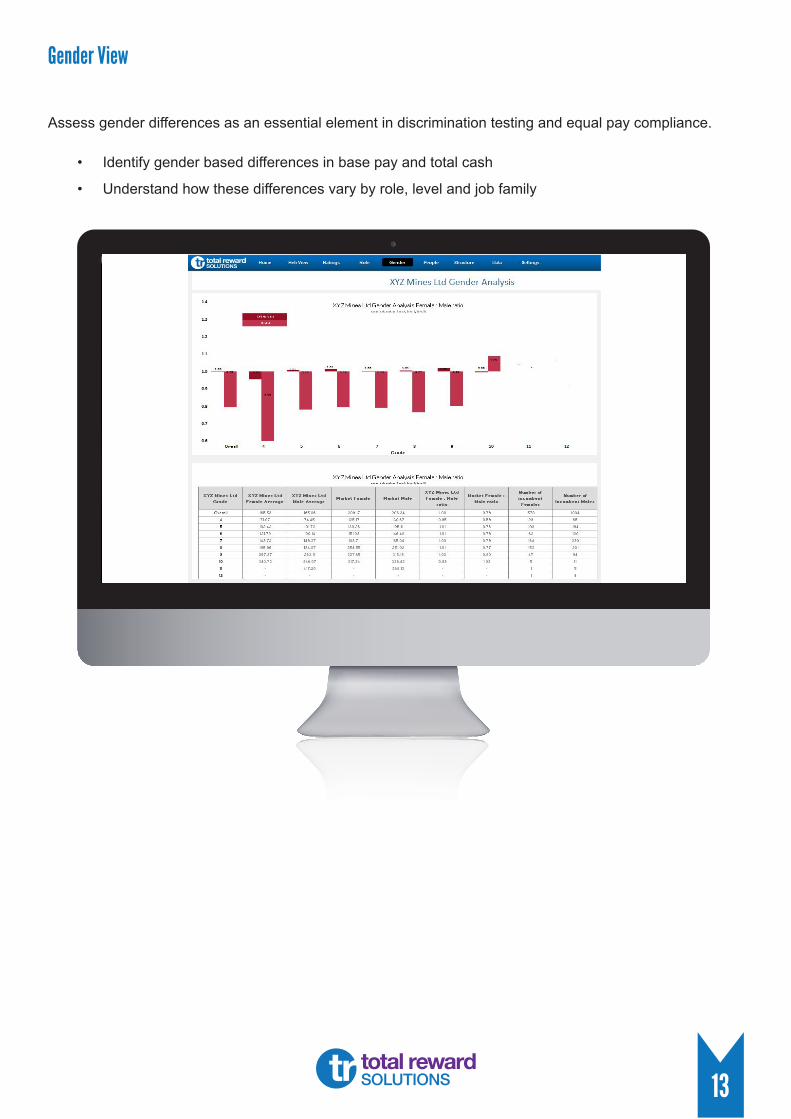
Gender View
Assess gender differences as an essential element in discrimination testing and equal pay compliance.
• Identify gender based differences in base pay and total cash
• Understand how these differences vary by role, level and job family

14
Individual View
Detailedviewsofnamedorspecificincumbentswithinyourorganisationandseehowtheirremuneration
compares to market.
• View an individual’s market positioning across a selection of quartiles
• Assess and compare at various pay aggregations

15
Structure View
Consideryourremunerationstructure,itslogicandmarketpositioningandwhetheritisalignedtostrategy
• Does your remuneration structure align with talent strategy and career paths?
• How do salary ranges and mid-points compare to market?