sake blok - sharkfesteurope.wireshark.org · #sf18eu • [email protected] • @synbit demo 3:...
TRANSCRIPT

SharkFest ’18 Europe
#sf18eu • Imperial Riding School Renaissance Vienna • Oct 29 - Nov 2
Sake BlokRelational Therapist for Computer Systems
Wireshark CLI tools and Scripting
http://syn-bit.nl/files/sf18eu.zip


Application and network troubleshooting
Protocol and packet analysis
Training (Wireshark, TCP, SSL)
www.SYN-bit.nl

#sf18eu • [email protected] • @SYNbit
Agenda
• Introductions •Why use CLI tools?... and how?
•Wireshark CLI tools •Useful shell commands •Some Scripting Examples •Q&A

#sf18eu • [email protected] • @SYNbit
Why use the CLI tools?
•When GUI is not available (shell access) •Quick and Easy Analysis • Postprocessing results
- GUI is powerful & interactive, but fixed functionality - CLI combined with other tooling is very flexible
•Automation
•CLI not only when GUI is unavailable
#sf18eu • [email protected] • @SYNbit
How?
•What information do I need? - visualize your output
•What (raw) data sources do I have? - Know the output formats of your data sources
•What tools are available? - What can they do, browse through manpages for unknown options
•Practice, Experiment & be Creative :-)
#sf18eu • [email protected] • @SYNbit
(some) Wireshark CLI tools
• tshark •dumpcap • capinfos • editcap •mergecap

#sf18eu • [email protected] • @SYNbit
tshark (1)
•CLI version of wireshark •Similar to tcpdump, but statefull / reassembly .... and MANY full protocol decodes
•uses dumpcap as capture engine • standard options: -i, -w, -f, -s, -r • name resolving (-n) • time stamps (-t <format>) •decode as (-d tcp.port==8080,http) • preferences (-o <pref>:<value>)

#sf18eu • [email protected] • @SYNbit
tshark (2)
• output formats (-V or -T <format>) - default: summary, uses column prefs - Verbose (-V), hex dump (-x), protocol selection (-O) - PDML (-T pdml) - JSON (-T json or -T jsonraw or -T ek) - fields (-T fields -E <sep> -e <field1> -e <field2> …)
• statistics (-z …) - protocol hierarchy (-qz io,phs) - conversations (-qz conv,eth , -qz conv,tcp) - i/o statistics (-qz io,stat,10,ip,icmp,udp,tcp) - follow stream (-qz follow,tcp,ascii,0)

#sf18eu • [email protected] • @SYNbit
Demo 1: Explore output formats
•Show normal output (‘tshark -r http.pcap’) • Show full decodes ('tshark -r http.pcap -V') • Show PDML (XML) decodes ('-T pdml’) • Show JSON decodes ('-T json')
http.pcap

#sf18eu • [email protected] • @SYNbit
Demo 2: protocol preferences
•Display the contents of file ssl.pcap with tshark, do you see http traffic?
•Use '-o ssl.keys_list:192.168.3.3,443,http,key.pem', do you see http traffic now?
•Which version of OpenSSL is used by the webserver (use '-V' and look at the “Server: <xxx>” http header)
ssl.pcap

#sf18eu • [email protected] • @SYNbit
Demo 3: Saving a selection of packets
•Use tshark with option '-o tcp.desegment_tcp_streams:TRUE' and filter on http
•Now use tshark with option '-o tcp.desegment_tcp_streams:FALSE' and filter on http. - How is this output different from the previous output?
• Execute the same commands again, but now use '-w' to write the output to 3a.pcap and 3b.pcap respectively.
•Read 3a.pcap and 3b.pcap with tshark. - Can you explain the difference?
http.pcap

#sf18eu • [email protected] • @SYNbit
Demo 4: tshark statistics
•Create a protocol hierarchy with '-qz io,phs'. - Which protocols are present in the file?
•Create a ip conversation list with '-qz conv,ip' •Create a tcp conversation list with '-qz conv,tcp' •Create some io statistics with '-qz io,stat,60,ip,tcp,smtp,pop' •Did the previous commands give you an overview of the contents of mail.pcap?
mail.pcap

#sf18eu • [email protected] • @SYNbit
dumpcap
•used by (wire|t)shark ... for privilege separation
• can be used separately • options similar to tshark • fast! only network->disk • stateless! so traces can run forever • ring buffer feature extremely useful:
- dumpcap -i 5 -s0 -b filesize:16384 -files:1024 -w 16gb-ring.pcap

#sf18eu • [email protected] • @SYNbit
capinfos
•display summary of a tracefile • all info vs specific info
•Or in table form with -T
$ capinfos example.pcap File name: example.pcapFile type: Wireshark/tcpdump/... - pcapFile encapsulation: EthernetFile timestamp precision: microseconds (6)Packet size limit: file hdr: 65535 bytesNumber of packets: 2357File size: 921 kBData size: 884 kBCapture duration: 1299.436650 secondsFirst packet time: 2008-01-17 11:37:16.280071Last packet time: 2008-01-17 11:58:55.716721Data byte rate: 680 bytes/sData bit rate: 5443 bits/sAverage packet size: 375.13 bytesAverage packet rate: 1 packets/sSHA256: 3527ce3d6297cf8d735f25092811b4f1…RIPEMD160: 3628f17b67b2d4c1e54fa31c9a438831…SHA1: 54373b7b0536621beeca2cffa2179647…Strict time order: TrueNumber of interfaces in file: 1Interface #0 info: Encapsulation = Ethernet (1 - ether) Capture length = 65535 Time precision = microseconds (6) Time ticks per second = 1000000 Number of stat entries = 0 Number of packets = 2357$
$ capinfos -Tae example.pcap http.pcap mail.pcap File name Start time End timeexample.pcap 2008-01-17 11:37:16.280071 2008-01-17 11:58:55.716721http.pcap 2008-01-17 11:43:09.216077 2008-01-17 11:43:09.263399$
$ capinfos -ae example.pcap http.pcapFile name: example.pcapFirst packet time: 2008-01-17 11:37:16.280071Last packet time: 2008-01-17 11:58:55.716721
File name: http.pcapFirst packet time: 2008-01-17 11:43:09.216077Last packet time: 2008-01-17 11:43:09.263399$

#sf18eu • [email protected] • @SYNbit
editcap (1) : select packets
• select frame ranges or time ranges - editcap -r example.pcap tmp.pcap 1-1000 2001-3000 - editcap -A "2008-01-17 11:40:00" -B "2008-01-17 11:49:59" example.pcap tmp.pcap
• split file in chunks - editcap -c 1000 example.pcap tmp.pcap - editcap -i 60 example.pcap tmp.pcap
• remove duplicate packets - editcap -d example.pcap tmp.pcap

#sf18eu • [email protected] • @SYNbit
editcap (2) : change packets
• change snaplen - editcap -s 96 example.pcap new.pcap
• change timetamps - editcap -t -3600 example.pcap new.pcap
• change link layer type - editcap -T user0 example.pcap new.pcap
• change file type - editcap -F ngsniffer example.pcap new.pcap

#sf18eu • [email protected] • @SYNbit
mergecap
•merge packets in multiple files based on their timestamps - mergecap -w out.pcap in-1.pcap in-2.pcap
• ... or just append the packets from each file - mergecap -a -w out.pcap in-1.pcap in-2.pcap

#sf18eu • [email protected] • @SYNbit
Demo 5: splitting with editcap
•Execute the command 'editcap -i 60 mail.pcap tmp.pcap'. - How many files are created?
•Use 'capinfos -Tcae tmp*' to display a summary of these new files. - Why are the timestamps not exactly 60 seconds apart?
•Remove the 'tmp*' files •Execute the command 'editcap -c 1000 mail.pcap tmp.pcap'.
- How many files are created?
•Use 'capinfos -Tcae tmp*' to display a summary of these new files.
mail.pcap

#sf18eu • [email protected] • @SYNbit
Demo 5: merging with mergecap
•Use 'mergecap -w mail-new.pcap tmp*'. - Is the resulting file exactly the same as mail.pcap?
(tip: use 'cmp <file1> <file2>')
tmp*.pcap

#sf18eu • [email protected] • @SYNbit
Demo 6: editing timestamps
•Adjusting timestamps with editcap - Use 'editcap -t <delta>' to create a new tracefile (tmp.pcap) where the first
packet arrived exactly at 11:39:00 (tip: use '-V -c1' to see the exact timestamp of the first packet). What is your '<delta>'?
- What is the timestamp of the last packet in the new file? Are all packets adjusted with the same '<delta>'?
mail.pcap

#sf18eu • [email protected] • @SYNbit
Getting Help
•Use “<command> -h” for options - ... check once-in-a-while for new features
•Read the man-pages for in-depth guidance - see: http://www.wireshark.org/docs/man-pages/

#sf18eu • [email protected] • @SYNbit
Command line piping
• Linux, MacOS, Unices - Use bash (or other command shell)
•Windows - use Cygwin - use “Linux Bash Shell” (Windows 10) - use powershell commands
(see Graham’s presentation from Sharkfest ’17 Europe)

#sf18eu • [email protected] • @SYNbit
Useful shell commands
•bash internals:|, >, for … do … done, `<command>`
• cut • sort • uniq • tr • sed • awk •q • scripting (sh/perl/python/…)

#sf18eu • [email protected] • @SYNbit
| , > , for … do … done
•Command piping with '|' - ls -1t | head
•Output redirection with '>' - ls -1t | head > 10-newest-files.txt
• Looping with for … do … done - for word in 'one' 'two' 'three'; do echo $word; done

#sf18eu • [email protected] • @SYNbit
`<command>` , variable assignments
•Command evaluation with backtics (``) - for file in `ls -1t | head ̀
do echo $file head -1 $file echo "" done > firstlines.txt
•Variable assignments - backupfile=`echo ${file}.bak`

#sf18eu • [email protected] • @SYNbit
cut
•By character position (-c <range>) - cut -c1-10 /etc/passwd
•By field (-f<index> [-d '<delimiter>'] - cut -d ':' -f1 /etc/passwd

#sf18eu • [email protected] • @SYNbit
sort
•General alphabetic sort (no option) - sort names.txt
•Reverse sorting (-r) - sort -r names.txt
•Numerical (-n) - sort -n numbers.txt
•Or combined: - du -ks * | sort -rn | head

#sf18eu • [email protected] • @SYNbit
uniq
•De-duplication (no option) - sort names.txt | uniq
•Show only 'doubles' (-d) - sort names.txt | uniq -d
•Count occurrences (-c) - sort names.txt | uniq -c

#sf18eu • [email protected] • @SYNbit
tr
•Translate a character(set) - echo "one two" | tr " " "_" - echo "code 217" | tr "[0-9]" "[A-J]" - echo "What is a house?" | tr "aeiou" "eioua"
•Delete a character(set) - echo "no more spaces" | tr -d " " - echo "no more vowels" | tr -d "aeiou" - cat dosfile.txt | tr –d "\015" > unixfile.txt

#sf18eu • [email protected] • @SYNbit
sed
•Stream editor •Very powerful ‘editing language’
•Some simple examples: - deleting text:
sed -e 's/<deleteme>//' - replacing text:
sed -e 's/<replaceme>/<withthis>/' - extracting text:
sed -e 's/^.*\(<keepme>\).*\(<andme>\).*$/\1 \2/‘

#sf18eu • [email protected] • @SYNbit
awk
•Pattern scanning and processing language •Also a very powerful language
•Some examples: - netstat -an | \
awk '$1~"tcp" {print $4}' | \ sort | uniq –c
- … | awk '{printf("%stcp.port==%s",sep,$1);sep="||"}'
#sf18eu • [email protected] • @SYNbit
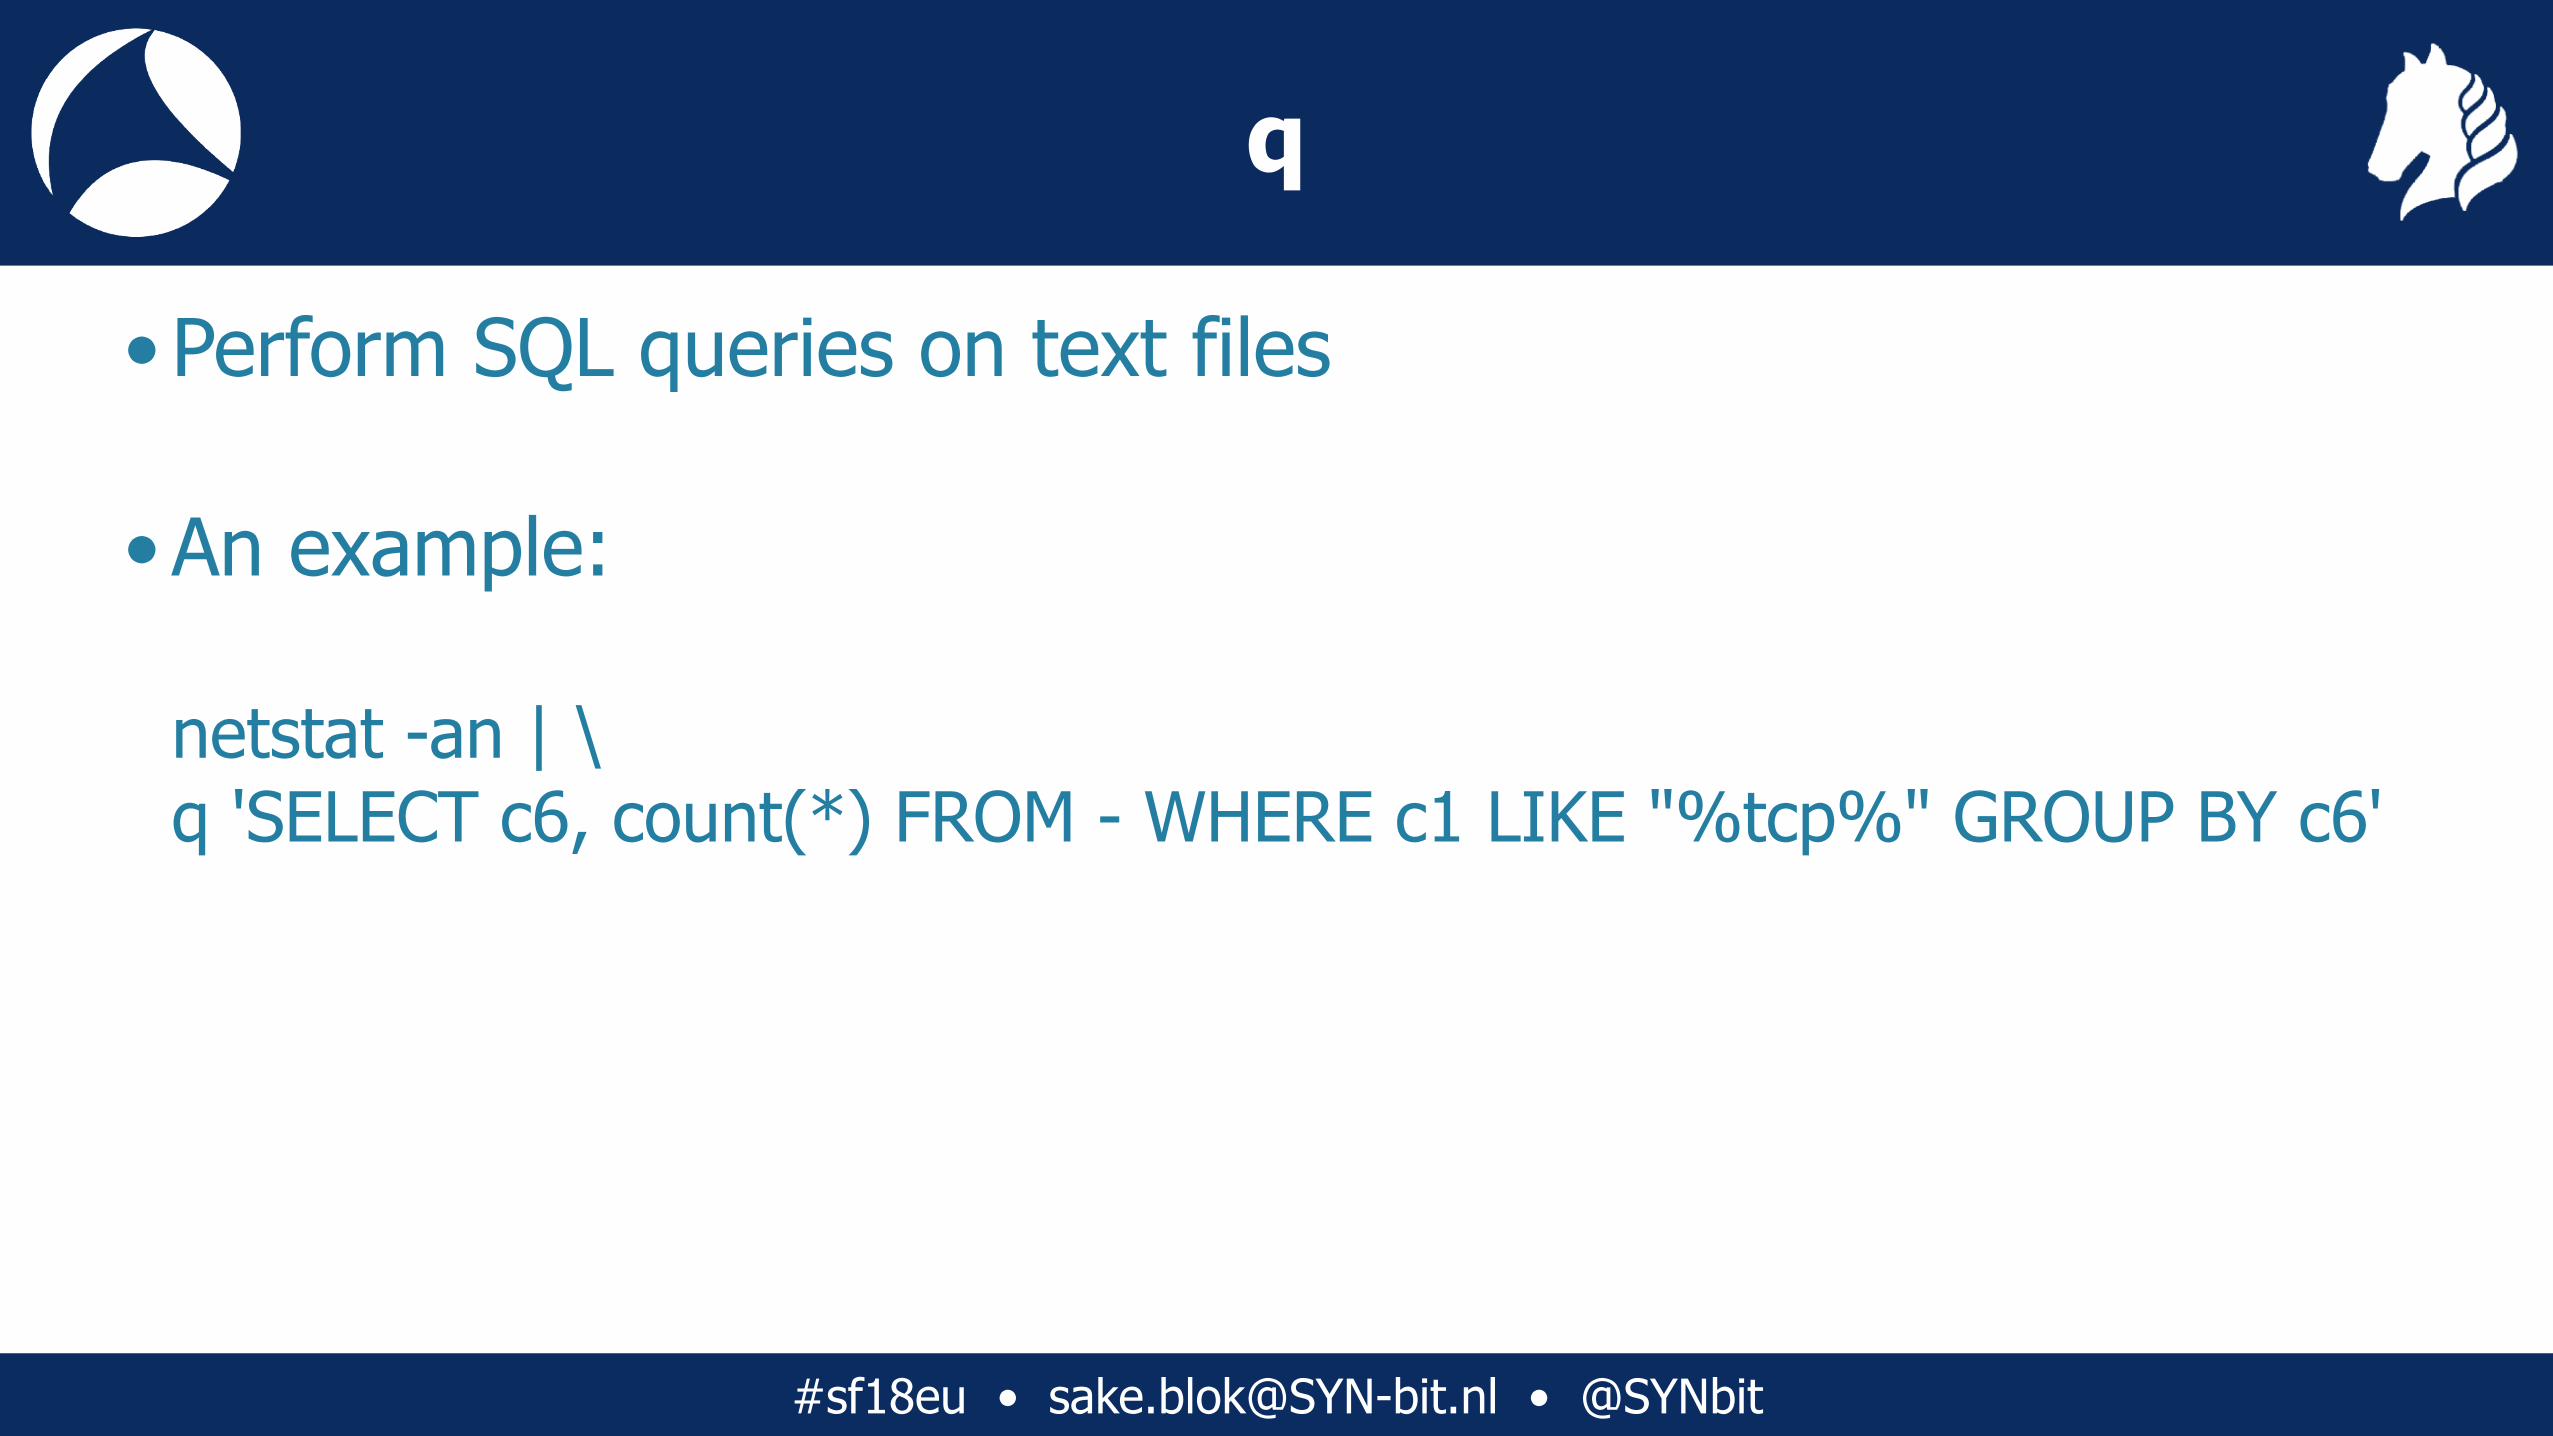
q
•Perform SQL queries on text files
•An example:netstat -an | \q 'SELECT c6, count(*) FROM - WHERE c1 LIKE "%tcp%" GROUP BY c6'

#sf18eu • [email protected] • @SYNbit
scripting
•parsing output when command piping is not enough •automate execution of tshark/dumpcap/mergecap etc •use your own favorite language (sh/perl/python/etc)
•do anything you want :-)

#sf18eu • [email protected] • @SYNbit
Some Cases
•Using command piping - Counting http response codes - Top 10 URL's - All TCP sessions which contain session-cookie XXXX
•Using scripting - All sessions for user XXXX (shell script)
example.pcap

#sf18eu • [email protected] • @SYNbit
Case 1: Counting http response codes (1)
•Problem - I need an overview of http response codes
•Output - table with http response codes & counts
• Input - Capture file with http traffic

#sf18eu • [email protected] • @SYNbit
Case 1: Counting http response codes (2)
•Steps to take - print only http response code - count - make (sorted) table
#sf18eu • [email protected] • @SYNbit
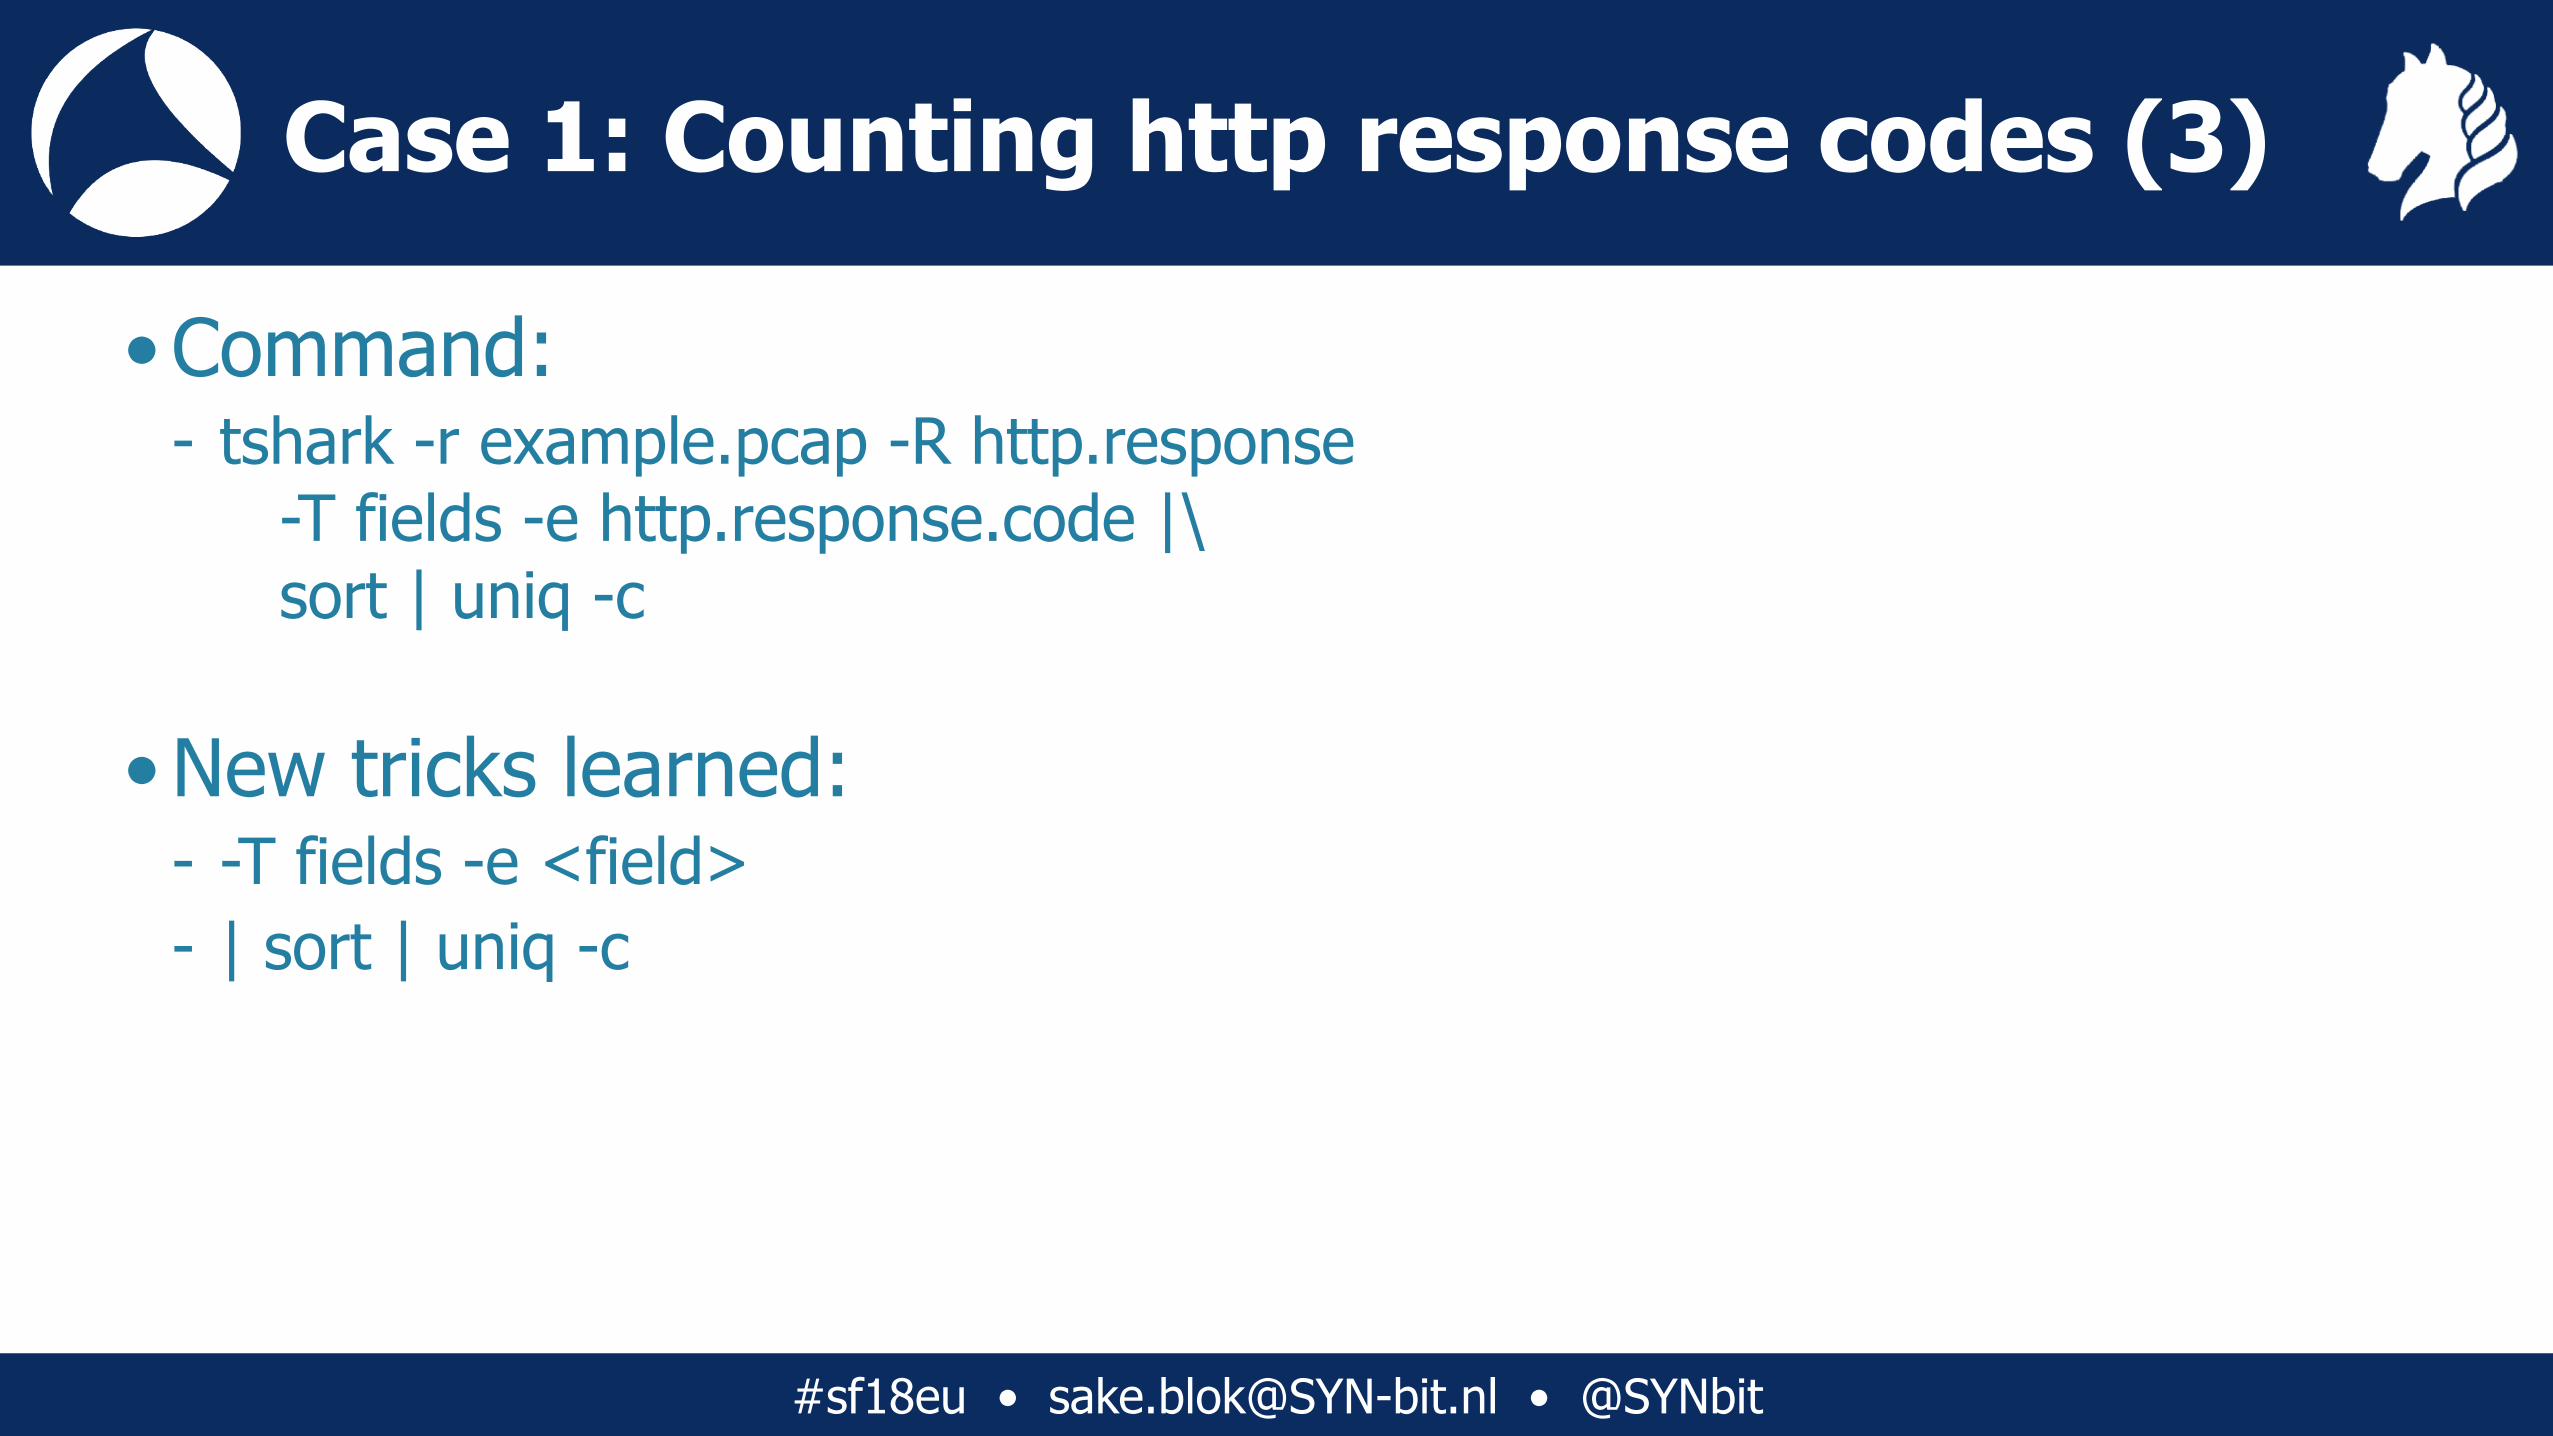
Case 1: Counting http response codes (3)
•Command: - tshark -r example.pcap -R http.response
-T fields -e http.response.code |\ sort | uniq -c
•New tricks learned: - -T fields -e <field> - | sort | uniq -c

#sf18eu • [email protected] • @SYNbit
Case 2: Top 10 requested URL's (1)
•Problem - I need a list of all URL’s that have been visited
•Output - Sorted list with requested URL’s and count
• Input - Capture file with http traffic

#sf18eu • [email protected] • @SYNbit
Case 2: Top 10 requested URL's (2)
•Steps - Print http.host and http.request.uri - Strip everything after “?” - Combine host + uri and format into normal URL - count url’s - make top 10

#sf18eu • [email protected] • @SYNbit
Case 2: Top 10 requested URL's (3)
•Command: - tshark -r example.pcap -R http.request \
-T fields -e http.host -e http.request.uri |\ sed -e 's/?.*$//' |\ sed -e 's#^\(.*\)\t\(.*\)$#http://\1\2#' |\ sort | uniq -c | sort -rn | head
•New tricks learned: - remove unnecessary info : sed -e 's/?.*$//' - transform : sed -e 's#^\(.*\)\t\(.*\)$#http://\1\2#' - top10 : | sort | uniq -c | sort -rn | head
http.request.full_uri

#sf18eu • [email protected] • @SYNbit
Case 3: All sessions with cookie XXXX (1)
•Problem - I know in which “session” a problem exists, but I need all data from that
session to work it out
•Output - New capture file with whole tcp sessions that contain cookie
PHPSESSID=c0bb9d04cebbc765bc9bc366f663fcaf
• Input - Capture file with http traffic

#sf18eu • [email protected] • @SYNbit
Case 3: All sessions with cookie XXXX (2)
•Steps - select packets that contain the cookie - print the tcp stream numbers - create new filter based on the stream numbers - use filter to extract tcp sessions - save packets to a new capture file

#sf18eu • [email protected] • @SYNbit
Case 3: All sessions with cookie XXXX (3)
•Command: - tshark -r example.pcap -w cookie.pcap \
-R `tshark -r example.pcap -T fields -e tcp.stream -R "http.request and http.cookie contains \ "PHPSESSID=c0bb9d04cebbc765bc9bc366f663fcaf\"" |\ awk '{printf(“%stcp.stream==%s",sep,1);sep="||"}‘ ̀
•New tricks learned: - tshark -R `<other command that generated filter>` - awk '{printf("%stcp.stream==%s",sep,$1);sep="||"}'

#sf18eu • [email protected] • @SYNbit
Case 4: All sessions for user XXXX (1)
•Problem - A particular user has multiple sessions and I need to see all sessions from
that user
•Output - New capture file with all data for user xxxx
• Input - Capture file with http data

#sf18eu • [email protected] • @SYNbit
Case 4: All sessions for user XXXX (2)
•Steps - print all session cookies for user XXXX - create new capture file per session cookie
(see example 3) - merge files to new output file

#sf18eu • [email protected] • @SYNbit
Case 4: All sessions for user XXXX (3)
#!/bin/bash
file=$1user=$2
for cookie in `tshark -r $file -R "http.request and http contains $user" \ -T fields -e http.cookie | cut -d ' ' -f2`do tmpfile="tmp_`echo $cookie | cut -d '=' -f 2`.pcap" echo "Processing session cookie $cookie to $tmpfile"
tshark -r $file -w $tmpfile -R `tshark -r $file -T fields -e tcp.stream \ -R "http.request and http.cookie contains \"$cookie\"" | \ awk '{printf("%stcp.stream==%s",sep,$1);sep="||"}'`done
mergecap -w $user.pcap tmp_*.pcaprm tmp_*.pcap

#sf18eu • [email protected] • @SYNbit
Case 4: All sessions for user XXXX (4)
•New tricks learned: - for … do … done - <var>=`echo … | …` - cut -d <FS> -f <x> - mergecap -w <outfile> <infile1> <infile2> …

#sf18eu • [email protected] • @SYNbit
Case 5: show metrics per URI (1)
•Problem - Create an overview of min, avg and max response times per URI
•Output - Overview with "uri, count,min,avg,max"
• Input - Capture file with http data

#sf18eu • [email protected] • @SYNbit
Case 5: show metrics per URI (2)
•Steps - create a text file with all requests - create a text file with all responses - use q to 'join' the files and calculate the statistics

#sf18eu • [email protected] • @SYNbit
Case 5: show metrics per URI (3)
•Command: - tshark -r example.pcap -Y http.request -T fields -E separator=' ' \
-e frame.number -e http.request.uri | sed -e 's/\?.*$//' > req
- tshark -r example.pcap -Y http.response -T fields -E separator=' ' \ -e http.request_in -e http.response.code -e http.time > resp
- q 'SELECT REQ.c2, count(*), min(RESP.c3), avg(RESP.c3), max (RESP.c3) FROM req AS REQ JOIN resp AS RESP ON REQ.c1=RESP.c1 GROUP BY REQ.c2'

#sf18eu • [email protected] • @SYNbit
Case 5: show metrics per URI (4)
•New tricks learned: - use q to combine multiple outputs with JOIN

#sf18eu • [email protected] • @SYNbit
Case 6: Automatic save for one user
•Create a new trace file for a specific pop userthat contains only his pop sessions.
• First get an idea of a typical POP session, use : - tshark -r mail.pcap -R 'tcp.port==64315 and tcp.len>0'
•Use the following steps to create a list of tcp ports used by user 'sake-test2': - Use the filter ' pop.request.parameter=="sake-test2" ' to only
show sessions of user sake-test2 - Add '-T fields -e tcp.stream' to the command to just show the tcp
streams. - Add | awk '{printf("%stcp.stream==%s",sep,$1);sep="||"}' to
mail.pcap

#sf18eu • [email protected] • @SYNbit
Case 6 (continued)
- Now use the output of the previous command between backticks to create the new file:tshark -r mail.pcap -w sake-test2.pcap -R `<previous command>`
- Use 'tshark -r sake-test2.pcap -R pop.request.command==USER' to verify that the new file only contains sessions of user sake-test2. Did we succeed? What went wrong? How can we fix it?

#sf18eu • [email protected] • @SYNbit
Case 7: Automatic save for every user
•Creating a separate trace file for each popuser automatically. - Delete the file sake-test2.pcap
•Create a list of users with the following steps: - Use a filter to only select the packets where the pop command was “USER”
and use '-T fields' to only print the username. - Use '| sort | uniq' to create a list of unique usernames
mail.pcap

#sf18eu • [email protected] • @SYNbit
Case 7 (continued)
- Loop through the list of usernames and create the file per user with:for user in `<command from case XX> ̀do echo $user <command from case XX with $user as variable>done

#sf18eu • [email protected] • @SYNbit
Challenge!
•Create a shell script [or a one-liner ;-)] that produces the following output:
Mail check times for : sake-test111:39:43 : 1 message (2833 octets)11:40:00 : 0 messages (0 octets)11:42:33 : 7 messages (25958 octets)11:45:04 : 6 messages (21538 octets)11:47:37 : 5 messages (17480 octets)11:50:09 : 8 messages (32297 octets)11:52:40 : 5 messages (17017 octets)11:55:13 : 6 messages (21075 octets)11:57:46 : 6 messages (20859 octets)12:00:28 : 7 messages (25416 octets)12:02:49 : 1 message (3677 octets)
Mail check times for : sake-test211:39:44 : 5 messages (14512 octets)11:40:01 : 6 messages (16811 octets)11:42:34 : 5 messages (17568 octets)11:45:05 : 4 messages (8551 octets)11:47:38 : 6 messages (16337 octets)11:50:10 : 2 messages (5396 octets)11:52:42 : 7 messages (20601 octets)11:55:14 : 5 messages (12089 octets)11:57:46 : 4 messages (14463 octets)12:00:22 : 5 messages (15016 octets)12:02:50 : 4 messages (14805 octets)
mail.pcap

#sf18eu • [email protected] • @SYNbit
Summary
•Wireshark comes with powerful CLI tools (tshark, dumpcap, capinfos, editcap, mergecap)
• tshark+scripting can complement GUI
•use little building blocks and combine them

#sf18eu • Imperial Riding School Renaissance Vienna • Oct 29 - Nov 2
Questions?

#sf18eu • Imperial Riding School Renaissance Vienna • Oct 29 - Nov 2
FIN/ACK, ACK, FIN/ACK, ACK
Still questions? [email protected]