sailing blind - iceaaonline.com · sailing blind data driven ... canadian,non‐cost or cost data....
TRANSCRIPT

Sailing Blind DataDriven Estimating at the Concept Phase, a Case Study of Canada’s Joint Support Ship Project
Abstract In 2012, the Canadian Parliamentary Budget Officer (PBO) was asked to assess the feasibility of
the $2.6 billion budget that had been earmarked for the Royal Canadian Navy to purchase two Joint Support Ships (JSS) to replace Canada’s aging Protecteur‐class Auxiliary Oiler Replenishment ships. This paper reflects on that experience.
When first announced in 2004, the JSS program’s budget was $2.1 billion. None of the shipbuilders competing for the contract returned compliant bids because the budget was too low. As a result, in 2010, the program was re‐baselinedwith a new statement of requirement and increased budget of $2.6 billion.
In 2011, construction of the ship was awarded to Seaspan Marine Corporationas part of Canada’s National Shipbuilding Procurement Strategy (NSPS). The NSPS commits the Canadian government to procuring ships for the Royal Canadian Navy and Coast Guard from Seaspan Marine on the West coast and Irving Shipbuilding on the East. The idea behind the strategy is to reinvigorate the Canadian shipbuilding industry by ensuring a consistent flow of throughput to the shipyards, avoiding boom and bust.
Very little data was available for the PBO to assess the feasibility of the $2.6 billion budget. The Navy has not settled on a design or requirements. There is no comparable, contemporary, Canadian,non‐cost or cost data. Seaspan’s Vancouver Shipyards has never built anything to military specification, and the largest vessel it has built is a ferry.
The PBO relied on Price Systems’ TruePlanning to estimate cost. TruePlanning is a proprietary model normally used by estimating at the individual subsystem level. This was not possible in the case of the JSS due to the datalimitations and absence of any work breakdown structure. Instead, the PBO used TruePlanning in an innovative way, modelling cost at the systems engineering and project management (SE/PM) and production levels. While estimating in this way presents challenges and limitations, the approach allowed the PBO to achieve its objective of assessing the feasibility of the $2.6 billion budget envelope.
1
Presented at the 2013 ICEAA Professional Development & Training Workshop - www.iceaaonline.com
Table of Contents Abstract......................................................................................................................................................... 1
Background ................................................................................................................................................... 3
Methodology.................................................................................................................................................5
Weight....................................................................................................................................................... 7
Technology................................................................................................................................................7
Manufacturing Complexity for Structure.............................................................................................. 7
Percent of New Structure ...................................................................................................................10
Percent Design Repeat for Structure ..................................................................................................11
Engineering Complexity ......................................................................................................................11
Schedule..................................................................................................................................................14
Summary of Results ....................................................................................................................................15
Validity ........................................................................................................................................................17
Discussion ...................................................................................................................................................19
List of Figures Figure 1: Manufacturing Complexity vs Acquisition Cost per Unit Weight .................................................. 9 Figure 2: RAND's Productivity Curve by Technical Skill, Build & Support ...................................................14 Figure 3 ‐ JSS Risk‐Adjusted Results ............................................................................................................17 Figure 4 ‐ Cost per kg Cross‐check ..............................................................................................................18
List of Tables Table 1: Normalized Data.............................................................................................................................. 8 Table 2: Calibration Results .......................................................................................................................... 9 Table 3: Engineering Complexity Values.....................................................................................................11 Table 4 ‐ Point Estimates (billions)..............................................................................................................15 Table 5 ‐ Total Cost Cross‐check (CDN TY$) ................................................................................................18
2
Presented at the 2013 ICEAA Professional Development & Training Workshop - www.iceaaonline.com

Background
In 2004, the Government of Canada announced that it would replace the Royal Canadian Navy’s Protecteur‐class Auxiliary Oiler Replenishment (AOR) ships. Three Joint Support Ships (JSS) were proposed, with a contract to be awarded in 2008, the first ship delivered in 2012, and the project completed in 2016.1 The Government allocated $2.1 billion to design, develop, and acquire the three ships.2
A letter was issued in February 2005 inviting companies to express interest in the project.3 Four industry teams were pre‐qualified to compete.4 The Government issued a request for proposals (RFP) on July 1, 2006.5
The acquisition budget for the project was set at $2.1 billion accompanied by a $0.8 billionservice contract allotment.
In the project definition phase, two teams—ThyssenKrupp Marine Systems AG (TKMS) and SNC‐Lavalin Profac Inc.—were each awarded a $12.5 million contract to produce and deliver an implementation proposal consisting of a preliminary ship design, a project implementation plan, and an in‐service support plan. Those proposals were then evaluated to determine which demonstrated the best value.
In August 2008, the Government terminated the JSS project as both proposals were deemed to be non‐compliant with the terms of the RFP. One team submitted a proposal for only two ships while the other’s proposal was significantly over budget.6
In July 2010, DND issued background materials on a second attempt at the JSS project. The number of ships was reduced to two, delivery dates pushed out, and requirements changed.7
The new budget was set at “approximately $2.6 billion” in fixed nominal dollarsinclusive of taxes.8This means that the Government plans to make $2.6 billion available to design and build the ship, with no further adjustments for inflation.
1 Treasury Board of Canada Secretariat, 2008‐2009 Reports on Plans and Priorities: National Defence, (2008), online: Treasury Board of Canada Secretariat <http://www.tbs‐sct.gc.ca/rpp/2008‐2009/inst/dnd/dnd‐eng.pdf>. 2Sarah Gilmour, Domestic Stories: JSS and Amphibious Ships Working Together: the Navy Plans for Future Additions (23 November 2005), online: Royal Canadian Navy <http://www.navy.forces.gc.ca/cms/3/3‐a_eng.asp?category=7&id=481>. All figures are quoted in Canadian dollars. 3 MERX, Letter of Interest (LOI) Joint Support Ship (JSS) Project (25 February 2005), online: MERX <http://www.merx.com/English/SUPPLIER_Menu.asp?WCE=Show&TAB=1&PORTAL=MERX&State=7&id=PW‐%24%24ML‐007‐11171&src=osr&FED_ONLY=0&ACTION=PAGE2&rowcount=13&lastpage=2&MoreResults=&PUBSORT=0&CLOSESORT=0&IS_SME=&hcode=yS%2fQ1u%2bzKuWWKi14TbGEXQ%3d%3d>. 4 MERX, Project Definition for the Joint Support Ship (JSS) (28 June 2006), online: MERX <http://www.merx.com/English/SUPPLIER_Menu.asp?WCE=Show&TAB=1&PORTAL=MERX&State=7&id=PW‐%24%24MD‐007‐13671&src=osr&FED_ONLY=0&ACTION=PAGE1&rowcount=13&lastpage=2&MoreResults=&PUBSORT=0&CLOSESORT=0&IS_SME=&hcode=5A%2fMIWQ3g3JPg76I0MYcpg%3d%3d>. 5Ibid. 6 Defense Industry Daily, Canada’s C$ 2.9B “Joint Support Ship” Project, Take 2 (13 October 2010) online: Defense Industry Daily <http://www.defenseindustrydaily.com/canada‐issues‐rfp‐for‐cdn‐29b‐joint‐support‐ship‐project‐updated‐02392/>. 7National Defence and the Canadian Forces, Internal Audit of Joint Support Ship (JSS) Project (November 2011), online: National Defence and the Canadian Forces <http://www.crs‐csex.forces.gc.ca/reports‐rapports/2011/176P0934‐eng.aspx#bg>.
3
Presented at the 2013 ICEAA Professional Development & Training Workshop - www.iceaaonline.com

This budget includes all costs associated with the procurement, including: salaries, contributions to employee benefits and pensions, project management, contracts, design fees, licensing fees, industrial and regional benefits management, construction, quality assurance, contingency, and all applicable taxes (approx. 13%).
DND started by assessingthen existing designsfor vessels operating within a NATO Navy and meeting a minimumset of Canadian requirements.
In October 2010, an advanced contract award notice (ACAN)9 was posted on the MERX procurement board announcing that the government had found only two suitable designs: ThyssenKrupp Marine Systems’ Berlin Class and Navantia S.A.’s Cantabria Class.10
TKMSwas provided with $3.65 million to assess the risk of implementing the changes to make the Berlin meet the SOR.Once TKMS successfully completed this work, it was awarded an additional amount to undertake design development activities (DDA).
While the Cantabria also met the requirements, the Navy was unable to reach an agreement with Navantia.
Concurrently, the Navy contracted with BMT Fleet Technology (BMT)—a wholly owned subsidiary of BMT Group Ltd—to develop a “clean sheet” design. BMT was provided $9.8 million for this work.11
DND will evaluate the two designs and select one prior to signing the design and build contract with Seaspan.12 Seaspan will then complete the production design and build the ships.13
At the time of publication, both TKMSand BMT were nearing completion of their DDA, and thus, no decision had yet been made as to the final design for the JSS.
Once built, the JSS will replace the Navy’s current AOR vessels—the Protecteur and the Preserver. These ships have been in operation for more than 40 years and are nearing the end of their service lives. 8 National Defence and the Canadian Forces, New Releases, NR‐10.074, “Government of Canada to Acquire New Joint Support Ships” (14 July 2010) online: National Defence and the Canadian Forces <http://www.forces.gc.ca/site/news‐nouvelles/news‐nouvelles‐eng.asp?cat=00&id=3463>. While a budget of $2.33 billion is indicated, officials from DND have confirmed that a contingency of $0.30 billion has been allocated as well, bringing the total budget to $2.63 billion. 9 An advanced contract award notice is a contracting vehicle used by the Government of Canada to expedite the procurement process typically used when it is believed that only one supplier is capable of meeting the procurement requirements. Notice is posted for no less than 15 calendar days to allow other parties to indicate if they would be able to meet the requirement. In this case, presumably, an ACAN was used to confirm that only two NATO ship designs met the requirements for the JSS. Refer to: Treasury Board of Canada Secretariat, Guide for Managers ‐ Best Practices for Using Advance Contract Award Notices (ACANS) (January 2004), online: Treasury Board of Canada Secretariat <http://www.tbs‐sct.gc.ca/pubs_pol/dcgpubs/contracting/acan_guide01‐eng.asp>. 10 MERX, JSS Military Off The Shelf Designs – ACAN (8 August 2010), online: MERX <http://www.merx.com/English/SUPPLIER_Menu.asp?WCE=Show&TAB=1&PORTAL=MERX&State=7&id=PW‐%24JSS‐002‐20533&src=osr&FED_ONLY=0&ACTION=PAGE1&rowcount=13&lastpage=2&MoreResults=&PUBSORT=0&CLOSESORT=0&IS_SME=&hcode=IuUnwQfOD07ZwV3oZBOgdQ%3d%3d>. 11 BMT, BMT Fleet Technology begins design work for Canada's Joint Support Ship (23 February 2011), online: BMT <http://www.fleetech.com/News/?/1705/0/781>; BMT, BMT Fleet Technology Continues Development of the Contract Design Option for Canada’s Joint Support Ship (15 March 2012), online: BMT <http://www.fleetech.com/News/?/1705/0/972>. 12 MERX, JSS MILITARY OFF THE SHELF DESIGNS (25 January 2012), online: MERX <http://www.merx.com/English/SUPPLIER_Menu.asp?WCE=Show&TAB=1&PORTAL=MERX&State=8&id=1069046&src=osr&FED_ONLY=0&PrevStateId=2&ACTION=&rowcount=&lastpage=&MoreResults=&hcode=AiiatAn%2fzsvKKZwFuLvsRg%3d%3d>. 13 Public Works and Government Services Canada, Joint Support Ship (JSS) Project (25 May 2011), online: <http://www.tpsgc‐pwgsc.gc.ca/app‐acq/stamgp‐lamsmp/nsi‐jss‐eng.html>.
4
Presented at the 2013 ICEAA Professional Development & Training Workshop - www.iceaaonline.com

It is hoped the new JSS will provide core replenishment, underway medical‐support to naval task groups, limited sealift capabilities, and limited support to forces ashore.14
In June 2010, the Government announced Canada's National Shipbuilding Procurement Strategy (NSPS).15 The NSPS aims to create a robust domestic shipbuilding industry to help the Government achieve its objectives for the Navy and Coast Guard. It seeks to develop a longer‐term, strategic relationship between government and industry by pledging the construction of vessels exclusively to two shipyards.16In October 2011, the selection was announced: Seaspan’s Vancouver Shipyards and Irving Shipbuilding in Halifax.17 In February 2012, the government and shipyards signed umbrella‐agreements.18 By and large, these agreements are not binding. The only exception to this is a provision that outlines how the shipyards are to be compensated should the Government eliminate or reduce its planned procurements.19In due course, separate, binding, individual contracts for each class of ship will be signed.
In the summer of 2012, two Members of the Canadian House of Commons (Parliament)requestedthat the Parliamentary Budget Officer (PBO)assess the sufficiency of this revised budget. Members of the House of Commons are entitled, by law, to such analysis.
Methodology Faced with the legislative obligation to assess the feasibility of the $2.6 billion envelope, the PBO set out to estimate the cost of designing and building two JSSs.
There are four main approaches to costing: analogy, parametric, build‐up, and expert opinion.
In cost estimating, the phase of the project and the availability of data drive methodology selection. Given that the JSS is still in early design phase (meaning that detailed specifications and actual costs are unavailable) and there are no recent, analogous Canadian acquisitions, parametric modeling is the most appropriate method for estimating cost. The methodology was developed in line with GAO best
14 The project has four main deliverables: (1) design of a new class of ship; (2) construction of two ships, with an option for a third; (3) provision of the necessary infrastructure and other logistics support to facilitate the transition of the new ships into service; and (4) in‐service support contract to provide maintenance, repair and overhaul, long‐term spares, and technical support for the life of the ships. National Defence and the Canadian Forces, Joint Support Ship (JSS) (8 August 2011), online: National Defence and the Canadian Forces <http://www.forces.gc.ca/aete/jointsupportshipjss‐projetdunaviredesoutieninterarmeesnsi‐eng.asp>; National Defence and the Canadian Forces, Backgrounder: Canada First Defence Strategy (12 May 2008), online: National Defence and the Canadian Forces <http://www.forces.gc.ca/site/news‐nouvelles/news‐nouvelles‐eng.asp?cat=00&id=2645>. 15 Public Works and Government Services Canada, National Shipbuilding Procurement Strategy (NSPS) (27 July 2011), online: Public Works and Government Services Canada <http://www.tpsgc‐pwgsc.gc.ca/app‐acq/sam‐mps/snacn‐nsps‐eng.html>. 16National Defence and the Canadian Forces (12 May 2008), supranote14; Public Works and Government Services Canada, supra note 15. 17 Public Works and Government Services Canada, Results of the National Shipbuilding Procurement Strategy (19 October 2011), online: Canada News Centre, <http://news.gc.ca/web/article‐eng.do?mthd=tp&crtr.page=1&nid=629989>. These shipyards would be designated as sources of supply for large vessels (1000 tonnes displacement or more): one for combat vessels, including the Canadian Surface Combatant (CSC) and Arctic/Offshore Patrol Ships (AOPS), and one for non‐combat vessels, such as the JSS. 18 Public Works and Government Services Canada, Canada Signs Long‐term Agreements with NSPS Selected Shipyards (15 February 2012), online: Canada News Centre <http://news.gc.ca/web/article‐ng.do?nid=656979>. 19Government of Canada, Umbrella Agreement Between Vancouver Shipyards Co Ltd and Seaspan Marine Corporation and Her Majesty the Queen in right of Canada, as represented by the Minister of Public Works and Government Services (Ottawa: National Shipbuilding Procurement Strategy, 2012) at s 6.9.
5
Presented at the 2013 ICEAA Professional Development & Training Workshop - www.iceaaonline.com

Ground Rules and Assumptions
The estimate:
•ncludes development and production costs
•ssumes multiple site development with poor communication
•ssumes high vendor interface and supervision requirements
•ssumes Mobile Military Ship operating specification
•s calculated in then‐year Canadian dollars
•ssumes 2.0% annual escalation (target inflation)
•ssumes one prototype and one production system
•ssumes development begins March 1, 2014
•ssumes development first article (prototype) is delivered by April 30 2018
practices and followed the GAO 12‐step estimating approach outlined in the GAO Cost Estimating and Assessment Guide: Best Practices for Developing and Managing Capital Program Costs20.
Developing and validating a parametric model requires a significant investment of time and access to a data set of historical costs, a task both far beyond the resource capacity of the PBO’s 19 person office. As such, the PBO relied on Price Systems’TruePlanning®.
TruePlanning was the tool ultimately selected by the PBO for a number of reasons. The primary reason was the feedback from industry on the support we could expect from PRICE Systems. PRICE’s reputation for exceptional customer support was echoed by many of our key industry contacts. We were confident that we could produce credible results with the guidance of PRICE consultantsbecause PRICE customers are using TruePlanning in government, aerospace, defense and automotive industries. Another attractive feature is the calibration capabilities of PRICE TruePlanning. Finally, we found the ability to estimate at any level of indenture with regard to the system being estimated to be invaluable. The flexibility of the modeling architecture in TruePlanning was key to developing the methodology for estimating the cost of the JSS.
In order to run TruePlanning®, however, programmatic specific data is required to inform the inputs.As discussed above, very littledata on the JSS existed. At the time of modelling, the Navy had not settled on any solid design parameters and the selected shipyard had not built anything of comparable size or complexity.
Because of these significant data limitations, the team had to adopt a different approach. While TruePlanning® is normally run at the subsystem level (often, with up to 400 separate systems being costed), the unavailability of data made this impossible. Instead, the PBO ran the model at a very high level, adopting a two box approach, box one being systems engineering and project management and box two being production.
20 United States Government Accountability Office, GAO Cost Estimating and Assessment Guide: Best Practices for Developing and Managing Capital Program Costs (March 2009), online: GAO <http://www.gao.gov/assets/80/77175.pdf>.
6
Presented at the 2013 ICEAA Professional Development & Training Workshop - www.iceaaonline.com

The absence of data made even running the model at this high level difficult. The PBO selected five key inputs from among many to best represent the ship, working within the constraints of available data and known requirements. All other inputs were left at “nominal” or industry average.
The core model inputsare weightand technology. Technology is represented by manufacturing complexity for structure, percent of new structure, percent of design repeat, engineering complexity, and schedule. These inputs, and the values adopted, are described below.
Weight Weight refers to the ship’s displacement. The larger the ship is, the more it is likely to cost to design and build. The PBO adopted the weight of the Protecteur for its point estimate.
Technology Technology is a measure of how complicated constructing the platform is; for example, a ship is more complex than a car, but less complex than a fighter jet.
For the JSS, technologyis represented across fourselected key components:
1. Manufacturing complexity for structure
2. Percent of new structure
3. Percent design repeat for structure
4. Engineering complexity
These variables are defined and discussed below.
Manufacturing Complexity for Structure Manufacturing complexity for structurereflects the complexity of the technology involved,21 its producibility (material machining and assembly tolerances, machining difficulty, surface finish, etc.), and its yield.22
This input posed the greatest methodological challenge. Usually, manufacturing complexity for structure and manufacturing complexity for electronics are input separately, and the resulting costs are based on the weights and complexities of each structural component. Since the available data did not differentiate between the weight of structure and the weight of electronics and the PBO had no work breakdown structure, it was necessary to arrive at a combined complexity value. The PBO used a complexity value derived from the calibrated complexity values for a number of logistics support ships.
21 Technology represents the impact to all of the component’s manufacturing operations including material, labour, process, equipment, etc. 22 During any manufacturing operation, there will be some components or sub‐assemblies which may have to be reworked or scrapped, requiring additional material and labour resources. This is more predominant in prototype than in the production ship. For example, if the yield is 50% in prototype, it means the builder would need to spend twice as much on material and labour.
7
Presented at the 2013 ICEAA Professional Development & Training Workshop - www.iceaaonline.com
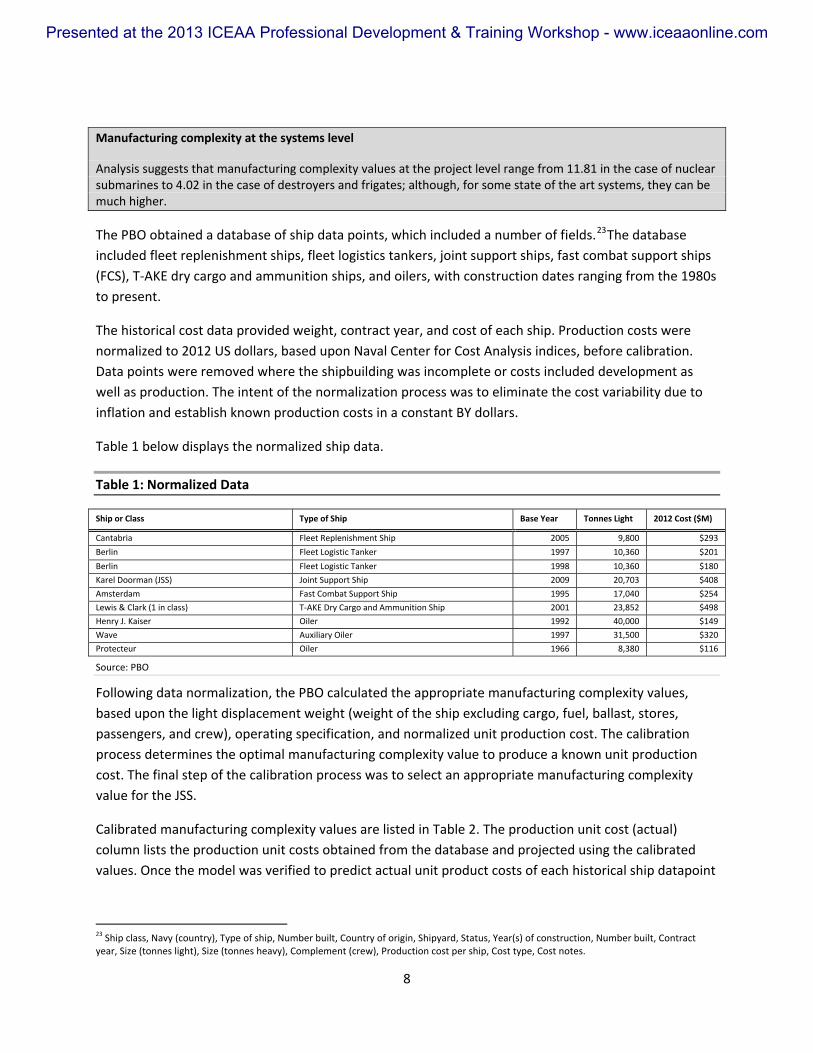
Manufacturing complexity at the systems level
Analysis suggests that manufacturing complexity values at the project level range from 11.81 in the case of nuclear submarines to 4.02 in the case of destroyers and frigates; although, for some state of the art systems, they can be much higher.
The PBO obtained a database of ship data points, which included a number of fields.23The database included fleet replenishment ships, fleet logistics tankers, joint support ships, fast combat support ships (FCS), T‐AKE dry cargo and ammunition ships, and oilers, with construction dates ranging from the 1980s to present.
The historical cost data provided weight, contract year, and cost of each ship. Production costs were normalized to 2012 US dollars, based upon Naval Center for Cost Analysis indices, before calibration. Data points were removed where the shipbuilding was incomplete or costs included development as well as production. The intent of the normalization process was to eliminate the cost variability due to inflation and establish known production costs in a constant BY dollars.
Table 1 below displays the normalized ship data.
Table 1: Normalized Data
Ship or Class Type of Ship Base Year Tonnes Light 2012 Cost ($M)
Cantabria Fleet Replenishment Ship 2005 9,800 $293
Berlin Fleet Logistic Tanker 1997 10,360 $201
Berlin Fleet Logistic Tanker 1998 10,360 $180
Karel Doorman (JSS) Joint Support Ship 2009 20,703 $408
Amsterdam Fast Combat Support Ship 1995 17,040 $254
Lewis & Clark (1 in class) T‐AKE Dry Cargo and Ammunition Ship 2001 23,852 $498
Henry J. Kaiser Oiler 1992 40,000 $149
Wave Auxiliary Oiler 1997 31,500 $320
Protecteur Oiler 1966 8,380 $116
Source: PBO
Following data normalization, the PBO calculated the appropriate manufacturing complexity values, based upon the light displacement weight (weight of the ship excluding cargo, fuel, ballast, stores, passengers, and crew), operating specification, and normalized unit production cost. The calibration process determines the optimal manufacturing complexity value to produce a known unit production cost. The final step of the calibration process was to select an appropriate manufacturing complexity value for the JSS.
Calibrated manufacturing complexity values are listed in Table 2. The production unit cost (actual) column lists the production unit costs obtained from the database and projected using the calibrated values. Once the model was verified to predict actual unit product costs of each historical ship datapoint
23 Ship class, Navy (country), Type of ship, Number built, Country of origin, Shipyard, Status, Year(s) of construction, Number built, Contract year, Size (tonnes light), Size (tonnes heavy), Complement (crew), Production cost per ship, Cost type, Cost notes.
8
Presented at the 2013 ICEAA Professional Development & Training Workshop - www.iceaaonline.com

based on calibration, development and SE/PM costs were extrapolated from the same calibration database.
Table 2: Calibration Results
Cost Object N
ame
Cost Object C
ustom Nam
e
Manufacturing
Com
plexity for Structure
Weight o
f Structure (lb)
Develop
men
t Cost (Estimated
)
Prod
uction
Cost (Actual)
System Folder JSS CalibrationHardware Component Cantabria 4.13 21,599,200 1,355,957,525$ 293,580,924$ Hardware Component Berlin 3.71 44,608,960 1,529,768,917$ 201,268,043$ Hardware Component Berlin(2) 3.67 44,608,960 1,463,061,180$ 179,772,710$ Hardware Component Karel Doorman (JSS) 3.99 45,629,164 2,043,902,043$ 408,158,202$ Hardware Component Amsterdam 3.86 37,556,160 1,570,897,691$ 253,779,518$ Hardware Component Lewis & Clark 4.03 52,569,808 2,333,265,242$ 497,414,846$ Hardware Component Henry J. Kaiser(2) 3.39 88,160,000 1,781,233,214$ 148,851,420$ Hardware Component Wave(2) 4.25 63,563,189 3,276,716,539$ 975,502,209$ Hardware Component Protecteur 3.78 18,771,200 881,608,890$ 115,890,891$
Min 3.39 Median 3.89 Max 4.25 Selected Value (Protecteur) 3.78
Source: TruePlanning®
Figure 1belowdepicts the exponential relationship between manufacturing complexity and the unit cost per weight of all the known ship data points, with an R‐squared value of 89%. The manufacturing complexity values varied from 3.39 to 4.25 with a median value of 3.9.The range of manufacturing complexities for the ships was relatively tight compared to the ranges of manufacturing complexity for different platforms noted above. The U.S. Henry J. Kaiser class fleet oiler (a relatively simple oiler carrying victuals) had the lowest manufacturing complexity coming in at 3.39, and the U.K. Wave Knight class tanker had the highest coming in at 4.25. The Protecteur was in the mid to low range, with a manufacturing complexity of 3.78.
Figure 1: Manufacturing Complexity vs Acquisition Cost per Unit Weight
9
Presented at the 2013 ICEAA Professional Development & Training Workshop - www.iceaaonline.com

Source: TruePlanning®
The PBO selected the Protecteur ship’s calibrated complexity value of 3.78 (Table 2) in returning its point estimate, as this was determined to be the most conservative estimate of the JSS complexity value. The JSS will, at a minimum, be similar to the Protecteur. Costing a direct replacement of the Protecteur, therefore, provided a defensible approach. Further, the Protecteur’s complexity falls near the median of the boundary of analogous ship data points as illustrated in
Figure 1.
Percent of New Structure Percent of new structure represents the amount of new structural design effort needed to complete the project. It may be less than 100% where old designs are adapted and reused in the new design.
Reusing Designs
Reusing designs sometimes makes sense, as it can reduce the amount of design work necessary. As such, although each ship type is a unique overall design in terms of size, shape and volume, ships may contain some designs from previous ships.
Reusing designs, however, does not mean that a ship will require no new design effort. In fact, reusing existing design may also require design effort, as old designs are adapted to new requirements.24
The team finally selected to design the JSS may reuse some design components from earlier projects. Even where this is so, however, it is likely that redesign will be required to adapt reused designs to Canadian operational requirements and make construction in a Canadian shipyard possible.25
The PBO adopted a value of 85% of new structure. This reflects the fact that any existing design will require significant redesign in order to ensure it responds to Canadian requirements and can be built in
24 Note that it is possible that using old designs may actually result in more design effort being required as a result of trying to adapt an existing design ill‐suited to new requirements. Note as well that subject matter experts familiar with TruePlanning® confirmed that they have never come across a new ship that requires no new design effort. 25 For example, TKMS would have to change the existing design of the Berlin Class’s electrical system to accommodate North American standards for voltage and amperage, add two goalposts (refueling masts), and adapt its design to modular construction significantly smaller than those used in Germany. This will require significant new design effort.
10
Presented at the 2013 ICEAA Professional Development & Training Workshop - www.iceaaonline.com

a Canadian shipyard. This figure was corroborated by examining Work Breakdown Structure (WBS) library and consulting with SMEs, members of PRICE’s team and members of the Review Panel.26
Percent Design Repeat for Structure Percent of design repeat is determined by the ratio of redundant hardware to unique hardware.
Repeating Design
Assume that a gearbox has ten gears, five of which are identical.The component has a redundant hardware input of 4. Design repeat is 40% (4 of 10 gears are redundant).
The PBO adopted 40% design repeat for structure, reflecting the fact that there will be some, but not complete, symmetry in the design of the ship.
Engineering Complexity Engineering complexity reflects the experience and qualifications of the engineering design team.
Itdepends on two factors:
1. Scope of design effort
2. Experience of personnel
Scope of design effort describes the newness of the design task and the sophistication of the technology.
The JSS was determined to be a new design with existing technology because the ship is a unique build of currently existing technology. The PBO assumed a design team that has mixed experience. This reflects a value of 1.1.
Table 3: Engineering Complexity Values
Experience of Personnel
Scope of Design Effort Extensive, Fam
iliar
Prod
uct
Normal, Fa m
iliar
Prod
uct
Mixed
, Som
e
Prod
uct F
amiliarity
Limite
d, Unfam
iliar
Prod
uct
Simple Modification, Existing Design 0.2 0.3 0.4 0.5
Extensive Modification, Existing Design 0.6 0.7 0.8 0.9
New Design, Existing Technology 0.9 1 1.1 1.2
New Design, New Product Line 1 1.2 1.4 1.6
New Design, Unfamiliar Technology 1.3 1.6 1.9 2.2
26 The WBS revealed that approximately 22% of its elements could be taken from existing design libraries. This results in 78% of design being created from scratch. That does not mean, however, that the 22% would require no redesign effort. Adapting these designs to ensure they comply with Canadian operating requirement and can be executed in a Canadian shipyard will require additional design effort.
11
Presented at the 2013 ICEAA Professional Development & Training Workshop - www.iceaaonline.com

New Design, State of Art Technology 1.9 2.3 2.7 3.1
Source: TruePlanning®
In selecting the value for experience of personnel, it was necessary to capture the realities of building in a shipyard whose expertise was in a different class of vessels. Many users of TruePlanning have years of corporate data upon which to base productivity assumptions. In this case, the PBO had only qualitative data that explained the experience of the yard and the work being done to increase its capacity. It was therefore necessary to establish a crosswalk between the qualitative data and the quantitative inputs used in TruePlanning.
As a privately held company, there was limited data publicly available on the capabilities and productivity of Seaspan’s Vancouver Shipyards. The assessment undertaken by First Marine International27 as part of the NSPS bid competition addressed the needs of the NSPS bid process, but revealed no usable information with respect to the cost implications of building in the yard. Therefore, the PBO opted to contract with researchers who developed an overview of the yard, its present capabilities, and the actions being taken to build the capacity to build ships in the non‐combat work package.
The results of this capacity analysis were largely qualitative.28 The shipyard’s CV includes numerous barges and ferries, but no ships of the size or complexity of the JSS. In order to meet the demands of the NSPS, the shipyard is developing partnerships with a Korean shipyard to obtain logistical expertise, with local training colleges to locate appropriate human resources, and has planned numerous infrastructure upgrades. It was necessary to find a method of adjusting the estimate to reflect the readiness of the shipyard.
TKMS has designed and built a ship of this nature before. BMT has not. In this case, however, the finalist selected would only form part of the design team. In addition, it will be composed of Seaspan and a third party. Thus, the personnel of at least two of the parties involved will have no project‐specific experience. And, even if TKMS is selected, its personnel do not haveproject‐specific experience designing and manufacturing in Canadian shipyards.
The PBO assumed a design team that has mixed experience. However, it was important to further validate this input in light of theaggressive human resources strategy being implemented by Seaspan. The shipyard planned to find experienced trades‐people, and there was some suggestion that these trades‐people would quickly reach optimal productivity29. However, this hypothesis was not supported in the literature.
RAND surveyed employee technical skills as part of a study on UK naval industrylabour force. Based on its survey, it took technical workers between 6 and 8 years to reach 90% optimum productivity (see
27 The Government of Canada contracted First Marine International to undertake assessments of all shipyards bidding for the NSPS work packages. The assessments are commercial confidence. 28Capacity Analysis of the Vancouver Shipyards was published as an annex to PBO’s report, which can be found online at: http://www.pbo‐dpb.gc.ca/files/get/publications/252?path=%2Ffiles%2Ffiles%2FJSS_EN.pdf29Ibid.
12
Presented at the 2013 ICEAA Professional Development & Training Workshop - www.iceaaonline.com

Figure 2).30“This is important to understand because simply employing a worker in a specific technical skill does not intrinsically equate to possessing the associated workforce capability—experience is critical in ensuring that the technical skill becomes a productive capability.”31
30 Hans Pung et al, Sustaining Key Skills in the UK Naval Industry (Santa Monica, CA: RAND Corporation, 2008) at 35. 31Ibid.
13
Presented at the 2013 ICEAA Professional Development & Training Workshop - www.iceaaonline.com
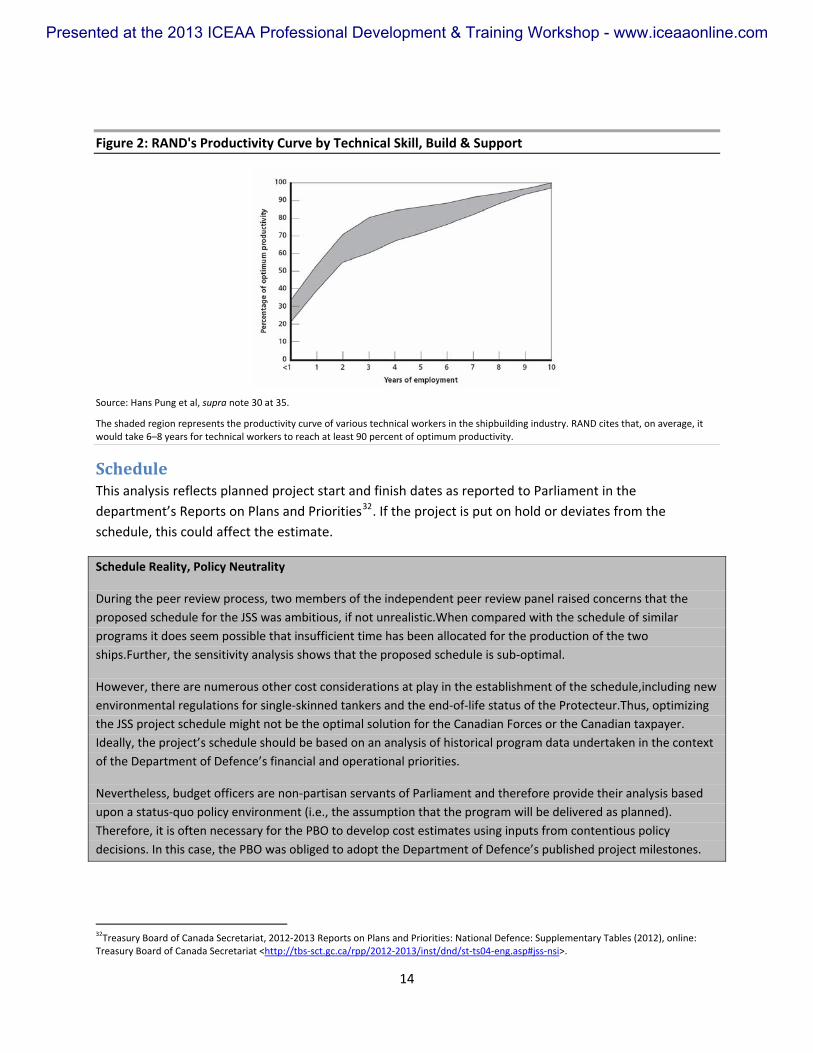
Figure 2: RAND's Productivity Curve by Technical Skill, Build & Support
Source: Hans Pung et al, supra note 30 at 35.
The shaded region represents the productivity curve of various technical workers in the shipbuilding industry. RAND cites that, on average, it would take 6–8 years for technical workers to reach at least 90 percent of optimum productivity.
Schedule This analysis reflects planned project start and finish dates as reported to Parliament in the department’s Reports on Plans and Priorities32. If the project is put on hold or deviates from the schedule, this could affect the estimate.
Schedule Reality, Policy Neutrality
During the peer review process, two members of the independent peer review panel raised concerns that the proposed schedule for the JSS was ambitious, if not unrealistic.When compared with the schedule of similar programs it does seem possible that insufficient time has been allocated for the production of the two ships.Further, the sensitivity analysis shows that the proposed schedule is sub‐optimal.
However, there are numerous other cost considerations at play in the establishment of the schedule,including new environmental regulations for single‐skinned tankers and the end‐of‐life status of the Protecteur.Thus, optimizing the JSS project schedule might not be the optimal solution for the Canadian Forces or the Canadian taxpayer. Ideally, the project’s schedule should be based on an analysis of historical program data undertaken in the context of the Department of Defence’s financial and operational priorities.
Nevertheless, budget officers are non‐partisan servants of Parliament and therefore provide their analysis based upon a status‐quo policy environment (i.e., the assumption that the program will be delivered as planned). Therefore, it is often necessary for the PBO to develop cost estimates using inputs from contentious policy decisions. In this case, the PBO was obliged to adopt the Department of Defence’s published project milestones.
32Treasury Board of Canada Secretariat, 2012‐2013 Reports on Plans and Priorities: National Defence: Supplementary Tables (2012), online: Treasury Board of Canada Secretariat <http://tbs‐sct.gc.ca/rpp/2012‐2013/inst/dnd/st‐ts04‐eng.asp#jss‐nsi>.
14
Presented at the 2013 ICEAA Professional Development & Training Workshop - www.iceaaonline.com

Summary of Results As discussed above, the major inputs for the point estimate were:
1. Weight of 18,469,520 lbs(i.e. Protecteur’s weight)
2. Manufacturing complexity of 3.78 (i.e. Protecteur’s manufacturing complexity)
3. Percent of new design of 85% (reflecting the significant redesign work that would be necessary to adapt any design to Canadian operating requirements and make it possible to be built in a Canadian shipyard)
4. Design repeat for structure of 40% (reflecting the fact that there will be some, but not complete, symmetry in the design of the ship)
5. Engineering complexity of 1.1 (i.e. a new design based on existing technology, designed and executed by a team with mixed experience and some product familiarity, thus reflecting Seaspan’s current state)
For these values, the model returned a point estimate of approximately $3.28 billion. Other cost drivers remained at nominal or industry standard values.
Table 4 ‐Point Estimates (billions)
Category Cost
Program/Project $0.98
Engineering $1.35
Tooling & Test $0.13
Manufacturing $0.50
Quality Assurance $0.33
Total $3.28
Source: PBO
This analysis reflects planned project start and finish dates. If the project is put on hold or deviates from the schedule, the estimate could change.
As discussed, given that the project is early in its development and characteristics remain uncertain, the PBO varied the inputs in order to provide a sense of how much should be allocated to reduce the likelihood of program failure.
15
Presented at the 2013 ICEAA Professional Development & Training Workshop - www.iceaaonline.com

Risk analysis was modeled on a triangular distribution of likely ranges as follows:
1. Weight was varied between 18,469,520 and 22,833,440 lbs (i.e. the Berlin‐class)
2. Manufacturing complexity was varied between 3.39 and 4.25 (i.e. the high and low of manufacturing complexities for logistics support ships)33
3. Percent of new structure was varied between 50 and 85%34
4. Percent of design repeat for structure was varied between 20 and 50%35
5. Engineering complexity was varied between 0.9 and 1.1 (i.e. new design, existing technology designed and executed by a team with extensive experience and familiar with productcompared to a team with mixed experience and some product familiarity).
Given the stage of the program and the uncertainty of the inputs, GAO best practice recommends budgeting at no less than a 50% confidence level.36 For this confidence level, varying the inputs above, the PBO’s model returns a value of $4.13 billion.
GAO on Ranges Versus Point Estimates
“Having a range of costs around a point estimate is more useful to decision makers, because it conveys the level of confidence in achieving the most likely cost and also informs them on cost, schedule, and technical risks.”37
33 Refer to Table 2 and
FigTure 1. 34 While 85% new structure is reasonable and reflective of the work that needs to be undertaken, it is possible that that figure may be lower. In order to enhance the defensibility of its range, PBO adopted a conservative figure for the low end of percent of new structure. This increases the likelihood of the simulation returning results with a lower cost. 35 20% represents a pessimistic outcome, but one that nonetheless seems within the range of possibilities given the different systems the ship may ultimately contain. 36United States Government Accountability Office, GAO Cost Estimating and Assessment Guide: Best Practices for Developing and Managing Capital Program Costs (March 2009), online: GAO <http://www.gao.gov/assets/80/77175.pdf>. 37Ibid.
16
Presented at the 2013 ICEAA Professional Development & Training Workshop - www.iceaaonline.com
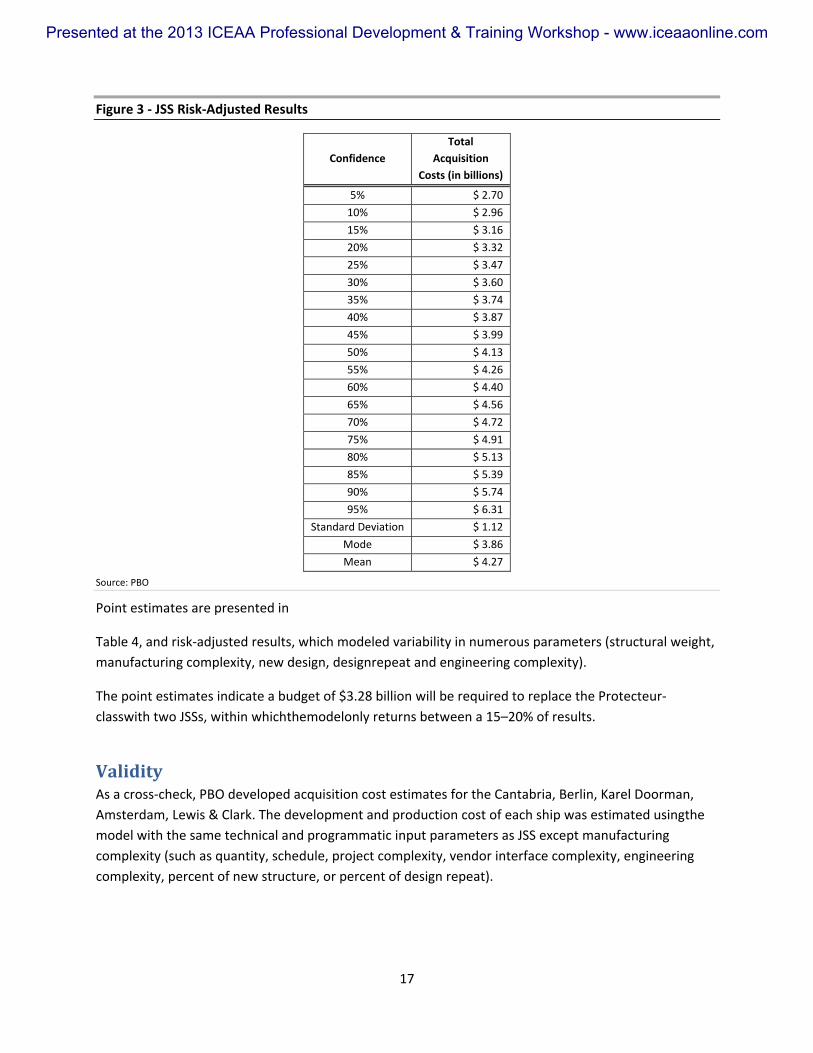
Figure 3 ‐ JSS Risk‐Adjusted Results
Total Acquisition Confidence
Costs (in billions)
5% $ 2.70
10% $ 2.96
15% $ 3.16
20% $ 3.32
25% $ 3.47
30% $ 3.60
35% $ 3.74
40% $ 3.87
45% $ 3.99
50% $ 4.13
55% $ 4.26
60% $ 4.40
65% $ 4.56
70% $ 4.72
75% $ 4.91
80% $ 5.13
85% $ 5.39
90% $ 5.74
95% $ 6.31
Standard Deviation $ 1.12
Mode $ 3.86
Mean $ 4.27
Source: PBO
Point estimates are presented in
Table 4, and risk‐adjusted results, which modeled variability in numerous parameters (structural weight, manufacturing complexity, new design, designrepeat and engineering complexity).
The point estimates indicate a budget of $3.28 billion will be required to replace the Protecteur‐classwith two JSSs, within whichthemodelonly returns between a 15–20% of results.
Validity As a cross‐check, PBO developed acquisition cost estimates for the Cantabria, Berlin, Karel Doorman, Amsterdam, Lewis & Clark. The development and production cost of each ship was estimated usingthe model with the same technical and programmatic input parameters as JSS except manufacturing complexity (such as quantity, schedule, project complexity, vendor interface complexity, engineering complexity, percent of new structure, or percent of design repeat).
17
Presented at the 2013 ICEAA Professional Development & Training Workshop - www.iceaaonline.com
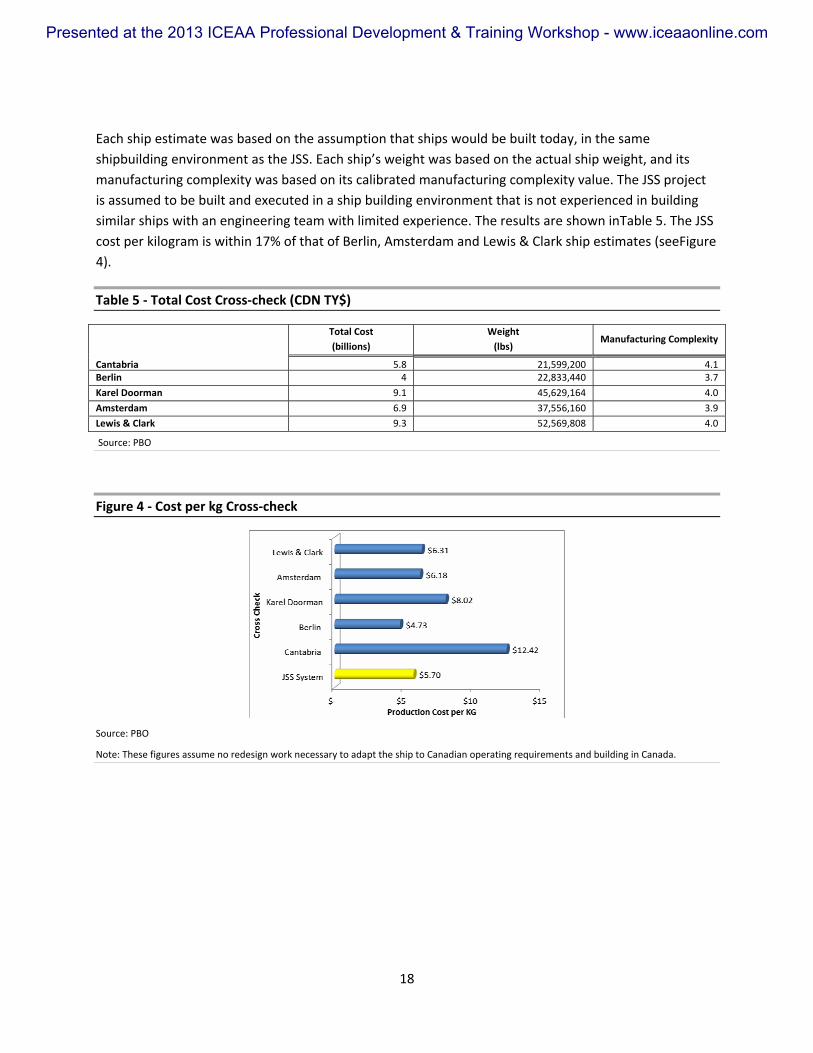
Each ship estimate was based on the assumption that ships would be built today, in the same shipbuilding environment as the JSS. Each ship’s weight was based on the actual ship weight, and its manufacturing complexity was based on its calibrated manufacturing complexity value. The JSS project is assumed to be built and executed in a ship building environment that is not experienced in building similar ships with an engineering team with limited experience. The results are shown inTable 5. The JSS cost per kilogram is within 17% of that of Berlin, Amsterdam and Lewis & Clark ship estimates (seeFigure 4).
Table 5 ‐ Total Cost Cross‐check (CDN TY$)
Total Cost (billions)
Weight (lbs)
Manufacturing Complexity
Cantabria 5.8 21,599,200 4.1Berlin 4 22,833,440 3.7
Karel Doorman 9.1 45,629,164 4.0
Amsterdam 6.9 37,556,160 3.9
Lewis & Clark 9.3 52,569,808 4.0
Source: PBO
Figure 4 ‐ Cost per kg Cross‐check
Source: PBO
Note: These figures assume no redesign work necessary to adapt the ship to Canadian operating requirements and building in Canada.
18
Presented at the 2013 ICEAA Professional Development & Training Workshop - www.iceaaonline.com

Discussion As highlighted above, the PBO faced a number of methodological challenges in assessing the feasibility of the budget. The credibility of the results hinged on a number of key factors. First, the PBO adhered closely to the GAO 12‐step estimating approach.38Second, the PBO relied on its calibrated results for manufacturing complexity for structure as inputs to the model. Third, the PBO sought a panel of eminent experts to peer review its analysis. Representatives from the Congressional Budget Office, the GAO, the Naval Postgraduate School, and the Danish Royal Navy were given access to the PBO’s model and TruePlanning. All these factors weighed heavily in validating the model’s inputs and ensuring that the results returned by the PBO were defensible and repeatable.
As discussed in the Background above, the JSS program had already failed once in 2008 due to an inadequate budget. This heightened the imperative of providing a timely assessment of the sufficiency of the new budget.
The reactions to the PBO’s report were mixed. Broadly speaking, the political and media discourse has centered on two main questions:Will the budget be augmented? And, if not, will the navy get the ship they were promised?
Such questions focus on the outcomes of the analysis, rather than the analysis itself. The real value in this kind of the approach taken by the PBO is being able to make adjustments as the project progresses. As more information becomes available, the PBO will be able to respond to differing opinions or conduct an analysis of alternatives. As Ken Hansen, succinctly wrote in the Canadian Naval Review:
“There is lots of ground here to disagree (or agree) with the assessments used to run the model. At least there is now the basis for a discussion and some solid data to use for comparative analysis. The PBO report helps to fill an enormous void with information. Its usefulness will only be known with the passage of time.”
At the time of writing, there had been no discussion of the inputs of the model on the public stage, but there have been some informative discussions behind closed doors. The PBO was invited to participate in a Canadian Defence Association roundtable that brought together members of industry, academia, and defence to discuss the report in a closed‐door meeting under the Chatham House Rule.39It is telling that the participants in this discussion were not surprised by the findings of the report.
The aim of the PBO analysis was to determine whether the budget envelope would be sufficient. The results suggested that it would not be. To say that a budget envelope is insufficient, however, is only the starting point for discussion. The next steps involve setting a reasonable budget and defining the
38 United States Government Accountability Office, supra note20. 39 “When a meeting, or part thereof, is held under the Chatham House Rule, participants are free to use the information received, but neither the identity nor the affiliation of the speaker(s), nor that of any other participant, may be revealed.” Source: http://www.chathamhouse.org/about‐us/chathamhouserule
19
Presented at the 2013 ICEAA Professional Development & Training Workshop - www.iceaaonline.com

program with greater precision, honing the cost estimate, and coming up with results, derived at the subsystem level, that have greater precision and accuracy. The PBO report is a beginning, not an end, but it does signify at least that we are no longer sailing completely blind.
20
Presented at the 2013 ICEAA Professional Development & Training Workshop - www.iceaaonline.com