sage-grouse population response to coal-bed natural gas
TRANSCRIPT

Sage-grouse Population Response to Coal-bed Natural Gas Development in the Powder River Basin:
Interim Progress Report on Region-wide Lek-count Analyses
May 26, 2006
Dr. David E. Naugle, Brett L. Walker, and Kevin E. Doherty
Wildlife Biology Program, College of Forestry and Conservation, University of Montana Synopsis In this interim progress report, we report preliminary results from an analysis of region-wide lek-count data for greater sage-grouse from the Powder River Basin (PRB) in relation to coal-bed natural gas (CBNG) development. We have completed the first of four separate, but related analyses of these data. Preliminary results support previous findings that region-wide populations declined severely in 1990-1995, followed by stable trends around a lower population equilibrium from 1995-2005. However, leks with extensive CBNG development (>40% developed within 3.2 km) showed substantially lower population trends than leks with minimal CBNG or no development, even after controlling for known impacts of West Nile virus. Leks in areas adjacent to CBNG fields (10-40% developed within 3.2 km) also showed higher population trends than leks further away, suggesting that sage-grouse may be avoiding developed areas and moving into adjacent undeveloped habitat. The avoidance hypothesis is supported by the finding that, by 2005, active leks, and large and medium-sized leks, were more often found outside or adjacent to CBNG fields than within CBNG. Expansion of agriculture and surface mining also appears to have played a role in regional population changes in the PRB. Introduction
Large-scale modification of sagebrush habitats associated with energy development may have important impacts on habitat use or vital rates of sagebrush-dependent wildlife species. Habitat use may change in response to energy development if animals avoid, or are attracted to, specific features of development such as roads, power lines, wells, or ponds. Species that avoid development are forced to move into adjacent areas that may or may not provide suitable habitat. Avoidance of development typically is detrimental because it increases density-dependent sources of mortality, decreases survival and reproduction, and leaves wildlife populations with little capacity to respond to new population stressors. Energy development may also impact wildlife by directly or indirectly affecting population vital rates (i.e., survival and reproduction), which in turn influences population growth rate, size, and persistence. Direct mortality of adults caused by collisions with infrastructure and destruction or abandonment of breeding areas or nests caused by construction activities may influence a population’s annual survival or productivity. Energy development often leads to shifts in vegetation structure or composition that influence habitat suitability or shifts in the abundance or distribution of predators, prey, parasites, or disease.

Coal-bed natural gas (CBNG) development in the Powder River Basin (PRB) of northeastern Wyoming and southeastern Montana is a concern for conservation of greater sage-grouse populations. The PRB supports an important regional sage-grouse population, with 516 leks documented over the past 25 years. Sage-grouse populations in this region have declined over the long-term due a combination of habitat loss, drought, and other unknown population stressors (Connelly et al. 2005) and new threats, such as West Nile virus, are emerging (Naugle et al. 2004, 2005, Walker et al. 2004). Since 1990, the PRB has also experienced widespread coal-bed natural gas (CBNG) development. Expansion of roads, power lines, pipelines, compressor stations, and ponds associated with CBNG development may influence habitat use, survival or reproduction of sage-grouse. Recent research from Alberta and Wyoming indicate that energy development may have substantial negative impacts on sage-grouse populations (Aldridge 2005, Holloran 2005). To test whether CBNG development influences trends in the status and size of sage-grouse populations, we analyzed lek-count data from 516 leks in the Powder River Basin in areas with and without CBNG development. Although CBNG is different than other types of mineral development, several features of CBNG are known to negatively affect sage-grouse populations, including loss of sagebrush habitat, expansion of roads and power lines, increased human activity, and the spread of invasive plants (Gelbard and Belknap 2003) and West Nile virus (Walker et al. 2004). Objectives
To test whether CBNG development influences counts of breeding male sage-grouse in the Powder River Basin, we analyzed historical lek-count data in relation to CBNG development. This project consists of four separate, but related analyses:
1. Comparison of lek-complex status (i.e., active or inactive) in 2005, lek complex size in 2005, and trends in population indices in areas inside, adjacent to, and outside CBNG development over the entire Powder River Basin.
2. Comparison of trends in population indices at leks categorized as inside, adjacent to, or outside CBNG development on a year-by-year basis over the entire Powder River Basin.
3. Comparison of linear models predicting lek-complex status (i.e., active or inactive) and population growth rate in relation to extent of CBNG development, habitat loss, roads, and power lines. This analysis will be conducted in a competing model framework and will incorporate anthropogenic landscape variables from GIS layers and habitat variables derived from classification of SPOT-5 remote-sensing imagery.
4. Comparison of population trends at leks that have sufficient data for meaningful analysis (>10 counts between 1988-2005) inside and outside CBNG development. Approximately 40 lek complexes have sufficient data for trend analysis.
Here we present results of the first analysis. Results of subsequent analyses will be included
in future reports. Methods - Analysis 1
We used public lek-count databases provided by Wyoming Game and Fish Department and Montana Fish Wildlife and Parks as the foundation of our analysis. We checked for and corrected errors in the data after consultation with database managers and regional biologists for

each state. We augmented the database with lek-count data from environmental consultants (John Barry and Thunderbird Wildlife Consulting, Inc.) and BLM biologists for leks in Montana that were known to be missing data. We excluded data with obvious errors, leks without supporting count data, and duplicate leks from the database. We restricted our analysis to an area within the Tongue River and Powder River drainages northeastern Wyoming and southeastern Montana in Big Horn and Powder River counties in Montana, and Campbell, Crook, Converse, Johnson, Natrona, Niobara, Sheridan, and Weston counties in Wyoming.
For the analysis of population indices, we used a dissolved 350 m buffer around wells to estimate the proportion of area around each lek and lek complex with development. Well density is highly correlated with other features of development, such as road and power line density, and represents a suitable index for the extent of development. We defined each lek as being inside CBNG development if >40% of an area within 3.2 km was developed, or if >25% was developed and development overlapped the lek center. A lek was considered to be on the edge of CBNG if 10-40% of the area within 3.2 km was developed and development did not overlap the lek center. Leks with <10% development were considered outside CBNG. We calculated population growth rates for each year-to-year transition from 1988-2005 by combining count data from multiple leks counted in consecutive years following the method of Connelly et al. (2004).
To describe landscapes surrounding lek complexes, we calculated summary statistics for six landscape variables for active and inactive lek complexes. We followed the definition of a lek complex of Connelly et al. (2004) as one or more leks that fall within 2.5 km of each other. To avoid problems with lek complexes shifting as new leks are discovered and as new leks form in response to changes in the landscape, we defined a set of original lek complexes based on leks discovered, or with data reported, prior to 1990. Leks discovered in subsequent years were considered new lek complexes regardless of distance from existing complexes. Leks newly discovered in the same year that fell within 2.5 km of each other were considered to be in the same lek complex. Results
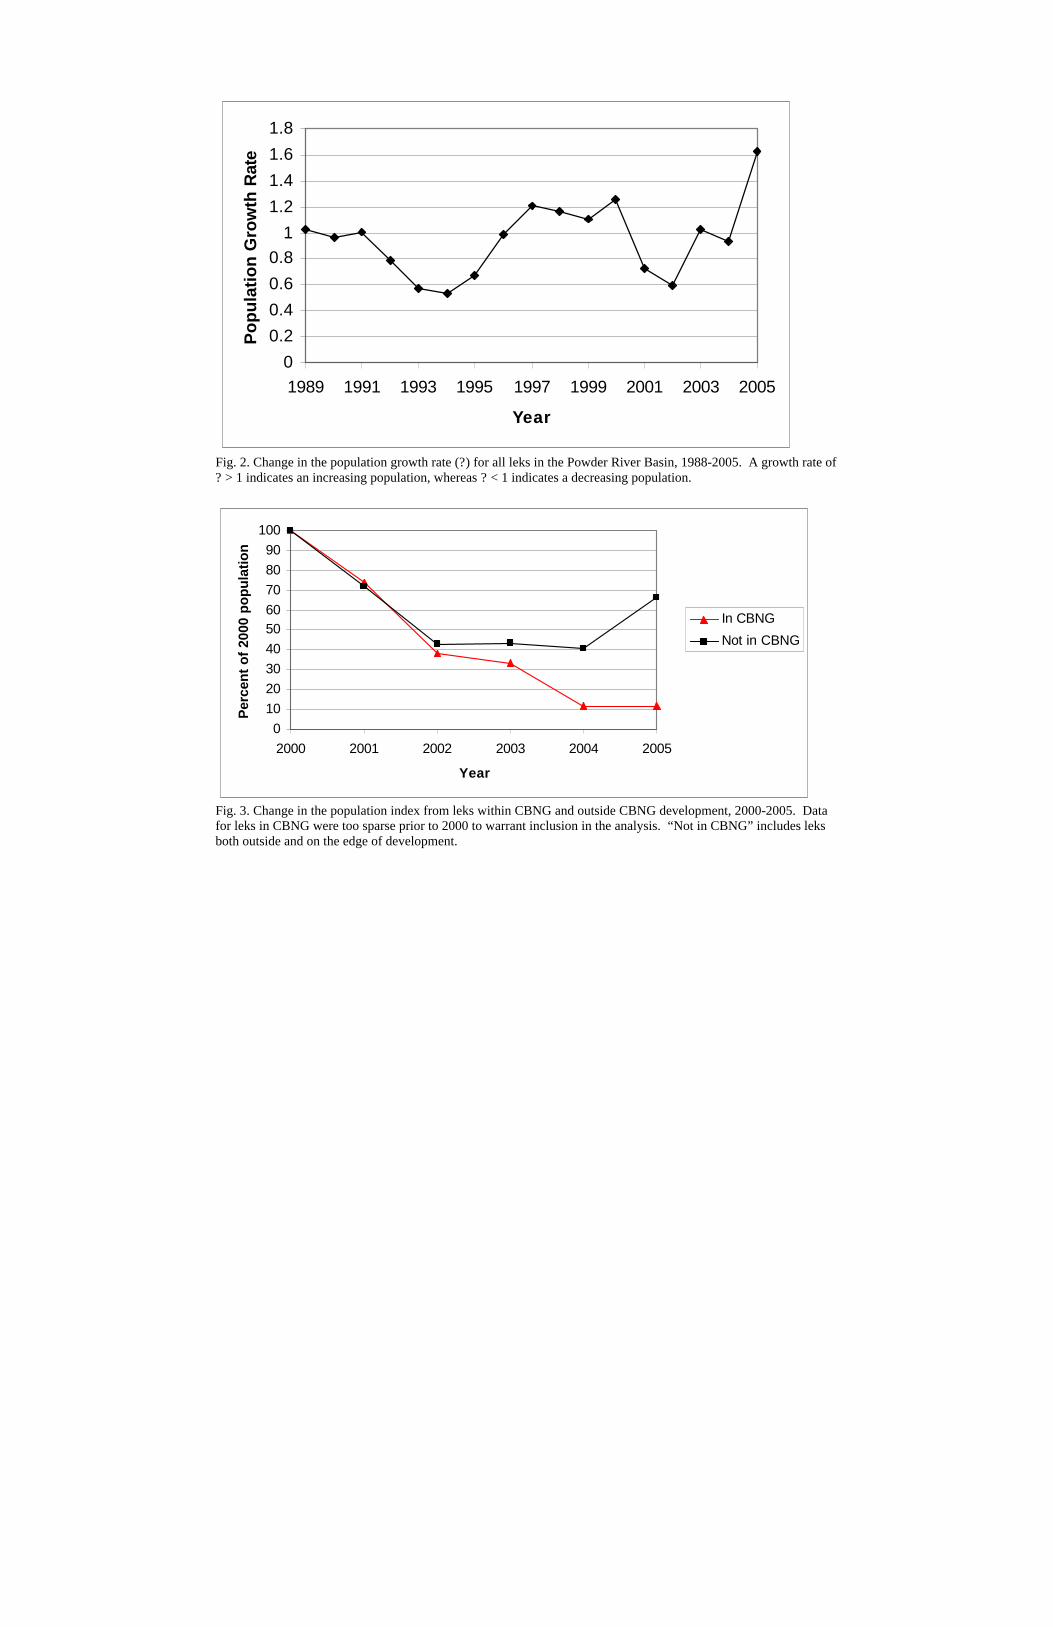
Region-wide populations appeared to decline severely from 1990-1995, followed by stable trends around a lower population equilibrium from 1995-2005 (Figure 1). The total population size of greater sage-grouse in the PRB as of 2005 is approximately 16% of the original population size in 1988. These data closely match those presented for the NE WY/SE MT regional subpopulation in the range-wide conservation assessment by Connelly et al. (2004). Examination of the population growth rate (?) for all leks combined suggest that 1990-1995 was a period of severe population decline followed by moderate population increases in the late 1990’s, another decline in 2000-2002, and extremely high population growth between 2004 and 2005 (Figure 2).
Data for year-to-year transitions were available for a relatively small proportion of leks with CBNG and along the edge of CBNG fields prior to 2000 (Table 1). For this reason, population indices prior to 2000 for areas within CBNG are not included.
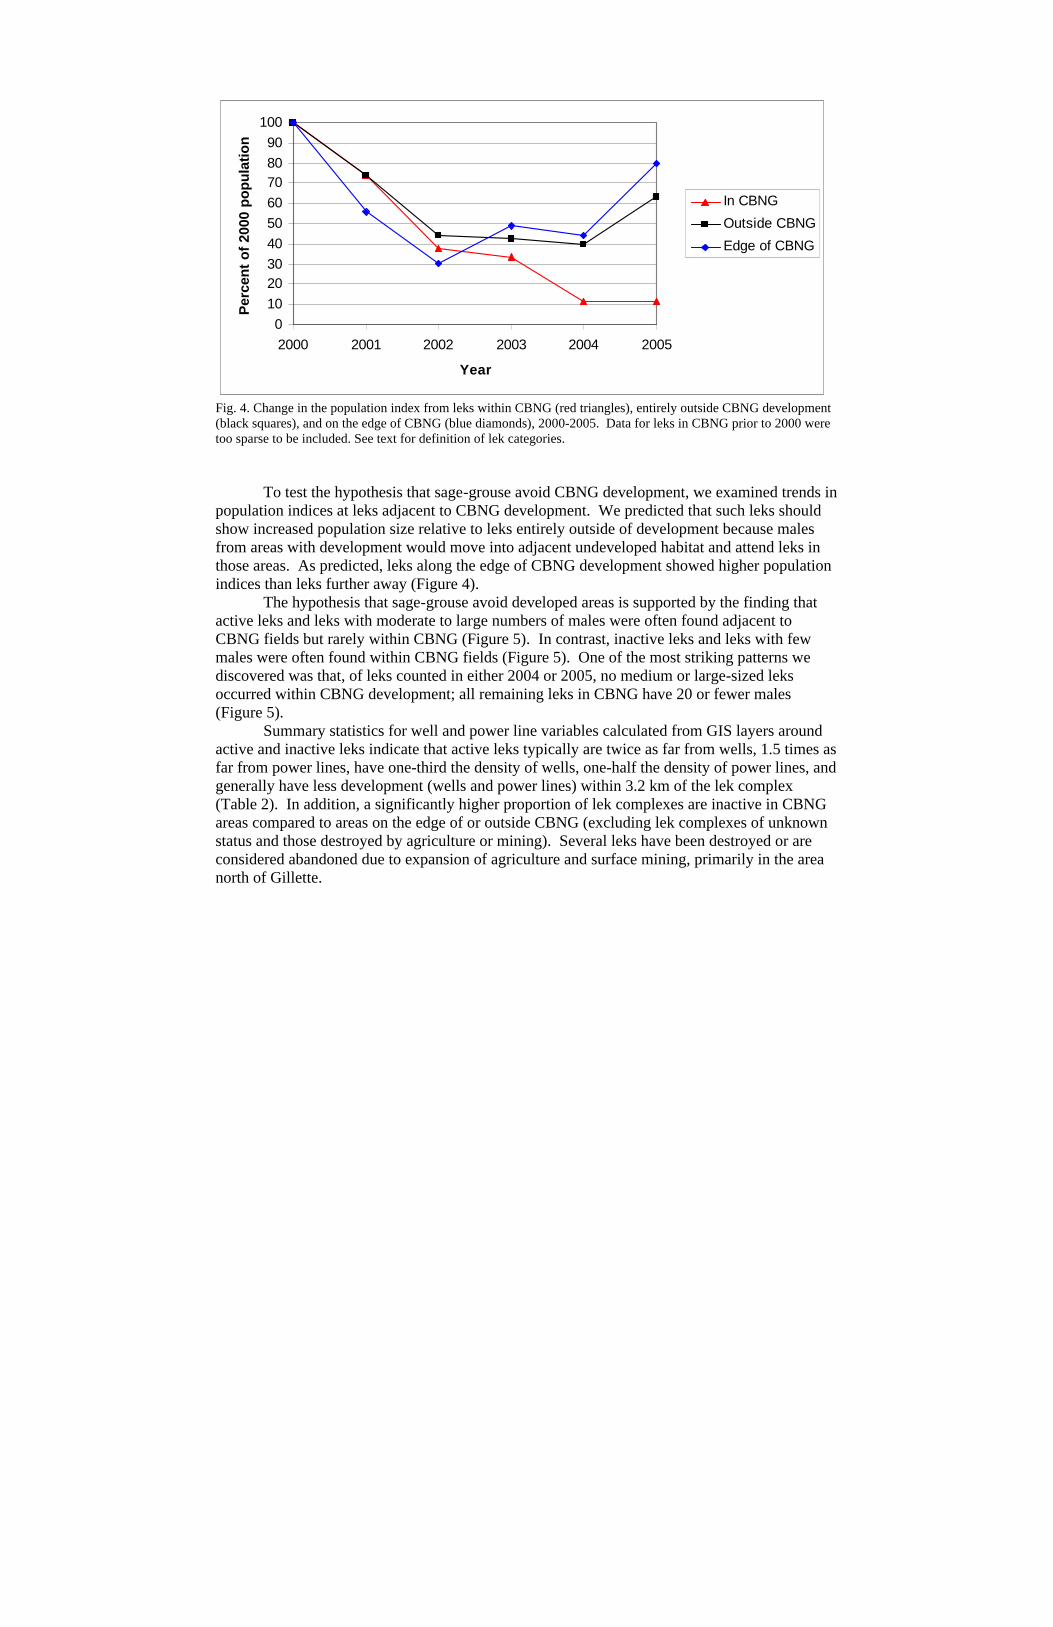
Data from 2000-2005 suggest that leks within CBNG development showed substantially lower population indices than leks outside CBNG development (Figure 3). This result does not change even after removing data from leks in the Spotted Horse region where West Nile virus largely extirpated sage-grouse populations between 2003 and 2004 (Walker et al. 2004) (data not

shown). It appears that leks within CBNG did not benefit from the same increases between 2004 and 2005 as leks outside development.
Table 1. No. sage-grouse leks with sufficient data for calculating year-to-year transitions in the Powder River Basin, 1988-2005.
88-8
9
89-9
0
90-9
1
91-9
2
92-9
3
93-9
4
94-9
5
95-9
6
96-9
7
97-9
8
98-9
9
99-0
0
00-0
1
01-0
2
02-0
3
03-0
4
04-0
5
CBNG1 3 3 3 5 3 3 4 4 5 4 4 6 13 17 18 23 30 Outside2 27 23 27 20 21 28 27 34 38 39 48 62 84 100 105 110 146 Edge3 8 7 11 9 7 6 4 8 9 7 6 10 14 23 21 22 41 1 No. of leks within CBNG development. 2 No. of leks entirely outside CBNG development. 3 No. of leks on the edge of CBNG development.
0
20
40
60
80
100
120
1988 1990 1992 1994 1996 1998 2000 2002 2004
Year
Per
cen
t o
f 19
88 P
op
ula
tion
Fig. 1. Change in the population index for all leks in the Powder River Basin, 1988-2005. Data indicate a severe region-wide population decline between 1990 and 1995.
0
0.2
0.4
0.6
0.81
1.2
1.4
1.6
1.8
1989 1991 1993 1995 1997 1999 2001 2003 2005
Year
Po
pu
lati
on
Gro
wth
Rat
e
Fig. 2. Change in the population growth rate (?) for all leks in the Powder River Basin, 1988-2005. A growth rate of ? > 1 indicates an increasing population, whereas ? < 1 indicates a decreasing population.
0102030405060708090
100
2000 2001 2002 2003 2004 2005
Year
Per
cen
t o
f 20
00 p
op
ula
tion
In CBNG
Not in CBNG
Fig. 3. Change in the population index from leks within CBNG and outside CBNG development, 2000-2005. Data for leks in CBNG were too sparse prior to 2000 to warrant inclusion in the analysis. “Not in CBNG” includes leks both outside and on the edge of development.
0102030405060708090
100
2000 2001 2002 2003 2004 2005
Year
Per
cen
t o
f 20
00 p
op
ula
tion
In CBNG
Outside CBNG
Edge of CBNG
Fig. 4. Change in the population index from leks within CBNG (red triangles), entirely outside CBNG development (black squares), and on the edge of CBNG (blue diamonds), 2000-2005. Data for leks in CBNG prior to 2000 were too sparse to be included. See text for definition of lek categories.
To test the hypothesis that sage-grouse avoid CBNG development, we examined trends in
population indices at leks adjacent to CBNG development. We predicted that such leks should show increased population size relative to leks entirely outside of development because males from areas with development would move into adjacent undeveloped habitat and attend leks in those areas. As predicted, leks along the edge of CBNG development showed higher population indices than leks further away (Figure 4).
The hypothesis that sage-grouse avoid developed areas is supported by the finding that active leks and leks with moderate to large numbers of males were often found adjacent to CBNG fields but rarely within CBNG (Figure 5). In contrast, inactive leks and leks with few males were often found within CBNG fields (Figure 5). One of the most striking patterns we discovered was that, of leks counted in either 2004 or 2005, no medium or large-sized leks occurred within CBNG development; all remaining leks in CBNG have 20 or fewer males (Figure 5).
Summary statistics for well and power line variables calculated from GIS layers around active and inactive leks indicate that active leks typically are twice as far from wells, 1.5 times as far from power lines, have one-third the density of wells, one-half the density of power lines, and generally have less development (wells and power lines) within 3.2 km of the lek complex (Table 2). In addition, a significantly higher proportion of lek complexes are inactive in CBNG areas compared to areas on the edge of or outside CBNG (excluding lek complexes of unknown status and those destroyed by agriculture or mining). Several leks have been destroyed or are considered abandoned due to expansion of agriculture and surface mining, primarily in the area north of Gillette.

Table 2. Descriptive statistics for active and inactive sage-grouse lek complexes in the Powder River Basin. Density and area calculations are based on a 2-mile (3.2 km) buffer around each lek complex.
Lek Complex
Status
Distance to Nearest
Well (m)
Distance to Nearest
Power Line (m)
Well Density
(wells/km2)
Well Spacing
(acres/well)
Power Line Density
(km/km2)
Prop. of surrounding area within 350m of a
well
Prop. of surrounding area within 350m of a
Power Line ACTIVE 14.04±1.34 2.34±0.16 0.32±0.06 774 0.22±0.02 0.07±0.01 0.14±0.01
n = 221 186 207 207 207 207 207 INACTIVE 7.38±1.47 1.64±0.23 1.03±0.18 250 0.41±0.04 0.21±0.03 0.25±0.02
n = 96 92 95 95 95 95 95 * All means significantly different between active and inactive leks (one-tailed t-test, all p<0.01). Table 3. Proportions of active and inactive lek complexes by CBNG category (CBNG, outside, edge) (n=431 total complexes, of which 324 are of known status and were not destroyed). Lek Complex Status CBNG Edge Outside CBM Active 12 (27.9%) 43 (82.7%) 166 (72.5%) Inactive/Abandoned 28 (65.1%) 8 (15.4%) 61 (26.6%) Unknown 2 1 95 Destroyed 1 2 6 Total (excl. leks of unknown status and destroyed leks)
43 52 229
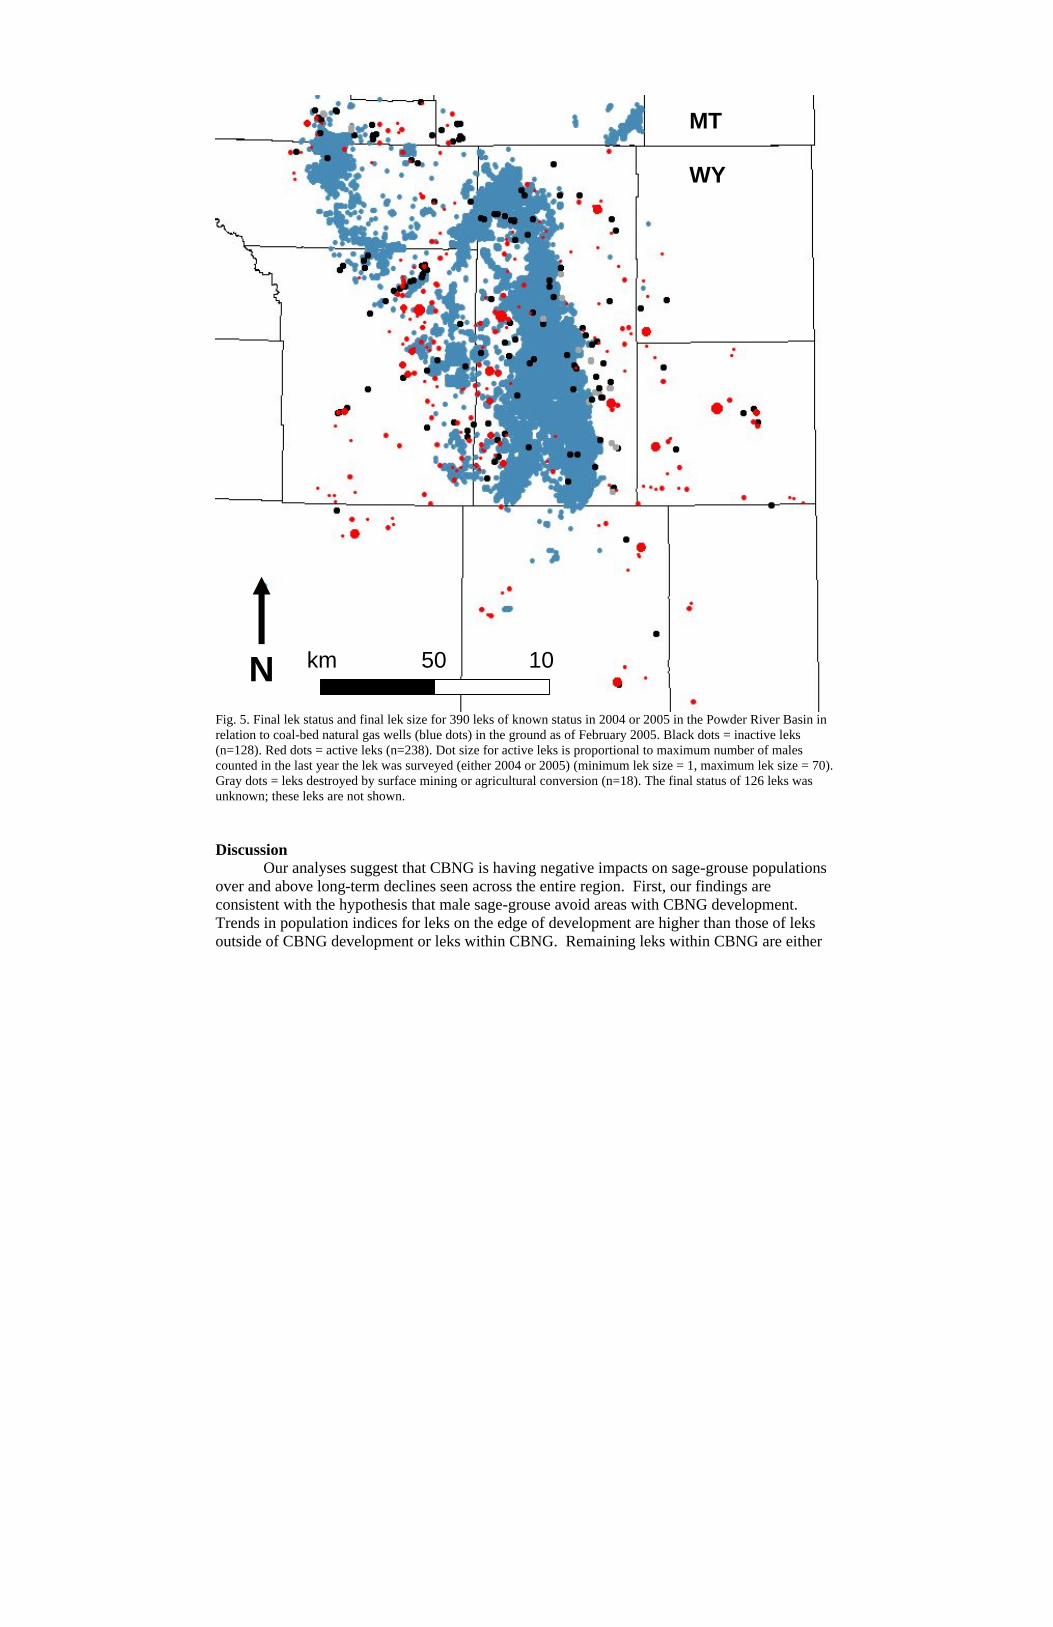
Fig. 5. Final lek status and final lek size for 390 leks of known status in 2004 or 2005 in the Powder River Basin in relation to coal-bed natural gas wells (blue dots) in the ground as of February 2005. Black dots = inactive leks (n=128). Red dots = active leks (n=238). Dot size for active leks is proportional to maximum number of males counted in the last year the lek was surveyed (either 2004 or 2005) (minimum lek size = 1, maximum lek size = 70). Gray dots = leks destroyed by surface mining or agricultural conversion (n=18). The final status of 126 leks was unknown; these leks are not shown. Discussion Our analyses suggest that CBNG is having negative impacts on sage-grouse populations over and above long-term declines seen across the entire region. First, our findings are consistent with the hypothesis that male sage-grouse avoid areas with CBNG development. Trends in population indices for leks on the edge of development are higher than those of leks outside of CBNG development or leks within CBNG. Remaining leks within CBNG are either
MT
WY
N 50 100
km

small (<20 males) or inactive, whereas leks along the edge of development and outside development have larger counts of males on average (i.e., >20 males). Second, inactive leks tend to fall closer to CBNG wells and to power lines, have significantly higher well and power line densities, and more surrounding area within 350 m of a well or a power line. This analysis is the first of several currently underway. The current analysis does not rule out the possibility that reduced population indices and apparent avoidance of developed areas by sage-grouse are driven by habitat loss instead. Habitat loss is widely recognized as the most significant threat to sage-grouse populations throughout their range (Connelly et al. 2004). Because CBNG development and power line corridors typically occur in low-lying areas that also are subject to agricultural development, habitat loss and CBNG development may be confounded as predictors of sage-grouse population declines. Additional analyses will address this issue by examining the relative roles of habitat loss, CBNG, and power lines in a competing model framework. Literature Cited Aldridge, C.L. 2005. Habitats for Persistence of Greater Sage-Grouse (Centrocercus
urophasianus) in Alberta, Canada. Ph.D. Dissertation, University of Alberta, Edmonton,
Alberta, Canada. 250 pp.
Connelly, J. W., S. T. Knick, M. A. Schroeder, and S. J. Stiver. 2004. Conservation assessment
of greater sage-grouse and sagebrush habitats. Western Association of Fish and Wildlife
Agencies, Unpublished Report, Cheyenne, Wyoming, USA.
Gelbard, J. L. and J. Belknap. 2003. Roads as conduits for exotic plant invasions in a semiarid
landscape. Conservation Biology 17: 420-427.
Holloran, M. J. 2005. Greater sage-grouse (Centrocercus urophasianus) population response to
natural gas field development in western Wyoming. Ph.D. Dissertation, University of
Wyoming, Laramie, Wyoming. 223 pp.
Naugle, D. E., C. L. Aldridge, B. L. Walker, T. E. Cornish, B. J. Moynahan, M. J.
Holloran, K. Brown, G. D. Johnson, E. T. Schmidtman, R. T. Mayer, C. Y. Kato, M. R.
Matchett, T. J. Christiansen, W. E. Cook, T. Creekmore, R. D. Falise, E. T. Rinkes, and

M. S. Boyce. 2004. West Nile virus: pending crisis for greater sage-grouse. Ecology
Letters 7:704–713.
Naugle, D. E., C. A. Aldridge, B. L. Walker, K. E. Doherty, M. R. Matchett, J. McIntosh,
T. E. Cornish, and M. S. Boyce. 2005. West Nile virus and sage-grouse: What more have
we learned? Wildlife Society Bulletin 33:616–623.
Walker, B. L., D. E. Naugle, K. E. Doherty, and T. E. Cornish. 2004. From the Field:
Outbreak of West Nile virus in greater sage-grouse and guidelines for monitoring,
handling, and submitting dead birds. Wildlife Society Bulletin 32:1000–1006.