safety modelling final report - eurocontrol
TRANSCRIPT

NLR-CR-2009-551
Safety modelling and analySiS of organizational proceSSeS in air traffic - d8: final report
EUROCONTROL CARE INNOvATIvE REsEARCh III
S.H. StroeveA. Sharpanskykh

NLR-CR-2009-551
Executive summary
UNCLASSIFIED
Report no. NLR-CR-2009-551 Author(s) S.H. Stroeve A. Sharpanskykh Report classification UNCLASSIFIED Date December 2009 Knowledge area(s) Vliegveiligheid (safety & security) Descriptor(s) Safety culture Organization Modelling
SAFETY MODELLING AND ANALYSIS OF ORGANIZATIONAL
PROCESSES IN AIR TRAFFIC - D8: FINAL REPORT EUROCONTROL CARE Innovative Research III Problem area Safety culture is broadly recognized as important for air traffic management (ATM) safety and various studies have addressed its characterization and assessment. However, relations between safety culture and formal and informal organizational structures and processes are yet not well understood. This impedes structured improvement of safety culture. As a way forward, NLR Air Transport Safety Institute, Vrije Universiteit Amsterdam and EUROCONTROL have collaborated in a EUROCONTROL CARE Innovative Research III project. The aim of this project is to enhance safety analysis of organizational processes in air traffic by development of formal approaches for modelling, simulation and analysis of organizational relationships and processes. These models aim to provide a proper basis for understanding the causal relations between organizational
processes that influence safety culture, such that robust and flexible policies may be identified to improve and maintain a sufficient level of safety culture in an organization. Description of work This final report provides an overview and discussion of the results obtained in the project. Based on a literature survey we identified a multi-view hybrid organizational modelling approach, which provides a broad repertoire of methods for modelling, simulation and analysis of organizational relations and processes. Using this approach we developed an agent-based organizational model for safety occurrence reporting at a specific air navigation service provider (ANSP) in relation to safety culture indicators. We validated the model by relating its predictions to results of a EUROCONTROL safety culture survey of this ANSP.
Results and conclusions We attained valid predictions of safety culture indicators with dedicated input data of the safety culture survey questionnaires. A sensitivity analysis of the organizational model provided valid results for important organizational factors influencing the safety culture indicators and related recommendations. We conclude that the agent-based organizational modelling approach is a useful add-on to the EUROCONTROL safety culture survey approach. The major added advantage of the organizational modelling approach is that it provides a structured, formally-grounded means for analysis and improvement of safety culture. It defines explicit formal relations between safety culture indicators and organizational
processes and structures, thus enabling identification of important organizational aspects impacting safety culture by sensitivity analysis techniques. Insights in relations between safety culture indicators and organizational structures and processes can be used to further enhance safety culture questionnaires, prepare safety culture survey workshops and support decision making on organizational change processes at ANSPs. In addition, coupling of organizational modelling to risk modelling provides a future way for structured analysis of the effect of safety culture on safety performance. Applicability This research supports the understanding of the impact of formal and informal organizational processes on safety culture.

NLR-CR-2009-551
SAFETY MODELLING AND ANALYSIS OF
ORGANIZATIONAL PROCESSES IN AIR TRAFFIC
- D8: FINAL REPORT EUROCONTROL CARE Innovative Research III
S.H. Stroeve A. Sharpanskykh1 1 Vrije Universiteit Amsterdam
No part of this report may be reproduced and/or disclosed, in any form or by any means without the prior written permission of the owner.
Customer EUROCONTROL
Contract number C06/123996BE
Owner EUROCONTROL
Division Air Transport
Distribution Unlimited
Classification of title Unclassified
December 2009
Approved by:
Author
Reviewer Managing department


NLR-CR-2009-551
December 2009 5
CONTENTS
1 INTRODUCTION 6
1.1 Context and aim of project 6 1.2 Purpose and structure of report 7 1.3 Reports and papers produced 7
2 ORGANIZATIONAL MODELLING 9
2.1 Organization theory 9 2.2 Organizational modelling methods 12 2.3 Organizational modelling for safety analysis 17
3 SAFETY CULTURE 22
3.1 Definitions of organizational and safety culture 22 3.2 Models of organizational/safety culture 23 3.3 Assessment of safety culture 26
4 MODELLING AND VALIDATION OF SAFETY CULTURE AT A SPECIFIC
ANSP 28
4.1 Introduction 28 4.2 Identification of safety culture issues 28 4.3 Agent-based organizational model 30 4.4 Model and Validation Phase 1 39 4.5 Model and Validation Phase 2 42 4.6 Model and Validation Phase 3 44 4.7 Discussion of results 51
5 DISCUSSION 53
5.1 Relation with safety culture survey approach 53 5.2 Potential extensions of the organizational model 54 5.3 Comparison with other safety-related organizational modelling
approaches 55 5.4 Coupling organizational and risk models 58
6 CONCLUSIONS 61
REFERENCES 62

6 NLR-CR-2009-551 December 2009
1 INTRODUCTION
1.1 CONTEXT AND AIM OF THE PROJECT
The importance of proper organizational processes to maintain the safety of
complex operations is currently well realized. It is generally recognized that the
level of safety achieved in an organization depends on the constraints and
resources set by people working at the blunt end (e.g. managers, regulators),
which determine the working conditions of practitioners who are directly
controlling hazardous processes at the sharp end (e.g. pilots, controllers,
maintenance operators). The recognition of the importance of organizational
aspects for operational safety is reflected in the considerable number of
publications on organizational and safety culture (Gordon et al., 2006; Mearns et
al., 2008; Choudhry et al., 2007; Hopkins, 2006; Ek et al., 2007). Safety culture
aims to keep the collective mind of an organization, through its entirety of
individual minds, continually focused on safety (EUROCONTROL/FAA AP15
Safety, 2008). As a prelude to systemic changes in air traffic management (ATM)
via SESAR in Europe and NextGen in the USA, EUROCONTROL, FAA and CANSO
plan to see more and more air navigation service providers (ANSPs) go through
safety culture measurement and improvement processes. Various studies have
focused on characterization and assessment of safety culture (e.g., Mearns et al.,
2008; Ek et al., 2007). However, the links of safety culture with organizational
structures and processes are yet not well understood and this affects the
determination of ways to improve safety culture.
As a way forward, NLR Air Transport Safety Institute, Vrije Universiteit
Amsterdam and EUROCONTROL have collaborated in a EUROCONTROL CARE
Innovative Research III project. The aim of this project is to enhance safety
analysis of organizational processes in air traffic by development of formal
approaches for modelling, simulation and analysis of organizational relationships
and processes. These models aim to provide a proper basis for understanding
the causal relations between organizational processes that influence safety
culture, such that robust and flexible policies may be identified to improve and
maintain a sufficient level of safety culture in an organization.

NLR-CR-2009-551
December 2009 7
1.2 PURPOSE AND STRUCTURE OF THE REPORT
This report is the final report of the project. Its aim is to provide an overview of
the main results that have been achieved by the organizational modelling
approach followed in this study, to discuss these results in the context of safety
culture assessment methods and other organizational modelling methods, to
shed a light on possibilities for application and enhancement of the model and to
discuss links of the modelling approach with risk assessment.
Section 2 introduces theory and methods on organizational modelling in general
as well as for safety analysis. Section 3 presents definitions, models and
assessment methods for safety culture. Section 4 highlights the main results of
the development and validation of an organizational model for safety culture
issues in relation to occurrence reporting at an ANSP. Section 5 presents the
discussion as outlined above. Section 6 presents the conclusions of the study.
1.3 REPORTS AND PAPERS PRODUCED
In the project, the following reports were produced as deliverables:
• D1: Literature study (Stroeve et al., 2007a)
• D2: Application cases (Stroeve et al., 2007b)
• D3: Methods and requirements (Sharpanskykh and Stroeve, 2008a)
• D4: Model and initial simulation results (Sharpanskykh et al., 2008b)
• D5: Validation plan (Sharpanskykh and Stroeve, 2008b)
• D6: Model evaluation and improvement (Sharpanskykh and Stroeve, 2009a)
• D7: Validation (Stroeve and Sharpanskykh, 2009)
• D8: Final report (current report)
In addition, the research in this project supported the following publications:
• Paper at EUROCONTROL Safety R&D Seminar 2007 (Stroeve et al., 2007c)
• Paper at EUROCONTROL Innovative Research Workshop 2007 (Stroeve et al.,
2007d)
• PhD-thesis at Vrije Universiteit (Sharpanskykh, 2008a)
• Paper at EUROCONTROL Innovative Research Workshop 2007 (Stroeve et al.,
2008)
• Paper at EUROCONTROL Safety R&D Seminar 2009 (Stroeve et al., 2009a)
• Paper at EUROCONTROL Innovative Research Workshop 2009 (Stroeve et al.,
2009b)
• Paper at the 10th International Conference on Enterprise Information Systems
2008 (Sharpanskykh et al., 2008a)

8 NLR-CR-2009-551 December 2009
• Paper at the 21st International Conference on Industrial, Engineering & Other
Applications of Applied Intelligent Systems 2008 (Sharpanskykh, 2008b)
• Paper at SocialCom-09/SIN-09 conference 2009 (Sharpanskykh and Stroeve,
2009b)
• Paper in the 4th International Conference on Intelligent Computing and
Information Systems, 2009 (Sharpanskykh, 2009)
• Chapter in the “Intelligent Systems for Knowledge Management” book
(Sharpanskykh, 2010)
Furthermore, at the time of writing of this final report we are preparing journal
publications about the results achieved.

NLR-CR-2009-551
December 2009 9
2 ORGANIZATIONAL MODELLING
This section provides an introduction on organization theory (Section 2.1),
general methods for organizational modelling (Section 2.2) and some specific
methods for organizational modelling in safety analysis (Section 2.3).
2.1 ORGANIZATION THEORY
Organization theory is a broad discipline that studies structures and dynamics of
human organizations. The research methods that are used in organization theory
stem from such disciplines as economics, psychology, sociology, political
science, anthropology, and system theory. Related practical disciplines include
human resources and industrial and organizational psychology. This overview
focuses on the major theories and trends in the western sociological tradition.
2.1.1 DEFINITIONS
Depending on the perspective, different definitions for an organization are
formulated in organization theory:
• An organization is defined as a planned, coordinated and purposeful action
of human beings to construct or compile a common tangible or intangible
product (Giddens, 2006).
• An organization is a social arrangement which pursues collective goals, which
controls its own performance, and which has a boundary separating it from
its environment (Scott et al., 1981).
• An organization is a structure that comprises sets of interrelated roles, which
are intentionally organized to ensure a desired (or required) pattern of
activities (Biddle, 1979).
• An organization is defined as a system that represents an organized
collection of parts that are highly integrated in order to accomplish an overall
goal (Kast and Rosenzweig, 1972).
The definitions by (Giddens 2006), (Scott et al., 1981) and (Biddle, 1979) are
formulated from the positions of sociology. The definition by (Kast and
Rosenzweig, 1972) is given from the perspectives of system theory.
Although the definitions given above reflect different aspects of the
organizational reality, all of them are based on the concept of rationality that lies
in the basis of organizational theory (Pfeffer 1982). According to the definitions,

10 NLR-CR-2009-551 December 2009
organizations are created for certain purposes. To achieve these goals
organizational activities are intentionally planned, coordinated and executed.
2.1.2 AGGREGATION LEVELS
In organization theory organizations are investigated at different aggregation
levels. In particular, at the individual (micro) level the behaviour of organizational
individuals and groups is investigated. At the level of the whole organisation
(meso level) different aspects of the organisational structure and dynamics are
considered. At the global (macro) level the interaction between the organization
and its environment that includes other organizations, society, markets etc. is
considered.
At the individual (micro) level the following aspects are considered:
• perception of an individual in the organizational context (Scott et al., 1981);
• work motivation and satisfaction (Vroom, 1964);
• the influence of personal and/or organizational values on the motivation and
work-related behaviour of an individual (Yukl, 2006; Hackman, 1980);
• group formation (Campion et al., 1993);
• group norms and regulations (Scott et al., 1981);
• social influence and conformity (Yeatts and Hyten, 1998);
• leadership (Yukl, 2006);
• individual conflicts in organizations (March and Simon, 1967);
• power and influence in groups (Yukl, 2006).
At the meso level of the whole organization the following topics are of relevance:
• organization structure and behaviour (Blau and Schoenherr, 1971; Mintzberg,
1979; Morgan, 1996);
• organization authority and power structures (Scott et al., 1981; Mintzberg,
1979; Pfeffer, 1982);
• organization normative systems (Scott et al., 1981);
• intergroup conflict within an organization (March and Simon, 1967);
• organization reward system (Galbraith, 1978; Vroom, 1964);
• technology in organizations (Morgan, 1996; Scott, 1981);
• organizational change (Cummings and Worley, 2005).
At the global (macro) level the behaviour of organizations is investigated using
the population ecology theory (Hannan and Freeman, 1977) and the resource
dependence theory (Pfeffer and Salancik, 1978). The following topics are
considered at this level:

NLR-CR-2009-551
December 2009 11
• inter-organizational formations, such as mergers and consolidations, joint
ventures and programs (Scott et al., 1981);
• governmental impact on organizations (Morgan, 1996);
• organizations and politics (Bacharach and Lawler, 1980);
• interactions between organizations and the society (Scott et al., 1981);
• organizations and markets (Langlois and Robertson, 1995);
• virtual organizations (Warner and Witzel, 2004).
2.1.3 ORGANIZATION TYPES
Classical organization theories (Mooney, 1947) provide insights into the
functioning of mechanistic (or functional) organizations. This type of
organizations comprises systems of hierarchically linked job positions with clear
responsibilities that use standard well-understood technology and operate in a
relatively stable environment.
In contrast to mechanistic organizations, a substantial group of modern
organizations are characterized by a highly dynamic, constantly changing,
organic structure with non-linear behaviour, which are known as organic
organizations (Morgan, 1996). Such organizations can be investigated using
modern organization theories. Modern theories are based on two essential
frameworks: the systems framework (Walter, 1968) and the contingency
approach (Donaldson, 2001).
The systems framework is based on the notion of interdependency, which
implies that a change in one part of an organization has effect on the behaviour
of all other parts. The systems framework is applied for studying matrix and
network organizations (Morgan, 1996).
The contingency approach (Donaldson, 2001) focuses on external determinants
of organizational structure and behaviour called contingencies. A contingency is
any variable that moderates the effect of an organizational characteristic on
organizational performance. The key thesis of the contingency theory is that to
ensure the effectiveness and the efficiency of an organization, its structure and
behaviour should be defined depending on particular environmental conditions.
The contingency approach is claimed to be useful for studying a variety of
organization types and to be particularly suitable for organization design.
Organization design is a special topic in the organization theory (Lorsch and
Lawrence, 1970; Galbraith 1978). Galbraith (1978) stated that ‘organization

12 NLR-CR-2009-551 December 2009
design is conceived to be a decision process to bring about a coherence between
the goals or purposes for which the organization exists, the patterns of division
of labour and inter-unit coordination and the people who will do the work.’ The
ideas of Galbraith and others are used extensively in the managerial practice to
(re)design efficient and effective organizations (Romme, 2003). The literature on
organizational design proposes an extensive set of factors identified at every
level of representation of an organization (i.e., micro, meso, and macro), which
influence the choice of specific design parameters (e.g., the group size, the task
complexity, reporting relations, the number of employees) related to the
organizational structure and dynamics.
2.2 ORGANIZATIONAL MODELLING METHODS
2.2.1 TRADITIONAL ORGANIZATIONAL MODELLING METHODS
The first formal computational organization modelling approaches have been
developed in the areas of the system dynamics theory (Forrester, 1961) and
operation research (Marlow, 1993).
Organizational models specified in system dynamics (SD) are based on numerical
variables and equations that describe how these variables change over time (e.g.,
a set of differential equations that describe the dynamics of a labour market from
a global perspective). In Figure 1 the graphical representation of a system
dynamics model is given as an example, which describes the change of the firm
population over time. In this representation, level variables are represented by
rectangles, rate of change variables – by valve symbol, and constants and
auxiliary variables - by a point or name of the constant. Cloud symbols represent
respectively source and sink, where the flow originated and vanished (e.g., the
environmental sources). Blue arrows represent influences of level variables on
other variables.

NLR-CR-2009-551
December 2009 13
Figure 1: Example of a system dynamics model of firms population (Merlone et al., 2008)
Operation research proposes mathematical methods for identifying best possible
solutions to problems related to coordination and execution of the operations
within an organization that improve or optimize the organizational performance
(Marlow, 1993), e.g., an optimisation of a production line in an organization.
Both system dynamics- and operation research-based modelling approaches
abstract from single events, entities and actors of organizations and take an
aggregate view on the organizational dynamics. Such methods can be useful for
the analysis of the organizational dynamics at macro levels (e.g., market
fluctuations, general trends of the organizational development). However, they
provide little help for the investigation of the behaviour of organizational
individuals and (the dynamics of) relations between them at detailed levels. As a
high complexity of social dynamics results from a large number of diverse local
interactions among organizational actors, the examination of an organization at
detailed levels may help identifying causes of organizational malfunctioning and
inefficiencies at more general levels.
Another traditional organization modelling approach that allows behavioural
representations at the level of organizational individuals is discrete-event
modelling (Banks, 2005). Discrete-event models represent the dynamics of a
system as a time ordered discrete sequence of events. Each event occurs at an

14 NLR-CR-2009-551 December 2009
instant in time and indicates a change of state in the system. Discrete-event
models were used in organisation modelling to analyze the performance and
reliability of organizations (Ranky, 1994; Ajaefobi and Weston, 2009). However,
some organizational and individual processes are best described by continuous
equations such as systems of differential or difference equations (e.g., cognitive
processes of individuals, dynamics of the environmental entities such as
markets), which is not possible in discrete-event models. To address this issue
and incorporate both discrete and continuous aspects of an organization in one
model, hybrid modelling techniques are required.
2.2.2 AGENT-BASED ORGANIZATIONAL MODELLING
Agent-based modelling approaches take into account the local perspective of a
possibly large number of separate components and their specific behaviours (i.e.,
interactions) in a system. The concept of an agent may be used to model both
human beings as well as hardware and software components of socio-technical
systems such as organizations. Currently many definitions exist for the concept
of an agent, including:
• An agent is anything that can be viewed as perceiving its environment
through sensors and acting upon that environment through effectors (Russell
and Norvig, 1995);
• An agent is an active object with the ability to perceive, reason, and act
(Huhns and Stephens, 1999);
• An autonomous agent is a system situated within and a part of an
environment that senses that environment and acts on it, over time, in
pursuit of its own agenda and so as to effect what it senses in the
future (Franklin and Graesser, 1996).
In general, most of the definitions agree that an agent is an entity that is able to
perceive its environment and to act upon this environment. In the area of multi-
agent systems the agent environment is understood as the agent surroundings
that include both passive and active entities including other agents (Figure 2).
Action
Observation
EnvironmentInternal model
Agent
Passive object
Agent
Figure 2: The classical model of an agent situated in the environment
NLR-CR-2009-551
December 2009 15
In the area of multi-agent systems the organizational paradigm is used to
improve computational properties of distributed algorithms, based on agent
systems (Bresciani et al, 2004, Ferber and Gutknecht, 1998, Hannoun et al, 2004,
Omicini, 2000). In particular, representation of a multi agent system as an
organization consisting of roles and groups can facilitate handling high
complexity and poor predictability of the dynamics in a system, and thus, allows
building better algorithms (Horling and Lesser, 2005). Organization-oriented
models of multi-agent systems have also been used to support processes of real
organizations: goal-related aspects of organizations are considered in (Giorgini
et al., 2006; Maiden et al., 2006), models for different types of organizational
interactions are described in (Horling and Lesser, 2005), an approach to
coordinate the execution of tasks is shown in (Decker, 1996). Although
organization-oriented models developed in the area of multi-agent systems can
be computationally effective for particular tasks, those known to the authors lack
the ontological expressivity required to conceptualize a wide range of concepts
and relations of human organizations. Furthermore, such frameworks only rarely
use the extensive theoretical basis from organization theory. Many agent-based
approaches that incorporate findings from social science are considered in the
area of computational organization theory.
In the area of computational organization theory (Carley, 1996) computational
and mathematical techniques are applied for the investigation of human
organizations; development, testing and improvement of organization theories.
Many models in this area are based on the agent paradigm. Such models aim at
the representation, investigation and prediction of processes in organizations
considered at three representation levels: (1) the macro level that focuses on an
organization as a whole and its relations with the environment; (2) the meso level
that focuses on the interaction between individuals and/or groups in the
organizational context; and (3) the micro level that focuses on an individual of an
organization, his/her characteristics and behaviour in an organization.
Organizational factors that exert an influence on the behaviour of agents are
diverse: norms and regulations related to the task execution and to
communication, a power (authority) system, a reward/punishment system.
Furthermore, organizational factors are interrelated (e.g., a power structure
influences the execution of tasks). However, often models used in computational
organization theory consider only a limited number of the organizational aspects
directly related to the considered research problem and do not reveal (inter-)
dependencies that exist between these and other (indirectly related)
organizational aspects. Neglecting indirect relations between aspects may result

16 NLR-CR-2009-551 December 2009
into limited evaluation possibilities of different organizational processes and may
undermine the practical feasibility of organizational models.
To perform a profound evaluation of the organizational performance and to
enable analysis and prediction of organizational behaviour under different
environmental influences, more sophisticated modelling and analysis techniques
are required that employ concepts and relations between them across different
perspectives on organizations and establish relations between different
representation levels (i.e., micro, meso and macro).
2.2.3 MULTI-VIEW HYBRID ORGANIZATIONAL MODELLING
In this project the generic organization modelling and analysis framework from
(Sharpanskykh, 2008a) was applied. By using multiple views and hybrid
techniques for organizational modelling (Figure 3), it aims to overcome the
restrictions of other organizational modelling approaches discussed above.
Figure 3: Views considered in the multi-view hybrid organizational modelling approach
This framework includes the following key issues.
(1) Expressivity: The modelling methods provide languages with sufficient
expressivity to represent different structural and behavioural aspects of
organizations of different types; furthermore, relations between different
aspects of the organizational reality are specified explicitly. The framework
includes four interrelated modelling views: the performance-oriented view
describes organizational goal structures, performance indicator structures,
and relations between them; the process-oriented view contains information
about the organizational functions and processes, how they are related,
ordered and synchronized and the resources they use and produce; within
NLR-CR-2009-551
December 2009 17
the organization-oriented view organizational roles, their authority,
responsibility and power relations are defined; in the agent-oriented view
different types of agents with their capabilities are identified, models of
agent behaviour are specified based on social theories, and principles of
allocating agents to roles are formulated. Specification of the views is
formalized using sorted predicate logic-based languages. These languages
provide high expressivity for conceptualizing a variety of concepts and
relations and allow expressing both quantitative and qualitative aspects of
different views. To express temporal relations in specifications of the views,
the dedicated languages of the views are embedded into the Temporal Trace
Language (TTL). TTL is a hybrid modelling language, it allows expressing the
behaviour of both discrete and continuous components of an organization.
(2) A strong connection to social science: The meaning attached to the
introduced modelling concepts and the rules of correct use of these concepts
in organizational specifications are specified based on the literature from
social science.
(3) Automated formal analysis: The languages used for the formalization of
organizational specifications allow rigorous automated formal analysis of
these specifications (e.g., by simulation, verification and validation) both
within particular views on organizations and across multiple views.
(4) Complexity: Since specifications for real organizations may be very complex,
means to handle a high complexity and to increase scalability of modelling
and analysis have been developed in the framework.
(5) Support for the execution of organizational scenarios: The developed
methods allow designing organizational specifications that form a basis for
enterprise information systems, which support and control the execution of
organizational scenarios.
(6) Usability: The framework is aimed to be usable and convenient for
organizational practitioners: modellers, designers, analysts, etc.
2.3 ORGANIZATIONAL MODELLING FOR SAFETY ANALYSIS
2.3.1 STAMP
It is recognised by Leveson (2004) that often applied sequential accident models,
which explain accidents in terms of multiple events sequenced as a chain over
time, and related reliability engineering techniques do not effectively account for
(1) social and organizational factors in accidents, (2) system accident and
software errors, (3) human error, and (4) adaptation over time. To account for
these aspects, Leveson (2004) presents a model based on system and control
18 NLR-CR-2009-551 December 2009
theory: STAMP (Systems-Theoretic Accident Model and Processes). In the
underlying concept of safety, accidents occur when external disturbances,
component failures, or dysfunctional interactions among system components are
not adequately handled by the control system. Here, the terms systems and
control are used in a broad context, referring to all aspects and levels of a socio-
technical organization. An accident is not understood in terms of a series of
events, but rather as the result of a lack of constraints imposed on the system
design and on operations.
This safety concept has led to the development of system modelling methods for
risk analysis, which aims at understanding the dynamic risk contributions of
technical and organizational factors, where ‘dynamic’ refers to the risk effects of
changes in organizational and technical factors over time. In such analysis,
models of relevant organizational aspects are developed using system dynamics
methods (Section 2.2.1). For example, in a model for NASA’s safety culture sub-
models such as Launch Rate, System Safety Resource Allocation, Perceived
Success by Management, and System Safety Status were used (Leveson et al.,
2005; Dulac et al., 2007). In this example, emergent properties include perceived
concern for performance, perceived concern for safety, level of risk, and fraction
of corrective action to fix systemic problems. Another example of an application
is the analysis of organizational processes in a water contamination accident
(Leveson, 2004).
Some illustrative archetypes for organizational safety based on control systems
thinking are presented in (Marais et al., 2006). It presents (high-level) control
diagrams for organizational issues, such as stagnant safety practices in the face
of technological advances, decreasing safety consciousness, unintended side-
effects of safety fixes, fixing symptoms rather than root causes, and vicious cycle
of bureaucracy. The variables in these models are at the meso and macro
organizational levels, rather than at the (micro) levels of individuals. As an
example, the control diagram of vicious cycle of bureaucracy is shown in Figure
4. It consists of a reinforcing loop R_{bureaucracy}, which leads to a continuing
increase in bureaucracy by management trying to improve (safety) performance
by formalisation, a balancing loop B_{control devices}, which tries to regulate the
performance by control devices, and a balancing loop B_{make them feel better},
which tries to counteract dysfunctional reactions in an organization by human
relation treatments.

NLR-CR-2009-551
December 2009 19
Figure 4: Control diagram for vicious cycle of bureaucracy (Marais et al., 2006)
2.3.2 SOTERIA
Mohaghegh and Mosleh (2009) presented a wide list of principles of
organizational risk analysis, which cover requirements for the development
process and the characteristics of models for organizational risk analysis. The
foundations for these principles span diverse disciplines, such as risk analysis,
industrial/organizational psychology, organizational theory and human
reliability. Based on these principles, they developed the Socio-Technical Risk
Analysis (SoTeRiA) framework, which is represented schematically in Figure 5. It
describes the forward and feedback loops of a variety of organizational factors
impacting system risk.
Mohaghegh et al. (2009) propose a hybrid technique that uses three types of
modelling techniques to specify a SoTeRiA model:
• Stock and flow diagrams from system dynamics (SD). Mathematically, these
describe sets of ordinary differential equations. They are used to formulate
deterministic dynamics in the model, such as delays and grow and decay
processes.
• Ordinary Bayesian Belief Networks (BBNs) or Qualitative-Quantitative (QQ)
BBNs. Ordinary BBNs represent conditional probabilities between variables in
a directed acyclic graph. QQ BBNs include qualitative scales (e.g. low,

20 NLR-CR-2009-551 December 2009
medium, high) and a mapping mechanism to quantitative scales. They are
used to represent probabilistic relations between organizational factors.
• Event Sequence Diagrams (ESDs) and Fault Trees (FTs). These classical
Probabilistic Risk Assessment Techniques are used to describe relations
between conditions, failures and errors in risk scenarios, leading to
probability estimates of hazardous events.
Figure 5: Schematic representation of SoTeRiA (Mohaghegh et al., 2009)
The application of this hybrid technique is illustrated by an example of aircraft
maintenance and the effects of its quality on aircraft airworthiness and accident
risk. This application includes SD models for management safety commitment,
financial pressure, training management, hiring management, technicians’
commitment and technicians’ error probabilities. BBNs are used to represent
internal auditing factors, regulatory auditing factors and aircraft airworthiness.
FTs and ESDs are used to represent the effect of maintenance-induced engine
failure on flight safety risk levels. The results of this example provided in
(Mohaghegh et al., 2009) indicate related variations in management
commitment, technician commitment, management financial distress, technician
error probability and aircraft accident risk. All in all, the illustrated variations in
the accident risk levels are very small (less than 0.4%).
2.3.3 TOPAZ
Motivated by stochastic system and control theory, researchers at NLR have
developed a systemic accident model methodology for the evaluation of air
traffic risk. This methodology uses Monte Carlo simulations and uncertainty
evaluations to analyse the safety risk of air traffic operations. In (Blom et al.,
2001a,b, 2003a,b) an initial version of this methodology has been introduced
under the name TOPAZ (Traffic Organization and Perturbation AnalyZer).
NLR-CR-2009-551
December 2009 21
Subsequently, this methodology has been extended with multi-agent situation
awareness modelling (Stroeve et al., 2003), an integrated qualitative safety risk
assessment cycle (Blom et al., 2006a), risk bias and uncertainty assessment
(Everdij et al., 2006a), and compositional specification of accident models by
Petri nets (Everdij et al., 2006b).
Key in TOPAZ risk assessments are Monte Carlo simulations of accident models
for air traffic scenarios. These accident models uniquely define the stochastic
dynamics of the relevant agents (human operators and technical systems) by a
compositional specification approach using a stochastic dynamic extension of
the Petri net formalism (Everdij and Blom, 2006b). Within this Petri net formalism
a hierarchically structured representation of the agents in the air traffic scenario
is developed. In this systemic accident modelling approach, the performance of
human operators and technical systems in an environment is thus represented in
an integrated way by coupled stochastic dynamic models. The human
performance modelling is based on a contextual perspective in which human
actions are the results of the interaction between human internal states,
strategies and the environment (Hollnagel, 1998; Wickens and Hollands, 1999).
The multi-agent situation awareness model describes the situation awareness of
each agent as time-dependent information on other agents, including identity,
continuous state variables, mode variables and intent variables (Blom and
Stroeve, 2004; Stroeve et al., 2003). Achieving, acquiring and maintaining
situation awareness depends on processes as observation, communication and
reasoning, which are part of the tasks of the human operator model.
As an integrated part of TOPAZ, a bias and uncertainty assessment method has
been developed (Everdij et al., 2006a). This method supports identification of
differences between the Monte Carlo simulation model and reality, and
subsequent evaluation of the bias and uncertainty in the risk due to these
differences. This evaluation includes assessment of the size of the differences
and the associated risk sensitivity. Typically, feedback from operational experts
is an important source of information in the bias and uncertainty assessment.
TOPAZ has been applied to a range of air traffic safety studies, including:
• collision risk analysis of parallel en-route lanes (Blom et al. 2003a,b,c),
• collision risk analysis of simultaneous missed approaches on converging
runways (Blom et al. 2003d),
• collision risk analysis of incursion on active runway crossings (Stroeve et al.
2003, 2009c)
• collision risk analysis of airborne separation assurance system-based (free
flight) concepts (Blom et al. 2006b).

22 NLR-CR-2009-551 December 2009
3 SAFETY CULTURE
The organizational model that has been developed and validated during this
study is focused on safety culture. As an introduction to this concept Section 3.1
provides some definitions, Section 3.2 presents some related models and Section
3.3 presents methods for assessment of safety culture.
3.1 DEFINITIONS OF ORGANIZATIONAL AND SAFETY CULTURE
There are various definitions of organizational culture, including
• A pattern of basic assumptions – invented, discovered, or developed by a
given group as it learns to cope with its problems of external adaptation and
internal integration; that has worked well enough to be considered valid and,
therefore, to be taught to new members as the correct way to perceive, think,
and feel in relation to those problems (Schein, 1992);
• Shared values (what is important) and beliefs (how things work) that interact
with a company’s people, organizational structures and control systems to
produce behavioral norms (the way we do things around here) (Uttal, 1983);
• A relatively stable, multidimensional, holistic construct shared by (groups of)
organizational members that supplies a frame of reference and which gives
meaning to and/or is typically revealed in certain practices (Guldenmond,
2000);
• The way we do things around here (Hopkins, 2006).
The definition of Schein stems from sociology, Uttal’s one is from management
theory, the definition of Guldenmond is based on a review of a range of
definitions, and the functional one of Hopkins reflects a practitioner’s view.
In addition to the concept of organizational culture, some authors use the term
organizational climate. Guldenmond (2000) and Hopkins (2006) argue that the
terms organizational culture and organizational climate have been used in
various not always distinguishable ways. Currently, the term organizational
climate usually indicates the overt manifestation of organizational culture. Cox
and Cox (1996) compare the culture and climate of an organization with,
respectively, the personality and mood of an individual.
Safety culture reflects safety-relevant aspects of organizational culture. A wide
range of definitions are provided in reviews by Guldenmond (2000) and
Choudhry et al. (2007), including:

NLR-CR-2009-551
December 2009 23
• The set of beliefs, norms, attitudes, and social and technical practices that
are concerned with minimising the exposure of employees, managers,
customers and members of the public to conditions considered dangerous or
injurious (Pidgeon, 1991);
• The product of individual and group values, attitudes, perceptions,
competencies, and patterns of behaviour that determine the commitment to,
and the style and proficiency of the organization’s health and safety
management (Lee, 1996);
• The attitudes, beliefs and perceptions shared by natural groups as defining
norms and values, which determine how they act and react in relation to risk
and risk control systems (Hale, 2000).
Hopkins (2006) notes that there is confusion about the meaning of safety
culture. He argues that the study of organizational culture should be
distinguished from the impact of organizational culture on safety; as such there
is no need to use the term safety culture.
Similarly to the current notion of organizational climate, the term safety climate
is sometimes used to indicate the overt manifestation of safety culture.
3.2 MODELS OF ORGANIZATIONAL/SAFETY CULTURE
Regarding layers or levels of organizational/safety culture, Glendon and Stanton
(2000) and Guldenmond (2000) describe a three-layered model going from an
outer layer to a core. The outer layer refers to observable behaviour, e.g.
meetings, inspection reports, protective equipment, procedures. At a middle
layer are espoused attitudes and perceptions, which are not directly observable
but may be inferred from behaviour or by questioning. At the core level are basic
assumptions, e.g. about the nature of reality and truth, which are not easily
assessed (ethnographic methods may be required).
A related three-level model of safety culture is proposed by Gordon et al. (2006).
They regard safety culture as reflecting the actual level of commitment of norms
set by safety management procedures. The safety culture model used specifies
the relations between ‘what is believed’, ‘what is said’ and ‘what is done’.
Discrepancies between these safety culture aspects are relevant for safety
assessment and management.
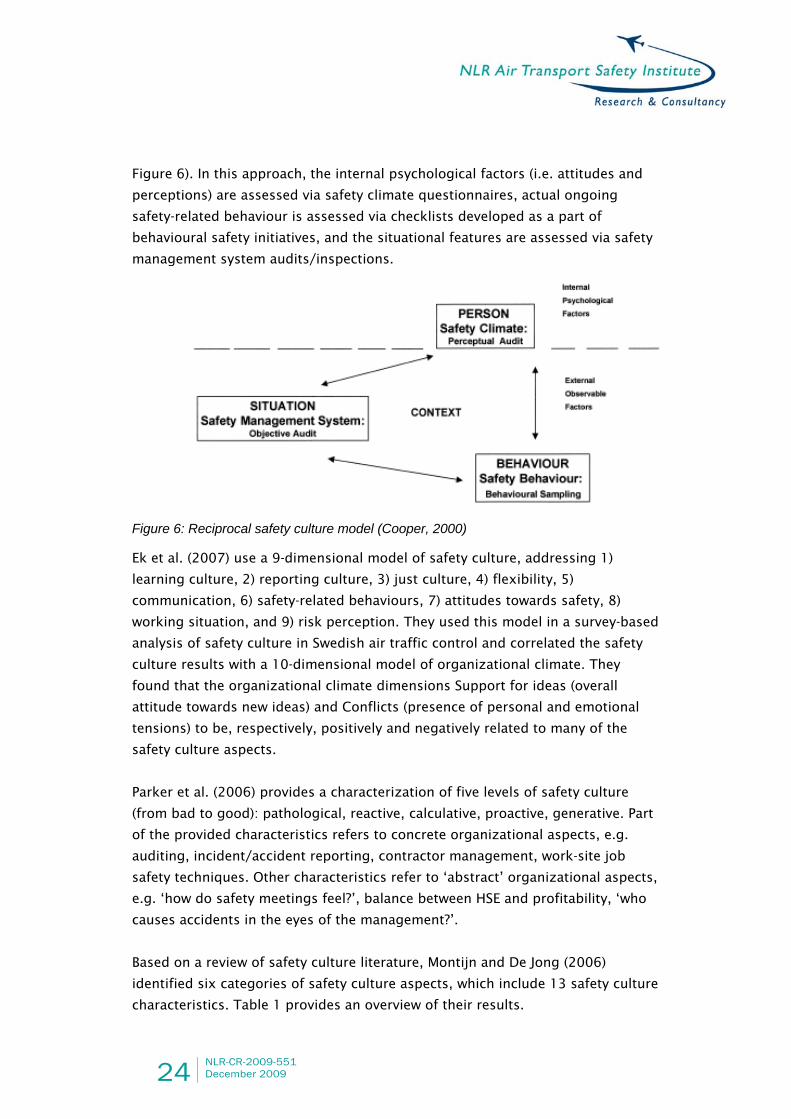
In recognition of interactive contributions from psychological, situational and
behavioural factors in accident causation, Cooper (2000) proposes a reciprocal
safety culture model, which gives a multi-faceted view of safety culture (see
24 NLR-CR-2009-551 December 2009
Figure 6). In this approach, the internal psychological factors (i.e. attitudes and
perceptions) are assessed via safety climate questionnaires, actual ongoing
safety-related behaviour is assessed via checklists developed as a part of
behavioural safety initiatives, and the situational features are assessed via safety
management system audits/inspections.
Figure 6: Reciprocal safety culture model (Cooper, 2000)
Ek et al. (2007) use a 9-dimensional model of safety culture, addressing 1)
learning culture, 2) reporting culture, 3) just culture, 4) flexibility, 5)
communication, 6) safety-related behaviours, 7) attitudes towards safety, 8)
working situation, and 9) risk perception. They used this model in a survey-based
analysis of safety culture in Swedish air traffic control and correlated the safety
culture results with a 10-dimensional model of organizational climate. They
found that the organizational climate dimensions Support for ideas (overall
attitude towards new ideas) and Conflicts (presence of personal and emotional
tensions) to be, respectively, positively and negatively related to many of the
safety culture aspects.
Parker et al. (2006) provides a characterization of five levels of safety culture
(from bad to good): pathological, reactive, calculative, proactive, generative. Part
of the provided characteristics refers to concrete organizational aspects, e.g.
auditing, incident/accident reporting, contractor management, work-site job
safety techniques. Other characteristics refer to ‘abstract’ organizational aspects,
e.g. ‘how do safety meetings feel?’, balance between HSE and profitability, ‘who
causes accidents in the eyes of the management?’.
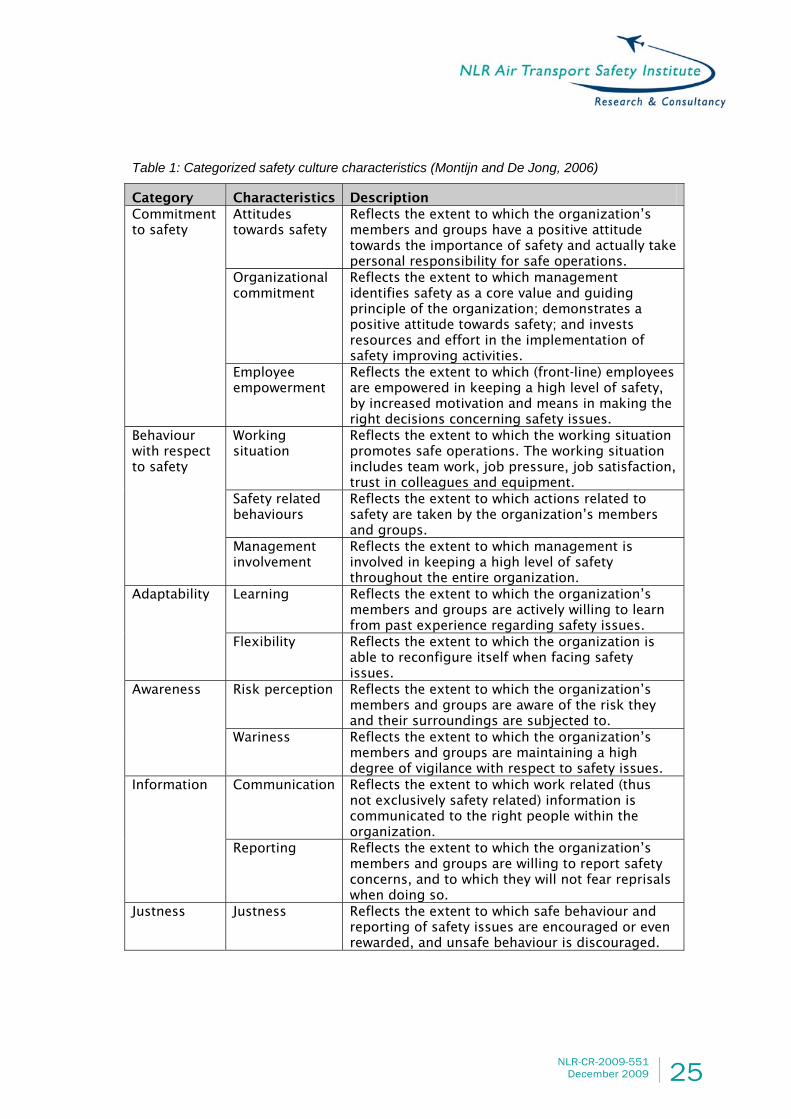
Based on a review of safety culture literature, Montijn and De Jong (2006)
identified six categories of safety culture aspects, which include 13 safety culture
characteristics. Table 1 provides an overview of their results.
NLR-CR-2009-551
December 2009 25
Table 1: Categorized safety culture characteristics (Montijn and De Jong, 2006)
Category Characteristics Description Attitudes towards safety
Reflects the extent to which the organization’s members and groups have a positive attitude towards the importance of safety and actually take personal responsibility for safe operations.
Organizational commitment
Reflects the extent to which management identifies safety as a core value and guiding principle of the organization; demonstrates a positive attitude towards safety; and invests resources and effort in the implementation of safety improving activities.
Commitment to safety
Employee empowerment
Reflects the extent to which (front-line) employees are empowered in keeping a high level of safety, by increased motivation and means in making the right decisions concerning safety issues.
Working situation
Reflects the extent to which the working situation promotes safe operations. The working situation includes team work, job pressure, job satisfaction, trust in colleagues and equipment.
Safety related behaviours
Reflects the extent to which actions related to safety are taken by the organization’s members and groups.
Behaviour with respect to safety
Management involvement
Reflects the extent to which management is involved in keeping a high level of safety throughout the entire organization.
Learning Reflects the extent to which the organization’s members and groups are actively willing to learn from past experience regarding safety issues.
Adaptability
Flexibility Reflects the extent to which the organization is able to reconfigure itself when facing safety issues.
Risk perception Reflects the extent to which the organization’s members and groups are aware of the risk they and their surroundings are subjected to.
Awareness
Wariness Reflects the extent to which the organization’s members and groups are maintaining a high degree of vigilance with respect to safety issues.
Communication Reflects the extent to which work related (thus not exclusively safety related) information is communicated to the right people within the organization.
Information
Reporting Reflects the extent to which the organization’s members and groups are willing to report safety concerns, and to which they will not fear reprisals when doing so.
Justness Justness Reflects the extent to which safe behaviour and reporting of safety issues are encouraged or even rewarded, and unsafe behaviour is discouraged.
26 NLR-CR-2009-551 December 2009
3.3 ASSESSMENT OF SAFETY CULTURE
Surveys (questionnaires, interviews) are often used to study organizational
culture and their effect on safety (e.g. Ek et al. 2007, Montijn and De Jong 2006,
Gordon et al. 2006). They can be used to study organizational practices, as well
as attitudes. It has been noted as a drawback of surveys that they tend to provide
relatively superficial descriptions of organizational culture, since many practices
are too complex and dynamic to be effectively captured in survey questions
(Hopkins, 2006). Furthermore, people may use questionnaires to show a picture
they want to show for company political reasons, rather than indicating their true
perception. Hopkins argues that ethnographic research, where a researchers
study the organization from within, can provide a much richer account of
organizational culture than surveys. Hopkins advocates the use of major accident
inquiries for studying organizational culture and its impact on safety.
EUROCONTROL has developed a safety culture survey approach along a number
of steps, which are illustrated in Figure 7 and which are discussed in detail in
(EUROCONTROL/FAA AP15, 2008). Main steps in this approach are safety culture
questionnaires and workshops. The safety culture questionnaires provide people
in the organization the opportunity to reflect anonymously on a range of
statements about the attitudes and the way the work is done. The answers are
provided via a five-point scale as illustrated in Figure 8. The data of the
questionnaires are analysed and key safety culture issues are identified on the
basis of the statistics. Next, there are several workshops with small groups of
people from different parts of the organization. The aims of the workshops are
to ensure that the interpretation from the questionnaire results are complete and
correct, to discuss organizational causes underlying the safety culture issues,
and to identify candidate solutions for these issues. The EUROCONTROL safety
culture survey approach has now been applied at a large number of ANSPs in
Europe. Data derived by this survey approach has been used in this study as will
be outlined in Section 4.

NLR-CR-2009-551
December 2009 27
Figure 7: Steps in the EUROCONTROL safety culture survey approach (EUROCONTROL/FAA AP15, 2008)
Figure 8: Examples of part of a safety culture questionnaire (EUROCONTROL/FAA AP15, 2008)

28 NLR-CR-2009-551 December 2009
4 MODELLING AND VALIDATION OF SAFETY
CULTURE AT A SPECIFIC ANSP
4.1 INTRODUCTION
Based on a literature survey on safety modelling and analysis of organizational
processes reported in (Stroeve et al., 2007a) and highlighted in Section 2, we
found that the organizational modelling framework proposed by Sharpanskykh
(2008a) presents the widest repertoire of desired organizational modelling
features. Therefore this method was employed for the development of an
organizational model for the analysis of safety culture aspects in relation to
safety occurrence reporting at a particular ANSP, referred to as ANSP-3. The
model results were compared with the results of a EUROCONTROL safety culture
survey study of ANSP-3. The modelling and validation study was done in the
following three phases:
• Phase 1: Comparison of model-based and survey-based safety culture
indicators, where the input values of the model were completely based on
organizational information available prior to the survey questionnaire results;
• Phase 2: Comparison of model-based and survey-based safety culture
indicators, where the input values of the model used organizational
information in combination with survey questionnaire results;
• Phase 3: Comparison of major organizational factors affecting the safety
culture indicators and related organizational improvement options, which
were inferred from a sensitivity analysis of the organizational model, with key
issues and recommendations stemming from the safety culture survey
workshop results.
Section 4.2 presents general safety culture issues, which were identified as a
starting point for the model development. Section 4.3 highlights key features of
the developed agent-based organizational model. Sections 4.4, 4.5 and 4.6
present the model and validation results of Phases 1, 2 and 3, respectively.
Section 4.7 discusses the obtained results for the application case.
4.2 IDENTIFICATION OF SAFETY CULTURE ISSUES
To identify safety culture aspects relevant for the occurrence reporting,
EUROCONTROL safety culture survey results of two ANSPs (ANSP-1, ANSP-2) and

NLR-CR-2009-551
December 2009 29
safety culture data from the literature have been analysed, and interviews have
been conducted with experts at EUROCONTROL Head Quarters and at a third
ANSP (ANSP-3). As result of this analysis, a categorised set of safety culture
issues that impact safety occurrence reporting has been determined. For each
issue in the identified set, required organization modelling aspects have been
identified. Then, based on a number of criteria, the selection of the most relevant
modelling aspects has been performed for further inclusion in the model.
Occurrence reporting
Group1:Individual aspects
Individualsafety-related
needs and goals
Individualsafety-related
beliefs and attitudes
Individualcommitment
to safety
Individualcapabilities
Group3:Intra-organisational
aspects
Organisationalsafety-related goals
Organisationalprocedures,
regulations andworking practices
Intra-organisationalinteraction
Reward/blamesystem
Organisationallearning
Staffing
Group 2: Team aspects
Team compositionand collaboration
Safety-related values/attitudes of a team
Leadership
Interaction withregulator
Interaction with pilots
Interaction withMinistry of Justice
Group 4: Inter-organisational aspects
Figure 9: Identified groups of aspects that influence safety occurrence reporting
Figure 9 shows the categorization of factors that influence occurrence reporting
(Sharpanskykh and Stroeve, 2008a). It discerns four aggregation levels for the
organization of safety occurrence reporting at an ANSP:
1. The level of an individual in the organisation (e.g. a controller, a supervisor, a
manager);
2. The level of a team (e.g. a team of air traffic controllers);
3. The level of an organisation (i.e. intra-organisational structures, as
departments in an ANSP);
4. The level of inter-organisational interaction (i.e. influences from other
organisations on an ANSP).
Examples of the identified safety culture issues for these four aggregation levels
are shown in Table 2. These issues form a basis for the development of the
agent-based organizational model, which will be discussed in the next section.
30 NLR-CR-2009-551 December 2009
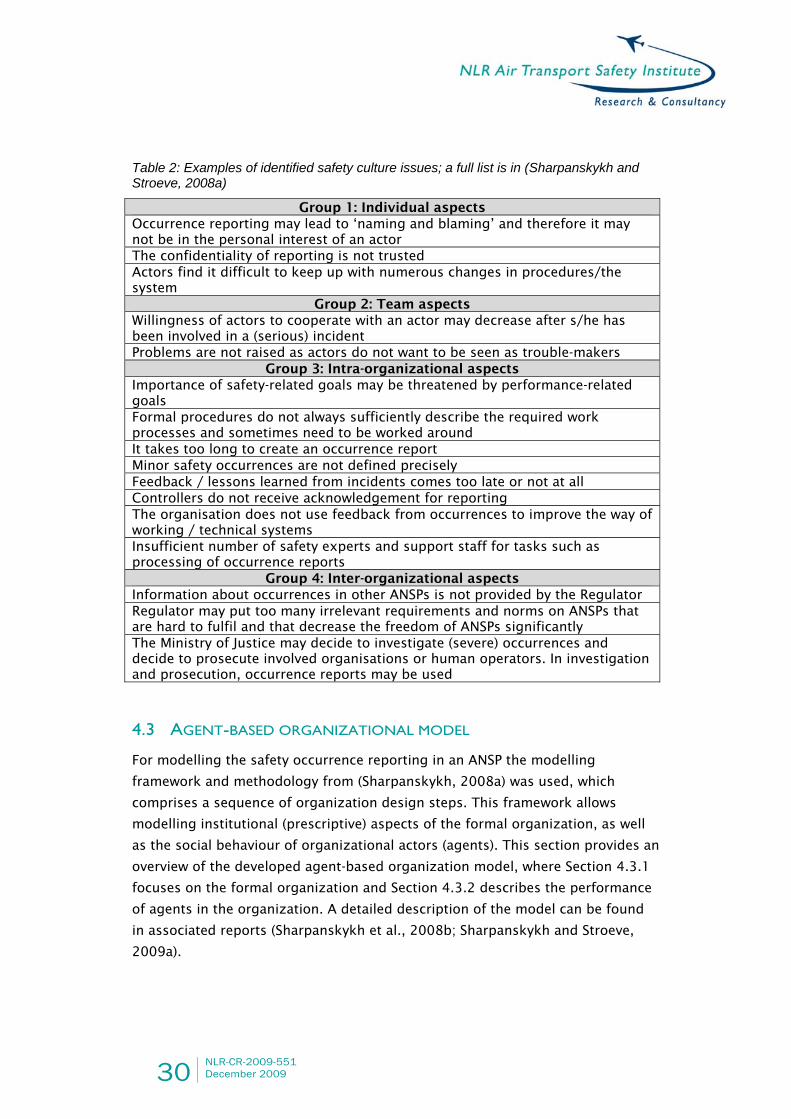
Table 2: Examples of identified safety culture issues; a full list is in (Sharpanskykh and Stroeve, 2008a)
Group 1: Individual aspects Occurrence reporting may lead to ‘naming and blaming’ and therefore it may not be in the personal interest of an actor The confidentiality of reporting is not trusted Actors find it difficult to keep up with numerous changes in procedures/the system
Group 2: Team aspects Willingness of actors to cooperate with an actor may decrease after s/he has been involved in a (serious) incident Problems are not raised as actors do not want to be seen as trouble-makers
Group 3: Intra-organizational aspects Importance of safety-related goals may be threatened by performance-related goals Formal procedures do not always sufficiently describe the required work processes and sometimes need to be worked around It takes too long to create an occurrence report Minor safety occurrences are not defined precisely Feedback / lessons learned from incidents comes too late or not at all Controllers do not receive acknowledgement for reporting The organisation does not use feedback from occurrences to improve the way of working / technical systems Insufficient number of safety experts and support staff for tasks such as processing of occurrence reports
Group 4: Inter-organizational aspects Information about occurrences in other ANSPs is not provided by the Regulator Regulator may put too many irrelevant requirements and norms on ANSPs that are hard to fulfil and that decrease the freedom of ANSPs significantly The Ministry of Justice may decide to investigate (severe) occurrences and decide to prosecute involved organisations or human operators. In investigation and prosecution, occurrence reports may be used
4.3 AGENT-BASED ORGANIZATIONAL MODEL
For modelling the safety occurrence reporting in an ANSP the modelling
framework and methodology from (Sharpanskykh, 2008a) was used, which
comprises a sequence of organization design steps. This framework allows
modelling institutional (prescriptive) aspects of the formal organization, as well
as the social behaviour of organizational actors (agents). This section provides an
overview of the developed agent-based organization model, where Section 4.3.1
focuses on the formal organization and Section 4.3.2 describes the performance
of agents in the organization. A detailed description of the model can be found
in associated reports (Sharpanskykh et al., 2008b; Sharpanskykh and Stroeve,
2009a).
NLR-CR-2009-551
December 2009 31
4.3.1 SPECIFICATION OF FORMAL ORGANIZATION
A specification of the formal organization is provided along three interrelated
views: organization-oriented view, performance-oriented view and process-
oriented view. The methodology for the model development along these views
includes various steps, which can be read in (Sharpanskykh, 2008a;
Sharpanskykh et al., 2008b; Stroeve et al., 2007b, 2008).
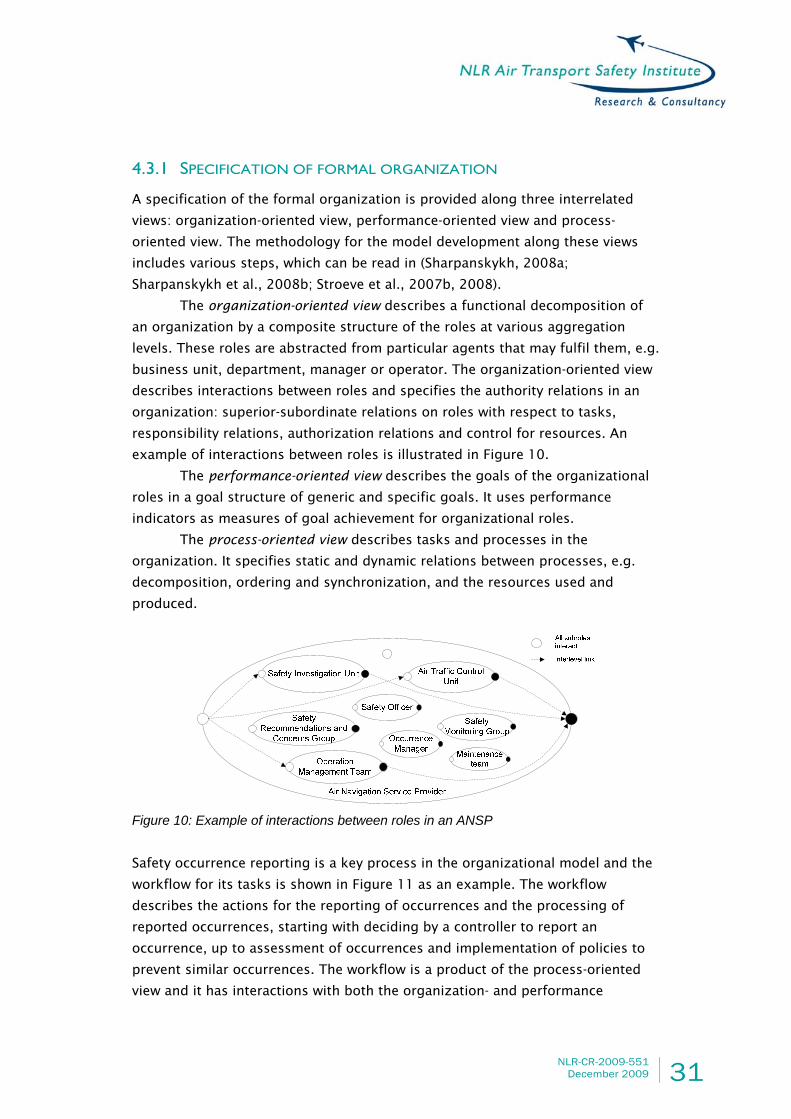
The organization-oriented view describes a functional decomposition of
an organization by a composite structure of the roles at various aggregation
levels. These roles are abstracted from particular agents that may fulfil them, e.g.
business unit, department, manager or operator. The organization-oriented view
describes interactions between roles and specifies the authority relations in an
organization: superior-subordinate relations on roles with respect to tasks,
responsibility relations, authorization relations and control for resources. An
example of interactions between roles is illustrated in Figure 10.
The performance-oriented view describes the goals of the organizational
roles in a goal structure of generic and specific goals. It uses performance
indicators as measures of goal achievement for organizational roles.
The process-oriented view describes tasks and processes in the
organization. It specifies static and dynamic relations between processes, e.g.
decomposition, ordering and synchronization, and the resources used and
produced.
Figure 10: Example of interactions between roles in an ANSP Safety occurrence reporting is a key process in the organizational model and the
workflow for its tasks is shown in Figure 11 as an example. The workflow
describes the actions for the reporting of occurrences and the processing of
reported occurrences, starting with deciding by a controller to report an
occurrence, up to assessment of occurrences and implementation of policies to
prevent similar occurrences. The workflow is a product of the process-oriented
view and it has interactions with both the organization- and performance

32 NLR-CR-2009-551 December 2009
oriented views. In relation with the organization-oriented view, the
responsibilities of the roles for the tasks in the workflow are defined, e.g., the
Controller role is responsible for execution of and decision making with respect
to the task ‘Create a notification report’, the Controller Supervisor is responsible
for monitoring and consulting for this task. In relation with the performance-
oriented view, goals that are pursued by tasks in a workflow are addressed, e.g.
goals to achieve particular reporting quality levels.
Figure 11: Workflow example: occurrence reporting
4.3.2 SPECIFICATION OF AGENTS
An agent is an entity that is able to perceive and act upon its environment. The
behaviour of an agent can be considered from external and internal perspectives.
From the external perspective the behaviour can be specified by dynamic
relations between agent’s input and output states, corresponding to interaction
with other agents and with the environment in a multi-agent organization (Figure
12). An agent perceives information by observation or communication and
generates output in the form of communication or actions.
NLR-CR-2009-551
December 2009 33
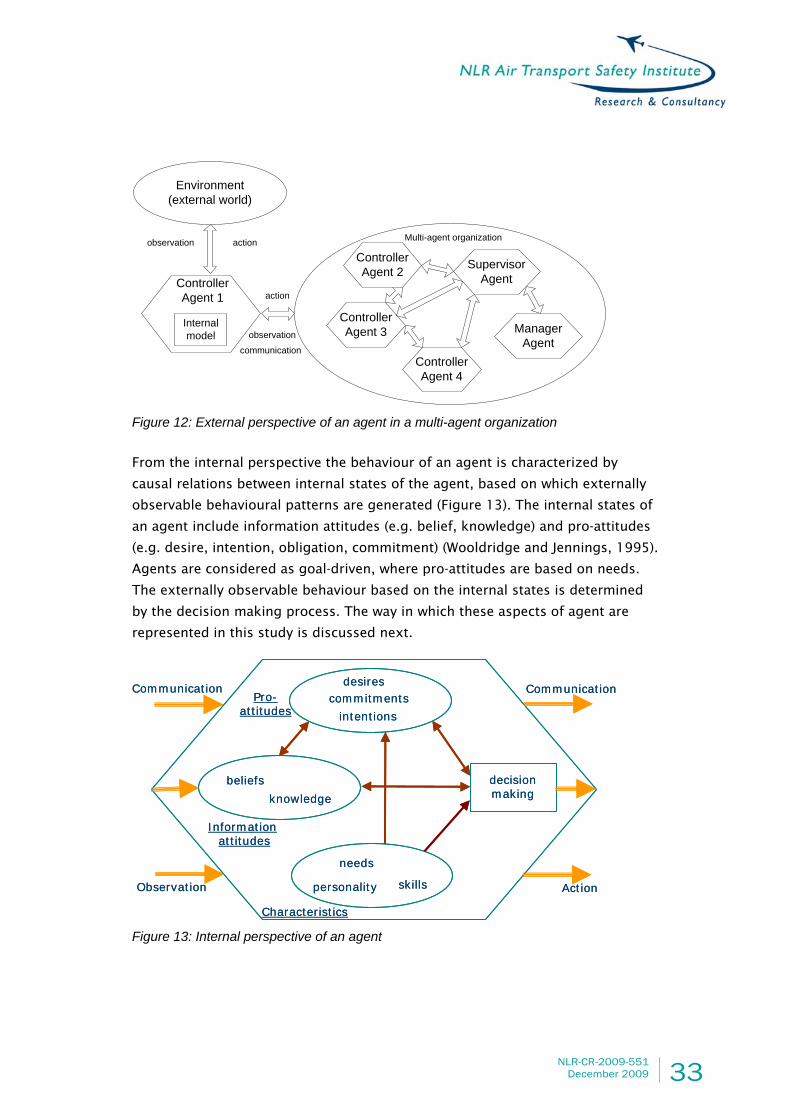
Figure 12: External perspective of an agent in a multi-agent organization From the internal perspective the behaviour of an agent is characterized by
causal relations between internal states of the agent, based on which externally
observable behavioural patterns are generated (Figure 13). The internal states of
an agent include information attitudes (e.g. belief, knowledge) and pro-attitudes
(e.g. desire, intention, obligation, commitment) (Wooldridge and Jennings, 1995).
Agents are considered as goal-driven, where pro-attitudes are based on needs.
The externally observable behaviour based on the internal states is determined
by the decision making process. The way in which these aspects of agent are
represented in this study is discussed next.
Communication
Observation
Communication
Action
beliefs
knowledge
Information attitudes
desirescommitments
intentions
Pro-attitudes
Characteristics
needs
decisionmaking
skillspersonality
Communication
Observation
Communication
Action
beliefs
knowledge
Information attitudes
desirescommitments
intentions
Pro-attitudes
Characteristics
needs
decisionmaking
skillspersonality
Figure 13: Internal perspective of an agent
ControllerAgent 1
ControllerAgent 4
ControllerAgent 3
ControllerAgent 2 Supervisor
Agent
ManagerAgent
Internalmodel
Environment(external world)
observation
action
communication
actionobservation Multi-agent organization
34 NLR-CR-2009-551 December 2009
Agent’s information attitudes and pro-attitudes
Agents create time-labelled internal representations (beliefs) about their input
and output states, which may persist over time. Besides beliefs about single
states, an agent forms beliefs about dependencies between its own states,
observed states of the environment, and observed states of other agents. In the
developed model we use the Temporal Trace Language (TTL) (Sharpanskykh,
2008a) to represent temporal relations between state properties. For example,
the property that for all time points if an agent ag believes that action a is
rewarded with r, then ag will after 30 time units perform a, is formalized in TTL
as:
∀t:TIME [ at(internal(ag, belief(reward_for_action(r, a))), t) →
at(output(ag, performed_action(a)), t+30) ]
In our study relations between agent’s states are mostly modelled by causal
networks (Pearl, 2000), which describe weighted static mappings between
‘evidence variables’, which take on values in the range from 0 to 1. As an
example Figure 14 shows the causal network for the commitment to safety of a
controller. According to this causal network, a controller agent’s commitment to
safety is influenced by the perceived commitment to safety of team members and
the management, by the priority of safety-related goals in the role description, by
the influence of the controller on safety activities and by the maturity level of the
controller (Burt, 1987; Griffin and Bateman, 1986). The rounded boxes in Figure
14 refer to evidence variables that are considered as input of the organizational
model and the rectangular boxes refer to evidence variables that depend on
other evidence variables in the model. For instance, an agent evaluates the
management’s commitment to safety by considering factors that reflect the
management’s effort in contributing to safety, such as investment in personnel
and technical systems, training and safety arrangements. As another example,
the maturity level of a controller depends on aspects as the self-confidence, the
commitment to perform the ATC task, the level of skill and the level of training
of the agent and the quality of feedback on occurrence reporting received by the
agent. By interconnection of causal networks feedback loops exist in the model.

NLR-CR-2009-551
December 2009 35
Commitment to safety of a controller
Priority of safety-related goals in the role
description
Perception of commitment to safety of
management
Perception of commitment to safety of
team
Influence of a controller on safety activities
Maturity level w.r.t. ATC task
e1
e2
e3
e4
e5
e6
w1
w2
w3
w4
w5
Figure 14: Causal network for ‘Commitment to safety of a controller’ Agent’s needs
Social science considers behaviour of individuals as goal-driven, where the
individual goals are based on needs. Three types of needs are distinguished: (1)
extrinsic needs associated with biological comfort and material rewards; (2)
social interaction needs that refer to the desire for social approval and affiliation,
e.g. own group approval and management approval; (3) intrinsic needs that
concern the desires for self-development and self-actualization, e.g. contribution
to safety-related goals, self-esteem and self-confidence. Different needs have
different priorities and minimal acceptable satisfaction levels for individuals in
different cultures. In this study we use the cultural classification framework of
Hofstede (2005), which considers three indices: individualism index reflects the
degree to which individuals are not integrated into groups; power distance index
is the extent to which the less powerful members of an organization accept and
expect that power is distributed unequally; and uncertainty avoidance index
deals with individual’s tolerance for uncertainty and ambiguity. The model uses
values for these indices that are suitable for Western European culture (Hofstede,
2005). The model has internal states that represent to what extent the agent’s
needs are satisfied as result of external events, the behaviour of other agents
and decisions made. The level of satisfaction of agent’s needs influences the
decision making process.
Agent’s decision making process
The decision making model of agents is based on the expectancy theory by
Vroom (Pinder, 1998) and it is illustrated in Figure 15. According to Vroom’s
theory, when a human evaluates alternative possibilities to act, the following

36 NLR-CR-2009-551 December 2009
factors are explicitly or implicitly taken into account: valence, expectancy and
instrumentality.
• Expectancy refers to the individual’s belief about the likelihood that a
particular act will be followed by a particular outcome (called a first-level
outcome). For example in Figure 15, the expectancy E12 refers to the agent’s
belief of the likelihood that reporting of an occurrence will be followed by an
administrative reprimand.
• Instrumentality is a belief concerning the likelihood that a first level outcome
results into a second level outcome, which represents a (un)desirable state as
reflected by the agent’s needs. For example in Figure 15, the instrumentality
I32 refers to the belief about the likelihood that own group appreciation of
the action results in own group approval.
• Valence refers to the strength of the individual’s desire for an outcome or
state of affairs. The values of valances depend on the degree of satisfaction
of the agent’s need: the more a need is satisfied, the less is its valence. In Vroom’s model the force iF on an individual to perform an act is defined as:
1 1
n m
i ij k jkj k
F E V I= =
= ⋅ ×∑ ∑
Here ijE is the strength of the expectancy that act i will be followed by outcome
j; kV is the valence of the second level outcome k; jkI is perceived
instrumentality of outcome j for the attainment of outcome k. The agent’s
decision making model considers two forces for reporting or not reporting; the
alternative with the greatest force is performed.
Expectancies, instrumentalities and valences are dynamic variables that change
over time due to individual and organizational learning. In particular, in the
model their values depend on the occurrence of events and on related evidence
variables. For example in Figure 15, the agent’s expectancies E12 and E15
change depending on the reprimands and rewards for occurrences reported by
the agent or another agent in its shift (instrumentalist/social learning); and E16
is adjusted based on the feedback from the safety investigator agent on
previously reported occurrences and the observed implementation of safety
recommendations for previous reports (instrumentalist learning), as well as
safety information informally provided by other controllers during breaks (social
learning).

NLR-CR-2009-551
December 2009 37
Figure 15: Decision making model for reporting an occurrence (E’s are expectancies, I’s are instrumentalities and V’s are valences)
4.3.3 MODEL PARAMETERS AND OUTPUTS
The dynamics of the agent-based organizational model depend on the model
structure such as outlined in the previous sections and on a range of parameter
values. We distinguish the following types of parameters:
• Evidence input variables, which are the independent inputs of the causal
networks in the model (Table 3 provides a list of all 22 evidence input
variables);
• Weights, which reflect the importance of mappings between the evidence
variables in the causal networks (the model contains 60 weights);
• Task durations, which refer to the (limits of) task durations in workflows (the
model contains upper and lower bounds for 16 tasks);
• Decision making, which are related to Vroom’s decision making model (28
parameters);
• Other (55 parameters).
In this study we used two sets of parameter values, which will be discussed later.

38 NLR-CR-2009-551 December 2009
Table 3: Model input evidence variables
Variable Description
e1 Priority of safety-related goals in the role description e4 Influence of a controller on safety activities e7 Sufficiency of the amount of safety investigators e8 Sufficiency of the amount of controllers e9 Availability of reliable and ergonomic technical systems for controllers
e10 Sufficiency and timeliness of training for changes e11 Regularity of safety meetings e12 Developed and implemented safety management system (SMS) e14 Level of development of managerial skills e19 Self-confidence for ATC task e20 Commitment to perform ATC task e21 Development level of skills for ATC task e25 Sufficiency of the number of maintenance personal e26 Quality of formal procedures for system checks and repairs e35 Intensity of informal interactions in the team of controllers e36 Quality of the formal safety occurrence assessment procedure e40 Quality of the communication channel between controllers and safety
investigators e44 Average commitment of the agents involved in the safety analysis
e61 Individualism index of a controller
e62 Power distance index of a controller
e63 Masculinity index of a controller
e64 Uncertainty avoidance index of a controller
e71 Formal support for confidentiality of reporting
Based on a broad list of safety culture issues related to occurrence reporting that
we identified in (Sharpanskykh and Stroeve, 2008a), Table 4 shows the eight
safety culture indicators that are observable in the agent-based organizational
model; these are the model outputs.
Table 4: Model output safety culture indicators
Index Safety culture indicator
I1.1 Average reporting quality of controllers. It refers to the ratio of reported versus observed occurrences.
I2.1 Average quality of the processed notification reports. It refers to the correctness and completeness of information about the reported occurrences.
I3.1 Average quality of the final safety occurrence assessment reports. It refers to the completeness of the occurrence report with respect to the causes of the occurrence.
I4.1 Average quality of the monthly safety overview reports received by controllers. It refers to the completeness of the report with respect to the safety trends.

NLR-CR-2009-551
December 2009 39
Index Safety culture indicator I5.1 Average commitment to safety of controllers. I5.2 Average commitment to safety of a team as perceived by controllers. I6 Average commitment to safety of a supervisor as perceived by controllers. I7 Average commitment to safety of management as perceived by controllers.
4.4 MODEL AND VALIDATION PHASE 1
In Model and Validation Phase 1, the safety culture indicators were predicted by
the agent-based organizational model on the basis of organizational information
of ANSP-3, without any knowledge of the safety culture survey results of ANSP-3.
The organizational information used in this phase was based on interviews with a
safety manager and a safety occurrence investigator of ANSP-3, as well as
documentation about the Safety Management System of ANSP-3. In combination
with general scientific knowledge about psychological, sociological and
organization cultural aspects, this specific information was used to develop the
model structure (as explained in Sections 4.3.1 and 4.3.2), and it was used for
setting up values for the parameters (listed in Section 4.3.3).
As a basis for the validation in Phase 1 we used results of the safety culture
survey questionnaire at ANSP-3. In the validation plan (Sharpanskykh and
Stroeve, 2008b), which was written before we received any questionnaire results,
we defined relations between safety culture indicators and particular questions in
the survey questionnaire. Table 5 shows some examples of questions that are
related to the safety culture indicators. For the cases where an indicator is
related to multiple questions, a weight is assigned to each question indicating
the degree of importance of the question for the safety culture indicator.
Table 5: Examples of coupling between safety culture indicators and safety culture survey questions
Safety culture indicator No. Description
Related survey questions Weight
A.24 People understand the need to report incidents in order to identify trends and make changes to the system if required
0.5
A.31. If I see an unsafe practice by a colleague I am able to report it in a way that we all learn lessons from it.
0.3 I1.1 Average reporting quality of controllers
A.32. If I do something unsafe I am aware that I may be asked to explain myself
0.2
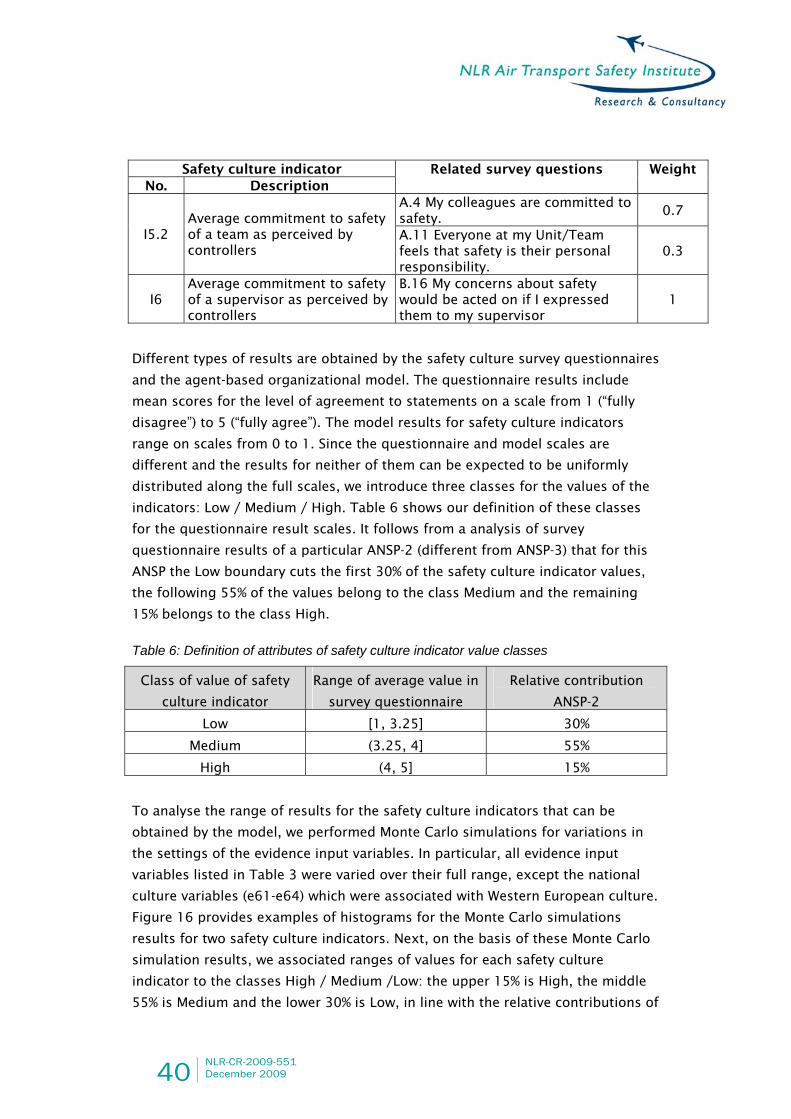
40 NLR-CR-2009-551 December 2009
Safety culture indicator No. Description
Related survey questions Weight
A.4 My colleagues are committed to safety.
0.7
I5.2 Average commitment to safety of a team as perceived by controllers
A.11 Everyone at my Unit/Team feels that safety is their personal responsibility.
0.3
I6 Average commitment to safety of a supervisor as perceived by controllers
B.16 My concerns about safety would be acted on if I expressed them to my supervisor
1
Different types of results are obtained by the safety culture survey questionnaires
and the agent-based organizational model. The questionnaire results include
mean scores for the level of agreement to statements on a scale from 1 (“fully
disagree”) to 5 (“fully agree”). The model results for safety culture indicators
range on scales from 0 to 1. Since the questionnaire and model scales are
different and the results for neither of them can be expected to be uniformly
distributed along the full scales, we introduce three classes for the values of the
indicators: Low / Medium / High. Table 6 shows our definition of these classes
for the questionnaire result scales. It follows from a analysis of survey
questionnaire results of a particular ANSP-2 (different from ANSP-3) that for this
ANSP the Low boundary cuts the first 30% of the safety culture indicator values,
the following 55% of the values belong to the class Medium and the remaining
15% belongs to the class High.
Table 6: Definition of attributes of safety culture indicator value classes
Class of value of safety
culture indicator
Range of average value in
survey questionnaire
Relative contribution
ANSP-2
Low [1, 3.25] 30%
Medium (3.25, 4] 55%
High (4, 5] 15%
To analyse the range of results for the safety culture indicators that can be
obtained by the model, we performed Monte Carlo simulations for variations in
the settings of the evidence input variables. In particular, all evidence input
variables listed in Table 3 were varied over their full range, except the national
culture variables (e61-e64) which were associated with Western European culture.
Figure 16 provides examples of histograms for the Monte Carlo simulations
results for two safety culture indicators. Next, on the basis of these Monte Carlo
simulation results, we associated ranges of values for each safety culture
indicator to the classes High / Medium /Low: the upper 15% is High, the middle
55% is Medium and the lower 30% is Low, in line with the relative contributions of
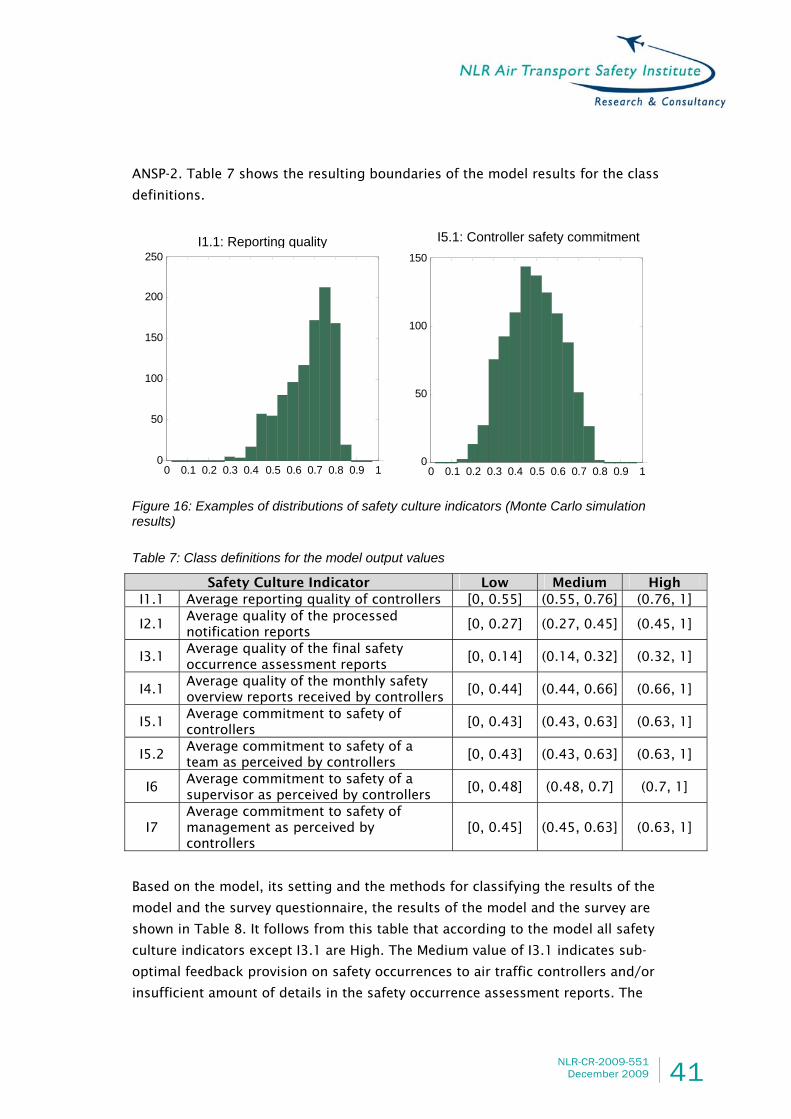
NLR-CR-2009-551
December 2009 41
ANSP-2. Table 7 shows the resulting boundaries of the model results for the class
definitions.
Figure 16: Examples of distributions of safety culture indicators (Monte Carlo simulation results) Table 7: Class definitions for the model output values
Safety Culture Indicator Low Medium High I1.1 Average reporting quality of controllers [0, 0.55] (0.55, 0.76] (0.76, 1]
I2.1 Average quality of the processed notification reports
[0, 0.27] (0.27, 0.45] (0.45, 1]
I3.1 Average quality of the final safety occurrence assessment reports
[0, 0.14] (0.14, 0.32] (0.32, 1]
I4.1 Average quality of the monthly safety overview reports received by controllers
[0, 0.44] (0.44, 0.66] (0.66, 1]
I5.1 Average commitment to safety of controllers
[0, 0.43] (0.43, 0.63] (0.63, 1]
I5.2 Average commitment to safety of a team as perceived by controllers
[0, 0.43] (0.43, 0.63] (0.63, 1]
I6 Average commitment to safety of a supervisor as perceived by controllers
[0, 0.48] (0.48, 0.7] (0.7, 1]
I7 Average commitment to safety of management as perceived by controllers
[0, 0.45] (0.45, 0.63] (0.63, 1]
Based on the model, its setting and the methods for classifying the results of the
model and the survey questionnaire, the results of the model and the survey are
shown in Table 8. It follows from this table that according to the model all safety
culture indicators except I3.1 are High. The Medium value of I3.1 indicates sub-
optimal feedback provision on safety occurrences to air traffic controllers and/or
insufficient amount of details in the safety occurrence assessment reports. The
I1.1: Reporting quality
0 0.1 0.2 0.3 0.4 0.5 0.6 0.7 0.8 0.9 10
50
100
150
200
250
0 0.1 0.2 0.3 0.4 0.5 0.6 0.7 0.8 0.9 10
50
100
150
I5.1: Controller safety commitment
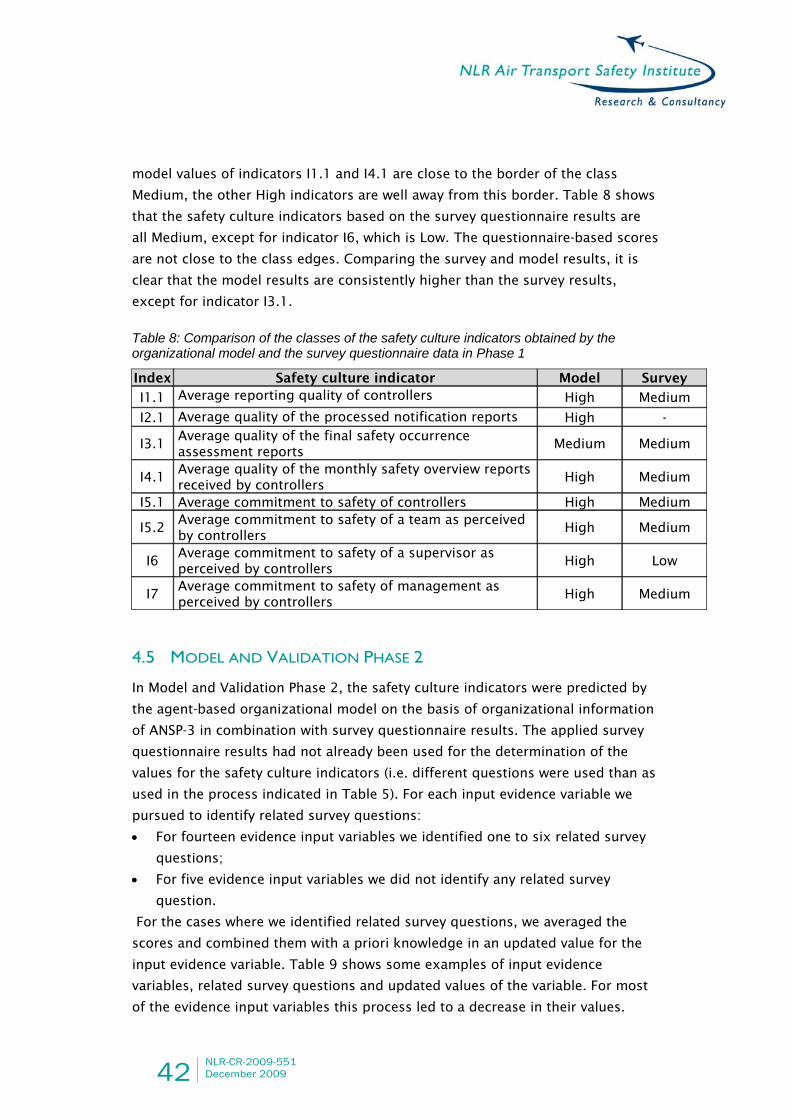
42 NLR-CR-2009-551 December 2009
model values of indicators I1.1 and I4.1 are close to the border of the class
Medium, the other High indicators are well away from this border. Table 8 shows
that the safety culture indicators based on the survey questionnaire results are
all Medium, except for indicator I6, which is Low. The questionnaire-based scores
are not close to the class edges. Comparing the survey and model results, it is
clear that the model results are consistently higher than the survey results,
except for indicator I3.1.
Table 8: Comparison of the classes of the safety culture indicators obtained by the organizational model and the survey questionnaire data in Phase 1
Index Safety culture indicator Model Survey
I1.1 Average reporting quality of controllers High Medium
I2.1 Average quality of the processed notification reports High -
I3.1 Average quality of the final safety occurrence assessment reports
Medium Medium
I4.1 Average quality of the monthly safety overview reports received by controllers
High Medium
I5.1 Average commitment to safety of controllers High Medium
I5.2 Average commitment to safety of a team as perceived by controllers
High Medium
I6 Average commitment to safety of a supervisor as perceived by controllers
High Low
I7 Average commitment to safety of management as perceived by controllers
High Medium
4.5 MODEL AND VALIDATION PHASE 2
In Model and Validation Phase 2, the safety culture indicators were predicted by
the agent-based organizational model on the basis of organizational information
of ANSP-3 in combination with survey questionnaire results. The applied survey
questionnaire results had not already been used for the determination of the
values for the safety culture indicators (i.e. different questions were used than as
used in the process indicated in Table 5). For each input evidence variable we
pursued to identify related survey questions:
• For fourteen evidence input variables we identified one to six related survey
questions;
• For five evidence input variables we did not identify any related survey
question.
For the cases where we identified related survey questions, we averaged the
scores and combined them with a priori knowledge in an updated value for the
input evidence variable. Table 9 shows some examples of input evidence
variables, related survey questions and updated values of the variable. For most
of the evidence input variables this process led to a decrease in their values.

NLR-CR-2009-551
December 2009 43
Table 9: Update of evidence input variables, based on survey questionnaire results
Value of variable Variable Description Related survey questions
Old New
A.1. Balancing safety against the other requirements of my job is a challenge
A.5. Safety is a responsibility shared throughout the organization
e1 Priority of safety-related goals in the role description
A.12. The other people in the organization do not understand the safety roles we fulfil
0.90 0.70
B.2 Our opinion and input into safety assessments are actively sought after. B.12 We are consulted about changes to the technical/engineering system that impact on the way we do our work
e4 Influence of a controller on safety activities
B.15 I have the opportunity to provide input in the ATC systems development or acquisition process.
0.70 0.50
e9 Availability of reliable and ergonomic technical systems for controllers
B.8 I trust the ATC equipment that I use in my job.
0.90 0.75
Based on the updated values of the input evidence variables, new model
simulation results were obtained. Table 10 shows the updated model results in
relation with the (unchanged) survey-based results. All safety culture indicators
are now in the class Medium, except for indicator I2.1. Indicators I1.1 and I7 are
close to the class boundary with High, all other indicators are well off from a
class boundary. It follows from a comparison of the original model results in
Table 8 and the updated model results in Table 10 that all indicators transferred
to a lower class, except for indicators I2.1 and I3.1. Comparison of the model
and survey results in Table 10 shows that the results are consistent for six out of
seven indicators, only the result for indicator I6 is lower in the survey than in the
model. As a result of the input updating the consistency between the model and
the survey-based results for the safety culture indicators has thus increased
considerably.

44 NLR-CR-2009-551 December 2009
Table 10: Comparison of the safety culture indicator classes for the survey data and for the organizational model with updated model input values
Index Safety culture indicator Model Survey
I1.1 Average reporting quality of controllers Medium Medium
I2.1 Average quality of the processed notification reports High -
I3.1 Average quality of the final safety occurrence assessment reports Medium Medium
I4.1 Average quality of the monthly safety overview reports received by controllers
Medium Medium
I5.1 Average commitment to safety of controllers Medium Medium
I5.2 Average commitment to safety of a team as perceived by controllers
Medium Medium
I6 Average commitment to safety of a supervisor as perceived by controllers
Medium Low
I7 Average commitment to safety of management as perceived by controllers
Medium Medium
4.6 MODEL AND VALIDATION PHASE 3
In Model and Validation Phase 3 we predicted organizational factors at ANSP-3
that are important for its safety culture indicators and on the basis of these
factors we proposed a number of organizational improvement options as ways to
improve the safety culture. Next we compared these results with issues and
recommendations that were identified in workshops of the EUROCONTROL safety
culture survey at ANSP-3. In coordination with the EUROCONTROL experts who
performed the safety culture survey we reached a conclusion about the level of
agreement between the model- and the survey-based results.
The basis for the model-based identification of Major Organizational Factors is a
sensitivity analysis, which is presented in Section 4.6.1. The identified Major
Organizational Factor and the comparison with the safety culture survey results
are presented in Section 4.6.2. The identified Organizational Improvement
Options and the comparison with the recommendations in the safety culture
survey study are presented in Section 4.6.3.
4.6.1 SENSITIVITY ANALYSIS
The sensitivity analysis method used in this study is Monte Carlo filtering
(Saltelli, 2006, 2008). The aim of Monte Carlo filtering is to identify the model
parameters of which the variation according to associated credibility intervals
lead to significant differences in attained model output classes. It consists of two
steps, which are presented next.
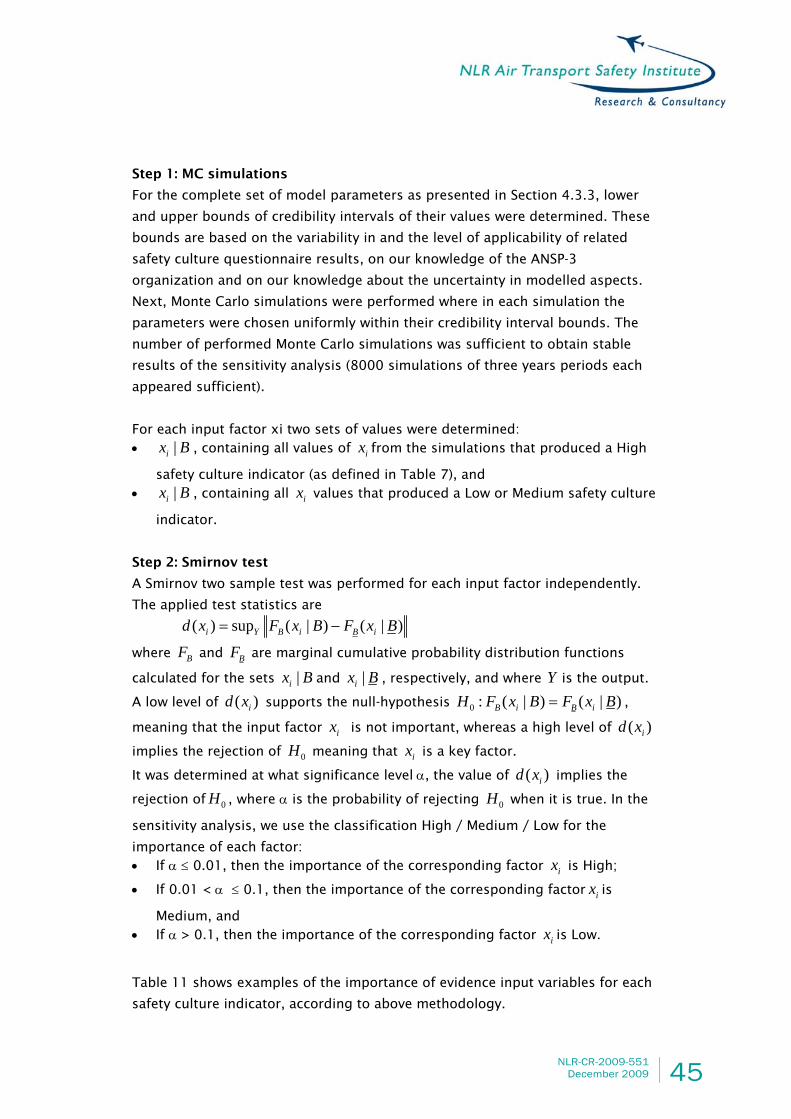
NLR-CR-2009-551
December 2009 45
Step 1: MC simulations
For the complete set of model parameters as presented in Section 4.3.3, lower
and upper bounds of credibility intervals of their values were determined. These
bounds are based on the variability in and the level of applicability of related
safety culture questionnaire results, on our knowledge of the ANSP-3
organization and on our knowledge about the uncertainty in modelled aspects.
Next, Monte Carlo simulations were performed where in each simulation the
parameters were chosen uniformly within their credibility interval bounds. The
number of performed Monte Carlo simulations was sufficient to obtain stable
results of the sensitivity analysis (8000 simulations of three years periods each
appeared sufficient).
For each input factor xi two sets of values were determined: • |ix B , containing all values of ix from the simulations that produced a High
safety culture indicator (as defined in Table 7), and • |ix B , containing all ix values that produced a Low or Medium safety culture
indicator.
Step 2: Smirnov test
A Smirnov two sample test was performed for each input factor independently.
The applied test statistics are
( ) sup ( | ) ( | )i Y B i B id x F x B F x B= −
where BF and BF are marginal cumulative probability distribution functions
calculated for the sets |ix B and |ix B , respectively, and where Y is the output.
A low level of ( )id x supports the null-hypothesis 0 : ( | ) ( | )B i B iH F x B F x B= ,
meaning that the input factor ix is not important, whereas a high level of ( )id x
implies the rejection of 0H meaning that ix is a key factor.
It was determined at what significance level α, the value of ( )id x implies the
rejection of 0H , where α is the probability of rejecting 0H when it is true. In the
sensitivity analysis, we use the classification High / Medium / Low for the
importance of each factor: • If α ≤ 0.01, then the importance of the corresponding factor ix is High;
• If 0.01 < α ≤ 0.1, then the importance of the corresponding factor ix is
Medium, and • If α > 0.1, then the importance of the corresponding factor ix is Low.
Table 11 shows examples of the importance of evidence input variables for each
safety culture indicator, according to above methodology.
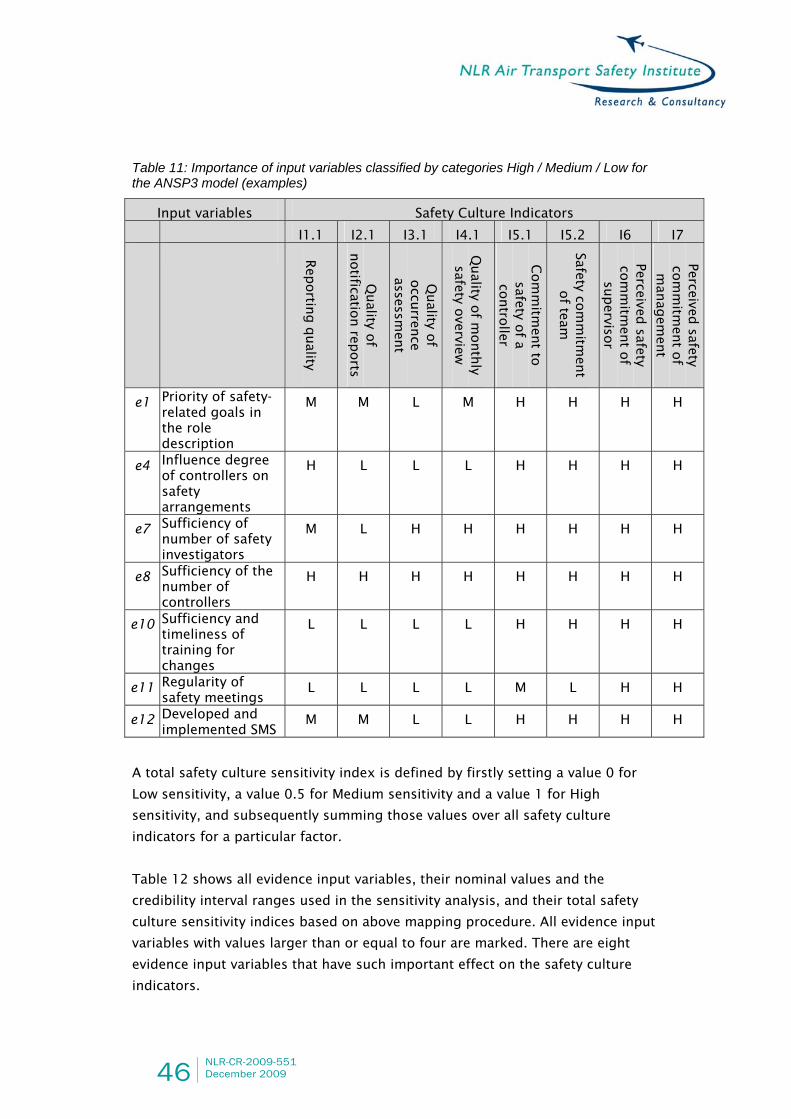
46 NLR-CR-2009-551 December 2009
Table 11: Importance of input variables classified by categories High / Medium / Low for the ANSP3 model (examples)
Input variables Safety Culture Indicators
I1.1 I2.1 I3.1 I4.1 I5.1 I5.2 I6 I7
Rep
ortin
g q
uality
Quality o
f notificatio
n rep
orts
Quality o
f occu
rrence
assessmen
t
Quality o
f month
ly safety o
verview
Com
mitm
ent to
safety o
f a co
ntro
ller
Safety com
mitm
ent
of team
Perceived safety
com
mitm
ent o
f su
perviso
r
Perceived safety
com
mitm
ent o
f m
anag
emen
t
e1 Priority of safety-related goals in the role description
M M L M H H H H
e4 Influence degree of controllers on safety arrangements
H L L L H H H H
e7 Sufficiency of number of safety investigators
M L H H H H H H
e8 Sufficiency of the number of controllers
H H H H H H H H
e10 Sufficiency and timeliness of training for changes
L L L L H H H H
e11 Regularity of safety meetings
L L L L M L H H
e12 Developed and implemented SMS
M M L L H H H H
A total safety culture sensitivity index is defined by firstly setting a value 0 for
Low sensitivity, a value 0.5 for Medium sensitivity and a value 1 for High
sensitivity, and subsequently summing those values over all safety culture
indicators for a particular factor.
Table 12 shows all evidence input variables, their nominal values and the
credibility interval ranges used in the sensitivity analysis, and their total safety
culture sensitivity indices based on above mapping procedure. All evidence input
variables with values larger than or equal to four are marked. There are eight
evidence input variables that have such important effect on the safety culture
indicators.

NLR-CR-2009-551
December 2009 47
For all other types of parameters in the model (as listed in Section 4.3.3), the
same sensitivity analysis was performed. Overall, the importance of the other
parameters for the total set of safety culture indicators is more modest than the
importance of the input evidence variables. Only for one weight, which describes
the relation between the commitment of a supervisor to safety and the
perception of the commitment to safety in a team, a total safety culture index of
4 is achieved in the sensitivity analysis. All other parameters are less important. Table 12: Total safety culture sensitivity index for the evidence input variables of the ANSP-3 model
Variable Description Value Total SC sensitivity
index e1 Priority of safety-related goals in the role
description 0.60 (0.50-0.70) 5.5
e4 Influence of a controller on safety activities 0.50 (0.40-0.60) 5
e7 Sufficiency of the amount of safety investigators
0.50 (0.40-0.60) 6.5
e8 Sufficiency of the amount of controllers 0.60 (0.40-0.80) 8 e9 Availability of reliable and ergonomic technical
systems for controllers 0.75 (0.65-0.85) 5.5
e10 Sufficiency and timeliness of training for changes
0.60 (0.45-0.75) 4
e11 regularity of safety meetings 0.75 (0.60-0.90) 2.5
e12 Developed and implemented SMS 0.60 (0.40-0.80) 5 e14 Level of development of managerial skills 0.60 (0.40-0.80) 7 e19 Self-confidence for ATC task 0.85 (0.75-0.95) 3.5 e20 Commitment to perform ATC task 0.80 (0.70-0.90) 3 e21 Development level of skills for ATC task 0.80 (0.70-0.90) 1 e25 Sufficiency of the number of maintenance
personal 0.75 (0.60-0.90) 3.5
e26 Quality of formal procedures for system checks and repairs
0.75 (0.60-0.90) 0.5
e35 Intensity of informal interactions in the team of controllers 0.65 (0.50-0.80) 0
e36 Quality of the formal safety occurrence assessment procedure
0.85 (0.75-0.95) 0
e40 Quality of the communication channel between controllers and safety investigators
0.50 (0.30-0.70) 1
e44 Average commitment of the agents involved in the safety analysis
0.65 (0.50-0.80) 1.5
e61 Individualism index of a controller 0.8 (0.7-0.9) 0
e62 Power distance index of a controller 0.4 (0.3-0.5) 0

48 NLR-CR-2009-551 December 2009
Variable Description Value Total SC sensitivity
index
e63 Masculinity index of a controller 0.15 (0.05-0.25) 0
e64 Uncertainty avoidance index of a controller 0.5 (0.4-0.6) 0
e71 Formal support for confidentiality of reporting 0.65 (0.55-0.75) 0
4.6.2 IDENTIFICATION AND VALIDATION OF MAJOR ORGANIZATIONAL FACTORS
Based on the sensitivity analysis of the model for ANSP-3, we identified eight
Major Organizational Factors with a large effect on safety culture. In the
EUROCONTROL safety culture survey of ANSP-3, a range of safety culture issues
became clear from the results of the questionnaire and the safety culture
workshops. In a safety culture model workshop with EUROCONTROL personnel
who performed the safety culture survey at ANSP-3, we identified for each Major
Organizational Factor the range of related results of the safety culture survey,
and we reached a conclusion about the agreement between the results of the
model and the safety culture survey.
The list of Major Organizational Factors identified via the model in order of
importance is:
• MOF-1: Sufficiency of the number of controllers
• MOF-2: Level of development of managerial skills of supervisors
• MOF-3: Sufficiency of the number of safety investigators
• MOF-4: Priority of safety-related goals in the role description
• MOF-5: Availability of reliable and ergonomic technical systems for
controllers
• MOF-6: Influence of a controller on safety activities
• MOF-7: Developed and implemented Safety Management System (SMS)
• MOF-8: Sufficiency and timeliness of training for changes
It was concluded in the safety culture model workshop that in the comparison of
the eight model-based Major Organizational Factors with issues identified in the
survey workshops at ANSP-3, there is some agreement for two factors (MOF-1, 4)
and good agreement for the remaining six factors (MOF-2, 3, 5, 6, 7, 8). In
particular, for MOF-1 (Sufficiency of number of controllers) it was expressed in
the survey workshops that with the current reduction in traffic volume there is no
shortage in controllers resources, but it may be a problem in contingency

NLR-CR-2009-551
December 2009 49
situations and in the long term. For MOF-4, no lack of priority of safety-related
goals in the role description of controllers was identified in the workshops, but
for some other roles in the organization the safety-related goals are not always
appropriately understood. In general, the issues identified by the survey study
provide more detailed information about the organizational context of the safety
culture issues. For instance, in relation to MOF-2 details related to leadership
roles, selection based on an adequate competence profile and coordination
within the organization became clear from the survey workshop. This detailed
information was mainly obtained in the workshop phase of the safety culture
survey, where the personnel was asked to discuss particular safety culture issues
with low scores in the safety culture questionnaire.
4.6.3 IDENTIFICATION AND COMPARISON OF ORGANIZATIONAL RECOMMENDATIONS
The identified Major Organizational Factors, which have a strong effect on the
safety culture indicators, provided the basis for the proposition of the following
five Organizational Improvement Options in the model-based study.
OIO-1: More involvement of controllers in safety assessment for development of
new systems and procedures (MOF-4, 5, 6)
(a) Controllers should be more involved in safety assessments for
development of new systems and procedures.
(b) These safety assessments should have a sufficiently broad scope such
that the variability in the working context of the controllers is addressed
in a way that is well recognized and understood by the controllers
involved in the assessment.
(c) The assessment should explicitly address the consideration of capacity
versus safety in nominal and non-nominal conditions.
OIO-2: Improve workload of controllers by developing explicit rules for balancing
safety and capacity in nominal and non-nominal conditions (MOF-1, 4)
(a) The workload of controllers should be improved by explicit guidelines
that support the supervisors and the controllers in balancing safety and
capacity.
(b) These guidelines should be determined in a safety assessment as
indicated in OIO-1 with involvement of controllers.
(c) A result of these guidelines may be that the number of controllers should
increase.
OIO-3: Improve the quality of management by supervisors (MOF-2)
(a) The quality of the management by supervisors should be improved.

50 NLR-CR-2009-551 December 2009
(b) The quality of management may be improved by further development of
the managerial skills and techniques of supervisors.
(c) The quality of management may be improved by developing clear
guidelines that support supervisors in their decisions for dealing with
capacity-safety issues in nominal and non-nominal conditions. The
development of such guidelines may be achieved in coordination with
OIO-1 and OIO-2.
OIO-4: Improve coherence and communication in the safety management system
(MOF-3, 7)
(a) The coherence and communication in the safety management system
should be improved.
(b) Improvement of the coherence means that safety assessment (prior to
operation) and safety monitoring (during operation) should be more
consistent, such that safety indicators and safety requirements
formulated in the safety assessment are well captured in the safety
monitoring phase.
(c) Improvement of the communication means, on the one hand, that voicing
about safety issues is encouraged, and on the other hand, that there
should be a structured way to always provide feedback on the safety
issues raised (either prior to or during operation). Therefore, OIO-4
should be addressed in good coordination with OIO-1.
OIO-5: Improve the communication about and training for changes (MOF-8)
(a) The communication about changes to systems, procedures or working
conditions should be improved.
(b) Appropriate training should be considered for changes to systems,
procedures or working conditions.
(c) In such communication and training there should be reference to the
conclusions of the safety assessments conducted in line with OIO-1,
explaining the reasons for the change and its assessed impact.
It was concluded in the SC model workshop that the Organizational Improvement
Options of the model-based study are consistent with the recommendations of
the survey study. The recommendations of the survey study tend to reflect the
larger detail in the organizational context as has emerged in the survey
workshops at ANSP-3. In addition to the list of consistent recommendations, the
survey study identified a number of recommendations that are not or only partly
addressed in the model-based study. Recommendations that were not addressed
reflect aspects that are out of the scope of the model, e.g. on-the-job-training or
learning processes of the Engineering department. Recommendations that were

NLR-CR-2009-551
December 2009 51
only partly addressed mostly reflect aspects for which the organizational context
is known in more detail via the workshops at ANSP-3.
4.7 DISCUSSION OF RESULTS
In summary, the following results were obtained in the three phases of this
model and validation study:
• In Phase 1, the input values of the model were completely based on
organizational information available prior to the survey questionnaire results.
The model predicted safety culture indicators which were mostly higher than
the survey questionnaire results. In particular, for six out of the seven
relevant indicators a higher class was predicted by the model.
• In Phase 2, the input values of the model were based on a combination of
organizational information and survey questionnaire results. The model
predicted safety culture indicators which were mostly equal to the survey
questionnaire results. In particular, for six out of seven indicators the same
class was predicted by the model.
• In Phase 3, major organizational factors affecting the safety culture indicators
and related organizational improvement options were inferred from a
sensitivity analysis of the organizational model. Next these results were
compared with safety culture issues and recommendations stemming from
safety culture survey workshops. The major organizational factors and
organizational improvement options identified by the model-based sensitivity
study were largely consistent with the safety culture issues and the
recommendations arrived at via the workshops in the survey study. The
survey results included more details of the organizational context and
revealed some aspects that were out of the scope in the organizational
model.
Comparing the results of Phases 1 and 2, there is a clear difference in the
attained consistency between the survey questionnaire and model results. This
difference is due to the differences in the values of the input evidence variables
of the model. The overall higher values used in Phase 1 led to safety culture
indicator classes that were mostly higher in Phase 1 than in Phase 2, and that
were mostly inconsistent with the survey questionnaire results in Phase 1 and
mostly consistent in Phase 2. The values of the evidence input variables in Phase
1 were based on organizational information stemming from interviews with a
safety manager and a safety investigator at ANSP-3, and from the SMS of ANSP-3.
It follows from the survey questionnaire results that the thus determined values
for these variables were too optimistic. The survey questionnaire results provided

52 NLR-CR-2009-551 December 2009
an overview of the opinions of a large number of employees with a variety of
roles, as such they give a considerably broader basis for the evaluation of the
evidence input variables than what can be achieved by interviews.
The results in Phase 2 show that given appropriate model inputs, the model
output results for the safety culture indicators are mostly consistent with the
survey questionnaire results. This shows that the model structure and other
parameters are such that the model can well predict the safety culture indicators
for appropriate input evidence variables. A limitation of the validation exercise in
Phase 2 is that both the reference outputs and the evidence input values were
based on the survey questionnaire results. Although different questions were
used for these two classes, the responses to groups of questions reflect similar
tendencies in safety culture dimensions at ANSP-3, and as such the values for the
inputs and reference outputs may have been correlated. Moreover, we know from
the sensitivity analysis that there are various input evidence variables that have a
strong effect on the output safety culture indicators. All in all, the consistent
prediction in Phase 2 is a positive indication that a valid model has been
developed, but due to the same basis for input and reference output not a strong
proof though.
The results in Phase 3 show that the outcomes based on the sensitivity analysis
of the model are mostly consistent with the results of the safety culture survey
workshops. Both the model and the workshop used results of the survey
questionnaire as input, but the processes for achieving their results were
completely different and independent. As such, the consistency in their results is
a good indication of the model’s validity. The limitation in the detail of the
organizational context and the scope of the model results is, on the one hand, a
fundamental modelling issue, in the sense that a model is always an abstraction
of reality and it focuses on selected aspects. On the other hand, the range of
organizational aspects that are considered in detail in the model may be
enhanced. In the current study, the model development was focused on the
occurrence reporting cycle and other processes such as management actions,
engineering activities and traffic management actions by controllers were
modelled at a high (abstract) level. The level of modelling detail of such other
processes may be enhanced, thus enabling more specific results for these
organizational layers and the air traffic control operations.

NLR-CR-2009-551
December 2009 53
5 DISCUSSION
This section presents a general discussion of the organizational modelling
approach applied in this study. Section 5.1 discusses the relation of the agent-
based organizational modelling method and the EUROCONTROL safety culture
survey approach. Section 5.2 presents some potential extensions of the
developed organizational model. Section 5.3 compares the applied modelling
approach with other safety-related modelling approaches. Section 5.4 describes
possibilities to link the model with risk assessment.
5.1 RELATION WITH SAFETY CULTURE SURVEY APPROACH
The application and validation of the organizational modelling approach was
done in conjunction with results achieved for a particular ANSP by the
EUROCONTROL safety culture survey approach (described in Section 3). The
results presented in Section 4 show that to achieve valid predictions of the safety
culture indicators by the model, we needed input data from the safety culture
survey questionnaire, and on this basis the sensitivity analysis provided valid
results for important organizational factors influencing the safety culture
indicators and related recommendations. In general, the developed model has a
range of input variables that reflect attitudes and opinions of people in the
organization, and a safety culture survey questionnaire is a suitable tool to
obtain an overview for these. As such, the agent-based organizational modelling
approach may be used in addition to safety culture questionnaires and
workshops.
We found that the major added advantage of agent-based organizational
modelling is that it provides a structured, formally-grounded means for analysis
and improvement of safety culture. It defines explicit formal relations between
safety culture indicators and organizational processes and structures, thus
enabling identification of important organizational aspects impacting safety
culture by sensitivity analysis techniques. Insights in relations between safety
culture indicators and organizational structures and processes may be used to
further enhance safety culture questionnaires and prepare safety culture survey
workshops.

54 NLR-CR-2009-551 December 2009
5.2 POTENTIAL EXTENSIONS OF THE ORGANIZATIONAL MODEL
The developed organizational model has a restricted scope, which may be
broadened in several ways. Some possible extensions are presented next.
• The modelling scope was focused on safety culture at the particular ANSP-3.
Similar models may be developed for other ANSPs. To this end, the
organizational structures and processes at other ANSPs should be studied
and as a result the model structure may need to be adapted to be consistent
with the specific organizational aspects at the other ANSPs. In addition,
suitable input data should be obtained as basis for the estimation of the
parameter values in the model. As was illustrated in this study, the safety
culture questionnaires provide a useful source for this estimation.
• In the current study, the scope of the model was focused on safety culture
issues in relation to occurrence reporting. In line with the broad scope of the
safety culture dimensions adhered to in the EUROCONTROL safety culture
survey approach, the range of safety culture issues may be enhanced. To this
end, additional organizational processes may need to be modelled, such as
the organization of training, the maintenance department or management
layers.
• The characteristics of the controller agents in the organizational model
include the four dimensions of national culture, as formulated by Hofstede
(2001, 2005): Power Distance, Individualism, Masculinity and Uncertainty
Avoidance. It has been shown in an extensive survey study in the aviation
domain with more than 8,000 pilots of 26 countries that national culture has
significant effects on pilot performance (Helmreich, 2000). In this study, we
achieved model results showing manifest effects of Western versus Eastern
European culture on safety culture indicators (Sharpankykh et al., 2008b;
Stroeve et al., 2008). The effect of national culture on safety culture is
worthwhile to study further, thus advancing on those early steps.
• The decision-making process by controller agents whether to report or not
report observed occurrences has a central role in the model. These process of
individual agents are adapted in response to the way reported occurrences
are processed and fed back in the organization and by team and
management interactions. These adaptations are manifestations of individual
and team learning in relation to the occurrence reporting process. The
organizational modelling approach can be used to analyse the effects of a
larger variety of goal-directed organizational change processes. Examples are
new reporting procedures, new rostering schemes, new management
structures, etc. The learning effects can be studied at different aggregation
levels, including individuals, teams, units and institutions.
NLR-CR-2009-551
December 2009 55
5.3 COMPARISON WITH OTHER SAFETY-RELATED ORGANIZATIONAL
MODELLING APPROACHES
In Section 2 we concisely presented the safety-related organizational modelling
approaches STAMP, SoTeRiA and TOPAZ. Here we compare the multi-view hybrid
organizational modelling approach applied in this study with those approaches.
Multi-view hybrid organizational modelling (this study)
The multi-view hybrid organizational modelling framework used in this study
provides methods for modelling the formal, prescriptive organization as well as
the social behaviour of organizational actors along four interrelated views:
organization-, performance-, process- and agent-oriented views. Within these
views several techniques are used, such as agent-based modelling, causal
networks, cognitive modelling and logic-based modelling. The modelled
organizational structure discerns roles (a set of defined functionalities in the
organization abstracted from the actors performing them), role instances
(description of performance of generic actors that may fulfil the role) and agents
(individuals allocated to role instances). The model that was developed in this
study by this approach uses a mix of variables. A part of these variables is at an
aggregated level, e.g. e44 ‘Average commitment of the agents involved in the
safety analyses’. The largest part of the variables is at the level of individuals,
e.g. beliefs and intentions of agents. Both continuous and event-based dynamics
can be represented, where the event times may be deterministic or stochastic.
The model developed was focused on a number of safety culture indicators, e.g.
reporting quality and commitment. These are quality indicators for the safety of
the organization, but they do not directly relate to safety risk levels. The
consistency of the model is checked using automated logic-based analysis
methods (in particular TTL checking (Sharpanskykh, 2008a)). The model is
evaluated by MC simulations that reflect a large number of instantiations
(thousands in this study) of several years (three years in this study) of
organizational performance. Simulation-based sensitivity analysis provides
insights in the key factors that impact the safety culture indicators.
STAMP
The Systems-Theoretic Accident Modeling and Processes (STAMP) methodology
uses system dynamics (SD) to describe interactions and dynamics between
organizational processes and their effect on safety. The variables in such models
are at an aggregated organizational level, rather than at the level of individuals in
the organization. The dynamics are mostly continuous time-based with some
triggering events; they are based on coupled ordinary differential equations with

56 NLR-CR-2009-551 December 2009
exogenous inputs, which may express event occurrences. The STAMP model in
(Dulac et al., 2007) describes relations between a large number of organizational
variables, including ‘Safety of operational system’. However, the model does not
provide probability estimates of adverse safety events (incidents/accident). The
model is evaluated via simulation runs and these show dynamic traces of relevant
variables regarding e.g. costs, scheduling and safety. By varying model settings,
the effects of conditions and decisions on dynamic traces for variables of interest
can be evaluated.
SoTeRiA
The Socio-Technical Risk Analysis (SoTeRiA) framework uses a hybrid set of
modelling techniques, including system dynamics, Bayesian Belief Networks,
Event Sequence Diagrams and Fault Trees. In the example model of (Mohaghegh
et al., 2009) relations between organizational aspects are mostly represented by
System Dynamics models, whereas the relation with risk levels is mostly achieved
by the BNNs, ESDs and FTs. Similar to STAMP, the variables in the model are
mostly at aggregated organizational levels, rather than at the level of individuals.
Also similarly to STAMP, the dynamics of the model are continuous time-based
with some triggering events. An extension with respect to STAMP is that SoTeRiA
provides as outputs system safety probability estimates. Similar to STAMP, the
model is evaluated via simulation runs and these show dynamic traces of relevant
variables, which include (in addition to STAMP) risk probability estimates. By
varying model settings, the effects of conditions and decisions on dynamic traces
for variables of interest can be evaluated.
TOPAZ
TOPAZ (Traffic Organization and Perturbation AnalyZer) is an air traffic risk
assessment methodology, which uses agent-based Dynamic Risk Modelling (DRM)
by Dynamically Coloured Petri Nets (DCPNs) and Monte Carlo simulation-based
collision risk assessment as key techniques on which we focus our discussion
here. The development of TOPAZ models has been focused on the organization
at the operational level, i.e. pilots and controllers supported by technical systems
in the context of specific traffic scenarios. The variables in these models are at
the level of individual systems and operators, rather than at aggregated levels.
The agents in the model represent systems or generic operators performing
particular roles (e.g. runway controller, pilot flying). The dynamics are continuous
time-based with internal stochastic triggering events, which are based on
stochastic differential equations with jump processes. Monte Carlo simulations
including speed-up techniques provide probability estimates of adverse safety
events. For instance, about 10 million variations of operational scenarios are
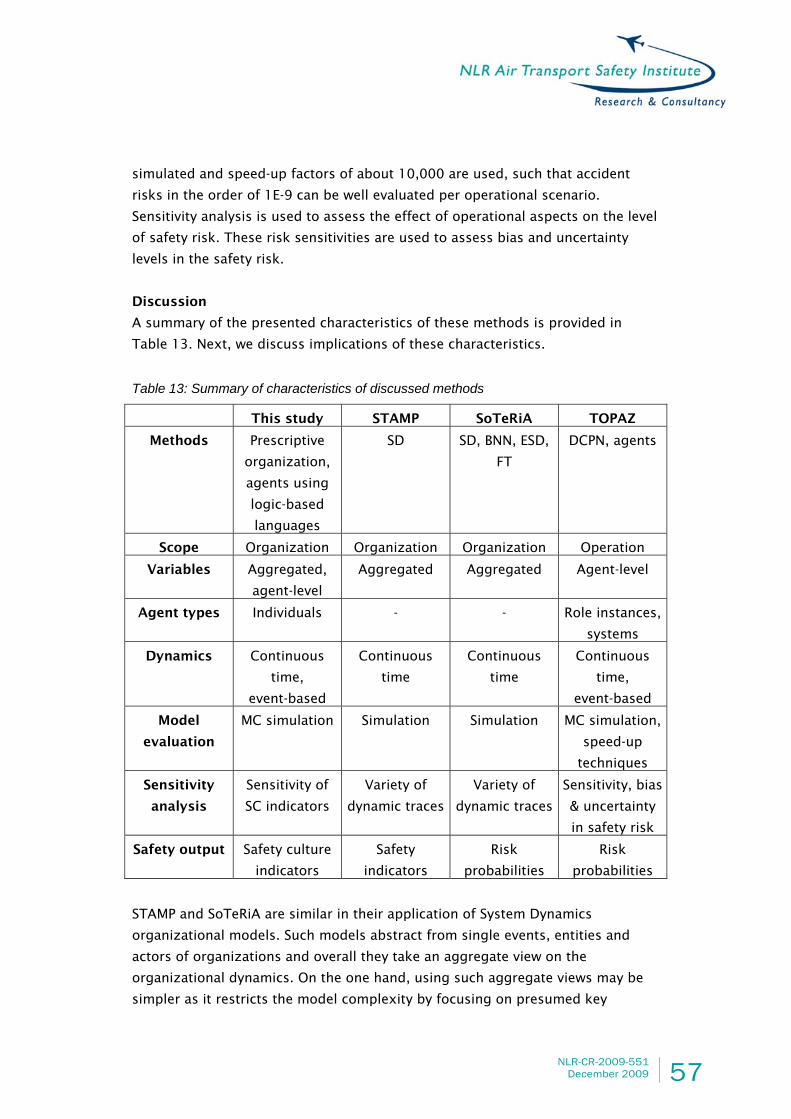
NLR-CR-2009-551
December 2009 57
simulated and speed-up factors of about 10,000 are used, such that accident
risks in the order of 1E-9 can be well evaluated per operational scenario.
Sensitivity analysis is used to assess the effect of operational aspects on the level
of safety risk. These risk sensitivities are used to assess bias and uncertainty
levels in the safety risk.
Discussion
A summary of the presented characteristics of these methods is provided in
Table 13. Next, we discuss implications of these characteristics.
Table 13: Summary of characteristics of discussed methods
This study STAMP SoTeRiA TOPAZ
Methods Prescriptive
organization,
agents using
logic-based
languages
SD SD, BNN, ESD,
FT
DCPN, agents
Scope Organization Organization Organization Operation
Variables Aggregated,
agent-level
Aggregated Aggregated Agent-level
Agent types Individuals - - Role instances,
systems
Dynamics Continuous
time,
event-based
Continuous
time
Continuous
time
Continuous
time,
event-based
Model
evaluation
MC simulation Simulation Simulation MC simulation,
speed-up
techniques
Sensitivity
analysis
Sensitivity of
SC indicators
Variety of
dynamic traces
Variety of
dynamic traces
Sensitivity, bias
& uncertainty
in safety risk
Safety output Safety culture
indicators
Safety
indicators
Risk
probabilities
Risk
probabilities
STAMP and SoTeRiA are similar in their application of System Dynamics
organizational models. Such models abstract from single events, entities and
actors of organizations and overall they take an aggregate view on the
organizational dynamics. On the one hand, using such aggregate views may be
simpler as it restricts the model complexity by focusing on presumed key

58 NLR-CR-2009-551 December 2009
aspects in the organization. On the other hand, it may be difficult to map actual
organizational structures and processes to abstract aggregated model variables.
By doing so, the link to the behaviour of organizational individuals and their
interactions is lost, so that the level of analysis is reduced. Moreover, a high
complexity of social dynamics of interacting organizational actors may result in
unexpected emergent effects in the organization, which cannot be observed
based on the aggregate view adhered to in System Dynamics models.
In addition to STAMP, SoTeRiA provides a link to risk assessment via BNNs, ESDs
and FTs. These techniques provide static mappings of risk levels, based on
assumed probabilistic relations between events and conditions. Overall, risk
levels in SoTeRiA may fluctuate as a result of the SD-based fluctuations in
organizational variables. A drawback of the static risk mappings via BNNs, ESDs
and FTs is that they may be limited to accurately describe the risk of complex
socio-technical operations with concurrently interacting operators and systems
(Hollnagel, 2004; Sträter, 2005; Stroeve et al., 2009c; Everdij and Stroeve, 2009).
In contrast with STAMP and SoTeRiA, both TOPAZ and the multi-view hybrid
organizational modelling method of the current study use agent-based models to
describe the performance of people, systems or organizational units. These
agent models intend to directly describe the behaviour of such organizational
entities and therefore do not require the type of aggregation used in SD
modelling. As a result of the agents’ interactions, emergent behaviour exists at
the level of the organization or the operation. Via sensitivity analysis the key
factors contributing to safety culture of risk can be traced.
Differences between TOPAZ and the organizational modelling of this study
include
• The focus on (safety-critical) operational scenarios in TOPAZ and on the
organization of safety occurrence reporting in this study;
• The use of agents at the level of role instances (e.g. Pilot Flying, Runway
Controller) and agents at the level of individuals (e.g. controller Peter) in this
study;
• The attainment of risk probability values by TOPAZ and of safety culture
quality indicators in this study.
5.4 COUPLING ORGANIZATIONAL AND RISK MODELS
The agent-based organizational model that we developed in this study has a
number of safety culture indicators as output. A stimulus of safety culture

NLR-CR-2009-551
December 2009 59
studies is the (implicit) premise that a good safety culture has a positive effect on
the safety risk of the work performed by the organization; for an ANSP this would
mean that good safety culture supports lowering ATM-related risk levels.
However, there is yet little evidence that explicitly supports such relation
between safety culture and safety performance. A way forward for the analysis of
this important link consists of modelling of the effect of safety culture on the
way operations are being performed, and next, assessing the risk of the safety
culture influenced performance by risk modelling methods that explicitly account
for the performance of human operators. Such modelling allows for explicitly
arguing about relations between safety culture and safety performance, which
can be supported by sensitivity analysis at the level of safety risks. On this basis,
measurements of organizational or operational factors that are found to be
important for the safety risk can be defined and applied in safety monitoring.
The way this coupling may be effectuated in practice depends on the type of risk
model chosen. Next, we discuss coupling with (1) FT, ESD and BNN risk
assessment models and (2) agent-based DRM.
FT, ESD, BNN
Fault Trees, Event Sequence Diagrams and Bayesian Belief Networks are methods
frequently used in risk assessments to describe probabilistic relations between
conditions, failures, errors and consequences in safety-relevant scenarios.
Similarly as has been done in SoTeRia (Mohaghegh et al., 2009), safety culture
quality variables of the organizational model may be used as Performance
Shaping Factors (PSFs) in these risk assessment models. For instance, these PSFs
may influence probabilities of the occurrence of human operator errors, as is
usual in the field of Human Reliability Assessment. More generally, they may
influence probabilities of particular occurrences (errors, failures, conditions) in
the risk model, e.g. an increase in system failure probability due to low
commitment at the maintenance department.
In this way of coupling between organizational and risk assessment models, it
can be envisioned that aggregated variables in the organizational model (e.g.
commitment of a group of controllers) are used rather than the performance
characteristics of individual agents. Furthermore, in such coupling it should to a
reasonable extent be feasible to describe the event probabilities as function of
safety culture quality variables. We note that it may be difficult to accurately
analyse the risk of air traffic scenarios with concurrently acting entities by
traditional risk models (Stroeve et al., 2009c; Everdij and Stroeve, 2009). Since
the operational risk model is not agent-based there is not a direct link from the
operational model back to the organizational model.

60 NLR-CR-2009-551 December 2009
Agent-based DRM
Agent-based Dynamic Risk Modelling (DRM) is an advanced method to assess the
risk of complex air traffic scenarios; it is used in the TOPAZ risk assessment
methodology. Such models describe the variability in the dynamic performance
of operators, systems and environmental conditions of safety-relevant scenarios.
The risk effects emerging from the variably performing and interacting agents
are evaluated by Monte Carlo simulations. Coupling between the DRM and the
organizational (safety culture) model can be envisioned at the level of roles or at
the level of individuals.
In coupling at the role level, safety culture quality variables for specific role
instances can be used to modify parameter values for these agent roles in the
DRM. Since in the organizational model, roles are typically performed by a
number of individuals, the safety culture quality variables are aggregated over
these individuals (e.g. group average). Similar to the PSFs for the traditional risk
models, error or failure probabilities may be described as function of safety
culture quality variables. In addition to these traditional PSFs, the dynamic
performance of agents in DRM can be influenced in a broad variety of ways (e.g.
other task initiation timing, task duration, system velocity, system accuracy, etc.).
This larger variety of influencing options may make it possible to describe the
influencing relations more accurately than for event probabilities. In this coupling
option, the simulations of the organizational model and the DRM can be
performed separately and the complexity of the coupling is considered to be
moderate.
In coupling at the level of individuals, the agents in the DRM should describe the
performance of individuals in their operational roles, and under this condition,
the agent-based dynamic risk and organizational safety culture models can be
directly coupled. In this type of coupling, the influence of the organization on the
individuals working in it, and vice versa, is modelled, as well as the way that this
organizational influence has impact on the operational performance of the
operator. For instance, agent Peter has got training for a failure condition, a
while later agent Peter encounters this failure condition during operation and (as
a result of the training) agent Peter reacts in a particular time, and this has effect
on the safety-criticality of the air traffic scenario. This type of coupling holds the
possibility to specify organizational aspects and operational effects, and their
interactions, at a large level of detail. As such, it supports a high level of analysis
detail. The modelling complexity for this coupling option is high.

NLR-CR-2009-551
December 2009 61
6 CONCLUSIONS
It was set out as aim of this project to enhance safety analysis of organizational
processes in air traffic by development of formal approaches for modelling,
simulation and analysis of organizational relationships and processes. In
particular, these models should support the understanding of causal relations
between organizational processes that influence safety culture, such that robust
and flexible policies may be identified to improve and maintain a sufficient level
of safety culture in an organization.
We claim that this aim has been achieved based on the following arguments.
• Based on a literature survey we identified a multi-view hybrid organizational
modelling approach, which provides a broad repertoire of methods for
modelling, simulation and analysis of organizational relations and processes.
• We showed that it is feasible to apply this organizational modelling approach
to the ATM domain by developing a model for the organization of the
reporting and processing of safety occurrences at an ANSP.
• We showed that we could validate the model by relating its predictions to
results of a EUROCONTROL safety culture survey of a particular ANSP.
• We showed that we could attain valid predictions of safety culture indicators
with dedicated input data of the safety culture survey questionnaires.
• We showed that the sensitivity analysis of the organizational model provided
valid results for important organizational factors influencing the safety
culture indicators and related recommendations.
Based on above findings, we argue that the agent-based organizational modelling
approach is a useful add-on to the EUROCONTROL safety culture survey
approach. The major added advantage of the organizational modelling approach
is that it provides a structured, formally-grounded means for analysis and
improvement of safety culture. It defines explicit formal relations between safety
culture indicators and organizational processes and structures, thus enabling
identification of important organizational aspects impacting safety culture by
sensitivity analysis techniques. Insights in relations between safety culture
indicators and organizational structures and processes can be used to further
enhance safety culture questionnaires, prepare safety culture survey workshops
and support decision making on organizational change processes at ANSPs. In
addition, coupling of organizational modelling to risk modelling provides a way
for structured analysis of the effect of safety culture on safety performance.
62 NLR-CR-2009-551 December 2009
REFERENCES
Ajaefobi JO and Weston RH (2009). Application of Enterprise Modelling (EM)
Principles to Improving the Performance of a Semi-Automated Production
System. Advanced Materials Research (Volumes 62 - 64), 293-302
Banks J (2005). Discrete-event System Simulation. Upper Saddle River, NJ: Pearson
Prentice Hall.
Bacharach, SB, Lawler, EJ (1980). Power and politics in organizations. Jossey-Bass,
San Francisco
Biddle B (1979). Role Theory: Concepts and Research. Krieger Publishing Co.
Blau PM, Schoenherr RA (1971). The structure of organizations. Basic Books Inc.,
New York London
Blom HAP, Bakker GJ, Blanker PJG, Daams J, Everdij MHC, Klompstra MB (2001a).
Accident risk assessment for advanced air traffic management. In: Donohue
GL and Zellweger AG (eds.), Air Transport Systems Engineering, AIAA, pp.
463-480
Blom HAP, Daams J, Nijhuis HB (2001b). Human cognition modelling in air traffic
management safety assessment. In: Donohue GL and Zellweger AG (eds.),
Air Transport Systems Engineering, AIAA, pp. 481-511
Blom HAP, Bakker GJ, Everdij MHC, Van der Park MNJ (2003a). Collision risk
modelling of air traffic. Proceedings European Control Conference 2003
(ECC03), Cambridge, UK
Blom HAP, Bakker GJ, Everdij MHC, Van der Park MNJ (2003b). Stochastic analysis
background of accident risk assessment for air traffic management.
Hybridge EC project, D2.2
Blom HAP, Stroeve SH, Everdij MHC, Van der Park MNJ (2003c). Human cognition
performance model to evaluate safe spacing in air traffic, Human Factors
and Aerospace Safety, Vol. 3, pp. 59-82
Blom HAP, Klompstra MB, Bakker GJ (2003d). Accident risk assessment of
simultaneous converging instrument approaches. Air Traffic Control
Quarterly 11: 123-155
Blom HAP, Stroeve SH (2004). Multi-agent situation awareness error evolution in
air traffic. Proceedings 6th Probabilistic Safety Assessment and
Management Conference, Berlin, Germany
Blom HAP, Stroeve SH, De Jong HH (2006a). Safety risk assessment by Monte
Carlo simulation of complex safety critical operations. In Redmill F,
Anderson T (eds.), Developments in risk-based approaches to safety,
Springer-Verlag, London

NLR-CR-2009-551
December 2009 63
Blom HAP, Bakker GJ, Klein Obbink B, Klompstra MB (2006b). Free flight safety
risk modeling and simulation. Proc. Int. Conf. on Research in Air Transport
(ICRAT), Belgrade, Servia
Bresciani P, Giorgini P, Giunchiglia F, Mylopoulos J, Perini A (2004). Tropos: An
Agent-Oriented Software Development Methodology. Journal of
Autonomous Agent and Multi- Agent Systems, vol. 8(3), 203-236
Burt RS (1987). Social Contagion and Innovation: Cohesion Versus Structural
Equivalence Source: The American Journal of Sociology, 92, 6, pp. 1287-
1335. The University of Chicago Press
Campion MA, Medsker GJ, Higgs AC (1993). Relationship between Work Group
Characteristics and Effectiveness: Implications for Designing Effective Work
Groups. Personnel Psychology, 46: 823-850
Carley KM (1996) A comparison of artificial and human organizations. Journal of
Economic Behavior & Organization, 31(2), 175-191
Choudhry RM, Fang D, Mohamed S (2007). The nature of safety culture: A survey
of the state-of-the-art. Safety Science 45:993-1012
Cooper MD (2000). Towards a model of safety culture. Safety Science 36: 111-
136
Cox S, Cox T (1996). Safety, Systems and People. Butterworth-Heinemann,
Oxford
Cummings TG, Worley CG (2005). Organization development and change.
Thomson/South Western
Decker K (1996). TAEMS: A Framework for Environment Centered Analysis &
Design of Coordination Mechanisms. Foundations of Distributed Artificial
Intelligence, Chapter 16, O'Hare, G. and Jennings, N. (eds.), Wiley Inter-
Science, 429-448
Donaldson L. (2001). The Contingency Theory of Organizations. Sage, London
Dulac N, Owens B, Leveson N et al. (2007). Demonstration of a new dynamic
approach to risk analysis for NASA’s constellation program. MIT SCRL
Report, March 2007
Ek A, Akselsson R, Arvidsson M, Johansson CR (2007). Safety culture in Swedish
air traffic control. Safety Science 45(7):791-811
EUROCONTROL/FAA AP 15 (2008). Safety Culture in Air Traffic Management: A
white paper. December 2008
Everdij MHC, Blom HAP, Stroeve SH (2006a). Structured assessment of bias and
uncertainty in Monte Carlo simulated accident risk. Proceedings of the 8th
International Conference on Probabilistic Safety Assessment and
Management, May 14-18 2006, New Orleans, USA
Everdij MHC, Klompstra MB, Blom HAP, Klein Obbink B (2006b). Compositional
specification of a multi-agent system by stochastically and dynamically

64 NLR-CR-2009-551 December 2009
coloured Petri nets. In: Blom HAP, Lygeros J (eds.), Stochastic Hybrid
Systems, LNCIS 337, Springer-Verlag, pp. 325-350
Everdij MHC, Stroeve SH (2009). Feasibility Study on Dynamic Risk Modelling for
ATM Applications. National Aerospace Laboratory NLR, report NLR-CR-
2008-512, March 2009
Ferber J., Gutknecht O. (1998) A meta-model for the analysis and design of
organizations in multi-agent systems. In: Y. Demazeau (ed.), Proceedings of
Third International Conference on Multi-Agent Systems (ICMAS'98), IEEE
Computer Society, 128-135
Forrester JW (1961). Industrial dynamics, Waltham, MA: Pegasus
Communications.
Franklin S, Graesser, A (1996). Is it an agent, or just a program? A taxonomy for
autonomous agents. In Mueller JP, Wooldridge M, Jennings NR (editors),
Intelligent Agents III, Springer LNAI 1193, 21-35
Galbraith JR (1978). Organization design. Addison-Wesley Publishing Company,
London Amsterdam Sydney
Giddens A (2006). Sociology, 5th ed., Polity, Cambridge
Giorgini P, Kolp M, Mylopoulos J (2006). Multi-Agent Architectures as
Organizational Structures. Journal of Autonomous Agents and Multi-Agent
Systems. Kluwer Academic Publishers, 13(1), 3-25.
Glendon AI, Stanton NA (2000). Perspectives on safety culture. Safety Science
34:193-214
Gordon R, Kennedy R, Mearns K, Jensen CL, Kirwan B (2006). Understanding
safety culture in air traffic management. EUROCONTROL, report EEC Note
No. 11/06
Griffin, R. W. and Bateman, T. S. (1986). Job satisfaction and organizational
commitment. In: Cooper, C. L. and Robertson, I. (Eds) International Review
of Industrial and Organizational Psychology 1986, Wiley, New York, pp.
157-188
Guldenmund FW (2000). The nature of safety culture: a review of theory and
research. Safety Science 34:215-257
Hackman JR (1980) Work redesign and motivation. Professional Psychology, 11:
445-455
Hale AR (2000). Editorial: Culture’s confusions. Safety Science 34:1-14
Hannan MT, Freeman J (1977) The population ecology of organizations. American
Journal of Sociology 82: 929-964
Hannoun M, Boissier O, Sichman JS, Sayettat C (2000). MOISE: An organizational
model for multi-agent systems. In: Monard MC, Sichman JS (eds.),
Proceedings of the 7th International Joint Ibero-American Conference on

NLR-CR-2009-551
December 2009 65
Artificial Intelligence (IBERAMIA'00) and 15th Brazilian Symposium on
Artificial Intelligence (SBIA'00), Atibaia, Brasil, 156-165
Helmreich RL (2000). Culture and error in space: Implications from analog
environments. Aviation, Space, & Environmental Medicine, 71: A133-A139
Hofstede G (2001). Culture's Consequences – Second Edition: Comparing Values,
Behaviors. Institutions and Organizations Across Nations, Sage, London
Hofstede G (2005). Cultures and Organizations. McGraw-Hill
Hollnagel E (1998). Cognitive reliability and error analysis method: CREAM.
Elsevier Science Ltd, Oxford, England
Hollnagel E (2004). Barriers and accident prevention. Ashgate, Aldershot, England
Hopkins A (2006). Studying organizational cultures and their effects on safety.
Safety Science 44:875-889, 2006
Horling B, Lesser V (2005). A survey of multi-agent organizational paradigms.
The Knowledge Engineering Review, Vol. 19(4) 281-316
Huhns MN, Stephens LM (1999). Multiagent Systems and Societies of Agents, in
Multiagent Systems: A Modern Approach to Distributed Artificial
Intelligence, Gerhard Weiss, editor, MIT Press, Cambridge, MA
Kast FE, Rosenzweig JE (1972) General systems theory: applications for
organization and management. Academy of Management Journal
December: 447-465
Langlois RN, Robertson PL (1995). Firms, Markets, and Economic Change: A
Dynamic Theory of Business Institutions. London: Routledge
Lee TR (1996). Perceptions, attitudes and behaviour: the vital elements of a
safety culture. Health and Safety, October 1:15
Leveson N (2004). A new accident model for engineering safer systems. Safety
Science 42:237-270
Leveson NG, Barrett B, Carroll J, Cutcher-Gershenfeld J, Dulac N, Zipkin D (2005).
Modeling, analyzing and engineering NASA’s safety culture. Phase 1 Final
report
Lorsch JW, Lawrence PR (1970). Organization design, Richard D. Irwin Inc., USA
Maiden NAM, Kamdar N, Bush D (2006). Analysing i* system models for
dependability properties: The Uberlingen accident, Proceedings
REFSQ'2006 Mini-Conference, in conjunction with CaiSE'2006, Luxembourg
Marais K, Saleh JH, Leveson NG (2006). Archetypes for organizational safety.
Safety Science 44:565-582
March, JG, Simon, HA (1967). Organizations, John Wiley & Sons, Inc.
Marlow, W. H. (1993) Mathematics for Operations Research. New York: Dover
Mearns K, Kirwan B, Kennedy R, Gordon R (2008) The EUROCONTROL safety
culture measurement approach. Proceedings EUROCONTROL Safety R&D
Seminar, Southampton, UK, 22-24 October 2008

66 NLR-CR-2009-551 December 2009
Merlone U, Sonnessa, M and Terna, P (2008). Horizontal and Vertical Multiple
Implementations in a Model of Industrial Districts. Journal of Artificial
Societies and Social Simulation 11(2)5.
Mintzberg H (1979). The Structuring of Organizations. Prentice Hall, Englewood
Cliffs
Mohaghegh Z, Mosleh A (2009). Incorporating organizational factors into
probabilistic risk assessment of complex socio-technical systems:
Principles and theoretical foundations. Safety Science 47:1139-1158
Mohaghegh Z, Kazemi R, Mosleh A (2009). Incorporating organizational factors
into probabilistic risk assessment (PRA) of complex socio-technical
systems: A hybrid technique formalization. Reliability Engineering and
System Safety 94:1000-1018
Montijn C, De Jong H (2006). Safety culture in air transport: Definition,
characteristics, indicators and classification scheme. National Aerospace
Laboratory NLR, memorandum ATSF-2006-150
Mooney JD (1947). The principles of organization, Harper & Bros., New York
Morgan G (1996). Images of organizations, SAGE Publications, Thousand Oaks
London New Delhi
Omicini A (2000). SODA: Societies and infrastructures in the analysis and design
of agent-based systems. In: Wooldridge MJ, Ciancarini P (eds.), Proceedings
of Agent-Oriented Software Engineering Workshop, Springer Verlag 185–
193
Parker D, Lawrie M, Hudson P (2006). A framework for understanding the
development of organizational safety culture. Safety Science 44:551-562
Pearl J (2000). Causality: Models of Reasoning and Inference. Cambridge
University Press
Pfeffer J (1982). Organizations and organization theory. Pitman Books Limited,
Boston London Melbourne Toronto
Pfeffer J, Salancik GR (1978). The external control of organizations: A resource
dependence perspective, Harper & Row, New York
Pidgeon NF (1991). Safety culture and risk management in organizations. Journal
of Cross-Cultural Psychology 22(1):129-140
Pinder CC (1998). Work motivation in organizational behavior. Upper Saddle
River, NJ: Prentice-Hall
Ranky PG (1994) Concurrent engineering and enterprise modelling, Assembly
Automation, Volume 14, Number 3, 14-21.
Romme, AGL (2003). Making a difference: Organization as design. Organization
Science, 14, 558-573
Russell S, Norvig P. (1995) Artificial Intelligence: A Modern Approach. Prentice-
Hall, Inc.

NLR-CR-2009-551
December 2009 67
Saltelli A, Ratto M, Tarantola S, Campolongo F (2006). Sensitivity analysis
practices: Strategies for model-based inference. Reliability Engineering and
System Safety 91:1109-1125
Saltelli A, Ratto M, Andres T, Campolongo F, Cariboni J, Gatelli D, Saisana M,
Tarantola S. (2008). Global Sensitivity Analysis: The Primer, Wiley-
Interscience
Schein EH (1992). Organizational culture and leadership. Jossey-Bass, San
Francisco, USA
Scott WG, Mitchell TR, Birnbarum PH (1981). Organization theory: a structural
and behavioural analysis, Richard D. Irwin inc., Illinois, USA
Sharpanskykh A (2008a). On computer-aided methods for modeling and analysis
of organizations. PhD Thesis Vrije Universiteit Amsterdam, The Netherlands
Sharpanskykh A (2008b) Modelling and Automated Analysis of Organisations
from the Air Traffic Management Domain. In: Proceedings of the 21st
International Conference on Industrial, Engineering & Other Applications of
Applied Intelligent Systems. Springer Verlag, 649-658.
Sharpanskykh A (2009) Individual Decision Making in a Learning Organization, In:
Proceedings of the 4th International Conference on Intelligent Computing
and Information Systems, ACM Press, 535-544
Sharpanskykh A (2010) Agent-based Modelling and Analysis of Air Traffic
Organisations, In: Nguyen NT, Szczerbicki E (eds), Intelligent Systems for
Knowledge Management (book chapter), Springer Verlag.
Sharpanskykh A, Stroeve SH (2008a). Safety modelling and analysis of
organizational processes in air traffic – D3: Methods and requirements.
National Aerospace Laboratory NLR, report NLR-CR-2008-299
Sharpanskykh A, Stroeve SH (2008b). Safety modelling and analysis of
organizational processes in air traffic – D5: Validation plan. National
Aerospace Laboratory NLR, report NLR-CR-2008-653
Sharpanskykh, A., Stroeve, S.H., Blom, H.A.P. (2008a) Organizational Modeling
and Analysis of Safety Occurrence Reporting in Air Traffic. In: Proceedings
of the 10th International Conference on Enterprise Information Systems,
INSTICC Press, 225-230.
Sharpanskykh A, Stroeve SH, Van Lambalgen R (2008b). Safety modelling and
analysis of organizational processes in air traffic – D4: Model and initial
simulation results. National Aerospace Laboratory NLR, report NLR-CR-
2008-407
Sharpanskykh A, Stroeve SH (2009a). Safety modelling and analysis of
organizational processes in air traffic – D6: Model evaluation and
improvement. National Aerospace Laboratory NLR, report CR-2009-054,
March 2009

68 NLR-CR-2009-551 December 2009
Sharpanskykh A, Stroeve S (2009b). An agent-based approach to modeling and
analysis of safety culture in air traffic. Proceedings of SocialCom-09/SIN-09
Conference, IEEE CS
Sträter O (2005). Cognition and safety: An integrated approach to system design
and assessment. Ashgate, Hampshire, England
Stroeve SH, Blom HAP, Van der Park MNJ (2003). Multi-agent situation awareness
error evolution in accident risk modelling. Proceedings 5th USA/Europe Air
Traffic Management R&D Seminar, Budapest, Hungary
Stroeve SH, Sharspanskykh A, Blom HAP (2007a). Literature survey of safety
modelling and analysis of organisational processes: EUROCONTROL CARE
Innovative research III. National Aerospace Laboratory NLR, report CR-2007-
156
Stroeve SH, Sharspanskykh A, Blom HAP (2007b). Organisational safety modelling
and analysis of an air traffic application: EUROCONTROL CARE Innovative
research III. National Aerospace Laboratory NLR, report CR-2007-457
Stroeve SH, Sharpanskykh A, Blom HAP (2007c). Systemic safety modelling and
analysis of organizational processes in air traffic. EUROCONTROL Safety
R&D Seminar, Rome, Italy, 24-26 October 2007
Stroeve SH, Sharpanskykh A, Blom HAP (2007d). Safety modelling and analysis of
organizational processes in air traffic. Proceedings EUROCONTROL
Innovative Research Workshop 2007
Stroeve SH, Sharpanskykh A, Van Lambalgen RM, Kirwan B (2008). Safety culture
analysis by agent-based modelling. Proceedings EUROCONTROL Innovative
Research Workshop 2008
Stroeve SH, Sharpanskykh A (2009). Safety modelling and analysis of
organizational processes in air traffic – D7: Validation. National Aerospace
Laboratory NLR, report CR-2009-305, September 2009
Stroeve SH, Sharpanskykh A, Kirwan B (2009a). Can we predict safety culture?
Safety culture analysis by agent-based organizational modelling.
EUROCONTROL Safety R&D Seminar, Munich, Germany, 21-22 October
2009
Stroeve SH, Sharpanskykh A, Kirwan B (2009b). Can we predict safety culture?
Safety modelling and analysis of organizational processes in air traffic.
Proceedings EUROCONTROL Innovative Research Workshop 2009
Stroeve SH, Blom HAP, Bakker GJ (2009c). Systemic accident risk assessment in
air traffic by Monte Carlo simulation. Safety Science 47: 238-249
Uttal B (1983). The corporate culture vultures. Fortune 17:66-72
Vroom VH (1964). Work and motivation. Wiley, New York
Walter B (1968). Modern systems research for the behavioral scientist. Aldine
Publishing Co, Chicago

NLR-CR-2009-551
December 2009 69
Warner M, Witzel M (2004). Managing in Virtual Organizations. Thomson
Learning
Wickens CD, Hollands JG (1999). Engineering psychology and human
performance. Prentice Hall, 1999
Wooldridge M, Jennings N (1995). Intelligent agents: Theory and practice.
Knowledge Engineering Review 10(2)
Yeatts DE, Hyten C (1998). High-performing self-managed work teams: A
comparison of theory to practice. Sage, Thousand Oaks
Yukl G (2006). Leadership in organizations, 6nd ed., Englewood Cliffs, NJ:
Prentice-Hall