safety benefits of paved shoulders · safety benefits of paved shoulders updated final report...
TRANSCRIPT

Safety Benefits of Paved Shoulders
Updated Final ReportAugust 2010
Sponsored byIowa Department of Transportation (InTrans Project 05-239)
Area for photos
About the MTCThe Midwest Transportation Consortium (MTC) is a Tier 1 University Transportation Center (UTC) that includes Iowa State University, the University of Iowa, and the University of Northern Iowa. The mission of the UTC program is to advance U.S. technology and expertise in the many disciplines comprising transportation through the mechanisms of education, research, and technology transfer at university-based centers of excellence. Iowa State University, through its Institute for Transportation (InTrans), is the MTC’s lead institution.
About CTREThe mission of the Center for Transportation Research and Education (CTRE) at Iowa State University is to develop and implement innovative methods, materials, and technologies for improving transportation efficiency, safety, and reliability while improving the learning environment of students, faculty, and staff in transportation-related fields.
Disclaimer NoticeThe contents of this report reflect the views of the authors, who are responsible for the facts and the accuracy of the information presented herein. The opinions, findings and conclusions expressed in this publication are those of the authors and not necessarily those of the sponsors.
The sponsors assume no liability for the contents or use of the information contained in this document. This report does not constitute a standard, specification, or regulation.
The sponsors do not endorse products or manufacturers. Trademarks or manufacturers’ names appear in this report only because they are considered essential to the objective of the document.
Non-Discrimination Statement Iowa State University does not discriminate on the basis of race, color, age, religion, national origin, sexual orientation, gender identity, genetic information, sex, marital status, disability, or status as a U.S. veteran. Inquiries can be directed to the Director of Equal Opportunity and Compliance, 3280 Beardshear Hall, (515) 294-7612.
Iowa Department of Transportation Statements Federal and state laws prohibit employment and/or public accommodation discrimination on the basis of age, color, creed, disability, gender identity, national origin, pregnancy, race, religion, sex, sexual orientation or veteran’s status. If you believe you have been discriminated against, please contact the Iowa Civil Rights Commission at 800-457-4416 or Iowa Department of Transportation’s affirmative action officer. If you need accommodations because of a disability to access the Iowa Department of Transportation’s services, contact the agency’s affirmative action officer at 800-262-0003.
The preparation of this (report, document, etc.) was financed in part through funds provided by the Iowa Department of Transportation through its “Agreement for the Management of Research Conducted by Iowa State University for the Iowa Department of Transportation,” and its amendments.
The opinions, findings, and conclusions expressed in this publication are those of the authors and not necessarily those of the Iowa Department of Transportation.
Technical Report Documentation Page
1. Report No. 2. Government Accession No. 3. Recipient’s Catalog No.
InTrans Project 05-239
4. Title and Subtitle 5. Report Date
Safety Benefits of Paved Shoulders
December 2009, Updated August 2010
6. Performing Organization Code
7. Author(s) 8. Performing Organization Report No.
Shauna L. Hallmark, Thomas J. McDonald, Ye Tian, David J. Andersen
9. Performing Organization Name and Address 10. Work Unit No. (TRAIS)
Center for Transportation Research and Education
Iowa State University
2711 South Loop Drive, Suite 4700
Ames, IA 50010-8664
11. Contract or Grant No.
12. Sponsoring Organization Name and Address 13. Type of Report and Period Covered
Iowa Department of Transportation
800 Lincoln Way
Ames, IA 50010
Updated Final Report
14. Sponsoring Agency Code
15. Supplementary Notes
Visit www.ctre.iastate.edu for color PDF files of this and other research reports.
16. Abstract
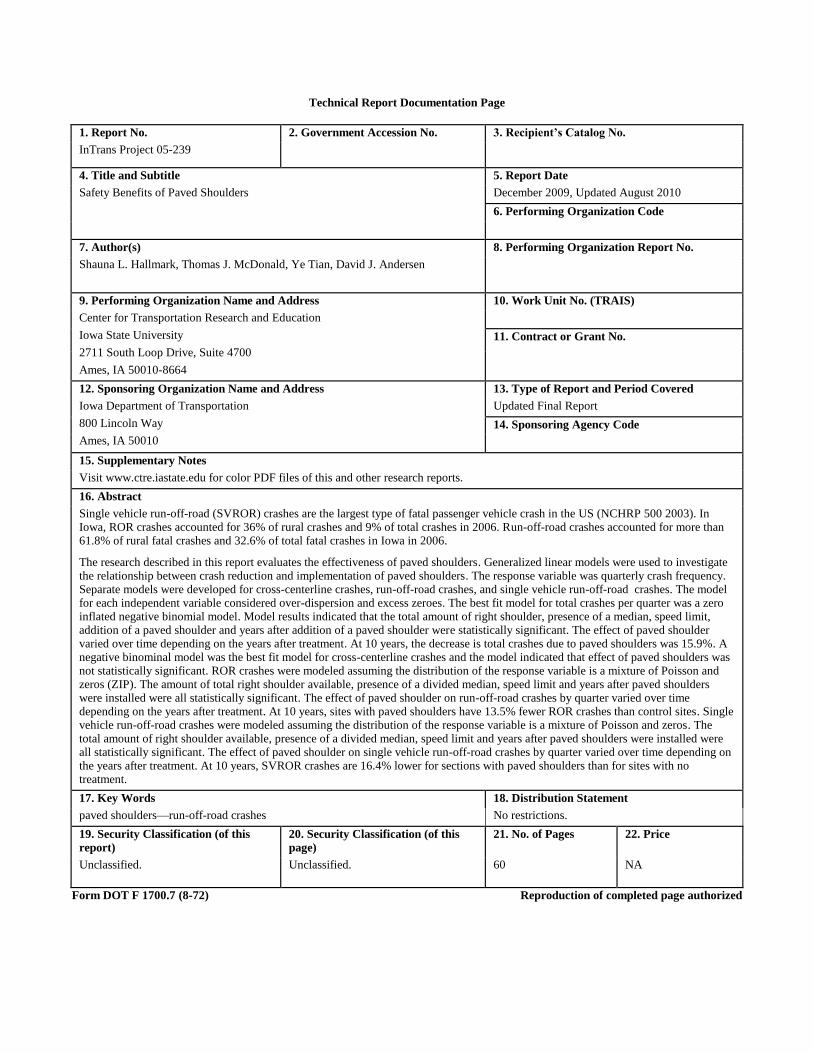
Single vehicle run-off-road (SVROR) crashes are the largest type of fatal passenger vehicle crash in the US (NCHRP 500 2003). In Iowa, ROR crashes accounted for 36% of rural crashes and 9% of total crashes in 2006. Run-off-road crashes accounted for more than 61.8% of rural fatal crashes and 32.6% of total fatal crashes in Iowa in 2006.
The research described in this report evaluates the effectiveness of paved shoulders. Generalized linear models were used to investigate the relationship between crash reduction and implementation of paved shoulders. The response variable was quarterly crash frequency. Separate models were developed for cross-centerline crashes, run-off-road crashes, and single vehicle run-off-road crashes. The model for each independent variable considered over-dispersion and excess zeroes. The best fit model for total crashes per quarter was a zero inflated negative binomial model. Model results indicated that the total amount of right shoulder, presence of a median, speed limit, addition of a paved shoulder and years after addition of a paved shoulder were statistically significant. The effect of paved shoulder varied over time depending on the years after treatment. At 10 years, the decrease is total crashes due to paved shoulders was 15.9%. A negative binominal model was the best fit model for cross-centerline crashes and the model indicated that effect of paved shoulders was not statistically significant. ROR crashes were modeled assuming the distribution of the response variable is a mixture of Poisson and zeros (ZIP). The amount of total right shoulder available, presence of a divided median, speed limit and years after paved shoulders were installed were all statistically significant. The effect of paved shoulder on run-off-road crashes by quarter varied over time depending on the years after treatment. At 10 years, sites with paved shoulders have 13.5% fewer ROR crashes than control sites. Single vehicle run-off-road crashes were modeled assuming the distribution of the response variable is a mixture of Poisson and zeros. The total amount of right shoulder available, presence of a divided median, speed limit and years after paved shoulders were installed were all statistically significant. The effect of paved shoulder on single vehicle run-off-road crashes by quarter varied over time depending on the years after treatment. At 10 years, SVROR crashes are 16.4% lower for sections with paved shoulders than for sites with no treatment.
17. Key Words 18. Distribution Statement
paved shoulders—run-off-road crashes No restrictions.
19. Security Classification (of this
report)
20. Security Classification (of this
page)
21. No. of Pages 22. Price
Unclassified. Unclassified. 60 NA
Form DOT F 1700.7 (8-72) Reproduction of completed page authorized

SAFETY BENEFITS OF PAVED SHOULDERS
Updated Final Report
December 2009
Updated August 2010
Principal Investigator
Shauna L. Hallmark
Transportation Engineer
Institute for Transportation, Iowa State University
Co-Principal Investigator
Thomas J. McDonald
Safety Circuit Rider
Institute for Transportation, Iowa State University
Authors
Shauna L. Hallmark, Thomas J. McDonald, Yu-Yi Hsu, Ye Tian, David J. Andersen
Preparation of this report was financed in part
through funds provided by the Iowa Department of Transportation
through its research management agreement with the
Institute for Transportation,
InTrans Project 05-239.
A report from
Center for Transportation Research and Education
Iowa State University
2711 South Loop Drive, Suite 4700
Ames, IA 50010-8664
Phone: 515-294-8103
Fax: 515-294-0467
www.ctre.iastate.edu

v
TABLE OF CONTENTS
ACKNOWLEDGMENTS ............................................................................................................ vii
EXECUTIVE SUMMARY............................................................................................................ ix
1. INTRODUCTION........................................................................................................................1
1.1 Paved Shoulders .............................................................................................................1 1.2 Rumble Strips ................................................................................................................3
2. DESCRIPTION OF PROJECT ....................................................................................................9
2.1 Project Scope .................................................................................................................9 2.2 Iowa Department of Transportation Current Practices ..................................................9
3. SURVEY OF EXPERT OPINION FIELD MAINTENANCE AND LAW
ENFORCEMENT ..............................................................................................................11
3.1 Survey of Field Maintenance Personnel ......................................................................11 3.2 Survey of Law Enforcement ........................................................................................17
4. DATA COLLECTION ...............................................................................................................23
4.1 Identification of Potential Locations ............................................................................23 4.2 Data Collection ............................................................................................................23 4.3 Determination of Construction Year ............................................................................31 4.4 Data Preparation ...........................................................................................................32
5. ANALYSIS ................................................................................................................................34
5.1 Response Variable .......................................................................................................34 5.2 Explanatory Variables ..................................................................................................34 5.3 Model for Total Crashes ..............................................................................................36 5.4 Model for Cross-Centerline Crashes ............................................................................38 5.5 Model for Run-Off-Road Crashes................................................................................39 5.6 Model for Single Vehicle Run-Off-Road Crashes .......................................................41
6. SUMMARY ...............................................................................................................................44
7. REFERENCES ..........................................................................................................................46
APPENDIX A. DATA COLLECTION FORM .......................................................................... A-1
APPENDIX B. DESCRIPTION OF STATISTICAL MODELB-ERROR! BOOKMARK NOT DEFINED.
vi
LIST OF FIGURES
Figure 1.1. Edge line rumble strip ....................................................................................................5 Figure 1.2. Nighttime view of edgeline rumble strip (image source:
http://www.tfhrc.gov/pubrds/06jul/images/morena14.jpg) ..................................................6 Figure 4.1. Typical gravel unpaved shoulder type .........................................................................25 Figure 4.2. Typical earth unpaved shoulder type ...........................................................................25 Figure 4.3. Typical mixed unpaved shoulder type .........................................................................26 Figure 4.4. Two-lane highway with fully paved shoulders ............................................................26 Figure 4.5. Two-lane highway with partially paved shoulders ......................................................27 Figure 4.6. Two-lane highway with unpaved shoulders ................................................................27 Figure 4.7. Rolled rumble strips ....................................................................................................28 Figure 4.8. Milled rumble strips ....................................................................................................29 Figure 4.9. Formed rumble strips ...................................................................................................29 Figure 4.10. Location of sections collected ...................................................................................33 Figure 5.1. Decrease in crashes over time for situation where no paved shoulders are present
versus having paved shoulders ...........................................................................................38 Figure 5.2. Change in ROR crashes over time for situation where no paved shoulders are present
versus having paved shoulders ...........................................................................................41 Figure 5.3. Change in SVROR crashes over time for situation where no paved shoulders are
present versus having paved shoulders ..............................................................................43
LIST OF TABLES
Table 5.1. Explanatory variables for cross-centerline, ROR, and SVROR models .......................35 Table 5.2. Estimated coefficients for the total crash model ...........................................................37 Table 5.3. Estimated coefficients for the cross-centerline crash model .........................................39 Table 5.4. Estimated coefficients for the ROR crash model ..........................................................40 Table 5.5. Estimated coefficients for the SVROR crash model .....................................................42
Table B.1. Estimates of the random effects DF = 61585 ........... B-Error! Bookmark not defined.
Table B.2. Estimates of the random effects DF = 61585 ........... B-Error! Bookmark not defined.
Table B.3. Estimates of the random effects DF = 61585 ........... B-Error! Bookmark not defined.

vii
ACKNOWLEDGMENTS
The research team would like to thank the Iowa Department of Transportation (Iowa DOT) and
the Midwest Transportation Consortium (MTC) for funding this research. We would especially
like to thank Dr. Michael Pawlovich of the Iowa DOT for extracting monthly crashes and volume
for the analysis. We would also like to thank the Iowa DOT districts that responded to the
maintenance survey and law enforcement personnel who responded to the law enforcement
survey. Additionally, we would like to thank several students who were not included as co-
authors in this report who helped collect data.


ix
EXECUTIVE SUMMARY
Single vehicle run-off-road (SVROR) crashes are the most common type of fatal passenger
vehicle crash in the United States (NCHRP 500 2003). In Iowa, ROR crashes accounted for 36%
of all rural crashes, more than 61.8% of rural fatal crashes, 9% of total crashes, and 32.6% of
total fatal crashes in 2006.
Paved shoulders are a potential countermeasure for ROR crashes. Several studies are available
that have generally indicated that paved shoulders are effective in reducing crashes. However, the
number of studies that quantify the benefits is limited.
In 2004, Iowa adopted a paved shoulder policy for higher volume roads, but a wide range of
paved shoulder types has been utilized for many years in the state. Because the benefits of paved
shoulders have not been quantified, the Iowa Department of Transportation (Iowa DOT)
requested a study to analyze the safety performance of various paved shoulder designs on a wide
spectrum of traffic and roadway types.
The research described in this report was designed to evaluate the effectiveness of paved
shoulders. As part of the research, two surveys were conducted that assessed the opinions of field
maintenance personnel and law enforcement personnel regarding the effectiveness of paved
shoulders. Most maintenance personnel felt that paved shoulders lead to reduced maintenance
costs, and most law enforcement personnel felt that paved shoulders reduce ROR crashes and
improve safety for officers who have to pull over for traffic stops.
This research also included a crash analysis for non-Interstate roadways where paved shoulders
have been installed in Iowa. The team made site visits and collected roadway data for 256
roadway sections in Iowa. The majority included locations where paved shoulders had been
installed, but a number of control sections were collected as well. Each test segment was
reviewed, and the construction year in which paved shoulders were implemented was
determined. In some cases, the roadway segment could not be located in a geographic
information management systems (GIMS) database, and in other cases the construction year
could not be determined. These cases were removed from further analysis. This resulted in a total
of 220 sites analyzed, including 77 control sections and 143 test sections. Sections included both
two- and four-lane roadways. Four-lane roadways were both divided and undivided.
Generalized linear models were used to investigate the relationship between crash reduction and
implementation of paved shoulders. The response variable was quarterly crash frequency. Traffic
volume was modeled as offsets. Separate models were developed for cross-centerline (CL)
crashes, run-off-road (ROR) crashes which included all road departure crashes, and single
vehicle run-off-road (SVROR) crashes which included only road departures involving a single
vehicle. The model for each independent variable considered over-dispersion and excess zeroes.
The best fit model for total crashes per quarter was a zero inflated negative binomial model.
Model results indicated that the total amount of right shoulder, presence of a median, speed limit,
x
addition of a paved shoulder and years after addition of a paved shoulder were statistically
significant. The effect of paved shoulder varied over time depending on the years after treatment.
At 10 years, the decrease is total crashes due to paved shoulders was 15.9%.
A negative binominal model was the best fit model for cross-centerline crashes and the model
indicated that effect of paved shoulders was not statistically significant.
ROR crashes were modeled assuming the distribution of the response variable is a mixture of
Poisson and zeros. The amount of total right shoulder available, presence of a divided median,
speed limit and years after paved shoulders were installed were all statistically significant. The
effect of paved shoulder on run-off-road crashes by quarter varied over time depending on the
years after treatment. At 10 years, sites with paved shoulders have 13.5% fewer ROR crashes
than control sites.
Single vehicle run-off-road crashes were modeled assuming the distribution of the response
variable is a mixture of Poisson and zeros. The total amount of right shoulder available, presence
of a divided median, speed limit and years after paved shoulders were installed were all
statistically significant. The effect of paved shoulder on single vehicle run-off-road crashes by
quarter varied over time depending on the years after treatment. At 10 years, SVROR crashes are
16.4% lower for sections with paved shoulders than for sites with no treatment.
The report is organized in the following way:
Chapter 1 summarizes a literature review of the effectiveness of paved shoulders and
rumble strips.
Chapter 2 describes the project scope and summarizes Iowa DOT paved shoulder
practices.
Chapter 3 provides the results of a survey of field maintenance personnel and law
enforcement personnel regarding their experience with paved shoulders.
Chapter 4 describes data collection.
Chapter 5 describes the analysis of the data.

1
1. INTRODUCTION
Single vehicle run-off-road (SVROR) crashes are the single most common type of fatal passenger
vehicle crash in the United States (NCHRP 500 2003). A ROR crash is defined as a crash in
which one or more vehicles has at least one of the vehicle’s first three sequences of events coded
as ROR-right, ROR-left, or ROR-straight. Many ROR crashes are rural crashes, which are
defined as crashes that occur one or more miles outside of an incorporated area. In Iowa, rural
crashes accounted for 13,255 out of 54,785 crashes in 2006 (24.2%). An extraction of rural ROR
crashes that occurred in 2006 from the Iowa Department of Transportation (DOT) crash database
indicated that ROR crashes accounted for 35.5% of rural crashes and 8.6% of total crashes.
Moreover, ROR crashes accounted for more than 61.8% of rural fatal crashes and 32.6% of total
fatal crashes in Iowa in 2006.
Paved shoulders are a potential countermeasure for ROR crashes. Shoulder rumble strips are also
potentially effective in reducing ROR crashes.
1.1 Paved Shoulders
It is generally accepted that shoulders play an important role in highway design. They provide
additional recovery space for errant vehicles and lateral support for the pavement structure.
Regarding lateral support, Benekohal (1990) stated that, as a rule of thumb, loads applied within
6 in. of the concrete slab edge will produce significant stresses at the slab edge. Benekohal also
concluded that, on roads widened beyond the conventional 12 ft, painted lane lines have a greater
influence on truck wheel placement than the slab edge. The author also found that providing an
additional 18 to 22 in. of pavement beyond the lane line can prevent tractor-semitrailers from
passing within 6 in. of the slab edge.
1.1.1 Safety Benefits
Heimbach (1974) found that rural two-lane highways with paved shoulders had a significantly
lower crash rate than highways with unstabilized shoulders. The National Cooperative Highway
Research Program (NCHRP) Report 197, published in 1978, also found that paved shoulders
exhibit safety benefits. The report concluded that roads with paved shoulders have lower crash
rates than roads with unpaved shoulders of the same width. It also concluded that shoulder
widths and whether shoulders were paved or unpaved had a greater effect on crash rates than lane
widths. A linear model was developed to predict crash rates for roadways with varying lane and
paved shoulder widths. The model was generally able to represent predicted relationships, but
there were some inconsistencies. In general, crash rates decreased as shoulder widths increased.
This rule applies for sections of roadway with 3° or less of horizontal curvature. However, the
opposite result was true for roadways with an average daily traffic (ADT) of less than 1,000
vehicles per day (VPD) or greater than 5,000 VPD (NCHRP 197 1974).
2
Zegeer (1981) conducted a comparative analysis study of state primary, state secondary, and rural
two-lane roads in Kentucky. The sections were selected so that they did not include any major
intersections. A database of 15,944 miles of road was compiled from computer tape, and eight
classifications of roads based on ADT were used. Due to about 70% of the total sample having
no shoulder, shoulders were defined as paved or densely graded. Grass and soil were not
considered shoulders because they are not suitable for driving. Zegeer found that ROR, head-on,
and opposite direction sideswipe crash rates decreased as shoulder width increased from 0 to 9 ft,
but the crash rates increased slightly for shoulders of 10 to 12 ft. Crash severity, however, did not
decrease with wider shoulders. For roadways with lane widths greater than 10 ft, Zegeer
determined that it was economically beneficial to widen the shoulders if there are at least five
ROR and/or opposite direction crashes in one year. For roads without shoulders, the optimal
shoulder width to install was estimated to be 5 ft (Zegeer 1981).
Not all studies have concluded that paved shoulders offer a significant benefit, however. Abboud
(2001) evaluated 2 ft and 4 ft paved shoulders on two-lane highways in Alabama and analyzed
them against county statistics for the expected number of crashes on the treated segments. Crash
records were not kept on specific routes with similar characteristics, and therefore total county
crashes in the before and after period were used as a control. Crash frequency by type and crash
severity were analyzed, but no statistically significant differences were found at the 0.05 alpha
confidence level (Abboud 2001).
Similarly, a study conducted by Souleyrette (2001) did not demonstrate significant crash
reduction benefits. Souleyrette’s study focused specifically on rural two-lane and rural four-lane
divided non-Interstate freeways in the state of Iowa. Only targeted crashes were considered for
this study; intersection crashes, median crashes, and roadway crashes were excluded because they
were assumed to be non-shoulder related. Limited data availability due to conservative shoulder
construction practices in Iowa prevented statistical significance from being obtained with any of
the results. Trends of reduced crash rates were noted but could not be verified with confidence.
The report was able to determine, however, that a reduction of up to $366 per mile per year can
be realized by paving shoulders on two-lane roads.
1.1.2 Bicycle Accommodation
Bicyclist safety and comfort is another benefit of paved shoulders. In 1997, Harkey found that
paved shoulders and bicycle lanes act essentially the same in terms of operations. By studying the
separation distance between motorists and bicyclists on varying shoulder widths, Harkey also
found that bicycle lane widths (paved shoulder widths) as narrow as three ft can allow safe
interactions between motorists and bicyclists. Encroachments by motorists into adjacent lanes
when passing bicyclists were also studied, but there were few observed encroachments and the
encroachments were not attributable to shoulder width. Harkey’s findings, however, only apply
to roadways similar to the ones in the study. These include roadways with vehicle speeds at or
below 50 mph, lane widths of at least 11 ft, and minimal horizontal and vertical sight restrictions.
Roadways with significant curvature or significant large truck traffic may require wider bicycle
lanes (Harkey 1997).
3
The Federal Highway Administration (FHWA) has developed the bicycle compatibility index
(BCI), a level of service concept for bicyclists. According to the BCI Implementation Manual,
the presence or absence of a bicycle lane or paved shoulder has the greatest effect of any variable
on the comfort level of bicyclists. On the one hand, a bicycle lane or a paved shoulder of at least
0.9 m (approximately 3 ft) can increase the level of service for that segment by an entire letter
grade on an ―A‖ through ‖F‖ scale. On the other hand, higher volumes and higher speeds result
in a slight decrease in level of service. The decrease, however, is much smaller than the increase
resulting from a 3 ft paved shoulder (Bicycle Compatibility Index 1999).
1.1.3 Operational Benefits
The operational benefits of paved shoulders were not the focus of the present study, but they are
worth mentioning as an additional benefit of paving shoulders. Turner et al. (1982) have reported
findings about roadway operations based on a study conducted on two-lane roadways without
shoulders, two-lane roadways with full (at least 6 ft) paved shoulders, and four-lane undivided
roadways without paved shoulders. The study focused on three key elements of operations:
vehicle speed, platooning, and shoulder use.
On two-lane roads without paved shoulders, vehicle speeds dropped dramatically as volume
increased. A similar trend was observed on two-lane roads with shoulders, except the trend
diminished at around 150 vehicles per hour. Beyond this point, vehicle speeds did not decrease
with an increase in volume. The difference in trends became significant at about 200 vehicles per
hour. At volumes above 200 vehicles per hour, the average vehicle speed was about 10% higher
on two-lane highways with paved shoulders than on those without (Turner 1982).
The amount of vehicle platooning experienced on a roadway increased with increased volumes,
but appeared to level out at approximately 200 vehicles per hour on two-lane roads with paved
shoulders. Vehicle platooning on two-lane roads without shoulders appeared to continue to
increase exponentially beyond the 200 vehicles per hour mark. This observation led to the
interpolated conclusion that, at volumes above 200 vehicles per hour, two-lane roads with paved
shoulders would experience a smaller percentage of vehicles driving in platoons than would two-
lane roads without paved shoulders (Turner 1982).
1.2 Rumble Strips
Paved shoulders allow additional recovery room for errant vehicles, but they do not alert
distracted drivers who are no longer driving in their intended lane. Rumble strips provide an
audible and tactile alert to drivers who have become distracted and drift away from their travel
lane. In evaluating the impact of rumble strips, some research reports have attempted to
differentiate between ROR crashes and drift-off-road (DOR) crashes. The difference between the
two types is that a ROR crash may result from a driver swerving to avoid some other danger in
the roadway. In this case, rumble strips would be ineffective. A DOR crash occurs when a driver
has fallen asleep or has become distracted in some other manner, such as by looking at a map. In
this case, rumble strips can alert the driver of the impending danger, and the driver can take the
appropriate action. In a study conducted by Morena (2003), DOR crashes account for 40% to
4
71% of all ROR crashes on rural roads in Michigan, with ADT values ranging from 5,000 to
11,000 VPD.
1.2.1 Safety Benefits of Shoulder Rumble Strips
Installing shoulder rumble strips on the Interstate system has proven to be effective in reducing
ROR crashes, but these results may not directly translate to rural two-lane roads. Neuman (2003)
speculates that rumble strips may be less effective on a two-lane road because there a vehicle has
a much smaller recovery area once it has been alerted. However, he also suggests that rumble
strips may be more effective on two-lane rural roads than on Interstate roads because two-lane
roads have a smaller recovery area and a less forgiving roadside. Thus, allowing the driver time
to recover before leaving the road entirely could have a much more significant safety impact on
two-lane roads than on an Interstate. The alignment of two-lane highways is also generally less
forgiving than that of the Interstate, creating a greater need for a warning device to keep drivers
on the roadway. Because no studies are currently available pertaining specifically to the safety
benefits of rumble strips on two-lane rural roads, Neuman estimated that a 20% to 30% reduction
in ROR crashes after the installation of shoulder rumble strips is realistic based on rural freeway
experience.
The New York State Department of Transportation (NYSDOT) began installing continuous
shoulder rumble strips on many of its roads in 1993. The NYSDOT began this process by
including continuous shoulder rumble strips with its regular construction and as site-specific
projects on existing roadways. The New York State Thruway Authority (NYSTA), which owns
and operates private toll roads, also installed continuous shoulder rumble strips between 1992
and 1996. The advantage of the NYSTA data is uniformity, because the data are recorded by a
dedicated troop of the state police force and there are a limited number of miles from which to
collect data. Both New York agencies had a limited amount of before and after data, so statistical
significance was not tested, but both agencies found a crash reduction of 65% to 70%. It should
be noted, however, that some observations were made during years that included construction of
a ―[non] significant percentage‖ of continuous shoulder rumble strips (Perrillo 1998).
Rumble strips were similarly installed on 80% of the Pennsylvania Turnpike between 1989 and
1994. Early results after the first five installation projects were completed found a 70% reduction
in DOR crashes. After speculation of regression to the mean and other factors affecting the
results, a follow-up study was conducted. The study included all reportable accidents from 1990
to 1995 and found a slightly more modest result of a 60% reduction in DOR crashes (Hickey
1997). These results, however, were not tested for statistical significance.
In another approach, Hanley et al. (2000) evaluated four accident reduction factors currently used
by the California Department of Transportation (CALTRANS), including rumble strip
installation, defined as any construction for which a laterally positioned rumble strip had been
installed. In most cases, the study indicated that some shoulder widening occurred as well. The
researchers found statistically significant accident reduction factors for rumble strip installations.

5
Garder and Davies evaluated the effectiveness of continuous shoulder rumble strips on reducing
crashes on rural Interstates in Maine. The authors found that the presence of these installations
reduced crashes overall by 27%, sleep-related ROR crashes by about 58%, and dry road ROR
crashes by about 43%. They also found that fatal crashes were reduced more than other crashes.
Smith and Ivan (2005) evaluated the amount of crash reduction due to milled-in shoulder rumble
strips on limited-access highways. The authors used a three-year before installation and three-
year after installation period on sections of 20 freeways, including some sections without rumble
strips. They found that shoulder rumble strips overall reduced single-vehicle, fixed-object crashes
by 33%. The results also indicated that crashes were reduced by as much as 48.5% within
interchange areas and as little as 12.8% on sections where the speed limit was less than 65 mph.
The authors also found that crashes increased in areas where rumble strips were not installed.
1.2.2 Safety Benefits of Edge line Rumble Strips
Edge line rumble strips (ERSs) are rumble strips that are milled-in at the painted edge line, as
shown in Figure 1.1. They are different from regular shoulder rumble strips because typical
shoulder rumble strips are installed several inches outside of the edge line. However, ERSs still
require the presence of a shoulder because they are two to three times wider than the lane line
itself. There are several potential benefits of ERSs. They can increase painted edgeline visibility
and longevity, provide additional recovery room for errant vehicles, and provide more room for
bicyclists on the shoulder.
Figure 1.1. Edge line rumble strip
6
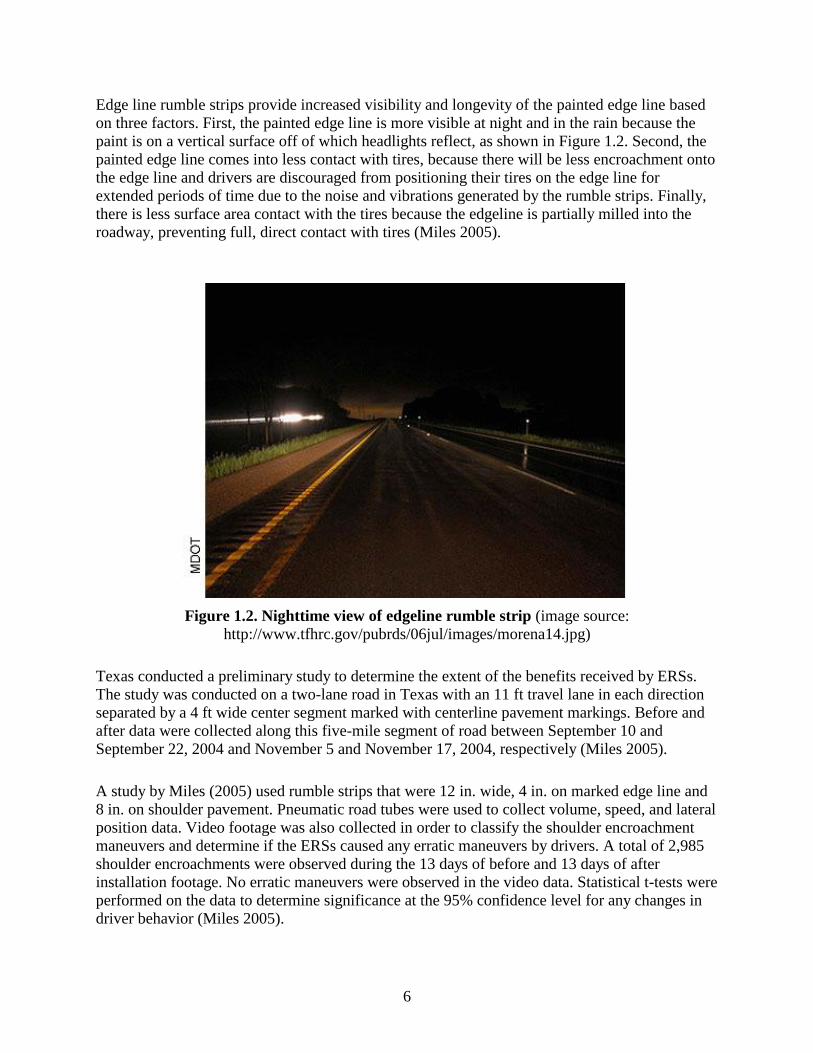
Edge line rumble strips provide increased visibility and longevity of the painted edge line based
on three factors. First, the painted edge line is more visible at night and in the rain because the
paint is on a vertical surface off of which headlights reflect, as shown in Figure 1.2. Second, the
painted edge line comes into less contact with tires, because there will be less encroachment onto
the edge line and drivers are discouraged from positioning their tires on the edge line for
extended periods of time due to the noise and vibrations generated by the rumble strips. Finally,
there is less surface area contact with the tires because the edgeline is partially milled into the
roadway, preventing full, direct contact with tires (Miles 2005).
Figure 1.2. Nighttime view of edgeline rumble strip (image source:
http://www.tfhrc.gov/pubrds/06jul/images/morena14.jpg)
Texas conducted a preliminary study to determine the extent of the benefits received by ERSs.
The study was conducted on a two-lane road in Texas with an 11 ft travel lane in each direction
separated by a 4 ft wide center segment marked with centerline pavement markings. Before and
after data were collected along this five-mile segment of road between September 10 and
September 22, 2004 and November 5 and November 17, 2004, respectively (Miles 2005).
A study by Miles (2005) used rumble strips that were 12 in. wide, 4 in. on marked edge line and
8 in. on shoulder pavement. Pneumatic road tubes were used to collect volume, speed, and lateral
position data. Video footage was also collected in order to classify the shoulder encroachment
maneuvers and determine if the ERSs caused any erratic maneuvers by drivers. A total of 2,985
shoulder encroachments were observed during the 13 days of before and 13 days of after
installation footage. No erratic maneuvers were observed in the video data. Statistical t-tests were
performed on the data to determine significance at the 95% confidence level for any changes in
driver behavior (Miles 2005).

7
The data revealed an overall reduction in shoulder encroachments of 46.7%. When broken down
by encroachment type, the ―other‖ case experienced the greatest proportional decrease in
shoulder encroachments. The ―other‖ case included ―inadvertent contact with the edge line
because of natural lane shifting, driver inattention or fatigue, swaying motions of trailers, or large
load width.‖ Encroachments classified as ―other‖ are categorized as one of four types, ranging
from ―right tires hit,‖ for when only the right tires contact the rumble strips, to ―around,‖ for
when both sets of tires completely cross over the rumble strips (Miles 2005).
While the number of encroachments decreased, lateral position of vehicles increased in distance
beyond the edge line. This was not statistically significant, however, and standard deviations
were large. The general increase in encroachment distance was attributed to the fact that the
treatment was most effective in limiting ―other‖ encroachments that involve only the vehicles’
right tires contacting the rumble strips. Certain maneuvers, such as straddling maneuvers by
vehicles with three or more axles, actually increased. This is likely because it is difficult to keep
wide loads and swaying trailers in the travel lane, so a conscious decision may have been made
by these drivers to straddle the ERSs. ―Passing‖ drivers in two-axle vehicles were also more
likely to pull completely onto the shoulder when allowing faster vehicles to pass in order to avoid
the annoyance of their left tire driving along the ERSs (Miles 2005). These observations may
create more wear and tear on shoulders not designed for vehicle traffic and may add to bicyclist
discomfort, but these are not necessarily viewed as less safe for drivers using the facility.
In another study, Corkle et al. (2001) summarized eight research studies on edge line rumble
strips and found that ROR crashes were reduced by 20% to 72%.
1.2.3 Bicycle Accommodation with Shoulder Rumble Strips
Bicyclists have the right to ride in the right-hand lane on Iowa highways, excluding the Interstate
highway system and where explicitly prohibited; therefore, highways should be designed to
accommodate them (2007 Iowa Code §321.324). In addition to their legal right to access the
right-most travel lane from the shoulder, bicyclists may need to access the travel lanes in order to
avoid debris on the shoulder. A bicyclist may also need to access the travel lane when
approaching a right-turn lane to avoid any potential collisions with a turning vehicle. Rumble
strips present a problem in this regard because they are designed to vibrate cars and alert
inattentive drivers. This is a safety feature for motor vehicles, but it is a dangerous obstacle for
bicyclists (Moeur 2000).
In Arizona, most of the bicycles operated on the streets and highways do not have any suspension
or shock absorbers. The only shock absorption these bicycles have is in their tires, saddles, hand
grips, and the riders themselves. This means the vertical displacement created by the rumble
strips will have a more severe effect on bicycles than on cars, trucks, or motorcycles. A gap
pattern in rumble strips was developed in order to reach a compromise between motorist and
bicyclist safety (Moeur 2000).
In their guide for development of bicycle facilities, the American Association of State Highway
and Transportation Officials (AASHTO) recommends a minimum design speed of 20 mph in

8
general, whether rumble strips are present or not, and 30 mph where down grades exceeding 4%
or strong winds are present (AASHTO 1999). In testing gap lengths in rumble strips, bicyclists
attempted to navigate the gaps in a gap pattern with an average of 25 mph, but speeds ranged up
to 31 mph. All skill levels of bicyclists were able to navigate both a 10 and 12 ft gap, but the
bicyclists felt that the 10 ft gap would be ―too tight‖ for ―real world‖ applications (Moeur 2000).
A 12 ft gap pattern allows for a vehicle to leave the roadway with up to a 4.7° departure angle
and still have the full right tire hit a 12 in. wide rumble strip. Moeur (2000) found a study stating
that the typical departure angle for a ROR crash is 3°, but other research contradicts this finding.
A 1986 study found only 17% of rural arterial ROR crash impacts occur at 5° or less (Mak 1986).
While the impact angle may be different than the departure angle, it is reasonable to assume that
they would be approximately similar. It may also be appropriate to assume vehicles leaving the
roadway at higher angles are doing so to avoid another vehicle or because of ice or edge drop-off,
not necessarily because of fatigue or distraction.
Establishing a regular pattern for the rumble strip gaps will allow bicyclists to easily find a gap
when necessary. For the 12 ft gap pattern, a 40 ft and 60 ft cycle were considered acceptable. The
40 ft cycle would consist of 28 ft of rumble strips followed by a 12 ft gap, and so on. The 60 ft
cycle would likewise consist of 48 ft of rumble strips followed by a 12 ft gap, and so on. The 40
ft cycle allows for 70% coverage of rumble strips and the 60 ft pattern provides 80% coverage.
Both patterns provide a sufficient frequency of gaps for bicyclists to depart the shoulder in
advance of hazards and intersections (Moeur 2000).
9
2. DESCRIPTION OF PROJECT
2.1 Project Scope
The value of paved shoulders has been acknowledged for many years by transportation agencies
and road users alike. Improved safety and convenience as well as reduced routine maintenance
costs are all common benefits attributed to paved shoulders. In 2004, Iowa adopted a paved
shoulder policy for higher volume roads, but a broad diversity of paved shoulder types has been
utilized for many years in the state. Since the benefits of paved shoulders have not been
quantified, the Iowa DOT requested a study to analyze the safety performance of various paved
shoulder designs on a wide spectrum of traffic and roadway types.
Although several types and designs of paved shoulders have been constructed by contract and
installed by agency maintenance staff for many years, an extensive analytical analysis of safety
benefits has not been undertaken. Many design and maintenance decisions regarding paved
shoulders must rely on subjective data and intuitive judgment. As a result, there is a need to
quantify the safety impacts of paved shoulders so that agencies can make better decisions on the
costs and benefits of improvements.
In order to address this need, this research evaluated the effectiveness of paved shoulders in
reducing the number of crashes. This study evaluated all non-Interstate roadway types in Iowa
where paved shoulders have been installed. The study collected data over a large number of
segments where paved shoulders have been installed and along control sections. A crash analysis
was conducted as described in Sections 3 and 4. A survey was also conducted to assess the
opinion of field maintenance personnel and law enforcement personnel as to their experience
with paved shoulders.
2.2 Iowa Department of Transportation Current Practices
The Iowa DOT Design Manual suggests that 4 ft paved shoulders be included in all National
Highway System (NHS) projects. Non-NHS projects should also include paved shoulders if the
current year ADT is 3,000 or more. The manual’s suggestions are as follows:
For non-NHS highways with a current year ADT of less than 3,000, a combination of
other factors such as those listed below needs to be considered to determine if paved
shoulders are appropriate:
Design year ADT: even if current year ADT doesn’t warrant paved shoulders,
design year ADT may be high enough that the designer should consider paved
shoulders.
Run-off-the-road crash rate: paved shoulders should be considered for segments
of roadway that exhibit a high run-off-the-road crash rate.
Horizontal and vertical alignment: paved shoulders should be considered for
segments of roadway with a high number of horizontal curves—paved shoulders
can reduce problems associated with off-tracking. Segments of road with steep
10
grades should also receive consideration for paved shoulders, as storm runoff can
cause erosion of shoulder rock on steep grades.
High truck volumes: segments of roadway that carry high truck volumes may be
candidates for paved shoulders.
Maintenance issues: paved shoulders should also be considered for segments of
roadway that experience continuing problems with edge rut.
Shoulder width continuity: continuity of paved shoulder width is desirable along
segments of a corridor.
Rumble strips: rumble strips are normally not placed on paved shoulders less than
4 ft wide.
Multiple widening units: consider how many times the pavement has been or may
be widened. Multiple narrow widening units are undesirable—they can create an
uneven surface and lead to additional maintenance. Paved shoulders may be more
appropriate.
Cost differential: the cost for 4 ft paved shoulders is only slightly more than for
pavement widening. The safety benefits of paved shoulders may outweigh the
extra cost.
Bicycle accommodation: if bicycle accommodation is warranted, minimum 4 ft
shoulders are recommended. (Design Manual)
Wider shoulders may be appropriate if paved shoulders are warranted for bicycle
accommodation. The Office of Systems Planning should be consulted for guidance in this
decision. For example, if a state highway is within a statewide trail corridor, 6 ft paved shoulders
may be recommended (Design Manual).

11
3. SURVEY OF EXPERT OPINION FIELD MAINTENANCE AND LAW
ENFORCEMENT
A survey was conducted to assess the opinion of field maintenance personnel and law
enforcement personnel and to obtain expert opinion about the effectiveness of paved shoulders.
Another survey was sent to law enforcement personnel to assess their subjective opinions about
how effective paved shoulders are in reducing crashes. The results of both surveys are provided
in the following sections.
3.1 Survey of Field Maintenance Personnel
A survey about the effectiveness of paved shoulders related to maintenance was sent to all six
Iowa DOT districts. It was beyond the scope of this project to evaluate the improvement in
pavement performance due to the adding of paved shoulders. However, the survey provides a
subjective measure of how paved shoulders might improve maintenance based on the expert
opinions of maintenance personnel. Seventeen people from the six districts responded to the
following questions. Responses to the questions are also shown.
(1) Approximately three years ago, the Iowa DOT adopted paved shoulder guidelines for
new and rehabilitated roads in Iowa. Do you approve of these guidelines?
0%
10%
20%
30%
40%
50%
60%
70%
80%
90%
No Yes Wasn't aware of guidelines
Question 1
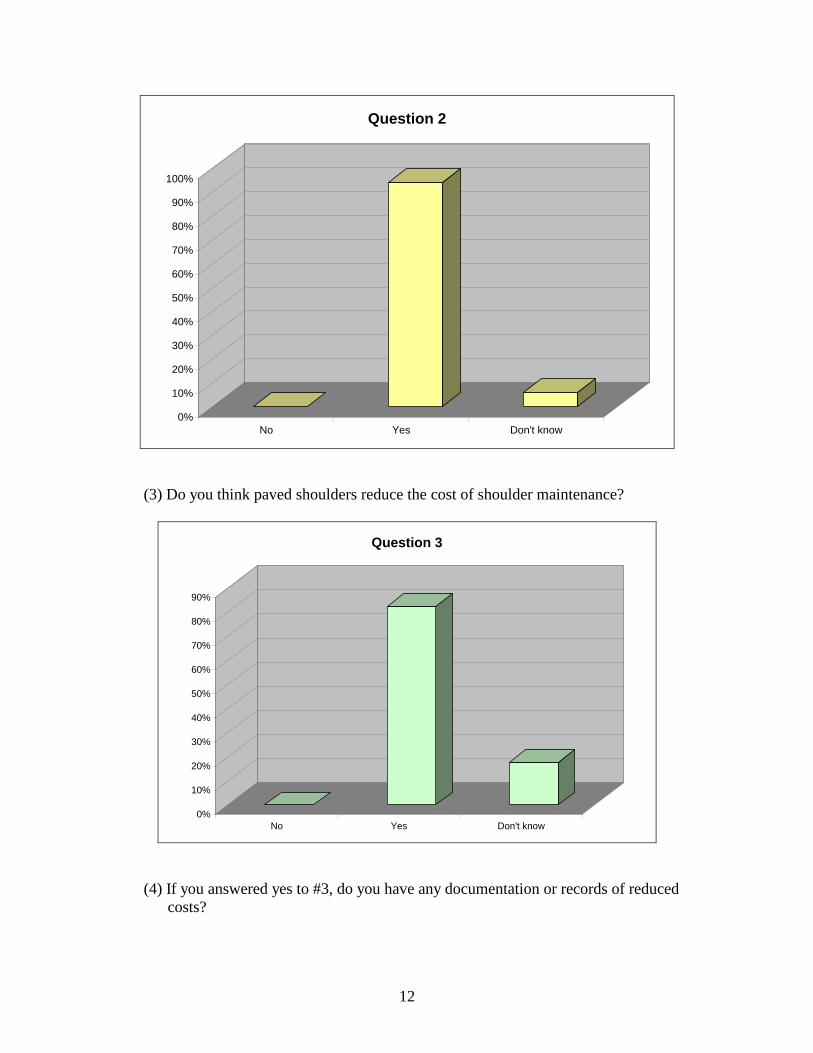
(2) Do you think paved shoulders reduce the hours required to maintain shoulders and
perform edge rut repair, allowing more time to be spent on other priority activities?
12
0%
10%
20%
30%
40%
50%
60%
70%
80%
90%
100%
No Yes Don't know
Question 2
(3) Do you think paved shoulders reduce the cost of shoulder maintenance?
0%
10%
20%
30%
40%
50%
60%
70%
80%
90%
No Yes Don't know
Question 3
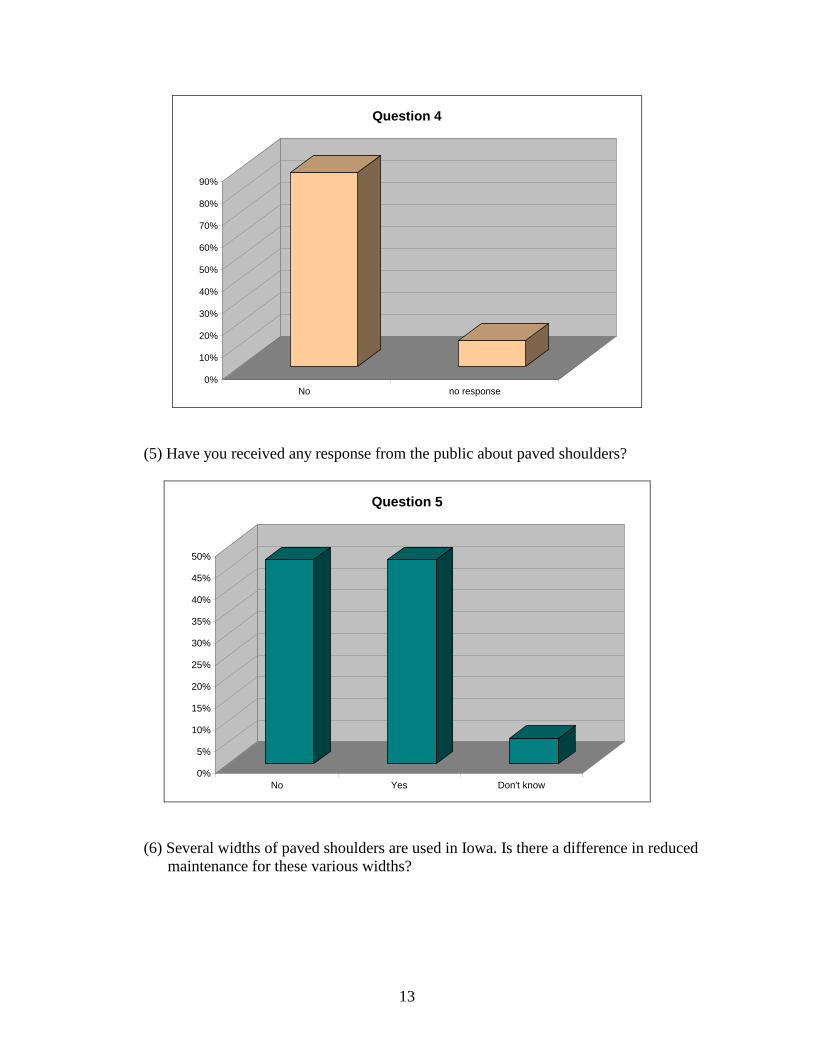
(4) If you answered yes to #3, do you have any documentation or records of reduced
costs?
13
0%
10%
20%
30%
40%
50%
60%
70%
80%
90%
No no response
Question 4
(5) Have you received any response from the public about paved shoulders?
0%
5%
10%
15%
20%
25%
30%
35%
40%
45%
50%
No Yes Don't know
Question 5
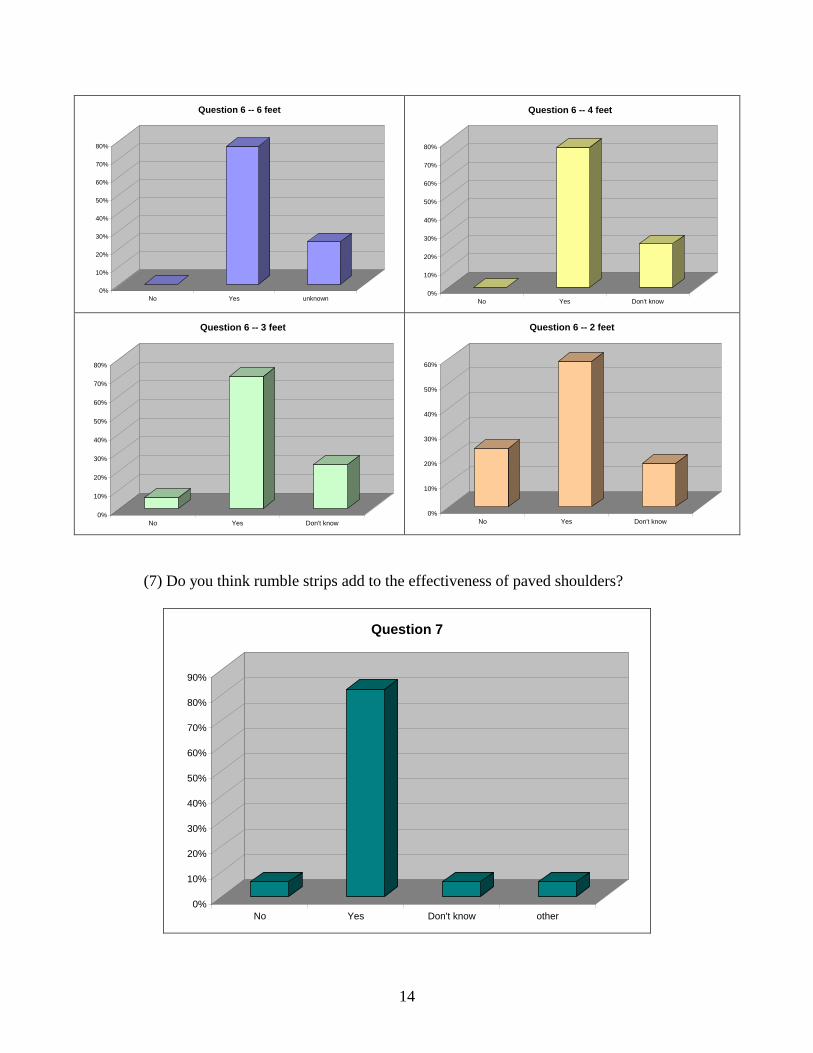
(6) Several widths of paved shoulders are used in Iowa. Is there a difference in reduced
maintenance for these various widths?
14
0%
10%
20%
30%
40%
50%
60%
70%
80%
No Yes unknown
Question 6 -- 6 feet
0%
10%
20%
30%
40%
50%
60%
70%
80%
No Yes Don't know
Question 6 -- 4 feet
0%
10%
20%
30%
40%
50%
60%
70%
80%
No Yes Don't know
Question 6 -- 3 feet
0%
10%
20%
30%
40%
50%
60%
No Yes Don't know
Question 6 -- 2 feet
(7) Do you think rumble strips add to the effectiveness of paved shoulders?
0%
10%
20%
30%
40%
50%
60%
70%
80%
90%
No Yes Don't know other
Question 7

15
(8) Do you think edge rut paving placed by DOT maintenance is effective in reducing
edge rutting and needed maintenance?
0%
10%
20%
30%
40%
50%
60%
70%
80%
90%
100%
No Yes
Question 8
(9) Some districts have moved the painted edge line in about 1 ft instead of placing
narrow paved shoulders. What do you think of this practice in terms of reduced edge
rut maintenance?
0%
5%
10%
15%
20%
25%
30%
35%
40%
45%
50%
Not effective Effective No experience or no
opinion
Question 9
16
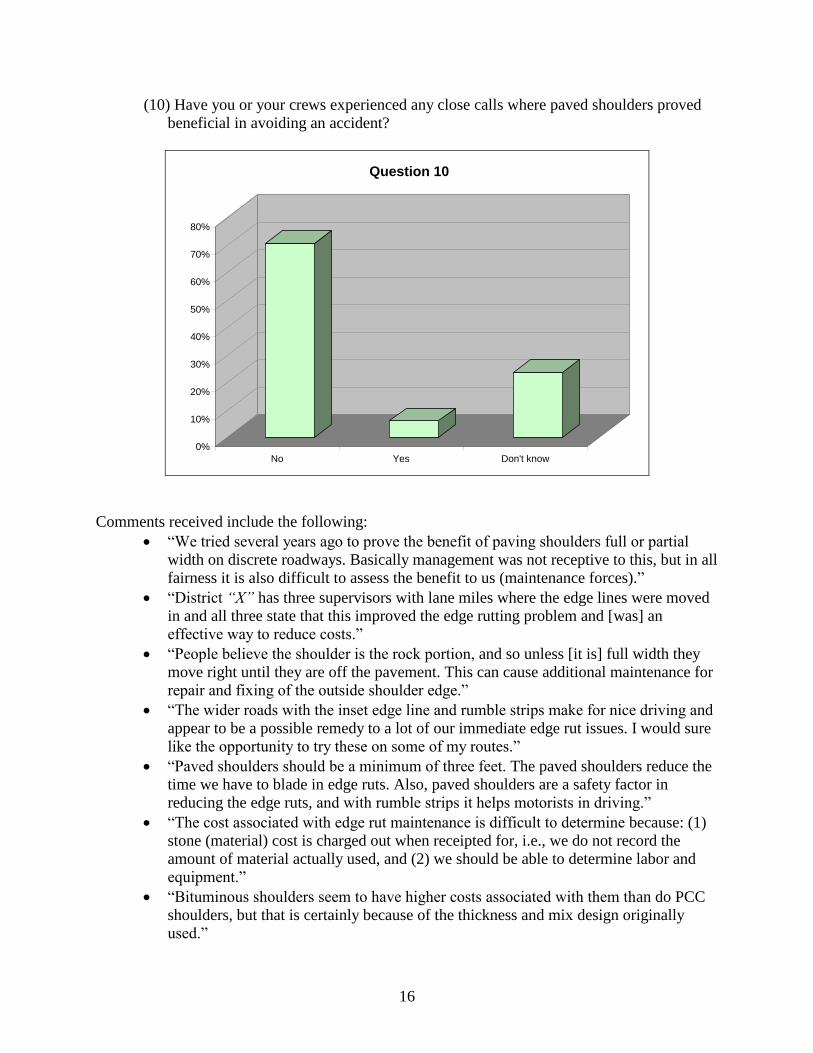
(10) Have you or your crews experienced any close calls where paved shoulders proved
beneficial in avoiding an accident?
0%
10%
20%
30%
40%
50%
60%
70%
80%
No Yes Don't know
Question 10
Comments received include the following:
―We tried several years ago to prove the benefit of paving shoulders full or partial
width on discrete roadways. Basically management was not receptive to this, but in all
fairness it is also difficult to assess the benefit to us (maintenance forces).‖
―District “X” has three supervisors with lane miles where the edge lines were moved
in and all three state that this improved the edge rutting problem and [was] an
effective way to reduce costs.‖
―People believe the shoulder is the rock portion, and so unless [it is] full width they
move right until they are off the pavement. This can cause additional maintenance for
repair and fixing of the outside shoulder edge.‖
―The wider roads with the inset edge line and rumble strips make for nice driving and
appear to be a possible remedy to a lot of our immediate edge rut issues. I would sure
like the opportunity to try these on some of my routes.‖
―Paved shoulders should be a minimum of three feet. The paved shoulders reduce the
time we have to blade in edge ruts. Also, paved shoulders are a safety factor in
reducing the edge ruts, and with rumble strips it helps motorists in driving.‖
―The cost associated with edge rut maintenance is difficult to determine because: (1)
stone (material) cost is charged out when receipted for, i.e., we do not record the
amount of material actually used, and (2) we should be able to determine labor and
equipment.‖
―Bituminous shoulders seem to have higher costs associated with them than do PCC
shoulders, but that is certainly because of the thickness and mix design originally
used.‖
17
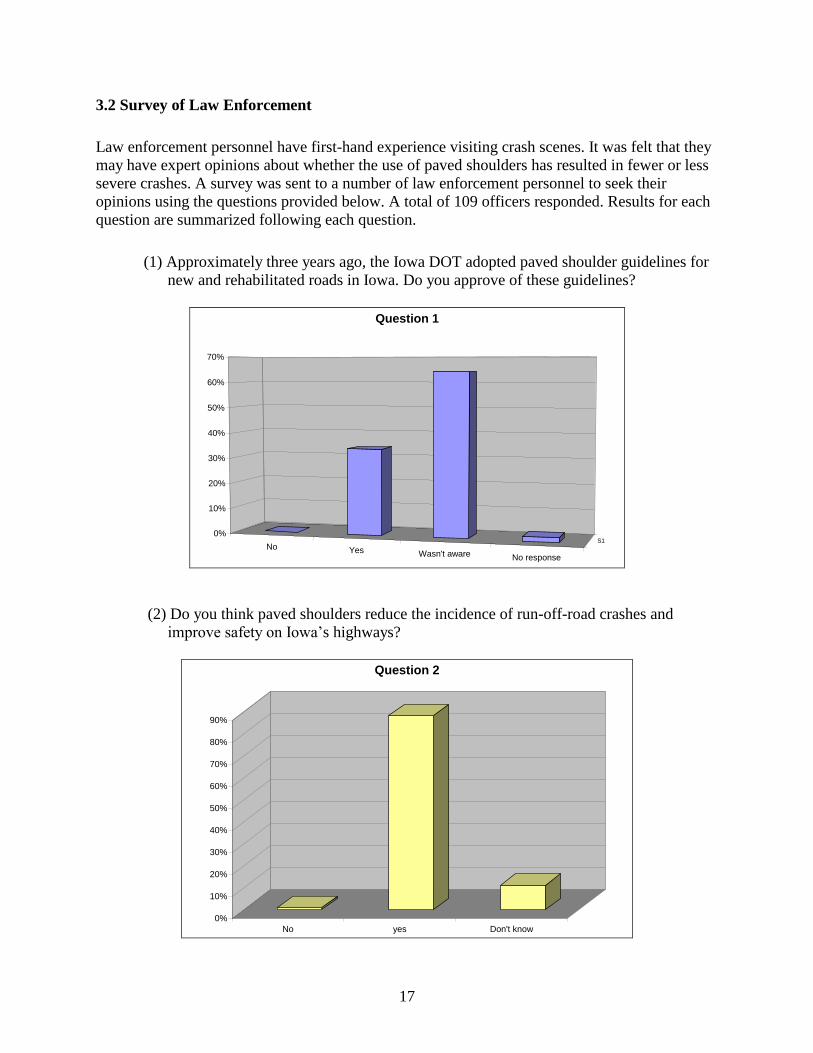
3.2 Survey of Law Enforcement
Law enforcement personnel have first-hand experience visiting crash scenes. It was felt that they
may have expert opinions about whether the use of paved shoulders has resulted in fewer or less
severe crashes. A survey was sent to a number of law enforcement personnel to seek their
opinions using the questions provided below. A total of 109 officers responded. Results for each
question are summarized following each question.
(1) Approximately three years ago, the Iowa DOT adopted paved shoulder guidelines for
new and rehabilitated roads in Iowa. Do you approve of these guidelines?
No Yes Wasn't aware No response
S10%
10%
20%
30%
40%
50%
60%
70%
Question 1
(2) Do you think paved shoulders reduce the incidence of run-off-road crashes and
improve safety on Iowa’s highways?
0%
10%
20%
30%
40%
50%
60%
70%
80%
90%
No yes Don't know
Question 2
18
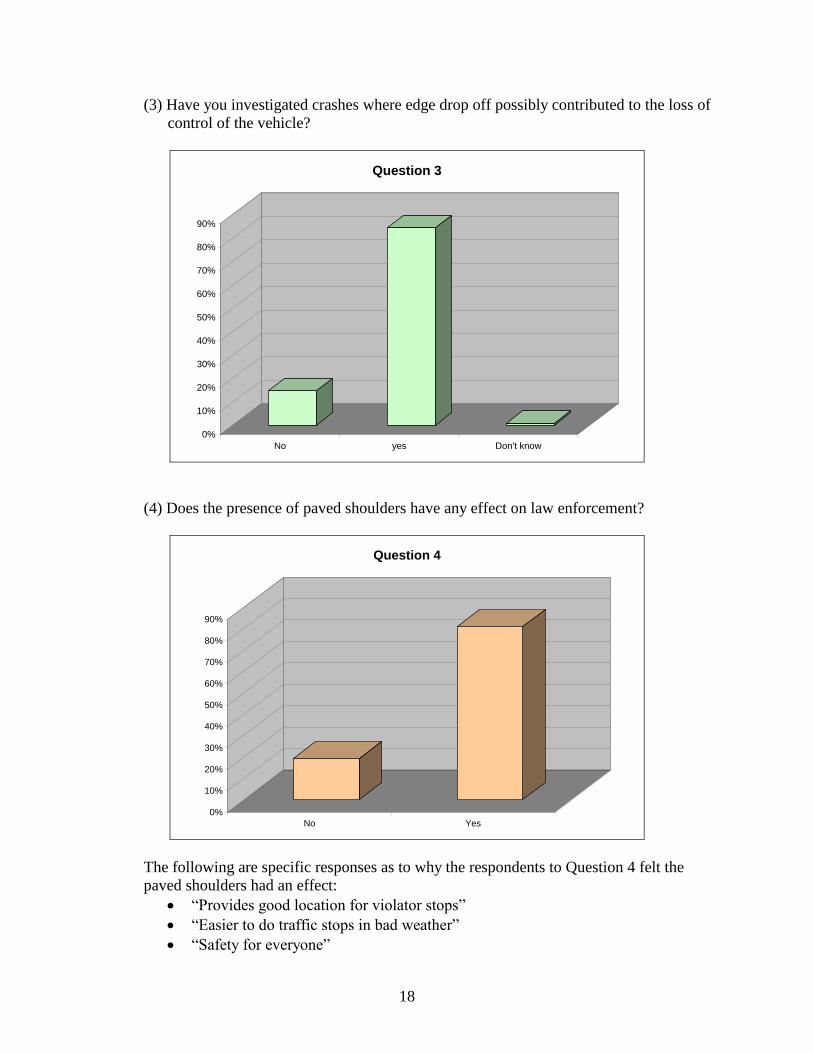
(3) Have you investigated crashes where edge drop off possibly contributed to the loss of
control of the vehicle?
0%
10%
20%
30%
40%
50%
60%
70%
80%
90%
No yes Don't know
Question 3
(4) Does the presence of paved shoulders have any effect on law enforcement?
0%
10%
20%
30%
40%
50%
60%
70%
80%
90%
No Yes
Question 4
The following are specific responses as to why the respondents to Question 4 felt the
paved shoulders had an effect:
―Provides good location for violator stops‖
―Easier to do traffic stops in bad weather‖
―Safety for everyone‖

19
―May invite passing on the right/shoulder‖
―Allows motorists to pull over on a paved surface when an emergency vehicle
running code comes up behind them. Also provides a more stable platform for
conducting traffic stops‖
―Should save on accidents of question #3‖
―Officer safety during stops or assisting motorists‖
―If the shoulders are gravel and wet, driving onto them could cause the patrol car
and violator may get stuck. With paved shoulders there is a less likely chance of
getting stuck.‖
―They are more safe to patrol and there is a better surface to perform standard
field sobriety testing (OWI tests) on.‖
―Creates a better environment for officer safety‖
―We use them for turning and abandoned vehicles.‖
―Give more room and better footing when doing approach to traffic stops‖
―Makes turning around safer and allows violators to exit and/or re-enter traffic
easier.‖
―I believe it is safer pulling cars over on paved shoulders and is much safer while
conducting OWI investigations.‖
―Cleaner cars, safer OWI sobriety tests‖
―Giving people a place to pull off roadway if vehicle breaks down is a good idea.‖
―Safer for traffic stops and would think possibly help prevent accidents‖
―Provides for more safety during traffic stops‖
―Safer turn-around to pursue violators. Safer area for traffic stops and stalled
motorists‖
―Not aware of any paved shoulders in Tama County‖
―Safety with vehicles stopped‖
―Reduce overcorrecting accidents‖
―Allows easier turn-around maneuvers to stop violators‖
―Helps with controlled braking when trying to get on shoulder quickly‖
―Paved shoulders present more available roadway to make safe vehicle stops,
leaving the traveled portion open to the motoring public.‖
―Safer for traffic stops‖
―Easier to do roadside sobriety tests‖
―Provided the shoulders are wide enough, it allows us to sit at roadside and run
radar and maintain traffic.‖
―It provides a safer place for motorists to pull over out of the way of emergency
vehicles.‖
―A good surface to conduct OWI SFST’s/vehicle weight‖
―We have one section in town where, because of the fog line, persons think there's
an additional traffic lane.‖
―Easier turnarounds, safer environment‖
―Makes traffic stops and motorist assists easier and safer‖
―Safer environment to pull cars over and for disabled vehicles‖
―Safety of officers during traffic stops‖
20
―Makes it easier to jack-up a car for flat tires, helps in making turnaround to chase
violators, stranded motorist, list could go on with more room.‖
―Wider turn around, better footing, etc.‖
―Less accidents‖
―Makes for easier pull overs on stops‖
―Presumably fewer drop off/loss of controls‖
―Better shoulders make it easier to turn around.‖
―Extra measure of traffic safety for public as ourselves‖
―Less crashes—wider shoulders are safer for traffic enforcement.‖
―Provides a safe pull off point for traffic stops or 10-50 investigations‖
―Safer and easier to work traffic enforcement‖
―Allows drivers to make mistakes by going off the road. Soft shoulders wouldn't
be as forgiving.‖
―Safer place to pull vehicles over—possibly reduce accidents‖
―Continuous turning around on shoulder and the safety of standing on and
working on a hard shoulder‖
―Safe place to pull over vehicles‖
―Hopefully decreases accidents—safer environment for traffic stops‖
―Safer roadways—less accidents‖
―When there are problems it is easier to have more shoulder room, it also makes it
safer in the winter.‖
―Safer environment to work from‖
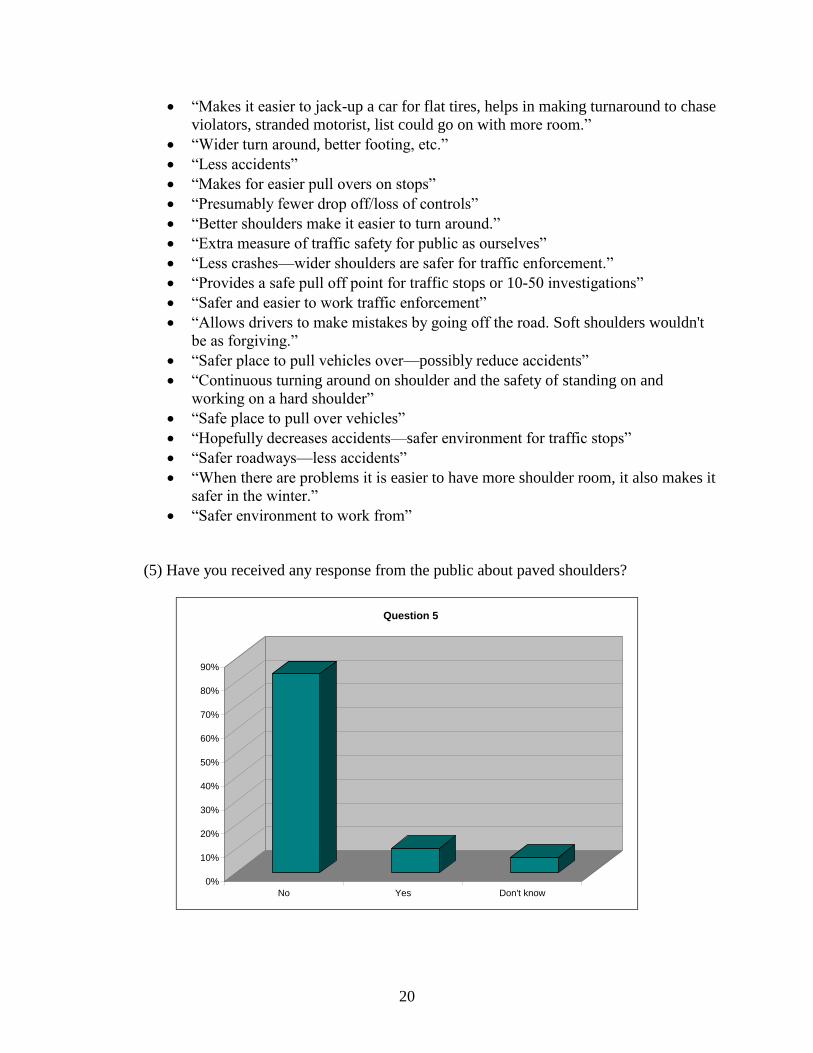
(5) Have you received any response from the public about paved shoulders?
0%
10%
20%
30%
40%
50%
60%
70%
80%
90%
No Yes Don't know
Question 5
21
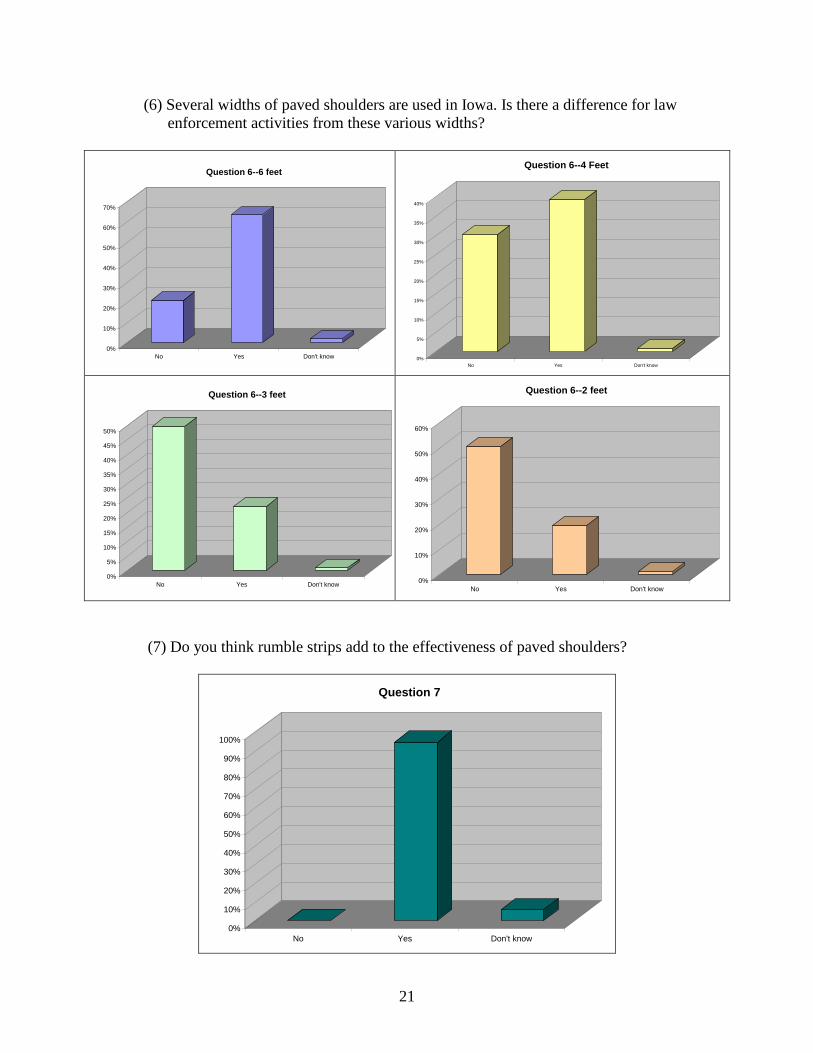
(6) Several widths of paved shoulders are used in Iowa. Is there a difference for law
enforcement activities from these various widths?
0%
10%
20%
30%
40%
50%
60%
70%
No Yes Don't know
Question 6--6 feet
0%
5%
10%
15%
20%
25%
30%
35%
40%
No Yes Don't know
Question 6--4 Feet
0%
5%
10%
15%
20%
25%
30%
35%
40%
45%
50%
No Yes Don't know
Question 6--3 feet
0%
10%
20%
30%
40%
50%
60%
No Yes Don't know
Question 6--2 feet
(7) Do you think rumble strips add to the effectiveness of paved shoulders?
0%
10%
20%
30%
40%
50%
60%
70%
80%
90%
100%
No Yes Don't know
Question 7

22
(8) In some Iowa DOT districts, painted edge lines have been moved in about 1 ft instead
of placing narrow paved shoulders. What do you think of this practice in terms of
reducing run-off-road crashes?
0%
10%
20%
30%
40%
50%
60%
70%
Not effective Effective No experience or no
opinion
Question 8
(9) Have you experienced any close calls where paved shoulders proved beneficial in
avoiding a crash or personal injury?
0%
10%
20%
30%
40%
50%
60%
70%
No Yes
Question 9
23
4. DATA COLLECTION
The main objective of this project was to conduct a before and after crash analysis for locations
where paved shoulders have been included in maintenance or resurfacing, restoration, and
rehabilitation (3R) projects. A total of 277 segments of road data were collected as described in
the following sections. Data were collected in 82 counties. Data were collected for segments that
had paved shoulders and for a smaller group of similar roadways that did not have paved
shoulders, which were used as control sections for the statistical analysis.
4.1 Identification of Potential Locations
Engineers from each district in Iowa were contacted in an effort to identify sections of paved
shoulders within the State of Iowa. The information received from the engineers was combined
with a list of recent 3R projects from fiscal year 2000 through fiscal year 2006 that was obtained
from the Iowa DOT. Sections listed as widening projects or those listed as receiving a paved
shoulder in the description were selected as potential sites.
In addition to the information received from the Iowa DOT, any locations that the team or the
Iowa DOT project monitor were aware of or any locations encountered during site visits were
also included. A paved shoulder was defined as a shoulder that had at least 1 ft of paved material
beyond the painted edge line. This definition was to distinguish a location with intentional
paving from a location where the edge line inadvertently varied as it was laid.
4.2 Data Collection
Once the list of potential locations was compiled, each site was visited and roadway data were
collected. Data were usually collected in at least two locations to ensure uniformity of the
section. Typically, data were collected at a spot one or two miles after the paved shoulder section
began and then was collected approximately every two to four miles thereafter. Frequency of data
collection depended on the confidence of the data collector in the uniformity of that section.
Beginning and ending points of roadway sections were determined by profile and construction
year uniformity. Clearly, a segment began and ended when a paved shoulder started or stopped.
In addition to this criterion, however, differences were looked for along the roadway to ensure
construction year uniformity. If a segment changed pavement type, then the segment ended not
only because of the difference in pavement, but because the sections were most likely constructed
in different years. Obvious changes in pavement color or construction techniques, such as rumble
strip type or presence, were also cause for a segment to end for construction year uniformity.
Finally, speed limit changes and segment length were reason to end a section. Once a section
reached about 12 miles in length, it was ended to maintain some uniformity in the section lengths
being studied. Additionally, after data were collected, several sections were split into smaller
sections if annual average daily traffic (AADT) varied significantly along the section.
The following information was recorded at each location where data were collected using a data
collection form:
Speed limit

24
Orientation (i.e., N/S)
Pavement type
Shoulder type
Shoulder pavement type
Unpaved shoulder type
Rumble strip type
Rumble strip location
Total paved width
Paved shoulder width
Unpaved shoulder width
Presence of paved driveway entrances or widening on curves
Anything unusual about roadway
Date, county, and a detailed literal description of the segment of roadway were noted at each
location. The location of each ―sample‖ of data within a segment was also noted. The roadway
segment, including locations of each individual data collection location, was also marked on a
detailed map of Iowa at the time of data collection. This was done to ensure the correct location
was found later when identifying locations in GIMS files. Finally, a picture was taken at each
data collection location for reference if there was any question about what was collected. A
description of how each characteristic was collected is provided in the following sections.
4.2.1 Speed Limit
When speed limits were not posted, a speed limit of 55 mph was assumed (2007 Iowa Code
§321.285) (Iowa 2006–2007).
4.2.2 Orientation
North/south and east/west orientations were collected on a spot by spot basis. If a roadway
segment was oriented predominantly north/south but a sample was collected on an east/west
portion, then the portion was collected as east/west with a note that the overall segment is
north/south. For segments that were aligned diagonally, the general orientation of that highway as
a whole was looked at or judgment was used to determine which orientation to mark.
4.2.3 Pavement Type and Shoulder Pavement Type
Asphalt and concrete pavement types were collected for this project. No bituminous seal coat or
other types of pavements were collected.
4.2.4 Unpaved Shoulder Type
The unpaved portion of the shoulder was considered to be gravel, earth, or mixed. Gravel
shoulders, shown in Figure 4.1 were those that still clearly had some gravel cover. Earth

25
shoulders, shown in Figure 4.2, were either dirt shoulders or grass shoulders. Finally, mixed
shoulders (Figure 4.3) were shoulders with some gravel cover but also some grass growing
through or a significant amount of dirt showing. The mixed category was only used when neither
of the other categories seemed to apply.
Figure 4.1. Typical gravel unpaved shoulder type
Figure 4.2. Typical earth unpaved shoulder type

26
Figure 4.3. Typical mixed unpaved shoulder type
4.2.5 Shoulder Type
A roadway segment was marked as having a fully paved shoulder if the paved shoulder width
was approximately 6 ft or greater, as shown in Figure 4.4. Any road with between 1 and 6 ft of
paved shoulder was considered as having a partially paved shoulder. An example of a partially
paved shoulder is shown in Figure 4.5. Any amount of pavement less than 1 ft beyond the
painted edge line was considered unpaved, shown in Figure 4.6.
Figure 4.4. Two-lane highway with fully paved shoulders

27
Figure 4.5. Two-lane highway with partially paved shoulders
Figure 4.6. Two-lane highway with unpaved shoulders
28
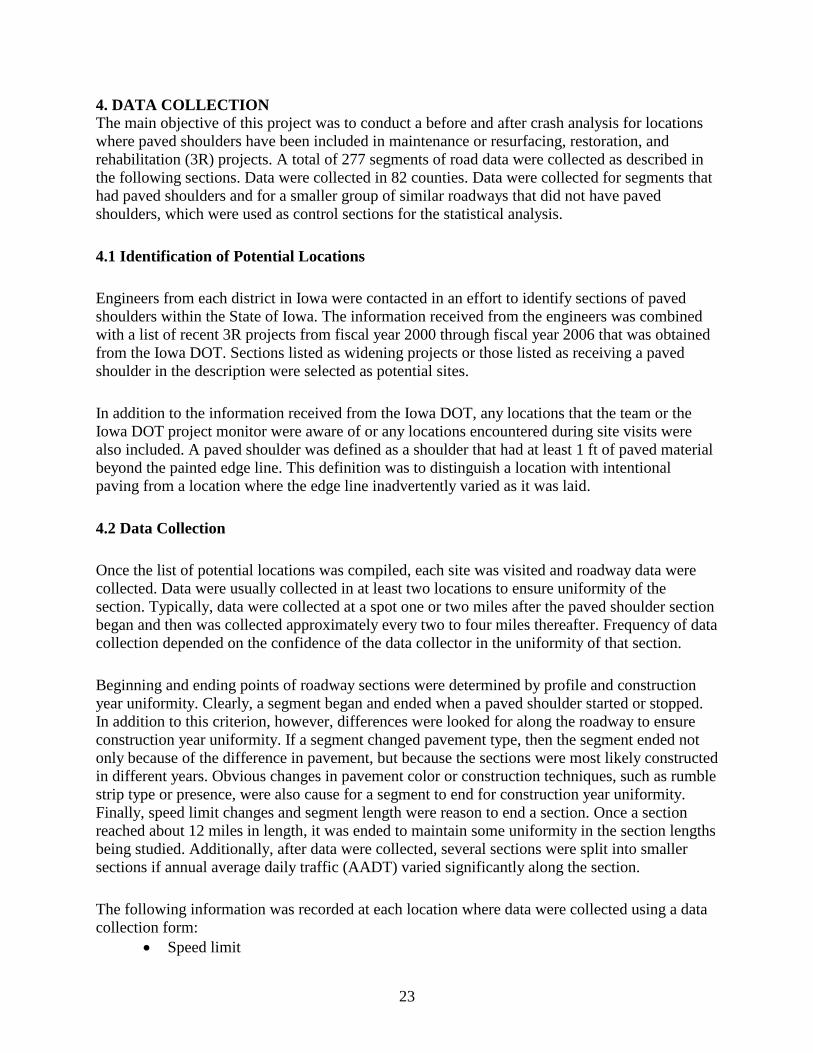
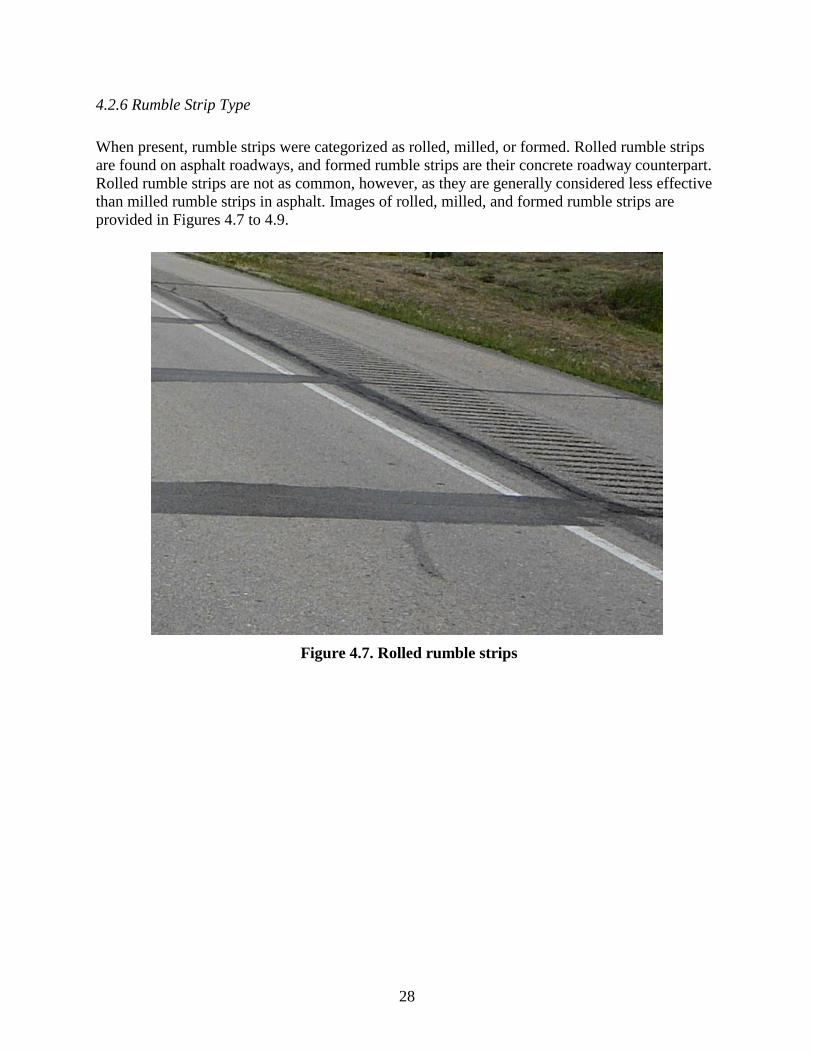
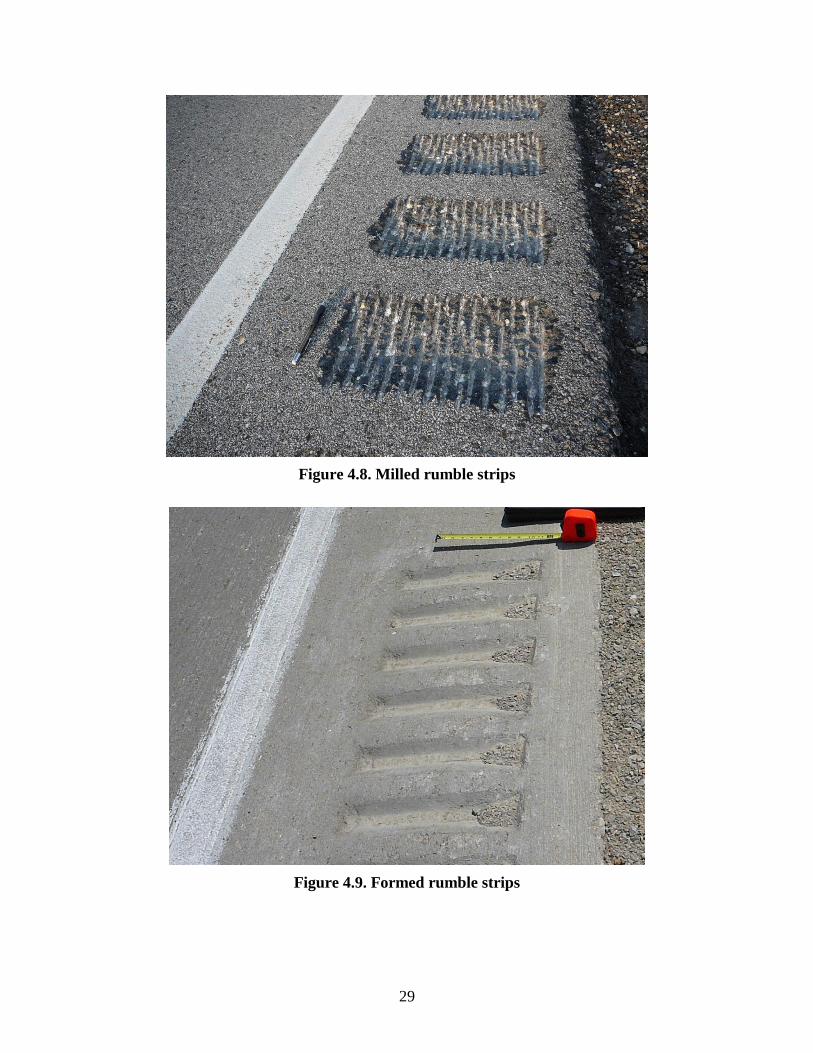
4.2.6 Rumble Strip Type
When present, rumble strips were categorized as rolled, milled, or formed. Rolled rumble strips
are found on asphalt roadways, and formed rumble strips are their concrete roadway counterpart.
Rolled rumble strips are not as common, however, as they are generally considered less effective
than milled rumble strips in asphalt. Images of rolled, milled, and formed rumble strips are
provided in Figures 4.7 to 4.9.
Figure 4.7. Rolled rumble strips
29
Figure 4.8. Milled rumble strips
Figure 4.9. Formed rumble strips
30
4.2.7 Rumble Strip Location
Rumble strips were recorded at the edge of the paved lane, at the edge of the paved shoulder, or
at some distance from the edge of the paved shoulder. Edge line rumble strips were recorded at
the edge of the paved lane.
4.2.8 Total Paved Width
Total paved width was measured from the edge of the pavement to the edge of the pavement,
regardless of the presence of paved shoulders. Paved shoulder width was also measured, and lane
width was determined by subtracting paved shoulder width from total width and dividing by two.
A measuring wheel or tape measure was used to make the measurements.
4.2.9 Paved Shoulder Width
The paved shoulder width was measured from the edge of the pavement to the outside edge of
the painted edge line. In the absence of a painted edge line, measurement was made from the
outside edge of the pavement to the transition of the shoulder pavement type to the mainline
pavement type. However, the absence of a painted edge line was rarely, if ever, an issue. This
measurement was made with a tape measure.
4.2.10 Unpaved Shoulder Width
The distance from the break in grade to the edge of the pavement was considered the unpaved
shoulder width. This measurement was also made with a tape measure. It is often difficult to
determine where the break in grade occurs, as it may have rounded off over the years due to
erosion. When this was the case, judgment was used to look up and down the highway to
determine the best possible point to declare as the break in grade. This was potentially the source
of the variation in unpaved shoulder width experienced on some roadway segments.
4.2.11 Presence of Driveway Entrances or Widening on Curves
It was noted as a yes or no if any paved driveway entrances were present along the segment of
roadway. It was also noted as a yes or no if any curves along the section of road experienced any
widening. Some roadways have an additional 1 or 2 ft of paved shoulder on the inside and/or
outside edge of curves. This is done to help keep cars on the pavement and to prevent edge
rutting that commonly occurs on curves.
4.2.12 Anything Unusual about Roadway
Any other types of random widenings or noteworthy unusual characteristics of the roadway were
described under this category. The most common entries here were the presence of single or

31
multiple bridges and the presence and location of left- and/or right-turn lanes. Other things noted
include, but are not limited to, the following: interchanges, guard rails if they were present for a
significant length of time, unusually steep or shallow grades beyond the shoulder, whether the
highway was access controlled, school zones, whether housing was present along part of the
road, temporary pavement changes, temporary shoulder width changes, unusual signs that would
affect driving habits, and anything else that could affect how people drive or the amount of
shoulder-related crashes that occur.
4.3 Determination of Construction Year
Data for each section were entered into an Excel spreadsheet. The corresponding road segments
were selected in the Iowa DOT GIMS database. GIMS segments corresponding to each collected
section were coded with a unique ID (―Paved ID‖) using ArcView. Each section was double-
checked against a map to ensure that they were located in the correct location in GIMS, and the
database was updated as needed.
4.3.1 Fiscal Year of Construction
After the data were refined and accurately reflected their original collection location, the fiscal
year in which paved shoulders were added during construction was determined. This step was
essential for before and after analysis. It was not possible to locate specific calendar dates of
construction; however, the fiscal year of construction was noted. Most construction in Iowa takes
place during the summer months. This allows for sufficient time on either side of the probable
construction time frame to ensure the construction period did not start before or continue past the
officially listed fiscal year in which the road was constructed.
The fiscal years of construction were obtained from two main sources: the 3R files obtained from
the Iowa DOT and the 2004 Test Sections by Milepost book, also obtained from the Highway
Division of the Iowa DOT. The 3R files consist of Microsoft Excel workbooks that contain six
worksheets of data, one worksheet per district in Iowa. The worksheets list projects associated
with that file, organized by county and by route number, that were constructed during the year, as
well as projects that were scheduled for future years. The lists contain literal descriptions of
project limits, project costs, whether or not the project was let that year, and a description of the
work done. These files were the first choice for determining fiscal year of construction, but when
segments were not found in these files, the 2004 Test Sections by Milepost book was checked.
The 2004 Test Sections by Milepost book contains a list of every project constructed on a state
route since the routes’ initial construction. The book is sorted by county, and projects are listed
from milepost to milepost, with a map of each county showing the mileposts mentioned in the
project listings. Next to the milepost boundaries are the directions of the roads for four-lane
divided highways, the year of construction, the project number, and information about the
pavement used for the project. This source was very effective for determining construction years
on older projects, as well as any other project on a state route that was overlooked or not included
in the 3R files.
32
Finally, the third source of information was county engineers. If a paved shoulder was collected
on a non-state route, then county engineers were contacted via email. The county engineers were
quick to respond with the information requested.
4.3.2 Length
The length of each segment was obtained from the segments selected in the GIS database. The
GIS lengths are stored in meters and converted to miles.
4.4 Data Preparation
A total of 256 treatment and control segments were collected. Data for each location were
entered into a database and spatially located using the Iowa DOT’s GIMS database.
Several locations were dropped from the analysis because they could not be located in the GIMS
database or because the year paved shoulders were added could not be determined. Several
locations had paved shoulders that were installed before the study period began in 1984. These
sites were removed from the analysis because there was no before and after period. This resulted
in a total of 220 sites analyzed, including 77 control sections and 143 test sections.
The location of sections collected is shown graphically in Figure 4.10. This map includes both
paved shoulder sections and control sections.
Initially a month was the time interval modeled. This unit allows the effect of time of year to be
included, because it is expected that some seasonal pattern may be evident in lane departure
crashes. Dr. Michael Pawlovitch of the Iowa DOT created code to extract crash and volume data
by month, starting in January 1984 and ending in December 2007. Total crashes, cross centerline
crashes, and single vehicle ROR crashes were extracted from the Iowa DOT crash database for
each segment by month. Crashes that corresponded to each section were selected using a manual
process in a GIS, ArcView. AADT was selected for each section for each year. When AADT
varied along a section, a weighted average was calculated. Monthly volume was determined by
multiplying AADT by the number of days for that month. AADT was obtained from archived
snapshots of the Iowa DOT’s GIMS database.
After an initial analysis was conducted, it was determined that use of months resulted in a large
number of observations with zero crashes. Data were combined into quarters. Volume data were
also aggregated by quarter. Data were aggregated for months where weather in Iowa was the
most similar resulting in the following:
Winter: (Dec, Jan, Feb)
Spring (March, April, May)
Summer (June, July, August)
Fall (September, October, November)

Figure 4.10. Location of sections collected
33
34
5. ANALYSIS
Generalized linear models were used to investigate the relationship between crash reduction and
implementation of paved shoulders. The following provides a very general description of the
model results. The models addressed overdispersion when present and excess zeroes.
A total of 224 sites were modeled with 147 sites receiving paved shoulders (test sites) and the
remaining 77 sites were control sites where no shoulders were added at any point prior to 2007. It
was discovered after conducting the model that one of the control sections had paved shoulders
and it was removed from the sample since a construction date was not available. The dataset
included 21,310 observations (rows). Correlations between observations from the same section
were accounted for in the model and the correlations depend on time.
Separate models were developed for cross-centerline (CL) crashes, run-off-road (ROR) crashes
which included all road departure crashes, and single vehicle run-off-road (SVROR) crashes
which included only road departures involving a single vehicle. For each model the
corresponding dependent variable was denoted as Yij which is the count of a specific type of
event for the ith
section and the jth
time point. Each section of road has chronologically recorded
number of crashes from 1984. There are correlations between records of the same section and the
correlation may be time dependent meaning that correlation can exist between Yij and Yi(j+1) for
the ith
section at two adjacent time points. So the value of Yij is used as a explanatory variable for
the model of Yi(j+1).
5.1 Response Variable
The response variable was quarterly crash frequency. Traffic volume in total vehicles over the
quarter (MT) was modeled as an offset. Segment length was modeled as an independent variable.
As indicated, separate models were developed for different crash types.
5.2 Explanatory Variables
Table 5.1 shows the explanatory variables. Several other explanatory variables were available but
were not included because they were highly correlated to other variables. For instance, median
type was highly correlated to number of lanes because most four-lane road sections were also
divided roadways.

35
Table 5.1. Explanatory variables for cross-centerline, ROR, and SVROR models
Variable Value Description
Polynomial of
Year-1984
(Year-1984)p,
p=1,2,…
A polynomial was used to explain the average
change over years
after_trt I{2}(Period) 0 for periods before installation of paved
shoulders
1 for periods after
Year_after_trt Years after treatment Year after treatment
0 for before period
0 for treatment year
(year of interest – treatment year) for years after
paved shoulders were installed (i.e. if shoulders
are paved in 2002 and 2004 is of interest, then
Year_after_trt = 2004 – 2002 = 2)
This variable allows different slope of annual
crash number trend before and after treatment. If
the coefficient of this variable is negative, the
averaged mean of crash number of treatment
sections is lower than the averaged mean of
sections without the treatment.
Indicator of seasons =I{s}(season), s=2,3,4 These three indicator variables are used for
estimating the mean differences between seasons
The value of I{2}(season)=1 if season=2 and the
value is zero otherwise.
1 for Winter (December, January, February)
2 for Spring (March, April, May(
3 for Summer (June, July, August)
4 for Fall (September, October, November)
Days = total days during
each season
Is_RS Indicates presence of
shoulder rumble strip
0 if no rumble strip is present
1 if rumble strip is present
SpdLimit Speed limit for
section
Tot_Rt_Shldr Total length of right
shoulder (paved plus
unpaved)
in feet
RT_Pvd_Width Total length of paved
shoulder on right
in feet, 0 if no paved shoulder
RT_Unpvd_Width Total length of
unpaved shoulder
in feet
Polynomial of
length = ,
p=1,2,…
length of each section
P is the order of the polynomial.
P=1, length is added as an explanatory variable.
36
P=2, length2 is also added as an explanatory
variable.
P=3, length3 is also added as an explanatory
variable.
Median Median type 0 for undivided
1 for divided
Is_4lane Indicates number of
lanes
0 for 2-lane sections
1 for 4-lane sections
Is_div4lane Indicator for 4-lane
divided
0 if number of lanes = 2
0 if number of lanes = 4 and median = 0
1 if number of lanes = 4 and median = 1
5.3 Model for Total Crashes
A model was developed for total crashes where Yijk is total crashes per site. The best fit model
was a zero inflated negative binomial model. The estimated variance and mean ratio was about
1.5. Estimated coefficients are shown in Table 5.2. As indicated, crashes are negatively
correlated with the amount of right shoulder provided, presence of median (i.e. divided versus
undivided), and amount of paved shoulder provided. The coefficient for ―treatment‖ was not
significant in the model and as a result, the effect of the treatment was not immediate. The
impact of incorporating paved shoulders is encapsulated in the predictors for ―after_trt_year‖ and
―Shd_Paved.‖ The variable ―after_trt_year‖ indicates a decreasing trend in crashes after paved
shoulders were installed.
The effect of a predictor can be estimated by the coefficients. For example, the effect of median
can be estimated by:
E(Y|median=1, xother) / E(Y|median=0, xothers) = exp(-0.342694) = 0.7
As indicated, the expected mean reduction in total crashes due to having a divided roadway
versus undivided roadway is 30%.
Similarly the impact for each foot of additional right shoulder is given by:
E(Y|Tot_RT_Shldr=2, xother) / E(Y| Tot_RT_Shldr=1, xothers) =
exp(-0.044698*2 + 0.044698*1) = 0.96
Indicating a reduction in the estimated mean number of crashes by 4%.

37
Table 5.2. Estimated coefficients for the total crash model
Parameter for
response model
DF Estimate Standard
Error
t value P(T > |t|) Notes
Intercept 1 5.093213 3.510558 1.45 0.1468
Tot_RT_Shldr 1 -0.044698 0.002885 -15.49 <.0001
Median 1 -0.342694 0.039458 -8.69 <.0001
SpdLimit 1 -0.012490 0.003911 -3.19 0.0014
Shd_Paved 1 -0.087671 0.027485 -3.19 0.0014
after_trt_year 1 -0.010426 0.003180 -3.28 0.0010
season1 1 -0.179793 0.037211 -4.83 <.0001
season2 1 -0.235078 0.044686 -5.26 <.0001
season3 1 -0.247293 0.044636 -5.54 <.0001
Year-1984 1 -0.004523 0.001395 -3.24 0.0012
pre_CRASH_SITE 1 0.043465 0.003497 12.43 <.0001 This is the count of
crashes in the
previous period of
time.
LENGTH 1 0.257575 0.009817 26.24 <.0001
LENGTH2
1 -0.008745 0.000598 -14.62 <.0001
DAYS 1 -0.184256 0.038480 -4.79 <.0001
Parameter for zero model
Intercept 1 -2.218691 0.133599 -16.61 <.0001
pre_CRASH_SITE 1 -1.205221 0.297076 -4.06 <.0001
Parameter for over-dispersion
(variance=+)
1 0.487258 0.015759 30.92 <.0001 This means the
variance is about
1.5 times the mean.
The predictor ―after_trt_year‖ = max(0, year – trt_year)*I(in treatment group) has positive values
only in the treatment groups. The ―after_trt_year‖ explains the change of in estimated mean
crashes after the treatment is applied. The coefficient of ―after_trt_year‖( -0.010426) explains the
reduced trend after treatment. The effect of the covariate ―after_trt_year‖ depends on time.
The coefficient ―Shd_Paved‖ is the change in crashes due to each additional foot of paved
shoulder added. The total total impact of paved shoulders is the effect of each additional foot of
paved shoulder explained by the covariate ―Shd_Paved‖ plus the decreasing trend over time as
explained by the covariate ―after_trt_year.‖ This can by illustrated by assuming a treatment year
and year for evaluation. We will use a treatment year of 1995 and assume 1 foot of paved
shoulder.
For no treatment, the estimated change in crashes for each year is given by:
exp(-0.00452 * (Year – 1984))
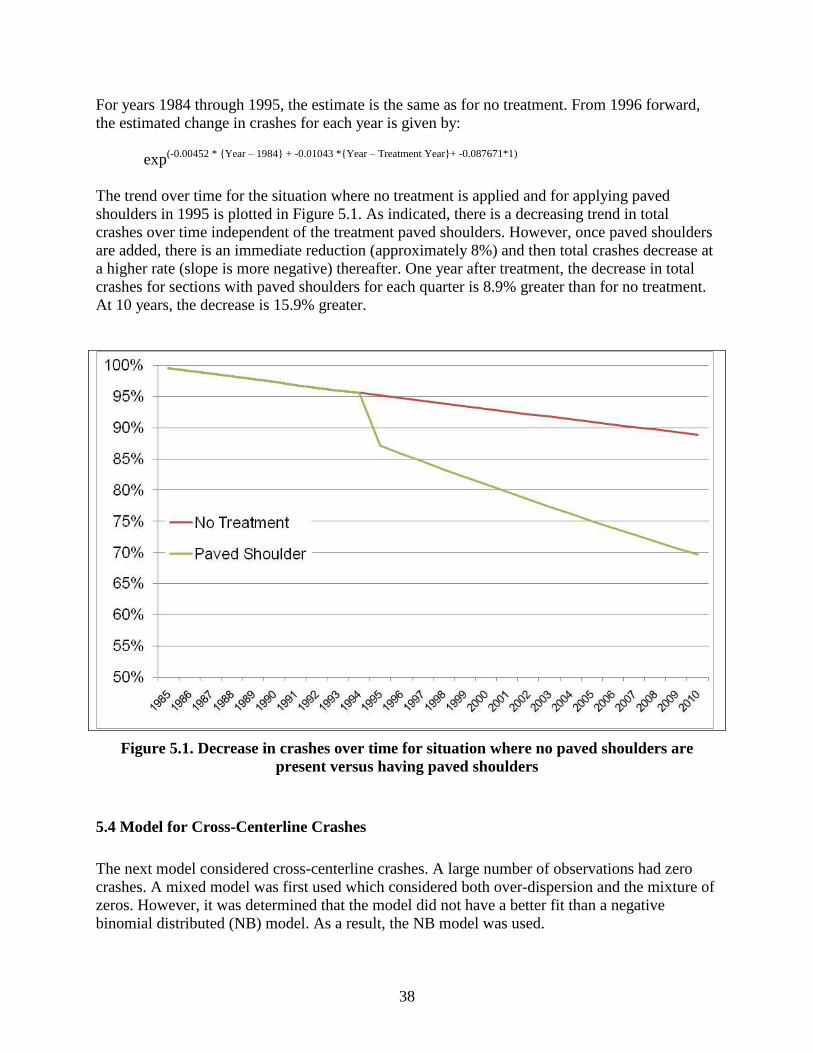
38
For years 1984 through 1995, the estimate is the same as for no treatment. From 1996 forward,
the estimated change in crashes for each year is given by:
exp(-0.00452 * {Year – 1984} + -0.01043 *{Year – Treatment Year}+ -0.087671*1)
The trend over time for the situation where no treatment is applied and for applying paved
shoulders in 1995 is plotted in Figure 5.1. As indicated, there is a decreasing trend in total
crashes over time independent of the treatment paved shoulders. However, once paved shoulders
are added, there is an immediate reduction (approximately 8%) and then total crashes decrease at
a higher rate (slope is more negative) thereafter. One year after treatment, the decrease in total
crashes for sections with paved shoulders for each quarter is 8.9% greater than for no treatment.
At 10 years, the decrease is 15.9% greater.
Figure 5.1. Decrease in crashes over time for situation where no paved shoulders are
present versus having paved shoulders
5.4 Model for Cross-Centerline Crashes
The next model considered cross-centerline crashes. A large number of observations had zero
crashes. A mixed model was first used which considered both over-dispersion and the mixture of
zeros. However, it was determined that the model did not have a better fit than a negative
binomial distributed (NB) model. As a result, the NB model was used.
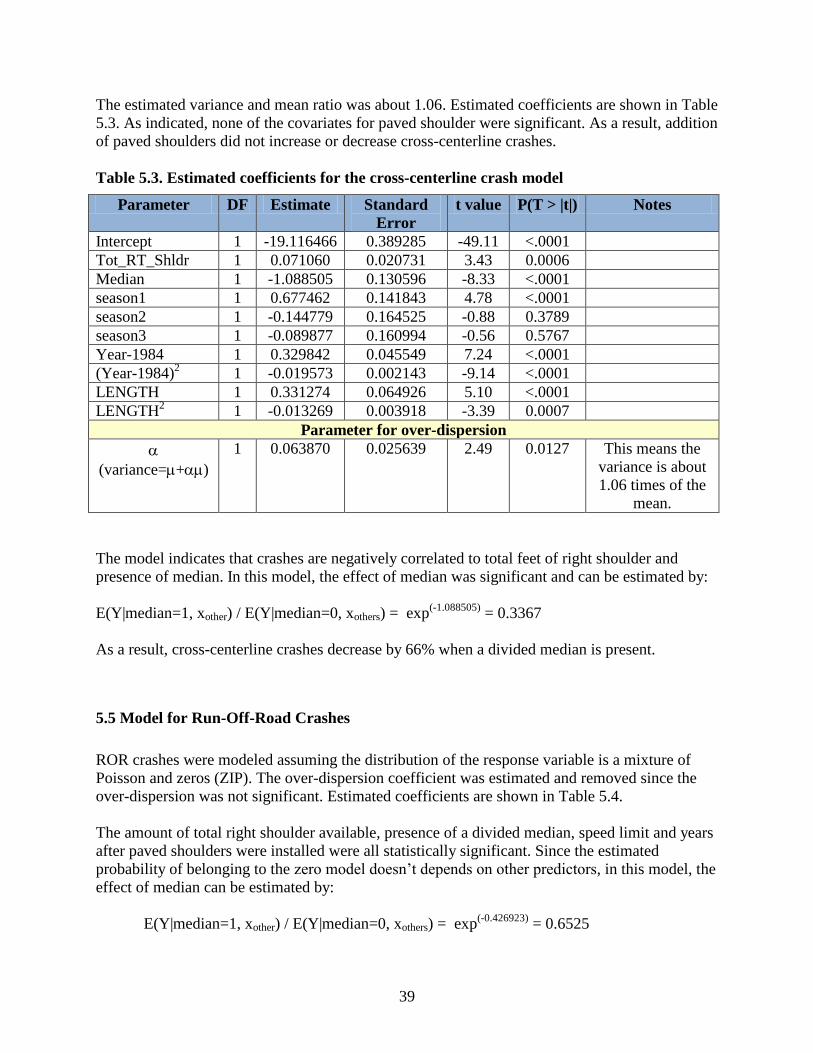
39
The estimated variance and mean ratio was about 1.06. Estimated coefficients are shown in Table
5.3. As indicated, none of the covariates for paved shoulder were significant. As a result, addition
of paved shoulders did not increase or decrease cross-centerline crashes.
Table 5.3. Estimated coefficients for the cross-centerline crash model
Parameter DF Estimate Standard
Error
t value P(T > |t|) Notes
Intercept 1 -19.116466 0.389285 -49.11 <.0001
Tot_RT_Shldr 1 0.071060 0.020731 3.43 0.0006
Median 1 -1.088505 0.130596 -8.33 <.0001
season1 1 0.677462 0.141843 4.78 <.0001
season2 1 -0.144779 0.164525 -0.88 0.3789
season3 1 -0.089877 0.160994 -0.56 0.5767
Year-1984 1 0.329842 0.045549 7.24 <.0001
(Year-1984)2
1 -0.019573 0.002143 -9.14 <.0001
LENGTH 1 0.331274 0.064926 5.10 <.0001
LENGTH2
1 -0.013269 0.003918 -3.39 0.0007
Parameter for over-dispersion
(variance=+)
1 0.063870 0.025639 2.49 0.0127 This means the
variance is about
1.06 times of the
mean.
The model indicates that crashes are negatively correlated to total feet of right shoulder and
presence of median. In this model, the effect of median was significant and can be estimated by:
E(Y|median=1, xother) / E(Y|median=0, xothers) = exp(-1.088505)
= 0.3367
As a result, cross-centerline crashes decrease by 66% when a divided median is present.
5.5 Model for Run-Off-Road Crashes
ROR crashes were modeled assuming the distribution of the response variable is a mixture of
Poisson and zeros (ZIP). The over-dispersion coefficient was estimated and removed since the
over-dispersion was not significant. Estimated coefficients are shown in Table 5.4.
The amount of total right shoulder available, presence of a divided median, speed limit and years
after paved shoulders were installed were all statistically significant. Since the estimated
probability of belonging to the zero model doesn’t depends on other predictors, in this model, the
effect of median can be estimated by:
E(Y|median=1, xother) / E(Y|median=0, xothers) = exp(-0.426923)
= 0.6525

40
Table 5.4. Estimated coefficients for the ROR crash model
Parameter DF Estimate Standard
Error
t value P(T > |t|)
Intercept 1 0.308047 5.124980 0.06 0.9521
Tot_RT_Shldr 1 -0.081668 0.004896 -16.68 <.0001
Median 1 -0.426923 0.061095 -6.99 <.0001
SpdLimit 1 0.012535 0.006136 2.04 0.0411
after_trt_year 1 -0.011187 0.003656 -3.06 0.0022
Year-1984 1 0.011595 0.002171 5.34 <.0001
season1 1 0.284322 0.056658 5.02 <.0001
season2 1 -0.049749 0.068178 -0.73 0.4656
season3 1 -0.055001 0.068095 -0.81 0.4193
pre_ROR_SITE
1 0.071761 0.012818 5.60 <.0001 The value of
ROR_Site at
previous time point
LENGTH 1 0.257049 0.015606 16.47 <.0001
LENGTH2
1 -0.008725 0.000938 -9.30 <.0001
DAYS 1 -0.163023 0.056132 -2.90 0.0037
Parameter for zero model
Intercept 1 -1.070874 0.074979 -14.28 <.0001 Indicates that there
is about 0.25
probability that the
record came from
the model with
P(0)=1.
As a result, around 35% fewer crashes are expected to result with a divided median versus having
no divided median. It should be noted that presence of a median or not is correlated to number of
lanes which was not included in the model.
The predictor ―after_trt_year‖ = max(0, year – trt_year)*I(in treatment group) has a positive
values only in the treatment groups. The ―after_trt_year‖ explains the change of in estimated
mean crashes after the treatment is applied. The coefficient of ―after_trt_year‖( -0.011187)
explains the reduced trend after treatment.
If a treatment year of 1995 is assumed, a plot showing the different is generated using the
following:
For no treatment, the estimated change in crashes for each year is given by:
exp(0.011595* (Year – 1984))
For years 1984 through 1995, the estimate is the same as for no treatment. From 1996 forward,
the estimated change in crashes for each year is given by:
exp(0.011595 * {Year – 1984} + -0.01119 *{Year – Treatment Year})

41
The change in crashes over time is shown in Figure 5.2. As indicated, ROR crashes per quarter
are increasing over time independent of the treatment of paved shoulders. However, once paved
shoulders are added, the average number of ROR crashes decreases at a low rate while sites
where no treatment is present continue to increase over time. One year after treatment, the
increase in ROR crashes is 1.3% less than for no treatment. At 10 years, sites with paved
shoulders have 13.5% fewer ROR crashes than control sites.
Figure 5.2. Change in ROR crashes over time for situation where no paved shoulders are
present versus having paved shoulders
5.6 Model for Single Vehicle Run-Off-Road Crashes
SVROR crashes were modeled assuming the distribution of the response variable is a mixture of
Poisson and zeros (ZIP). The over-dispersion coefficient was estimated and removed since the
over-dispersion is not significant. Estimated coefficients are shown in Table 5.5.
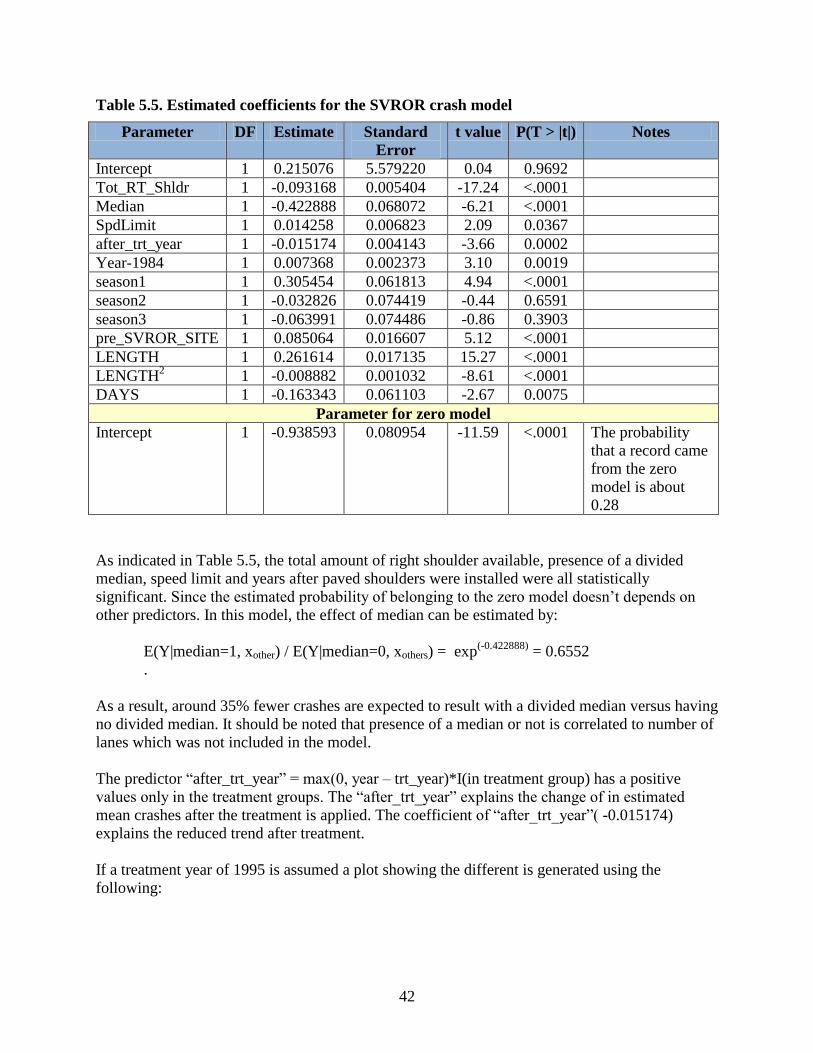
42
Table 5.5. Estimated coefficients for the SVROR crash model
Parameter DF Estimate Standard
Error
t value P(T > |t|) Notes
Intercept 1 0.215076 5.579220 0.04 0.9692
Tot_RT_Shldr 1 -0.093168 0.005404 -17.24 <.0001
Median 1 -0.422888 0.068072 -6.21 <.0001
SpdLimit 1 0.014258 0.006823 2.09 0.0367
after_trt_year 1 -0.015174 0.004143 -3.66 0.0002
Year-1984 1 0.007368 0.002373 3.10 0.0019
season1 1 0.305454 0.061813 4.94 <.0001
season2 1 -0.032826 0.074419 -0.44 0.6591
season3 1 -0.063991 0.074486 -0.86 0.3903
pre_SVROR_SITE 1 0.085064 0.016607 5.12 <.0001
LENGTH 1 0.261614 0.017135 15.27 <.0001
LENGTH2
1 -0.008882 0.001032 -8.61 <.0001
DAYS 1 -0.163343 0.061103 -2.67 0.0075
Parameter for zero model
Intercept 1 -0.938593 0.080954 -11.59 <.0001 The probability
that a record came
from the zero
model is about
0.28
As indicated in Table 5.5, the total amount of right shoulder available, presence of a divided
median, speed limit and years after paved shoulders were installed were all statistically
significant. Since the estimated probability of belonging to the zero model doesn’t depends on
other predictors. In this model, the effect of median can be estimated by:
E(Y|median=1, xother) / E(Y|median=0, xothers) = exp(-0.422888)
= 0.6552
.
As a result, around 35% fewer crashes are expected to result with a divided median versus having
no divided median. It should be noted that presence of a median or not is correlated to number of
lanes which was not included in the model.
The predictor ―after_trt_year‖ = max(0, year – trt_year)*I(in treatment group) has a positive
values only in the treatment groups. The ―after_trt_year‖ explains the change of in estimated
mean crashes after the treatment is applied. The coefficient of ―after_trt_year‖( -0.015174)
explains the reduced trend after treatment.
If a treatment year of 1995 is assumed a plot showing the different is generated using the
following:
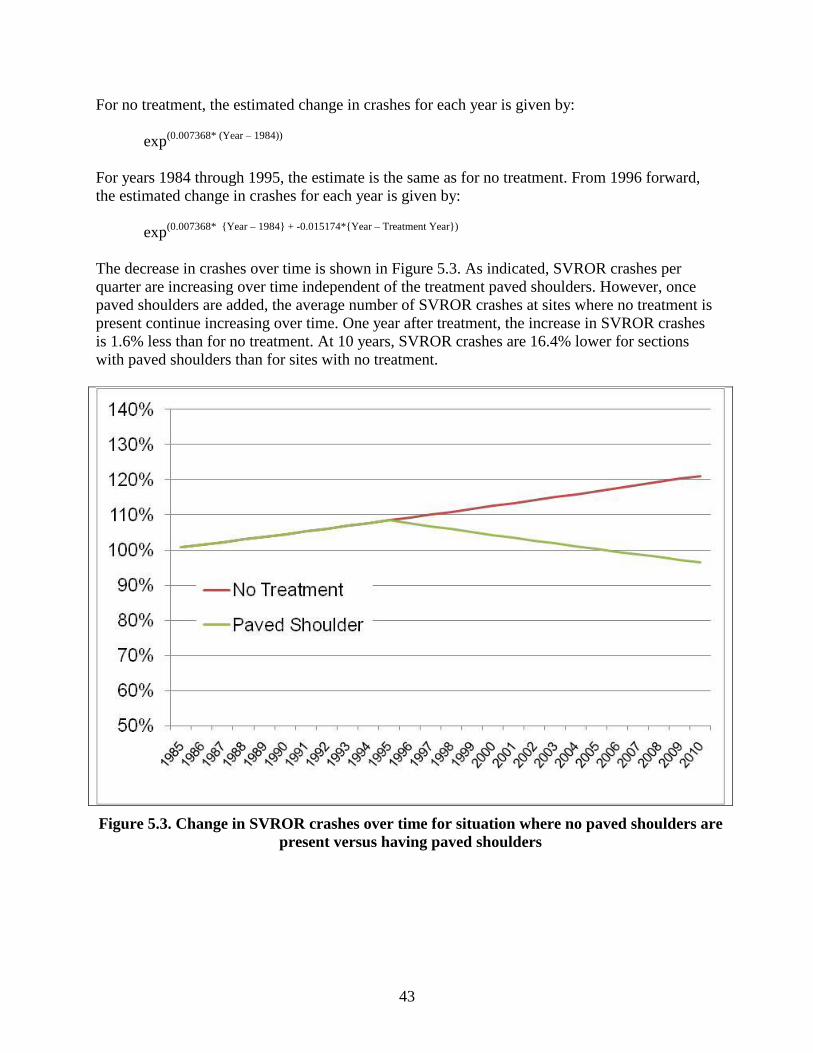
43
For no treatment, the estimated change in crashes for each year is given by:
exp(0.007368* (Year – 1984))
For years 1984 through 1995, the estimate is the same as for no treatment. From 1996 forward,
the estimated change in crashes for each year is given by:
exp(0.007368* {Year – 1984} + -0.015174*{Year – Treatment Year})
The decrease in crashes over time is shown in Figure 5.3. As indicated, SVROR crashes per
quarter are increasing over time independent of the treatment paved shoulders. However, once
paved shoulders are added, the average number of SVROR crashes at sites where no treatment is
present continue increasing over time. One year after treatment, the increase in SVROR crashes
is 1.6% less than for no treatment. At 10 years, SVROR crashes are 16.4% lower for sections
with paved shoulders than for sites with no treatment.
Figure 5.3. Change in SVROR crashes over time for situation where no paved shoulders are
present versus having paved shoulders
44
6. SUMMARY
In 2004, Iowa adopted a paved shoulder policy for higher volume roads, but a broad diversity of
paved shoulder types have been utilized for many years in the state. Because the benefits of
paved shoulders have not been quantified, the Iowa DOT requested a study to analyze the safety
performance of various paved shoulder designs on a wide spectrum of traffic and roadway types.
The research described in this report evaluated the effectiveness of paved shoulders. As part of
the research, two surveys were conducted that assessed the opinions of field maintenance
personnel and law enforcement personnel about the effectiveness of paved shoulders. Most
maintenance personnel felt that paved shoulders led to reduced maintenance costs. Most officers
felt that the shoulders reduced ROR crashes and improved safety for officers when they have to
pull over for traffic stops.
This study also included a crash analysis for non-Interstate roadways in Iowa where paved
shoulders have been installed. The team made site visits and collected roadway data for 256
roadway sections in Iowa. The majority was locations where paved shoulders had been installed,
but a number of control sections were collected as well. Each test segment was reviewed, and the
construction year for implementation of paved shoulders was determined. In some cases, the
roadway segment could not be located in the GIMS database, and in other cases the construction
year could not be determined. These sections were removed from further analysis. This resulted
in a total of 220 sites analyzed, including77 control sections and 143 test sections. Sections
included both two- and four-lane roadways. Four-lane roadways were both divided and
undivided.
Generalized linear models were used to investigate the relationship between crash reduction and
implementation of paved shoulders. The response variable was quarterly crash frequency. Traffic
volume was modeled as offsets. Separate models were developed for total crashes, cross-
centerline (CL) crashes, run-off-road (ROR) crashes which included all road departure crashes,
and single vehicle run-off-road (SVROR) crashes which included only road departures involving
a single vehicle. The model for each independent variable considered over-dispersion and excess
zeroes.
The best fit model for total crashes per quarter was a zero inflated negative binomial model.
Model results indicated that the total amount of right shoulder, presence of a median, speed limit,
addition of a paved shoulder and years after addition of a paved shoulder were statistically
significant. The effect of paved shoulder varied over time depending on the years after treatment.
Since the effect of paved shoulder varies over time, one year after treatment, the decrease in total
crashes for sections with paved shoulders for each quarter is 8.9% greater than for no treatment.
At 10 years, the decrease is 15.9% greater.
A negative binominal model was the best fit model for cross-centerline crashes. The model
indicates that crashes are negatively correlated to total feet of right shoulder and presence of
median. The model indicated that the covariates used to model the effect of paved shoulders was
not statistically significant. As a result, addition of paved shoulders had no impact on cross-

45
centerline crashes.
ROR crashes were modeled assuming the distribution of the response variable is a mixture of
Poisson and zeros (ZIP). The amount of total right shoulder available, presence of a divided
median, speed limit and years after paved shoulders were installed were all statistically
significant. The effect of paved shoulder on run-off-road crashes by quarter varied over time
depending on the years after treatment. One year after treatment, the 1.3% fewer crashes are
expected for sections with paved shoulder than for control sections. At 10 years, sites with paved
shoulders have 13.5% fewer ROR crashes than control sites.
Single vehicle run-off-road crashes were modeled assuming the distribution of the response
variable is a mixture of Poisson and zeros. The total amount of right shoulder available, presence
of a divided median, speed limit and years after paved shoulders were installed were all
statistically significant. The effect of paved shoulder on single vehicle run-off-road crashes by
quarter varied over time depending on the years after treatment. One year after treatment, the
SVROR crashes are 1.6% less than for no treatment. At 10 years, SVROR crashes are 16.4%
lower for sections with paved shoulders than for sites with no treatment.
46
7. REFERENCES
Abboud, N.K., Evaluation of Two- and Four-Foot Shoulders on Two-Lane State Routes. ITE
Journal, Institute of Transportation Engineers, June 2001.
American Association of State Highway and Transportation Officials. Guide for the Development
of Bicycle Facilities. AASHTO, Washington, D.C., 1999.
Benekohal, R.F., K.T. Hall, and H.W. Miller. Effect of Lane Widening on Lateral Distribution of
Truck Wheels. In Transportation Research Record 1286, TRB, National Research
Council, Washington, D.C., 1990.
Cost and Safety Effectiveness of Design Elements. In National Cooperative Highway Research
Program, Report 197, TRB, National Research Council, Washington, D.C., 1978.
Design Manual. Iowa Department of Transportation: Highway Division – Office of Design,
Ames, IA, June 2004.
Finley, M.D., J.D. Miles, and P.J. Carlson. An Assessment of Various Rumble Strip Designs and
Pavement Marking Applications for Crosswalks and Work Zones. FHWA/TX-06/0-4728-
2 Report, Texas Transportation Institute, The Texas A&M University System, College
Station, Texas, 2005.
Garber, Nicholas J., and Lester A. Hoel. 2002. Traffic and highway engineering. Pacific Grove,
CA: Brooks/Cole Pub. Co.
Harkey, D.L., and J.R. Stewart. Bicycle and Motor Vehicles Operations on Wide Curb Lanes,
Bicycle Lanes, and Paved Shoulders. Proceedings of the conference on Traffic
Congestion and Traffic Safety in the 21st Century: Challenges, Innovations, and
Opportunities, ASCE, Chicago, IL, 1997, pp. 139-145.
Heimbach, C.L., W.W. Hunter, and G.C. Chao. Paved Highway Shoulders and Accident
Experience. Journal of the Transportation Engineering Division, Vol. 100, No. 4,
November 1974, pp. 889-907.
Hickey, J.J. Shoulder Rumble Strip Effectiveness: Drift-Off-Road Accident Reductions on the
Pennsylvania Turnpike. In Transportation Research Record 1573, TRB, National
Research Council, Washington, D.C., 1997, pp. 105-109.
Iowa. 2006-2007 Iowa driver's manual. [Des Moines: Iowa Dept. of Transportation].
Mak, K.K., D.L. Sicking, and H.E. Ross, Jr. Real-World Impact Conditions for Run-Off-The-
Road Accidents. In Transportation Research Record 1065, TRB, National Research
Council, Washington, D.C., 1986, pp. 45-55.
Miles, J.D., P.J. Carlson, M.P. Pratt, and T.D. Thompson. Traffic Operational Impacts of
Transverse, Centerline, and Edge line Rumble Strips. FHWA/TX-05/0-4472-2 Report,
Texas Transportation Institute, The Texas A&M University System, College Station,
Texas, 2005.
Moeur, R.C. Analysis of Gap Patterns in Longitudinal Rumble Strips to Accommodate Bicycle
Travel. In Transportation Research Record 1705, TRB, National Research Council,
Washington, D.C., 2000, pp. 93-98.
Morena, D. A. Rumbling Toward Safety. Public Roads, September/October, 2003.
Neuman, T.R., R. Pfefer, K.L. Slack, K.K. Hardy, F. Council, H. McGee, L. Prothe, and K.
Eccles. NCHRP Report 500, Vol. 6: A Guide for Addressing Run-Off-Road Collisions.
Transportation Research Board of the National Academies, Washington, D.C. 2003.
Perrillo, K. The Effectiveness and Use of Continuous Shoulder Rumble Strips. Federal Highway
Administration, Albany, New York, 1998.

47
Souleyrette, Reg. Paved Shoulders on Primary Highways in Iowa: An Analysis of Shoulder
Surfacing Criteria, Costs, and Benefits. Ames, Iowa: Center for Transportation Research
and Education, Iowa State University, 2001.
The Bicycle Compatibility Index: A Level of Service Concept, Implementation Manual.
Publication FHWA-RD-95-095. FHWA, US Department of Transportation, 1999.
United States. 2007. Highway statistics 2005. Washington, D.C.: U.S. Dept. of Commerce,
National Technical Information Service.
Watts, G.R. The Development of Rumble Areas as a Driver-alerting Device. Supplementary
Report 291, Transportation and Road Research Laboratory, 1977.
Zegeer, C.H., R.C. Deen, and J.G. Mayes. Effect of Lane and Shoulder Widths on Accident
Reduction on Rural Two-Lane Roads. In Transportation Research Record 806, TRB,
National Research Council, Washington, D.C., 1981, pp. 33-43.

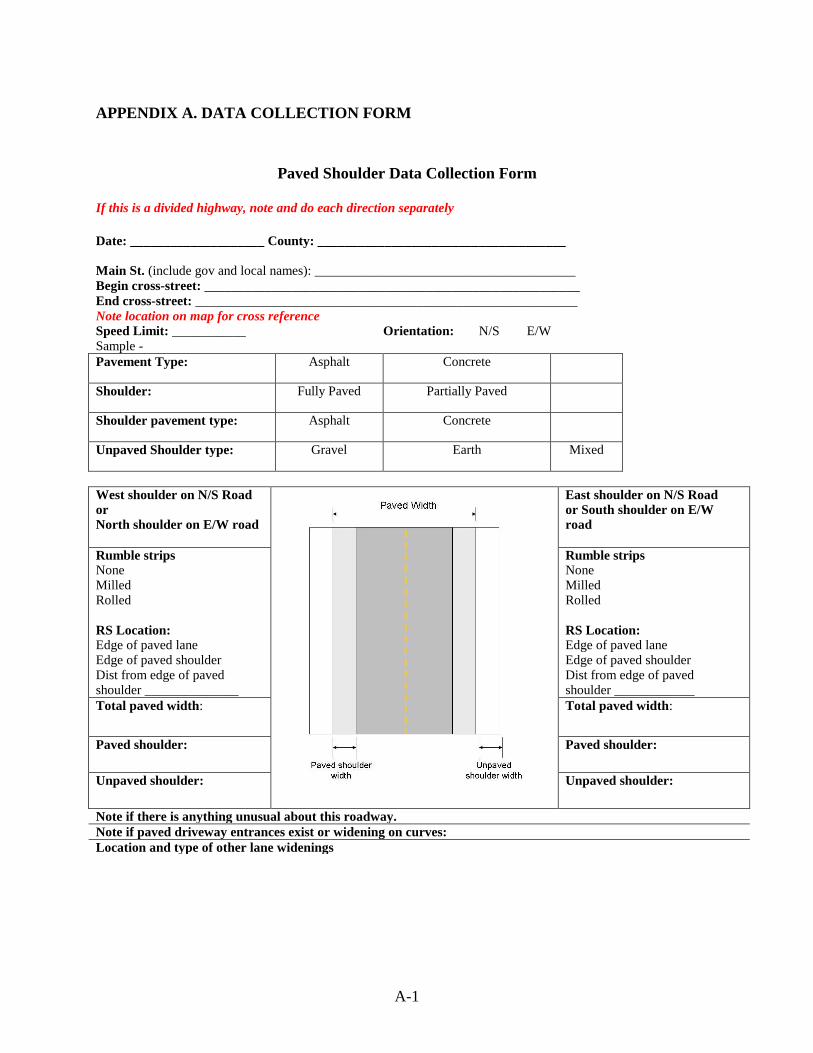
A-1
APPENDIX A. DATA COLLECTION FORM
Paved Shoulder Data Collection Form
If this is a divided highway, note and do each direction separately
Date: ____________________ County: _____________________________________
Main St. (include gov and local names): _______________________________________
Begin cross-street: ________________________________________________________
End cross-street: _________________________________________________________
Note location on map for cross reference
Speed Limit: ___________ Orientation: N/S E/W Sample -
Pavement Type: Asphalt Concrete
Shoulder: Fully Paved Partially Paved
Shoulder pavement type: Asphalt Concrete
Unpaved Shoulder type: Gravel Earth Mixed
West shoulder on N/S Road
or
North shoulder on E/W road
East shoulder on N/S Road
or South shoulder on E/W
road
Rumble strips None Milled Rolled
RS Location: Edge of paved lane Edge of paved shoulder Dist from edge of paved shoulder ______________
Rumble strips None Milled Rolled
RS Location: Edge of paved lane Edge of paved shoulder Dist from edge of paved shoulder ____________
Total paved width:
Total paved width:
Paved shoulder:
Paved shoulder:
Unpaved shoulder:
Unpaved shoulder:
Note if there is anything unusual about this roadway.
Note if paved driveway entrances exist or widening on curves:
Location and type of other lane widenings
