safety and techno-economic analysis of ethylene
TRANSCRIPT
SAFETY AND TECHNO-ECONOMIC ANALYSIS OF ETHYLENE
TECHNOLOGIES
A Thesis
by
PREETHA THIRUVENKATASWAMY
Submitted to the Office of Graduate and Professional Studies of
Texas A&M University
in partial fulfillment of the requirements for the degree of
MASTER OF SCIENCE
Chair of Committee, Mahmoud El-Halwagi
Committee Members, M. Sam Mannan
Hisham Nasr-El-Din
Head of Department, M. Nazmul Karim
May 2015
Major Subject: Safety Engineering
Copyright 2015 Preetha Thiruvenkataswamy

ii
ABSTRACT
Inherent safety is a concept that enables risk reduction through elimination or
reduction of hazards at the grass root level of a process development cycle. This
proactive approach aids in achieving effective risk management while minimizing fixed
and operating cost. Several indices which quantify the measures of inherent safety have
been identified and by applying these techniques on conceptual design stage, an estimate
of the inherent risk and additional safety cost measures can be developed. This approach
facilitates easy decision making in an early stage, for choosing the best process that is
superior in process, economic and safety performance. Yet, these quantitative techniques
are not being used effectively in process industries. In this thesis, a comparative
approach was developed wherein, two different process technologies producing same
chemical were compared through techno-economic and safety analysis, to identify the
superior process.
Recent advancements in shale gas monetization have contributed to the growth
and expansion of large number of petrochemical plants, particularly the ethylene
industry. For this thesis, the production of ethylene through two process technologies
were considered, such that one route is the primary process route while other is a novel
process that is still in development stage. The process routes identified were ethane
steam cracking, a well-established process and “ECLAIRS” (Ethylene from
Concentrated Liquid phase Acetylene- Integrated, Rapid and Safe), an emerging Gas to
ethylene process. A top level analysis was performed using key quantitative indicators of

iii
process, cost and inherent safety. The results show that the state of art technology of
ethane cracking has an attractive process and economic potential, while the gas to
ethylene technology is more inherently safer. The areas of improvement were identified
and critical analysis of metrics was carried out.

iv
DEDICATION
To
My Parents

v
ACKNOWLEDGEMENTS
First of all, I would like to thank my committee chair, Dr. Mahmoud El-Halwagi
for providing continuous, positive support and guidance throughout the course of this
research. I would also like to thank my committee members and other department
faculty for sharing their knowledge and expertise in the field of chemical engineering. I
would also like express my gratitude to Dr. Fadwa El-Jack from Qatar University, for
providing valuable inputs on ethylene processes. I sincerely believe that this learning
experience has strengthened my fundamental understanding and helped me appreciate
new concepts in the field of process safety and chemical engineering.
I would like to acknowledge the assistance provided by Nitin Roy, P.V.K.
Srikanth, Sunder Janardhan and Narendra Kumar in the field of process safety, reaction
engineering, thermodynamics and Aspen simulation. I am also thankful to my seniors
Mohamed Noureldin, Kerron Gabriel and Kamrava Serveh for providing valuable
guidance throughout my course of research. I would specially like to thank my friend
Saurabh Maduskar, for providing positive support and inspiration to undertake this
course. Thanks also go to my friends, colleagues and the department staff for making my
time at Texas A&M University a great experience. Finally, thanks to my family for their
encouragement and support throughout my course of learning.
vi
TABLE OF CONTENTS
Page
ABSTRACT .......................................................................................................................ii
DEDICATION .................................................................................................................. iv
ACKNOWLEDGEMENTS ............................................................................................... v
TABLE OF CONTENTS .................................................................................................. vi
LIST OF FIGURES ........................................................................................................ viii
LIST OF TABLES ............................................................................................................. x
CHAPTER I INTRODUCTION ....................................................................................... 1
I.1. Bhopal Gas Tragedy, India (1984)........................................................................... 4 I.2. Flixborough, UK (1974) .......................................................................................... 6
CHAPTER II LITERATURE REVIEW ......................................................................... 14
II.1. Safety Metrics ....................................................................................................... 18 II.1.1. Dow Fire and Explosion Index ...................................................................... 18 II.1.2. Mond Index .................................................................................................... 20
II.1.3. Inherent Safety Index (ISI) ............................................................................ 21 II.1.4. Safety Weighted Hazard Index (SWeHI) ...................................................... 22
II.1.5. Hazard Identification and Ranking System (HIRA) ...................................... 24 II.2. Economic Metrics ................................................................................................. 30
II.3. Process Metrics ..................................................................................................... 31
CHAPTER III PROCESS ANALYSIS ........................................................................... 33
III.1. Ethane Cracking Technology .............................................................................. 33 III.1.1. Assumptions ................................................................................................. 43 III.1.2. Simulation Results ........................................................................................ 48
III.2. Pyrolysis of Methane ........................................................................................... 50 III.2.1. Assumptions ................................................................................................. 62
III.2.2. Simulation Results ........................................................................................ 64
CHAPTER IV ECONOMIC ANALYSIS ...................................................................... 68

vii
Page
IV.1. Ethane Cracking .................................................................................................. 68
IV.2. Pyrolysis of Methane .......................................................................................... 72
CHAPTER V SAFETY ANALYSIS .............................................................................. 79
V.1.General Assumptions ............................................................................................ 80 V.1.1 Units with Chemical Reactions and Physical Operations .............................. 81
V.2. Ethane Cracking ................................................................................................... 85 V.3. Pyrolysis of Methane ............................................................................................ 92
CHAPTER VI RESULTS AND DISCUSSION ............................................................. 99
VI.1. Process Metrics ................................................................................................... 99 VI.2. Economic Metrics ............................................................................................. 103
VI.3. Safety Metrics ................................................................................................... 105
CHAPTER VII CONCLUSION AND RECOMMENDATIONS ................................. 110
REFERENCES ............................................................................................................... 115
APPENDIX .................................................................................................................... 122
viii
LIST OF FIGURES
Page
Figure 1: Typical Layers of Protection in a chemical process ........................................... 8
Figure 2: Stages of Chemical Process Development ....................................................... 10
Figure 3: Approach methodology of techno-economic and safety analysis. ................... 13
Figure 4: Ethylene supply and demand change ................................................................ 16
Figure 5: Yield patterns of different steam cracking feed stocks ..................................... 17
Figure 6: Factors affecting Damage potential. ................................................................. 27
Figure 7: Block diagram of ethane steam cracking process using front end de-
methanizer scheme. ........................................................................................... 41
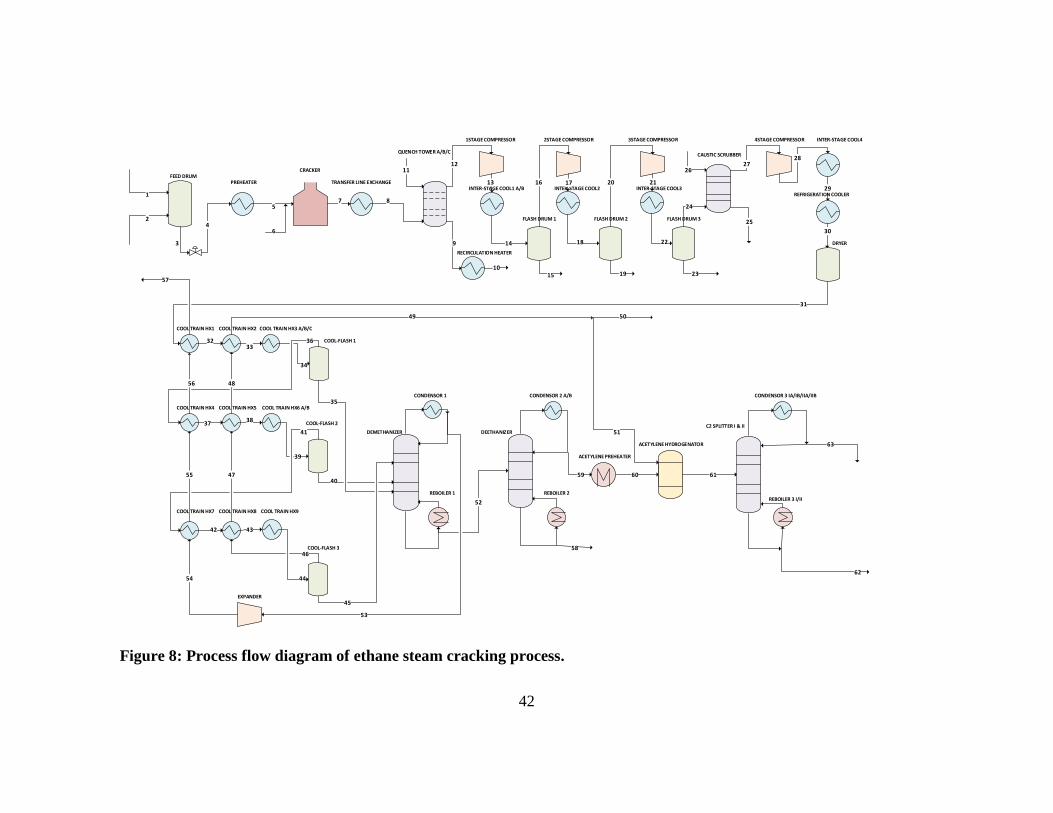
Figure 8: Process flow diagram of ethane steam cracking process. ................................. 42
Figure 9: Specific energy consumption of major sections- ethane cracking process. ...... 49
Figure 10: Major energy contributors- ethane cracking process. ..................................... 50
Figure 11: Block diagram of methane pyrolysis using partial oxidation method of heat
transfer. ............................................................................................................. 55
Figure 12: Process flow diagram of methane pyrolysis process. ..................................... 56
Figure 13: Scheme 1 and scheme 2 for solvent separation. ............................................. 57
Figure 14: Scheme 3 proposed for solvent separation. .................................................... 58
Figure 15: Specific energy consumption of major sections- methane pyrolysis. ............. 66
Figure 16: Major contributors to energy consumption- methane pyrolysis. .................... 67
Figure 17: Distribution of equipment under various ranges of damage radius- Ethane
Cracking. ........................................................................................................... 88
Figure 18: Semi-quantitative ranking based on HIRA method- Ethane Cracking. .......... 89
Figure 19: Section wise ranking of FEDI- Ethane Cracking. .......................................... 91
ix
Page
Figure 20: Overall block diagram of inherent safety levels- Ethane cracking. ................ 91
Figure 21: Distribution of equipment under various ranges of danage radius- Methane
pyrolysis. ........................................................................................................... 95
Figure 22: Semi-quantitative ranking based on HIRA method- Methane pyrolysis. ....... 95
Figure 23: Section wise ranking of FEDI- Methane Pyrolysis. ....................................... 96
Figure 24: Overall block diagram of inherent safety levels- Methane pyrolysis. ............ 98
Figure 25: Comparison of section-wise energy consumption. ....................................... 101
Figure 26: Comparison of utility consumption. ............................................................. 102
Figure 27: ASPEN Flowsheet- Ethane Cracking - Overall Process ............................... 123
Figure 28: ASPEN Flowsheet: Ethane Cracking- Compression Section ....................... 124
Figure 29: ASPEN Flowsheet- Ethane Cracking- Cooling train .................................... 125
Figure 30: ASPEN Flowsheet- Ethane Cracking- Separation Section ........................... 126
Figure 31: ASPEN Flowsheet- Gas to Ethylene - Pyrolysis and Compression Section 127
Figure 32: ASPEN Flowsheet - Gas to Ethylene- Solvent Separation and Product
Separation Section .......................................................................................... 128
x
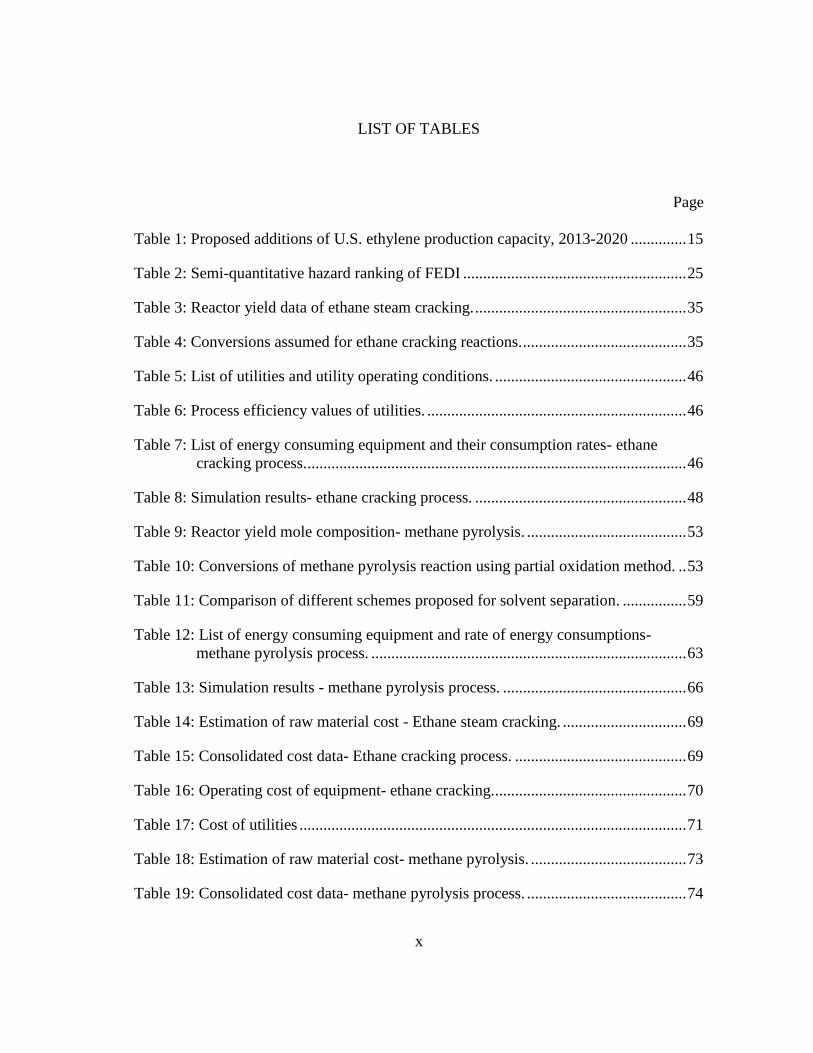
LIST OF TABLES
Page
Table 1: Proposed additions of U.S. ethylene production capacity, 2013-2020 .............. 15
Table 2: Semi-quantitative hazard ranking of FEDI ........................................................ 25
Table 3: Reactor yield data of ethane steam cracking. ..................................................... 35
Table 4: Conversions assumed for ethane cracking reactions. ......................................... 35
Table 5: List of utilities and utility operating conditions. ................................................ 46
Table 6: Process efficiency values of utilities. ................................................................. 46
Table 7: List of energy consuming equipment and their consumption rates- ethane
cracking process. ............................................................................................... 46
Table 8: Simulation results- ethane cracking process. ..................................................... 48
Table 9: Reactor yield mole composition- methane pyrolysis. ........................................ 53
Table 10: Conversions of methane pyrolysis reaction using partial oxidation method. .. 53
Table 11: Comparison of different schemes proposed for solvent separation. ................ 59
Table 12: List of energy consuming equipment and rate of energy consumptions-
methane pyrolysis process. ............................................................................... 63
Table 13: Simulation results - methane pyrolysis process. .............................................. 66
Table 14: Estimation of raw material cost - Ethane steam cracking. ............................... 69
Table 15: Consolidated cost data- Ethane cracking process. ........................................... 69
Table 16: Operating cost of equipment- ethane cracking................................................. 70
Table 17: Cost of utilities ................................................................................................. 71
Table 18: Estimation of raw material cost- methane pyrolysis. ....................................... 73
Table 19: Consolidated cost data- methane pyrolysis process. ........................................ 74
xi
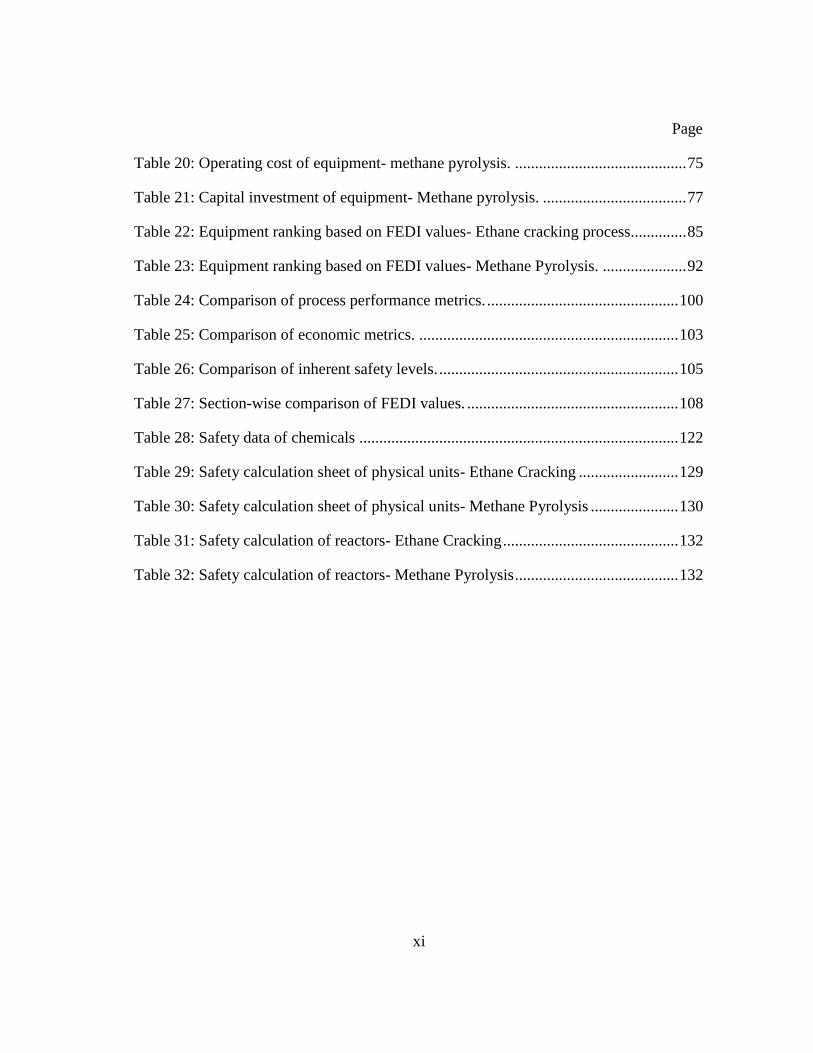
Page
Table 20: Operating cost of equipment- methane pyrolysis. ........................................... 75
Table 21: Capital investment of equipment- Methane pyrolysis. .................................... 77
Table 22: Equipment ranking based on FEDI values- Ethane cracking process.............. 85
Table 23: Equipment ranking based on FEDI values- Methane Pyrolysis. ..................... 92
Table 24: Comparison of process performance metrics. ................................................ 100
Table 25: Comparison of economic metrics. ................................................................. 103
Table 26: Comparison of inherent safety levels. ............................................................ 105
Table 27: Section-wise comparison of FEDI values. ..................................................... 108
Table 28: Safety data of chemicals ................................................................................ 122
Table 29: Safety calculation sheet of physical units- Ethane Cracking ......................... 129
Table 30: Safety calculation sheet of physical units- Methane Pyrolysis ...................... 130
Table 31: Safety calculation of reactors- Ethane Cracking ............................................ 132
Table 32: Safety calculation of reactors- Methane Pyrolysis ......................................... 132

1
CHAPTER I
INTRODUCTION
Process risk management is a fundamental concept of chemical process safety
that involves identifying, reducing and managing risks in chemical processes.(Center for
Chemical Process, 2008b) Risk is a function of consequence and likelihood of a hazard,
where hazard is defined as a potential harm caused by a condition. (Center for Chemical
Process, 2008b) In order to effectively manage risks, a thorough hazard analysis must be
done to identify all possible hazards produced in a process. Followed by identification,
efforts should be taken to reduce those hazards that have high consequences as well as a
large likelihood of occurrence. Since, it is impossible to eliminate all the hazards
completely in a process, the risk levels should be maintained at a minimum level by
continual improvement and effective management. One of those powerful ways of
reducing risk is done by eliminating the root cause of hazards in a process. (Center for
Chemical Process, 2008b) The approach of identifying the source of hazard and
developing methods to eliminate or reduce impact of source is termed as inherent safety
approach. (Center for Chemical Process, 2008b)
Hazards of a chemical process are inherent in nature, caused predominantly due
to operating conditions, quantities of chemicals, characteristics of chemicals, size and
location of unit operations. Consequence of a hazard arising out of an abnormal
condition increases with increase in intensity of the above mentioned factors. In addition
to these factors there are several other types of hazards such as mechanical hazards of

2
rotary equipment, electrical hazards, safety hazards and few other that can attribute to
further severity of hazard consequence.
In order to effectively neutralize the consequence of a hazard, the probability of
an abnormal condition is thwarted by following risk reduction in four levels.(Center for
Chemical Process, 2008a)
i. Inherent - Reducing or eliminating hazards that are present in the process
condition or chemicals involved in processes.
ii. Passive – Eliminating hazards by subduing the impact of an abnormal
condition without the use of any human initiated controls or automatic
device activation.
iii. Active – Eliminating hazards by thwarting the occurrence of a hazard by
initiating manual controls or automatic device activation.
iv. Procedural – Implementing policies, training and other managerial
regulations that can effectively help in early identification of a hazard and
abnormal situation management, thus preventing an accident from
occurring. (Center for Chemical Process, 2008a)
The above mentioned approaches are used in all stages of process development
and they seek to address all the hazards present in a process. Though all the methods
contribute in increasing overall safety, inherent and passive ways are proven to be the
most effective way of risk reduction because they don’t involve any manual or automatic
intervention.(Dennis, 2012) Hence, they are considered reliable and robust techniques of
risk management.(Dennis, 2012) Inherent safety approach is one such method that can

3
be applied at any stage of a chemical process with ease. However, basic safety of the
process is enhanced on implementing the inherent safety approach at the preliminary
level of a chemical process life cycle.(Kletz, 1985) This approach is a fundamental and
logical way of eliminating risks by removing materials or reducing intensity of process
variables that cause significant impact on safety. (Kletz, 1985)
Inherent Safety as defined by CCPS (Center for Chemical Process Safety) is
given by: “A chemical manufacturing process is inherently safer if it reduces or
eliminates the hazards associated with materials and operations used in the process and
this reduction or elimination is permanent and inseparable.” (Center for Chemical
Process, 2008a) The concept of inherent safety was first introduced by Trevor Kletz,
who suggested change in basic technology to remove hazards, rather than adding
additional layers to protect the inherent hazards.(Kletz, 1985) Effective inherent safety is
achieved with the change or modification done starting from process chemistry followed
by change in intensive process parameters and design of equipment. The four main
guiding principles of inherent safety approach are defined as follows:(Kletz, 1985)
i. Minimization: Minimizing the inventory of the material, size of
equipment, pipeline size can reduce the risk of an incident significantly.
ii. Substitution: Substituting the more hazardous chemical with a less
hazardous chemical that gives same or better performance is an effective
method of risk reduction. A process that produces more hazardous
intermediates or by products that require additional separation processes
can be substituted by a less dangerous technology.

4
iii. Moderation: Moderating the intensity of process parameters such as
reduced temperatures and pressure favor in enhancement of safety.
iv. Simplification: A simplified process that has minimum number of
equipment not only reduces fixed and operating cost but also enhances
safety.
Inherent safety gained importance after the occurrence of two major accidents in
chemical industry: Bhopal Gas tragedy, India (1984) and Explosion at Flixborough,
UK.(Kletz, 1985) Both these incidents depict lack of sound process design and illustrate
the need for inherently safer design at the initial stage. Following these incidents,
continuous efforts have been taken to popularize the concept of Inherently Safer Designs
(ISD) and thus improve safety at all levels of a process development. The brief details of
the cause and consequence of these two accidents are explained below to understand the
need of inherent safety approach.
I.1. Bhopal Gas Tragedy, India (1984)
On December 3, 1984, near Bhopal, India, approximately 41 tonnes of a toxic
chemical named Methyl Iso-Cyanate leaked from a chemical plant manufacturing
Carbaryl, a pesticide.(Gupta, 2002) This disaster caused approximately 3000+ fatalities
and 300,000 injuries.(Gupta, 2002) Methyl Iso-Cyanate, was stored as a chemical
intermediate in the process of manufacturing Carbaryl. On the day of the incident, a
storage tank containing large quantities of Methyl Iso-Cyanate got contaminated with
water which led to an exothermic runaway reaction, causing sudden rise in temperature
5
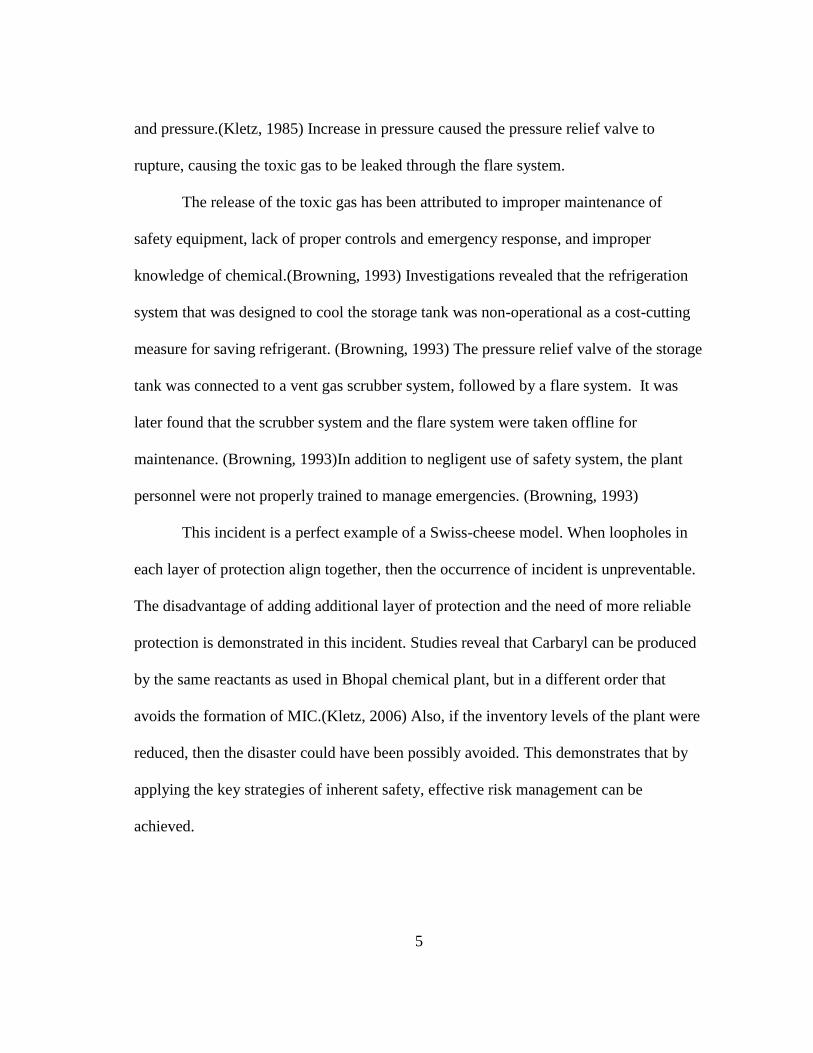
and pressure.(Kletz, 1985) Increase in pressure caused the pressure relief valve to
rupture, causing the toxic gas to be leaked through the flare system.
The release of the toxic gas has been attributed to improper maintenance of
safety equipment, lack of proper controls and emergency response, and improper
knowledge of chemical.(Browning, 1993) Investigations revealed that the refrigeration
system that was designed to cool the storage tank was non-operational as a cost-cutting
measure for saving refrigerant. (Browning, 1993) The pressure relief valve of the storage
tank was connected to a vent gas scrubber system, followed by a flare system. It was
later found that the scrubber system and the flare system were taken offline for
maintenance. (Browning, 1993)In addition to negligent use of safety system, the plant
personnel were not properly trained to manage emergencies. (Browning, 1993)
This incident is a perfect example of a Swiss-cheese model. When loopholes in
each layer of protection align together, then the occurrence of incident is unpreventable.
The disadvantage of adding additional layer of protection and the need of more reliable
protection is demonstrated in this incident. Studies reveal that Carbaryl can be produced
by the same reactants as used in Bhopal chemical plant, but in a different order that
avoids the formation of MIC.(Kletz, 2006) Also, if the inventory levels of the plant were
reduced, then the disaster could have been possibly avoided. This demonstrates that by
applying the key strategies of inherent safety, effective risk management can be
achieved.
6
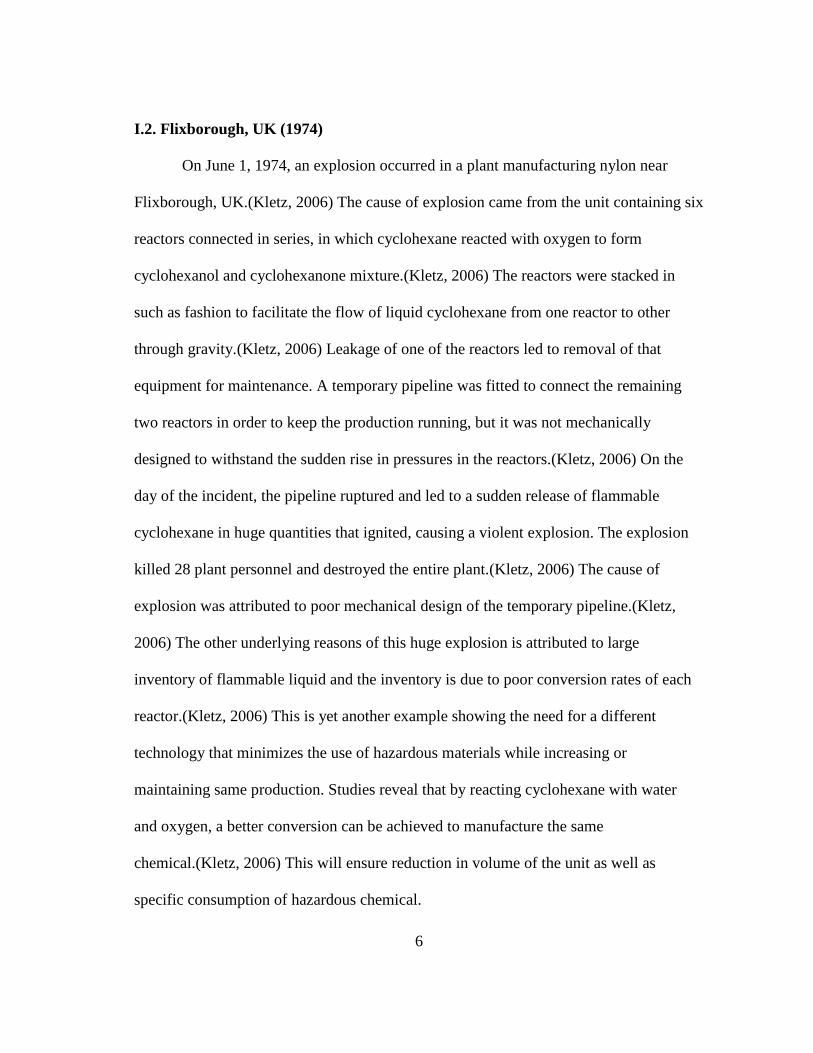
I.2. Flixborough, UK (1974)
On June 1, 1974, an explosion occurred in a plant manufacturing nylon near
Flixborough, UK.(Kletz, 2006) The cause of explosion came from the unit containing six
reactors connected in series, in which cyclohexane reacted with oxygen to form
cyclohexanol and cyclohexanone mixture.(Kletz, 2006) The reactors were stacked in
such as fashion to facilitate the flow of liquid cyclohexane from one reactor to other
through gravity.(Kletz, 2006) Leakage of one of the reactors led to removal of that
equipment for maintenance. A temporary pipeline was fitted to connect the remaining
two reactors in order to keep the production running, but it was not mechanically
designed to withstand the sudden rise in pressures in the reactors.(Kletz, 2006) On the
day of the incident, the pipeline ruptured and led to a sudden release of flammable
cyclohexane in huge quantities that ignited, causing a violent explosion. The explosion
killed 28 plant personnel and destroyed the entire plant.(Kletz, 2006) The cause of
explosion was attributed to poor mechanical design of the temporary pipeline.(Kletz,
2006) The other underlying reasons of this huge explosion is attributed to large
inventory of flammable liquid and the inventory is due to poor conversion rates of each
reactor.(Kletz, 2006) This is yet another example showing the need for a different
technology that minimizes the use of hazardous materials while increasing or
maintaining same production. Studies reveal that by reacting cyclohexane with water
and oxygen, a better conversion can be achieved to manufacture the same
chemical.(Kletz, 2006) This will ensure reduction in volume of the unit as well as
specific consumption of hazardous chemical.

7
The above mentioned accidents demonstrate how poor process design and
inefficient operations affect safety. Soon after these incidents, chemical industries
adopted different approaches for replacement of a safer technology to produce the same
chemical compound. The lesson to be inferred is that hazards caused by the physical and
chemical conditions of materials has to be identified earlier and reduced or modified to
attenuate the impact, than by adding additional layers of protection. However, layers of
protection are vital in reducing risk and hence, proper and reliable layer of protection is
to be used.
The typical layers of protection in a chemical process development stage are
illustrated below in Figure 1. (S2S-A Gateway for Plant and Process Safety, 2003)
Layers of protection provide additional safety measures to suppress the effect of the
potential hazards. (Center for Chemical Process, 2008a) These add-on layers do not
intend to eliminate hazards, but instead they prevent and control the incidents from
happening using manual, automatic and administrative controls. (Center for Chemical
Process, 2008a) Every additional layer added reduces the overall risk, but also
introduces the need for more reliable equipment. As reliability of equipment increases
cost of equipment increases thus, causing a major impact on the fixed and operating cost
of the plant. Addition of too many equipment also causes complexity in the process and
this increases chances of human and operational error. In order to optimize the reliability
and cost of safety, it is important to choose a process that is inherently safe designed so
that, safety is ensured with minimal cost of operation and more reliability.

8
Figure 1: Typical Layers of Protection in a chemical process. Adapted from (S2S-A
Gateway for Plant and Process Safety, 2003)
Community emergency response
Plant emergency response
Active/Passive protection
Automatic Action SIS/ESD
Alarm, operator action
BPCS
Process Design
Process
9
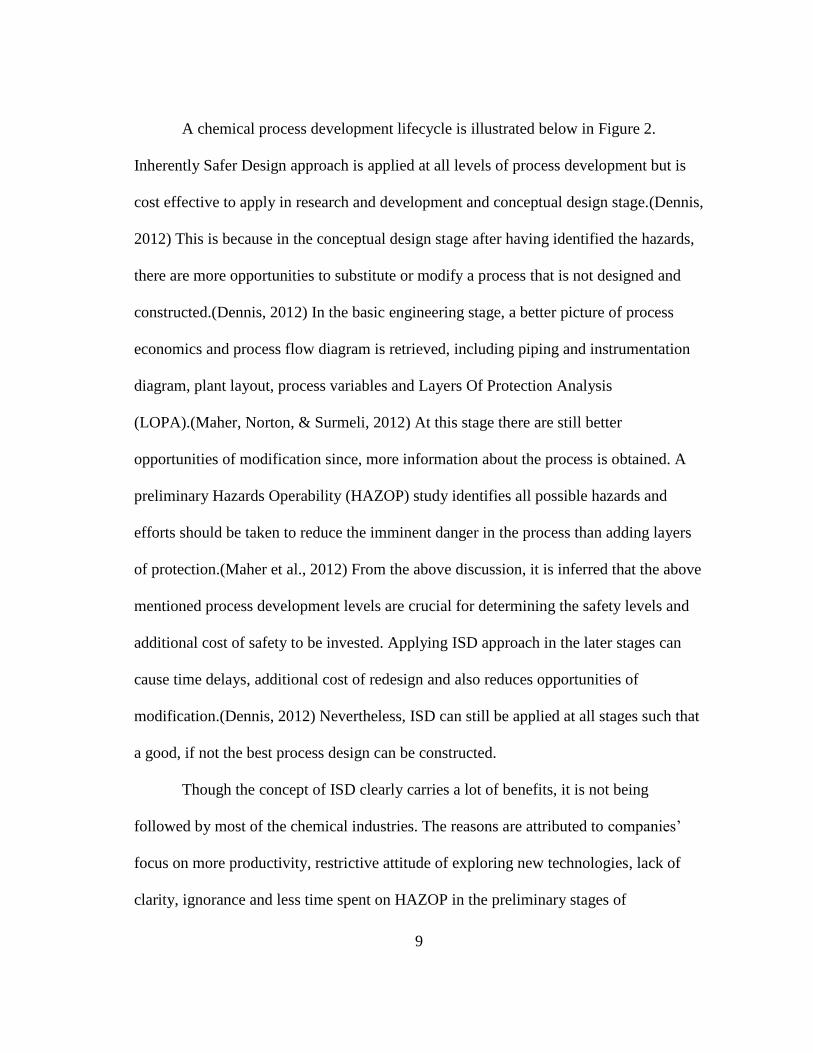
A chemical process development lifecycle is illustrated below in Figure 2.
Inherently Safer Design approach is applied at all levels of process development but is
cost effective to apply in research and development and conceptual design stage.(Dennis,
2012) This is because in the conceptual design stage after having identified the hazards,
there are more opportunities to substitute or modify a process that is not designed and
constructed.(Dennis, 2012) In the basic engineering stage, a better picture of process
economics and process flow diagram is retrieved, including piping and instrumentation
diagram, plant layout, process variables and Layers Of Protection Analysis
(LOPA).(Maher, Norton, & Surmeli, 2012) At this stage there are still better
opportunities of modification since, more information about the process is obtained. A
preliminary Hazards Operability (HAZOP) study identifies all possible hazards and
efforts should be taken to reduce the imminent danger in the process than adding layers
of protection.(Maher et al., 2012) From the above discussion, it is inferred that the above
mentioned process development levels are crucial for determining the safety levels and
additional cost of safety to be invested. Applying ISD approach in the later stages can
cause time delays, additional cost of redesign and also reduces opportunities of
modification.(Dennis, 2012) Nevertheless, ISD can still be applied at all stages such that
a good, if not the best process design can be constructed.
Though the concept of ISD clearly carries a lot of benefits, it is not being
followed by most of the chemical industries. The reasons are attributed to companies’
focus on more productivity, restrictive attitude of exploring new technologies, lack of
clarity, ignorance and less time spent on HAZOP in the preliminary stages of

10
design.(Kletz, 1985) Other reasons include conflicting interest between safety and
process yield, environmental concerns or economics.(Khan & Amyotte, 2003)
Figure 2: Stages of Chemical Process Development. Adapted from (Bauer & Maciel
Filho, 2004)
The above introduction to the concept of inherent safety provides a new route to
deal with the hazards identified in a process. This approach provides a wide array of
benefits including cost reduction while managing risks and also increase reliability. Yet,
the approach is adapted only by a few companies in an effective way. This necessitates
development of a problem statement whose principle objective is to apply the inherent
safety approach at the conceptual design stage, to demonstrate its merits and method of
choosing a safe approach to design. The problem statement can be described as making
an effective overall decision between two chemical process routes for producing same
chemical compound by analyzing the process technologies, economics of operation and
Research & Development
Conceptual Design
Engineering Design
Construction & Erection
Startup & commissioning
Plant operations and planning

11
inherent safety levels of the processes. Quantitative measures of all the three key
performance factors are evaluated and a top level analysis is performed to select the
process having minimum risk at basic level without addition of any layers of protection.
The base case product chosen for the study is ethylene and the processes are identified
such that one route is a well-established, state of art technology while the other one is a
novel technology, that is yet to be commercialized.(Wood, Nwaoha, & Towler, 2012)
The aim of this thesis is to illustrate the idea of inherent safety by doing a top-
level quantitative analysis of safety on the base case and comparing the safety levels
with the process economics and technology. This study aims to analyze the inherent
safety levels of two different process routes producing the same chemical compound and
decide on the inherently safer process subject to cost and technological factors. There are
several indices that can be used to measure inherent safety and these indices represent
the magnitude of potential impact of a process. Another objective of this analysis is to
identify areas of process improvement that can help in improving process efficiency as
well as safety. This analysis also helps in comparing the operating cost with safety of
the plant, so that decisions can be made that are equally beneficial to both the factors.
The final aim is to rank all the major equipment/ sections of the plant that impact safety
and provide possible recommendations for risk reduction.
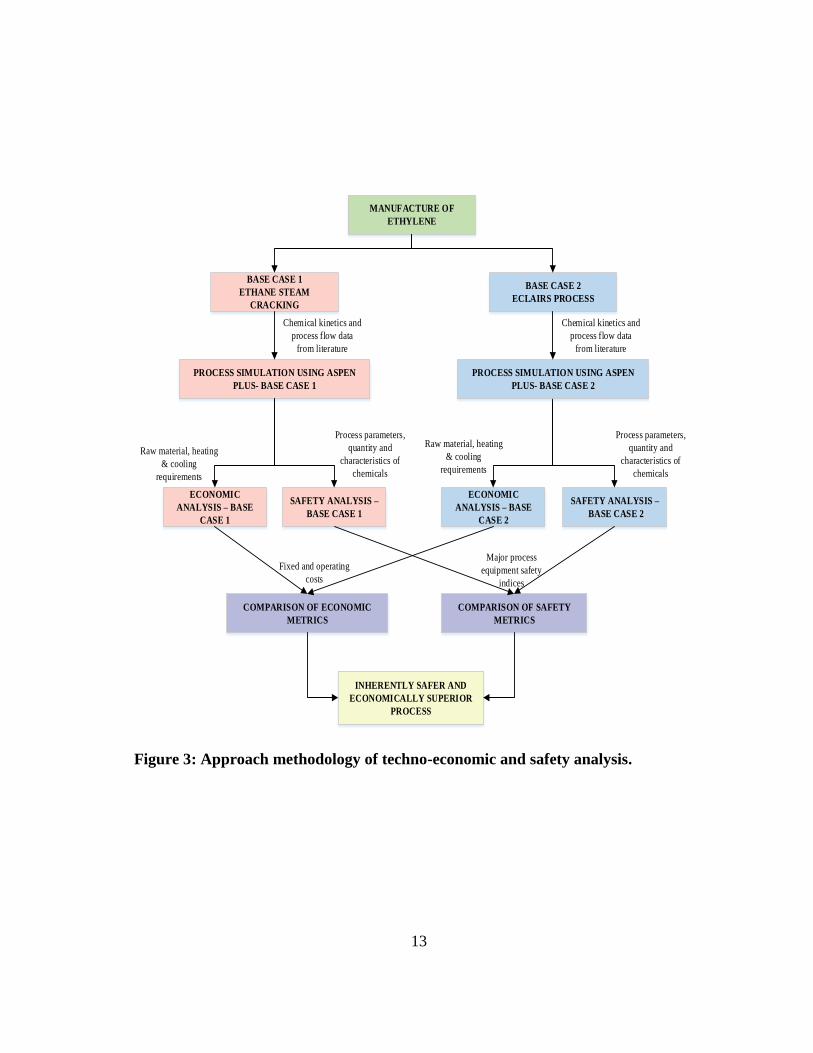
The general approach to the problem statement can be illustrated by the Figure 3.
Initially, chemical kinetics and general process flow data for both the process
technologies are collected from literature. Using this data, a steady state process
simulation is carried out with the aid of computational software. From the simulation
12
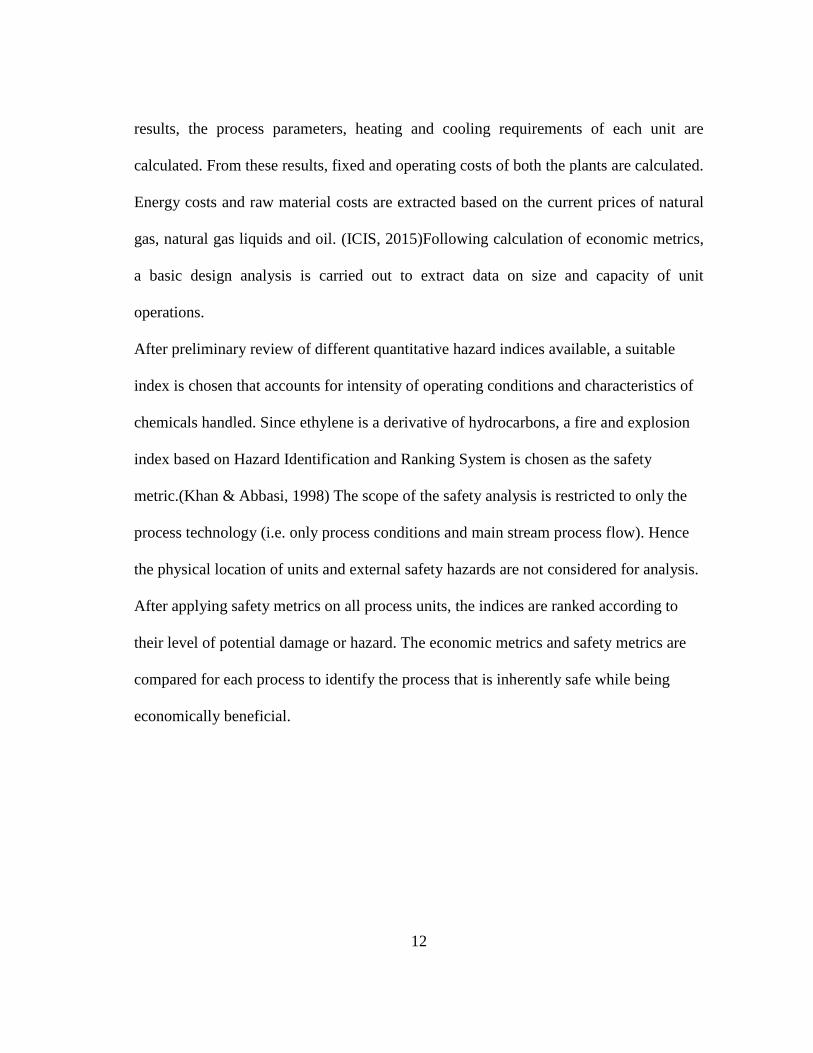
results, the process parameters, heating and cooling requirements of each unit are
calculated. From these results, fixed and operating costs of both the plants are calculated.
Energy costs and raw material costs are extracted based on the current prices of natural
gas, natural gas liquids and oil. (ICIS, 2015)Following calculation of economic metrics,
a basic design analysis is carried out to extract data on size and capacity of unit
operations.
After preliminary review of different quantitative hazard indices available, a suitable
index is chosen that accounts for intensity of operating conditions and characteristics of
chemicals handled. Since ethylene is a derivative of hydrocarbons, a fire and explosion
index based on Hazard Identification and Ranking System is chosen as the safety
metric.(Khan & Abbasi, 1998) The scope of the safety analysis is restricted to only the
process technology (i.e. only process conditions and main stream process flow). Hence
the physical location of units and external safety hazards are not considered for analysis.
After applying safety metrics on all process units, the indices are ranked according to
their level of potential damage or hazard. The economic metrics and safety metrics are
compared for each process to identify the process that is inherently safe while being
economically beneficial.
13
BASE CASE 1
ETHANE STEAM
CRACKING
BASE CASE 2
ECLAIRS PROCESS
MANUFACTURE OF
ETHYLENE
PROCESS SIMULATION USING ASPEN
PLUS- BASE CASE 1
ECONOMIC
ANALYSIS – BASE
CASE 1
SAFETY ANALYSIS –
BASE CASE 2
SAFETY ANALYSIS –
BASE CASE 1
ECONOMIC
ANALYSIS – BASE
CASE 2
COMPARISON OF ECONOMIC
METRICS
COMPARISON OF SAFETY
METRICS
INHERENTLY SAFER AND
ECONOMICALLY SUPERIOR
PROCESS
Chemical kinetics and
process flow data
from literature
Chemical kinetics and
process flow data
from literature
PROCESS SIMULATION USING ASPEN
PLUS- BASE CASE 2
Raw material, heating
& cooling
requirements
Fixed and operating
costs
Major process
equipment safety
indices
Process parameters,
quantity and
characteristics of
chemicals
Raw material, heating
& cooling
requirements
Process parameters,
quantity and
characteristics of
chemicals
Figure 3: Approach methodology of techno-economic and safety analysis.

14
CHAPTER II
LITERATURE REVIEW
Recent advancements made in extracting more natural gas from untapped shale
gas reserves have opened the door for huge opportunities of shale gas monetization in
the petrochemical market. Natural Gas Liquid (NGL) reserves have also increased
significantly along with shale gas recoveries and this has led to exploration of
opportunities that use NGLs such as ethane, propane and butane as raw
materials.(Thomas K. Swift, Martha G. Moore, & Sanchez, 2011) Studies show that
ethane, one of the primary components recovered from NGL has a huge market for
producing petrochemical intermediates rather than being burnt as a fuel. (Thomas K.
Swift et al., 2011)These shale gas developments have led to a 25% increase of ethane
supply. (Thomas K. Swift et al., 2011) This increase has created a major growth in
petrochemical production capacities, investment in chemical industries, taxes, revenue
and economic output.(True, 2013)
One of those petrochemical industry that is undergoing a great deal of expansion
is the ethylene industry. Ethylene is a primary petrochemical compound that is used in
the manufacture of polyethylene, ethylene dichloride, ethylene oxide, ethyl benzene,
vinyl acetate and other miscellaneous chemicals. (Thomas K. Swift et al., 2011) The
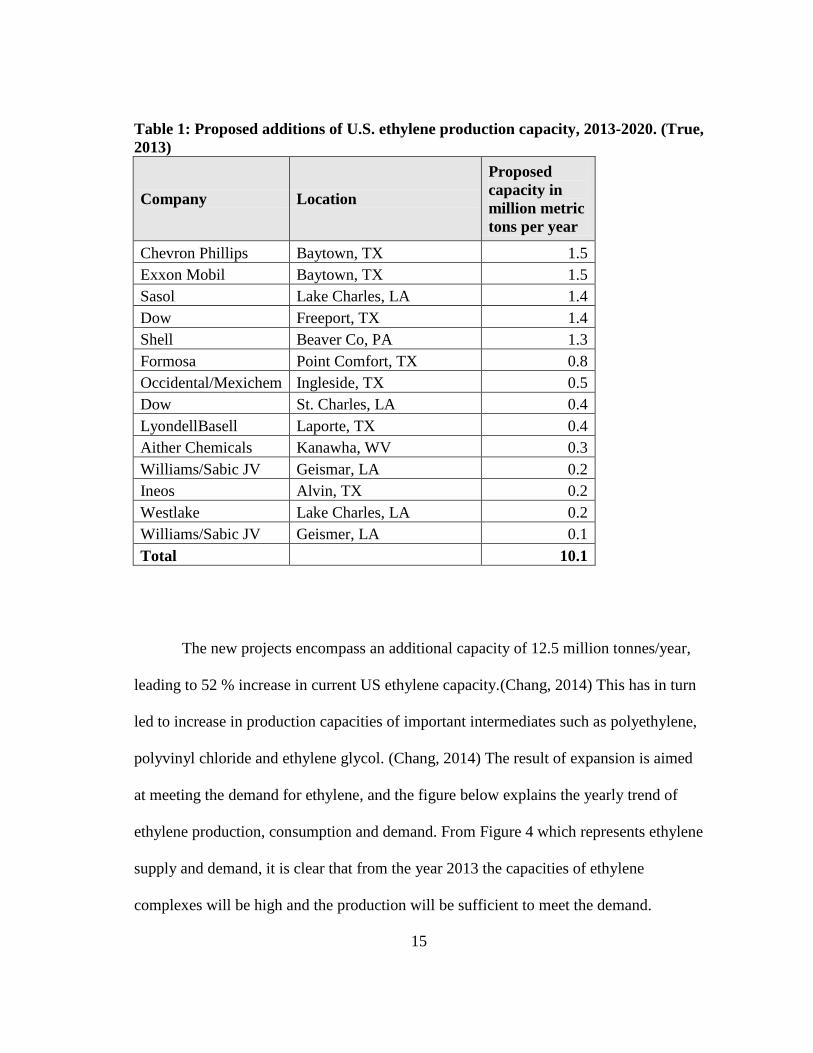
shale gas boom has led to announcement of 10 new projects to produce ethylene. Table 1
given below shows the major projects announced for expansion of ethylene.
15
Table 1: Proposed additions of U.S. ethylene production capacity, 2013-2020. (True,
2013)
Company Location
Proposed
capacity in
million metric
tons per year
Chevron Phillips Baytown, TX 1.5
Exxon Mobil Baytown, TX 1.5
Sasol Lake Charles, LA 1.4
Dow Freeport, TX 1.4
Shell Beaver Co, PA 1.3
Formosa Point Comfort, TX 0.8
Occidental/Mexichem Ingleside, TX 0.5
Dow St. Charles, LA 0.4
LyondellBasell Laporte, TX 0.4
Aither Chemicals Kanawha, WV 0.3
Williams/Sabic JV Geismar, LA 0.2
Ineos Alvin, TX 0.2
Westlake Lake Charles, LA 0.2
Williams/Sabic JV Geismer, LA 0.1
Total 10.1
The new projects encompass an additional capacity of 12.5 million tonnes/year,
leading to 52 % increase in current US ethylene capacity.(Chang, 2014) This has in turn
led to increase in production capacities of important intermediates such as polyethylene,
polyvinyl chloride and ethylene glycol. (Chang, 2014) The result of expansion is aimed
at meeting the demand for ethylene, and the figure below explains the yearly trend of
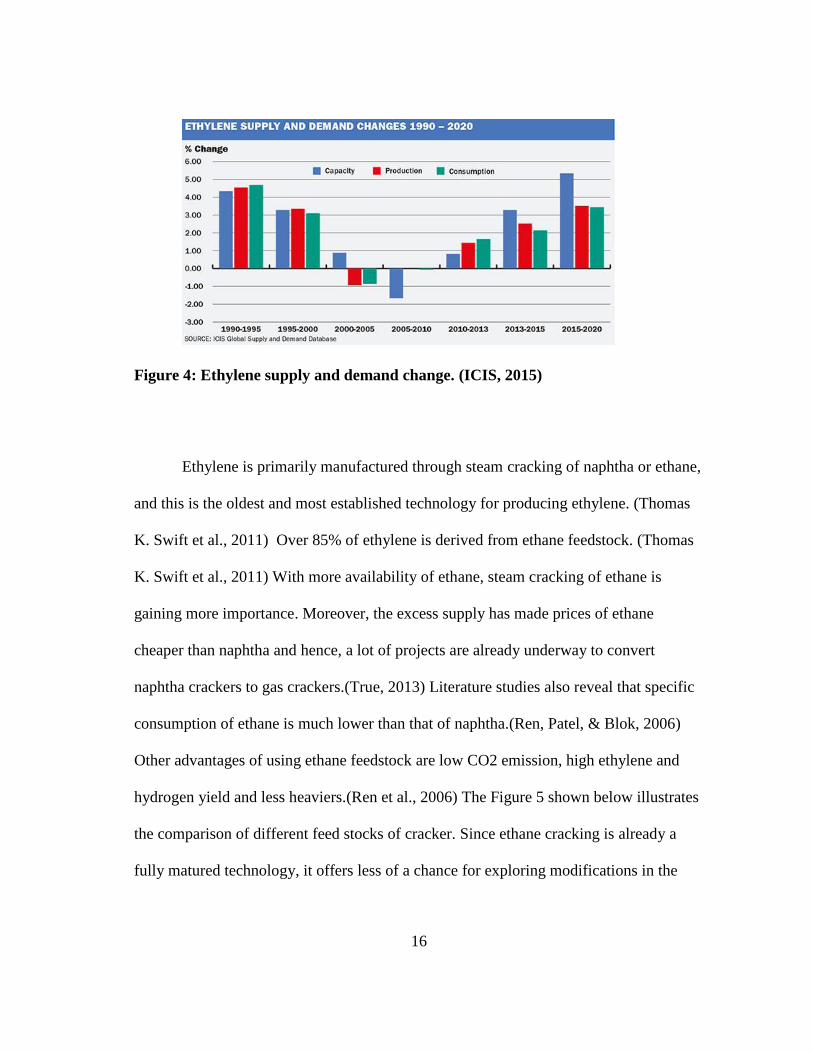
ethylene production, consumption and demand. From Figure 4 which represents ethylene
supply and demand, it is clear that from the year 2013 the capacities of ethylene
complexes will be high and the production will be sufficient to meet the demand.
16
Figure 4: Ethylene supply and demand change. (ICIS, 2015)
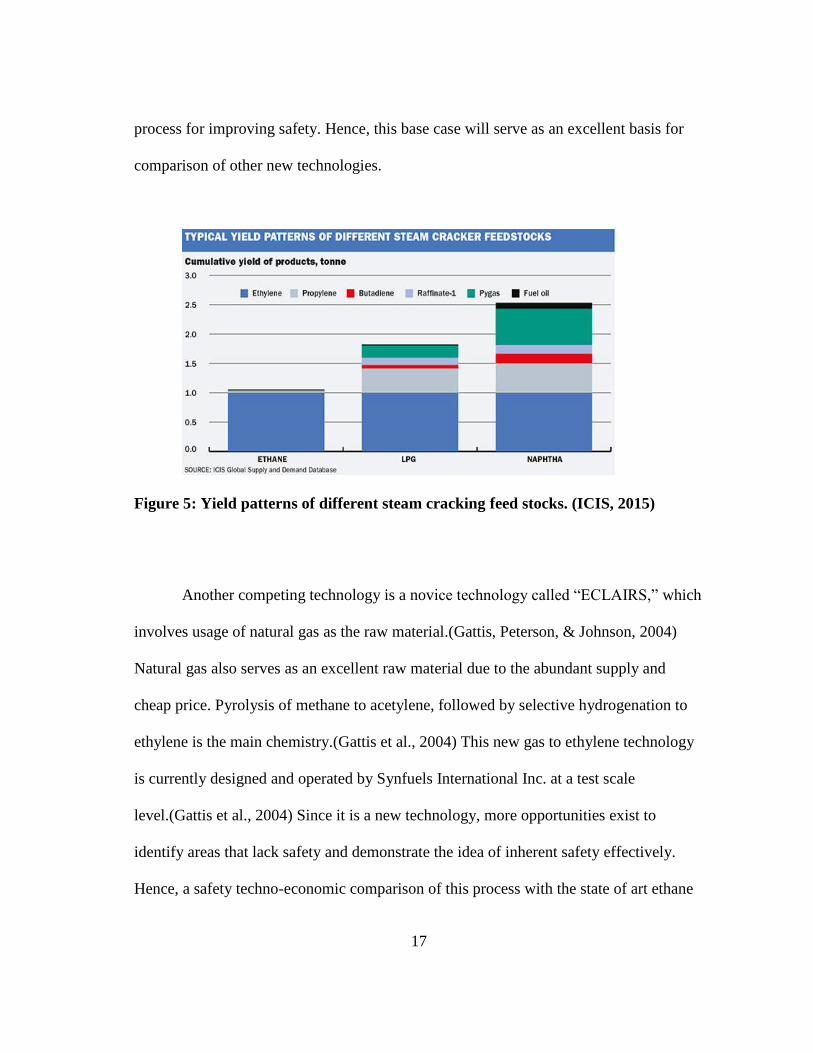
Ethylene is primarily manufactured through steam cracking of naphtha or ethane,
and this is the oldest and most established technology for producing ethylene. (Thomas
K. Swift et al., 2011) Over 85% of ethylene is derived from ethane feedstock. (Thomas
K. Swift et al., 2011) With more availability of ethane, steam cracking of ethane is
gaining more importance. Moreover, the excess supply has made prices of ethane
cheaper than naphtha and hence, a lot of projects are already underway to convert
naphtha crackers to gas crackers.(True, 2013) Literature studies also reveal that specific
consumption of ethane is much lower than that of naphtha.(Ren, Patel, & Blok, 2006)
Other advantages of using ethane feedstock are low CO2 emission, high ethylene and
hydrogen yield and less heaviers.(Ren et al., 2006) The Figure 5 shown below illustrates
the comparison of different feed stocks of cracker. Since ethane cracking is already a
fully matured technology, it offers less of a chance for exploring modifications in the
17
process for improving safety. Hence, this base case will serve as an excellent basis for
comparison of other new technologies.
Figure 5: Yield patterns of different steam cracking feed stocks. (ICIS, 2015)
Another competing technology is a novice technology called “ECLAIRS,” which
involves usage of natural gas as the raw material.(Gattis, Peterson, & Johnson, 2004)
Natural gas also serves as an excellent raw material due to the abundant supply and
cheap price. Pyrolysis of methane to acetylene, followed by selective hydrogenation to
ethylene is the main chemistry.(Gattis et al., 2004) This new gas to ethylene technology
is currently designed and operated by Synfuels International Inc. at a test scale
level.(Gattis et al., 2004) Since it is a new technology, more opportunities exist to
identify areas that lack safety and demonstrate the idea of inherent safety effectively.
Hence, a safety techno-economic comparison of this process with the state of art ethane
18
cracking technology will help in identifying dark areas and will deliver clear benefits of
choosing one over the other.
II.1. Safety Metrics
Literature review shows a wide array of systematic quantitative tools adopted for
measuring the risk and inherent safety of a process. Quantitative metrics are objective
based and are more effective since they represent the magnitude of impact. Moreover,
the scale of improvement achieved by modifying a process or operating variables is well
interpreted by a quantitative measure such as a safety or a hazard index and this
facilitates continual improvement. Thus, these indices can be useful in capturing the
application of inherent safety design principles. Safety indices are simple to use in the
early stage of design for hazard identification since they do not require detailed process
information and are also cheaper than the more traditional approaches such as HAZOP,
FTA (Fault Tree Analysis) and FMEA (Failure Mode and Effect Analysis).(Khan, Sadiq,
& Amyotte, 2003) They are easy to calculate and enable easy comparison between
processes.(Khan et al., 2003) A list of most commonly used safety metrics is discussed
below.
II.1.1. Dow Fire and Explosion Index
Dow fire and explosion index is the most commonly used index in chemical
industries.(Khan et al., 2003) This index has been revised seven times with the latest
published in 1994.(Khan et al., 2003) This index is primarily calculated after the basic

19
engineering stage when all the design parameters, layout, spacing, controls and detection
systems are added.(AichE, 1994) The information needed for evaluating fire and
explosion index are plot plan, process flow diagram, replacement cost data of equipment
and details of all layers of protection.(AichE, 1994). Initially, a parameter called
Material Factor (MF) which measures the hazard potential in terms of flammable and
reactive characteristics of the material is calculated.(AichE, 1994) This is followed by
calculation of general and special process hazards. General process hazards (F1) account
for penalties due to exothermic and endothermic reactions, material transfer, access,
enclosed units and drainage and spill control of chemical.(AichE, 1994) Special process
hazards (F2) include penalties for hazardous operating conditions, process parameters,
quantity, corrosion and types of equipment used in operation.(AichE, 1994) The above
mentioned process hazards are multiplied to get process unit hazards factor (F3), which
is again multiplied with material factor to get the fire & explosion index.(AichE, 1994)
Later, Loss Control Credit Factor (LCCF) is calculated by multiplying credits assigned
on the basis of availability of process controls, material isolation techniques and fire
protection added.(AichE, 1994) Finally, from the calculated Fire and Explosion Damage
Index (FEDI), a radius of exposure, area exposed to the hazard and the replacement cost
of all equipment in that area are calculated.(AichE, 1994)
Damage radius = 0.84* FEDI
Additional factor called a damage factor, which represents the degree of loss
exposure is calculated based on MF and F3. This damage factor multiplied with value of
area exposed gives base Maximum Probable Property Damage (MPPD).(AichE, 1994)
20
By applying loss credit factor to this value, the actual MPPD is determined.
Subsequently, maximum probable day’s outage and the business interruption in terms of
monetary value are calculated.(AichE, 1994) The penalties and credits are based on
designated ranges of parameters calculated using expert-based knowledge. The
advantage of using this index is that it accounts for all design details and correlates the
damage incurred to monetary value. But, from the above calculation method, it is clear
that Dow index is a very comprehensive and laborious process of hazard identification.
It is also expensive due to the amount of data required and additionally, it requires
technical expertise to decide on the penalty and credit values.
II.1.2. Mond Index
The Mond fire, explosion and toxicity index was developed by Mond division at
ICI.(Khan et al., 2003) The approach and principles of calculation are similar to Dow
index, except that Mond index includes additional hazards.(Khan et al., 2003) The major
changes incorporated in Mond index are that it includes a wider range of storage and
process facilities, processing of explosive chemicals, toxicity hazards index, deviating
effects of good design, extended plant layout, indices to account for fire, aerial and
internal explosion.(Lewis, 1979) The initial procedure of hazard assessment due to fire
and explosion are the same as Dow index except for some additional factors included in
the assessment. An additional toxicity index is included, which is based on toxic
characteristics of the chemical, quantity in use and health implications.(Khan et al.,
2003) Fire, explosion and toxicity indices calculated are analyzed and compared with the

21
acceptable risk standards.(Lewis, 1979) Following this, reviews of the hazard factors
namely the general and special process hazards are done to implement design changes
that would reduce the risk levels.(Lewis, 1979) Finally, credits for implementation of
preventive control features are accounted and final indices are recalculated.(Lewis,
1979) Thus, this index carries an additional advantage of accounting for special hazard
considerations. However, it carries the same disadvantage as that of Dow index because
this procedure is also time-consuming and comprehensive.
II.1.3. Inherent Safety Index (ISI)
Inherent safety index is used for measuring the inherent safety potential of a
process. ISI is a modified version of Prototype Index of Inherent Safety (PIIS).(Heikkilä,
Hurme, & Järveläinen, 1996) The PIIS introduced by Edward & Lawrence was mainly
reaction-oriented and failed to include other processes into consideration.(Edwards &
Lawrence, 1993) ISI accounts for all the process attributes combined with the chemical
characteristics.(Heikkilä et al., 1996) This index is effective for making business
decisions for choosing process alternatives producing the same product. The total
inherent safety is represented by the below mentioned formula:(Heikkilä et al., 1996)
ITI = ICI + IPI
ICI (chemical inherent safety index) represents the value contributed by chemicals
and chemical characteristics while IPI (Physical inherent safety index) represents process
parameters and other physical factors.(Heikkilä et al., 1996) The addition of these sub-
indices form the total inherent safety index (ITI) which depicts the basic hazard potential
22
of the process.(Heikkilä et al., 1996) The chemical inherent safety index is addition of
individual scores assigned to 7 categories, namely heat of reaction, heat of side reaction,
flammability, toxicity, explosiveness, corrosiveness and chemical interactions.(Heikkilä
et al., 1996) The process inherent safety is the addition of individual scores assigned to
five categories namely inventory, pressure, temperature, equipment safety and safety of
process structure.(Heikkilä et al., 1996) The approach uses different databanks for each
sub-category to extract information about them.(Heikkilä et al., 1996) The scores are
based on experienced based ranges of values for each sub-category. The scale of score
varies such that the smaller score represents a highly safe process and vice
versa.(Heikkilä et al., 1996) Hence, the process with higher ITI value indicates that it is
more hazardous. The advantage of using this index is that due to the requirement of
basic information on chemicals and process, it can be easily applied during the
conceptual stage of design for choosing better alternatives. The disadvantage is that the
index is subjective type and is based on a semi-quantitative scoring pattern which might
yield different results for different users based on their experience.
II.1.4. Safety Weighted Hazard Index (SWeHI)
SWeHI is an advanced and modified version of its predecessor index, HIRA
(Hazard Identification and Ranking). This index aims to capture the entire picture of a
process by including all factors such as process, environment and society and how they
impact safety.(Khan, Husain, & Abbasi, 2001) Quantitatively, it represents the radius of
area that is hazardous, caused due to operating and environmental conditions of a
23
particular unit/ section.(Khan et al., 2001) The formula for calculating the SWeHI index
is given as follows:(Khan et al., 2001)
SWeHI = B/A
In the above formula, B represents the damage caused due to fire, explosion or
toxic release of a particular unit under the assumption of a 50% probability of damage.
‘A’ represents the credits gained due to the safety measures and controls adopted for
either preventing occurrence of an accident or reducing the frequency.(Khan et al., 2001)
Thus, if the control measures are low, the value of index will be high suggesting that the
unit or process is not safe. This type of analysis is best suited for identifying, comparing
and ranking different units within a process, so that maximum focus can be given on the
more hazardous equipment for safety improvement. The method of approach and
calculation of B is identical to the calculation of the HIRA index except for addition of
two penalties; one accounts for external factors such as earthquakes and floods while the
other accounts for vulnerability of surroundings such as accident and societal
clashes.(Khan et al., 2001) The calculation of A is done by considering two subgroups:
one that measures the controls adopted and the other that reduces the frequency of
occurrence. The general formula is given by:(Khan et al., 2001)
A = 0.15*∑ (1+cri)
In the above mentioned formula, credits are included to account for emergency
response planning, disaster management planning, other control measures such as foam,
water and fire extinguishing materials available, control systems, detecting systems,
emergency control measures, human error and human reliability.(Khan et al., 2001) Each

24
of these categories is further divided into sub categories that are additive and the final
number is calculated by using the above mentioned formula. All the quantification
methods used in the calculation of B are derived from thermodynamic, empirical
models, National Fire Protection Agency (NFPA) rankings, American Petroleum
Institute (API) standards, process safety design codes, storage area classification
guidelines and Dow index.(Khan et al., 2001) The calculation of A is based on expert
decisions, literature studies on controls, detection and human error.(Khan et al., 2001)
Thus, this index has attempted to quantify factors predominantly based on objective type
data. Hence, it is reliable and is very effective in specifically identifying areas where
safety controls need to be added. However, the disadvantage of this index is that it can
be applied only for a fully designed or an existing plant, thus failing to fetch
opportunities of improving the actual process.
II.1.5. Hazard Identification and Ranking System (HIRA)
The Hazard Identification and Ranking System introduced by Khan and Abbasi
in the year 1998 is a systematic and comprehensive methodology of hazard
identification.(Khan & Abbasi, 1998) This method aims to be more sensitive to process
parameters and is accurate since the quantification is made using thermodynamic and
fluid dynamics models. The index accounts for impact of hazards posed by a unit at
elevated temperatures due to environmental factors and surroundings.(Khan & Abbasi,
1998) Hence, it is accurate in describing the hazard potential of a unit. This index is
unique from other indices such that it considers different classes of equipment according

25
to the hazards specific to it, thus accounting for all kinds of hazards of each unit.(Khan
& Abbasi, 1998) The various units that are classified based on their special hazards
are:(Khan & Abbasi, 1998)
i. Storage units
ii. Physical units with operations such as pumping, mass and heat transfer
and compression.
iii. Unit having chemical reactions
iv. Transportation units
v. Other hazardous units such as boilers, furnaces and fired heaters
The HIRA index is a combination of two other indices: Fire and Explosion
Damage Index (FEDI) and Toxicity Damage Index (TDI).(Khan & Abbasi, 1998) The
estimation of FEDI is based on several penalties and energy factors. Finally, a damage
potential is calculated from which the FEDI is estimated using the following
formula:(Khan & Abbasi, 1998)
FEDI = 4.76* (Damage potential) 1/3
FEDI is the damage radii represented in meters. The semi-quantitative ranking is
given by Table 2.
Table 2: Semi-quantitative hazard ranking of FEDI. (Khan & Abbasi, 1998)
Fire and Explosion damage Index (FEDI) Hazard Characterization
FEDI>500 Extremely hazardous
500>FEDI>400 Highly hazardous
400>FEDI>200 Hazardous
200>FEDI>100 Moderately hazardous

26
Table 2: Continued.
Fire and Explosion damage Index (FEDI) Hazard Characterization
100>FEDI>20 Less hazardous
else No hazard
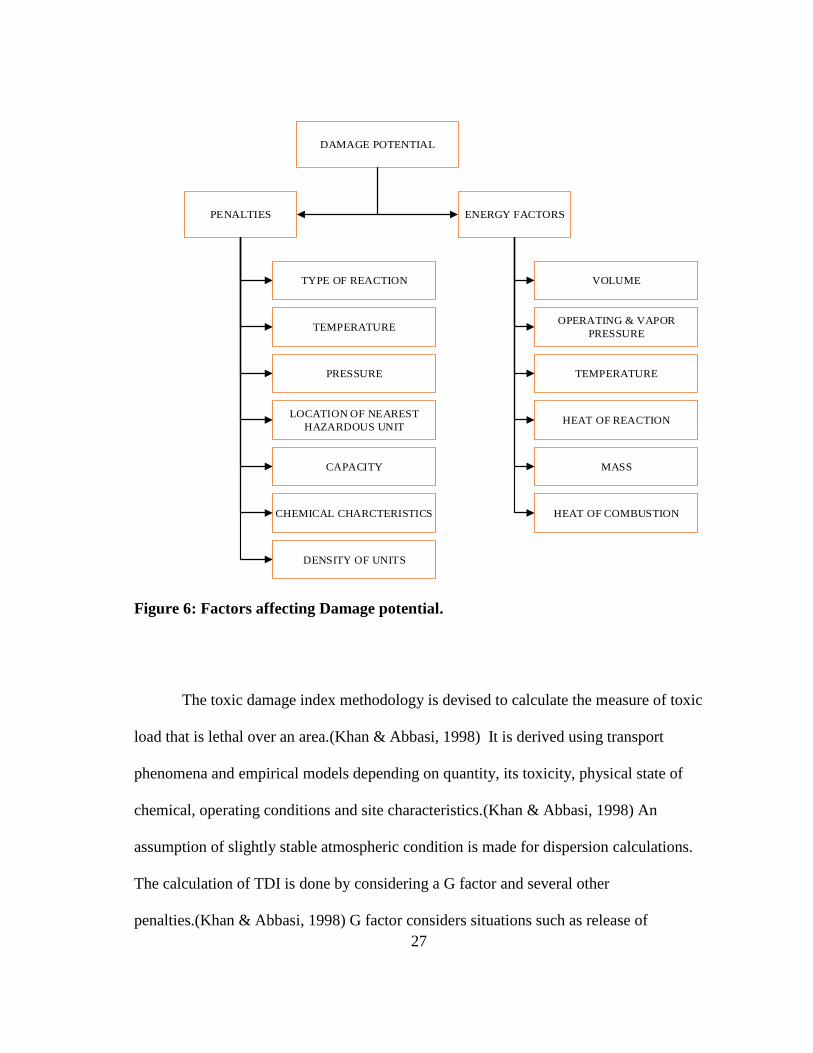
An illustrative diagram describing the various penalties and energy factors is
given in Figure 6. The algorithm for calculating temperature and pressure penalties for
different classes of units vary depending on the equipment class specific guidelines.
Other penalties calculated include that for location of nearest hazardous units, capacity,
characteristics of chemicals, density of units, physical state of chemical during transport,
quantity of fuel used in furnaces, type of reaction and probability of side or runaway
reactions.(Khan & Abbasi, 1998) These penalties are included in the estimation of FEDI
depending on their applicability to that particular class of equipment. All the values of
penalties obtained are from thermodynamic, empirical models, API standards, NFPA
rankings, Dow index and other quantitative relationships derived from literature
studies.(Khan & Abbasi, 1998)
27
DAMAGE POTENTIAL
PENALTIES ENERGY FACTORS
TYPE OF REACTION
TEMPERATURE
PRESSURE
LOCATION OF NEAREST
HAZARDOUS UNIT
CAPACITY
DENSITY OF UNITS
CHEMICAL CHARCTERISTICS
VOLUME
OPERATING & VAPOR
PRESSURE
TEMPERATURE
HEAT OF REACTION
MASS
HEAT OF COMBUSTION
Figure 6: Factors affecting Damage potential.
The toxic damage index methodology is devised to calculate the measure of toxic
load that is lethal over an area.(Khan & Abbasi, 1998) It is derived using transport
phenomena and empirical models depending on quantity, its toxicity, physical state of
chemical, operating conditions and site characteristics.(Khan & Abbasi, 1998) An
assumption of slightly stable atmospheric condition is made for dispersion calculations.
The calculation of TDI is done by considering a G factor and several other
penalties.(Khan & Abbasi, 1998) G factor considers situations such as release of
28
superheated liquid that cause vapor flash and pool of liquid, release of gas leading to
dispersion into atmosphere, liquefied gas having two-phase release and pyrophilic solids
giving toxic vapors.(Khan & Abbasi, 1998) The formula is given by:(Khan & Abbasi,
1998)
G = A *m
In the above formula, A is a function of release conditions and m is the mass
released in kg/s. The penalties calculated account for operating pressure, temperature,
toxicity of chemical, vapor density and site characteristics.(Khan & Abbasi, 1998) The
formula for calculating TDI is given by:(Khan & Abbasi, 1998)
TDI = 25.35* (G* ∏ penalties) 0.425
The advantage of using the HIRA methodology of hazard identification is that
most of the penalties and energy factors calculated are directly from empirical relations
and literature studies. This makes it a more reliable quantification and further enables
easy interpretation of results. In addition to this, the concept of addressing unit specific
hazards based on the different units involved in an industry facilitates accurate
calculation of hazard potential. The semi-quantitative ranking enables us to focus on
those areas that are extremely hazardous. The disadvantages of this index include the
calculation procedure being comprehensive and requirement of detailed design with
equipment layout and plot plan. Another drawback of this index is that it does not take
into account any credit for control systems or preventive measures taken in the plant
thus, giving an overestimated magnitude of impact.(Khan et al., 2001)
29
Comprehensive tools such as Dow, Mond index are applied in industries
extensively after the detailed engineering phase. However, the availability of indices that
can accurately measure the amount of inherent safety during the conceptual stage of
design are less in number. This is one of the reason why industries do not adopt inherent
safety assessment at early stages. From literature review, it is concluded that in this
thesis, the hazard identification and ranking system will be adopted for analyzing
inherent safety on the ethylene base plants. This is because HIRA index is based on
fundamental thermodynamic models which makes the quantification more objective-
based. Further, it is flexible in choosing what penalties can be included, depending upon
the available amount of information. Since, it does not account for control systems and
prevention systems, it is easy to identify the factor that directly impacts the inherent
safety of the unit. Otherwise, the general tendency is to add more protection devices than
identifying the root cause of the hazard.
Hence, this index is highly suitable for determination of actual inherent safety. In
this thesis, penalties accounting for location of nearest hazardous unit and space
occupied by the unit will be neglected. This proves to be a valid assumption, since the
objective is to compare different units and rank them based on inherent safety. Also,
since ethylene is primarily a hydrocarbon compound, only the fire and explosion index
will be determined. The scope of this analysis is restricted only to the main process
stream and hence other external hazards that impact the unit will not be considered.

30
II.2. Economic Metrics
Economics of operation plays a crucial role in selecting alternative process
routes. Cost of building a plant is influenced by several factors. Some of those factors
include process efficiency, process yield, availability of cheap raw material, equipment
cost, utility consumption, profit, environmental emissions and safety measures of plant.
The main economic metrics that dictate the decision making process are fixed and
operating cost. Fixed cost of equipment for two identical well-established technologies
having literature data for capacities and capital cost are determined using the
correlation:(El-Halwagi, 2012)
FCIB = FCIA* (Capacity of B/ Capacity of A) 0.6
In the above formula, FCI is the Fixed Capital Investment. Another method for
calculating the fixed capital investment is based on the cost of delivered equipment. This
method includes a factor that incorporates a collective term for cost of installation,
piping & instrumentation and other engineering installations.(El-Halwagi, 2012) This
method known as Lang method is given by the following formula:(El-Halwagi, 2012)
FCI = FCI Lang factor * Delivered equipment cost
The value of Lang factor depends on the type of material processed. Operating
cost or Working Capital Investment (WCI) constitutes of cost of energy, catalysts, raw
materials, labor and maintenance.(El-Halwagi, 2012) Utility cost includes cost of steam,
power, fuel, cooling water and nitrogen.(El-Halwagi, 2012) Cost of utility depends on
the complexity of process and studies show that safety is directly related to the cost of
energy. Hence, a safer process tends to have less operating cost thus, leading to greater
31
profits. The sum of FCI and WCI constitutes the total capital investment, which is cost
of the entire project.(El-Halwagi, 2012)
Another important parameter that dictates the feasibility of a project is the
economic gross potential. This is calculated to assess if the proposed project is feasible
considering raw material costing and products costing.(El-Halwagi, 2012)
Economic Gross Potential (EGP) = ∑Annual production rate of products* cost of
products - ∑Annual consumption rate of raw material * cost of raw material.
If EGP is greater than one, then project is deemed economically feasible and
further studies are carried out to find the actual net profit. If EGP is lesser than one, the
project is economically not feasible and shall not be considered for further analysis.(El-
Halwagi, 2012)
II.3. Process Metrics
Process technology of manufacturing a product dictates the cost of the project,
environmental impact as well as the safety. The chemistry of the process and the
separation processes involved to achieve product purity that satisfies customer’s
requirement is crucial in determining process route. Factors that affect the decision
making process are product yield, conversion, specific consumption of the raw material,
energy consumption involved in the process, degree of separation processes and process
complexity. In this thesis, all of the above mentioned factors are determined to make
effective comparison between different process routes by performing a process
simulation using Aspen Plus. Aspen Plus is a steady state chemical process simulation

32
software that entails a wide array of rigorous thermodynamic property package specific
to each case study. The inputs to the simulation software were given from chemical
kinetics and process flow data available from the literature.
33
CHAPTER III
PROCESS ANALYSIS
In this chapter, a detailed description of the process technology, simulation
techniques used, assumptions made and finally the results of steady state simulation are
obtained. Only major equipment involved in the main process stream flow were
considered for developing the process. ASPEN PLUS version 7.8.2 was used to carry
out steady state simulation of the base case plants. A print screen picture of the aspen
flow models are attached in the appendix. Peng Robinson was used as the base
thermodynamic method for simulation of both the plants. All reactors were simulated
using RSTOIC model while all distillation columns, absorption and quench towers were
simulated using RADFRAC.
III.1. Ethane Cracking Technology
Steam cracking is the most widely used, established technology for producing
ethylene.(Takaoka, 1967) Due to increase in shale gas reserves, ethane supply is found
to have increased by 25 % making it a suitable raw material for producing ethylene.
(Thomas K. Swift et al., 2011) Over 85 % of ethylene is manufactured from natural gas
liquids obtained along with the shale gas. (Thomas K. Swift et al., 2011) Since ethane is
not easily transportable, most of the time it is considered as stranded gas and therefore is
burnt in flares or used as fuel. But now, ethylene industries are shifting from
conventional liquid crackers processing naphtha to gas crackers that process ethane due

34
to cheap raw material cost and higher product yield of ethane. Hence, this process
analysis helps in understanding the underlying safety and economic benefits of using
ethane as feedstock.
The process chemistry of thermal steam cracking of ethane can be explained by a
complex set of reactions that are based on free radical mechanism.(Froment, Van de
Steene, Van Damme, Narayanan, & Goossens, 1976) There are number of literature
studies done on the thermal cracking of ethane to analyze the product yield patterns and
conversion of ethane along the length of reactor.(Froment et al., 1976) On subjecting
ethane to high temperatures at low pressures, it undergoes dehydrogenation reaction to
primarily form ethylene and hydrogen. Other primary products obtained are methane,
acetylene, propylene, propane and butadiene. The products are obtained as result of
complex combination of 42 free radical mechanisms.(Sundaram & Froment, 1977) Out
of these reactions, only 8 main reactions that adequately define the net effect of the
chemistry have been considered for the case study.(Sundaram & Froment, 1977) They
are given as follows:
i. C2H6 ----------- C2H4 + H2
ii. 2C2H6 ----------- C3H8 + CH4
iii. C3H8 ----------- C3H6 + H2
iv. C3H8 ----------- C2H4 + CH4
v. C3H6 ----------- C2H2 + CH4
vi. C2H2 + C2H4 ----------- C4H6
vii. 2C2H6 ----------- C2H4 + 2CH4

35
viii. C2H6 + C2H4 ----------- C3H6 + CH4
Table 3: Reactor yield data of ethane steam cracking.
Components Reactor yield mass %
Hydrogen 3.8
Methane 2.6
Acetylene 0.08
Ethane 40
Ethylene 52.4
Propylene 1.1
Propane 0.03
Butadiene 1.04
Table 4: Conversions assumed for ethane cracking reactions.
Reaction
Number Conversion %
Conversion of limiting
reactant
i 56 Ethane
ii 1.4 Ethane
iii 35 Propane
iv 39.3 Propane
v 65 Propylene
vi 40 Acetylene
vii 35.8 Ethane
viii 2 Ethane
The net effect of these reactions are endothermic hence, in order to increase yield
of ethylene, external energy has to be supplied to maintain the temperature of the
reactor. This is accomplished by indirect fired heater, where heat release from

36
combustion of fuel is used to heat the reaction mixture that passes through tubes, fixed
along the walls of furnace.(Takaoka, 1967) The main dehydrogenation reaction takes
place in the temperature range of 750- 850 0C at low pressures of about 1.5 – 3.5
bar.(Takaoka, 1967) The residence time of the reaction mixture in the cracker coils are
about 0.1-0.5 seconds.(Takaoka, 1967) Steam is injected along with ethane, since it
reduces the partial pressure of hydrocarbons which in turn reduces the rate of
decomposition of hydrocarbon products to coke at high temperatures.(Takaoka, 1967)
Steam to hydrocarbon ratio of range 0.3-0.45 is considered for the process.(Sundaram &
Froment, 1977) A 60 % single- pass conversion of ethane is assumed, which is in
accordance with the literature.(Froment et al., 1976) The cracker yields obtained are
shown above in Table 3 and the values are matched with the literature data.(Froment et
al., 1976) These values are used for simulating the cracker reactor using RSTOIC. The
percentage conversions calculated from reaction kinetic data for the above eight
reactions are also shown above in Table 4. Ethane cracker is considered as the heart of
the ethylene process plant. Cracker has the maximum energy consumption since
endothermicity of the reactions are very high.
The entire process is separated into three major sections: Pyrolysis, Compression
and Cooling & Separation. The pyrolysis section comprises of the cracker, where the
ethylene product is formed by subjecting ethane feed to high temperature at low
pressure. Cooled cracker products exiting the pyrolysis section are compressed in stages
to desired pressure in order to effectively separate the ethylene from other compounds.
In the compression section, acid gases are removed using caustic scrubbing and any

37
residual moisture is also removed.(Takaoka, 1967) This is done before cooling section to
avoid formation of solid CO2 or ice at cryogenic conditions since, they can block
equipment and pipelines.(Takaoka, 1967) Following the compression section, the tail gas
is cooled in a series of heat exchangers using refrigerants to effectively separate
hydrogen from rest of the product gases, which passes to the separation
section.(Takaoka, 1967) The separation scheme used in this analysis is Front-end De-
Methanizer and Tail-end Acetylene Hydrogenation.(Takaoka, 1967) In this separation
scheme, methane and residual hydrogen are removed initially, followed by which
heaviers are removed. Acetylene present in residual stream is hydrogenated back to get
ethylene following which ethylene is separated as product. The product purity of
ethylene obtained is 99.9 wt %.
The process begins with fresh and recycled ethane feed being preheated in the
convection section of the cracker by the flue gas up to a temperature of about 775 0C.
The reaction takes place at a low pressure of 1.5 bar and temperature of about 775 0C in
the radiation section of the cracker furnace. Low pressure steam is injected at a steam/
hydrocarbon ratio of 0.35. The reaction products exit the cracker furnace at a
temperature of 840 0C and 1 bar pressure. The reaction products have to be immediately
quenched to stop the further formation of acetylene which is an undesired by-product.
This is done by rapid cooling of the reaction products to 380 0C with cooling water in a
series of transfer line heat exchangers.(Takaoka, 1967) Following the transfer line
exchangers, the products are further quenched in quench towers to about 42 0C,
38
operating at 1 bar pressure. The cooling medium used in quench towers are cooling
water.
The cooled gas is now compressed in three stages of compression. Each stage
comprises of a compressor, a cooling water heat exchanger (to cool the compressed
gases to 40 0C) and a flash (to separate the gases from the condensed liquid). In the first
compression stage, pressure is increased to 2.4 bar, followed by second stage where
pressure is increased to about 6 bar. This is again followed by third stage of compression
where the final pressure is around 15 bar. The cooled compressed gases from the third
stage of compression is now passed into a caustic scrubber containing 27 trays, where 8
wt % sodium hydroxide is used a solvent to remove any acid gases such as carbon
dioxide or sulfur present in the gas.(Hammond & Ham, 2009) The sweet gas exiting the
caustic scrubber is compressed again to about 36 bar in a 4th
stage of compression
subsequently. The cooled product gas at 40 0C from the 4
th stage compressor is further
cooled to about 15 0C using propylene refrigerant. The gas is sent to adsorption
tower/dryer to remove any residual moisture in the gas stream, since the stream will be
subjected to cryogenic conditions downstream.(Takaoka, 1967) After achieving a dew
point of around -73 0C in the gas stream, the tail end gas from dryer is directed to
cooling train. The cooling train consists of 3 stages of cooling, where each stage
comprises of three heat exchangers and one flash drum. The heat exchangers in each
stage are integrated with two other streams in two exchangers. The remaining heat duty
is removed by a propylene refrigerant in parallel exchangers. In the first stage of cooling,
the gas is cooled to -29 0C and flashed in a flash drum. This is followed by second stage
39
of cooling to -74 0C and third stage where the exit gas from third stage flash drum is at
around -124 0C. The 95 mol % hydrogen gas stream exiting the third flash at -124
0C is
one of the stream that is pinched with three heat exchangers of each stage. After passing
through the integrated exchangers, a part of it is regulated back to acetylene
hydrogenation reactor while the rest is used as fuel utility.
All the liquids collected from the three flash drums of the cooling train are then
regulated into de-methanizer column of 30 trays that operates at 30 bar pressure, top and
bottom temperature of -113 0C and -4
0C respectively. The vapor distillate from the
column containing 61 mole % methane is expanded and used for heat integration in the
cooling train. After passing through series of exchangers in cooling train, the gas is used
as utility fuel. The bottoms from de-methanizer column is regulated into de-ethanizer
column of 45 trays operating at 26 bar, where all C3+ heaviers are removed from the
bottom at temperature of 80 0C. The top of column consisting of C2 and lighter
compounds exits the column at -11 0C. This overhead stream is heated to around 35
0C
and then sent into the acetylene hydrogenation reactor operating at 25 bar.
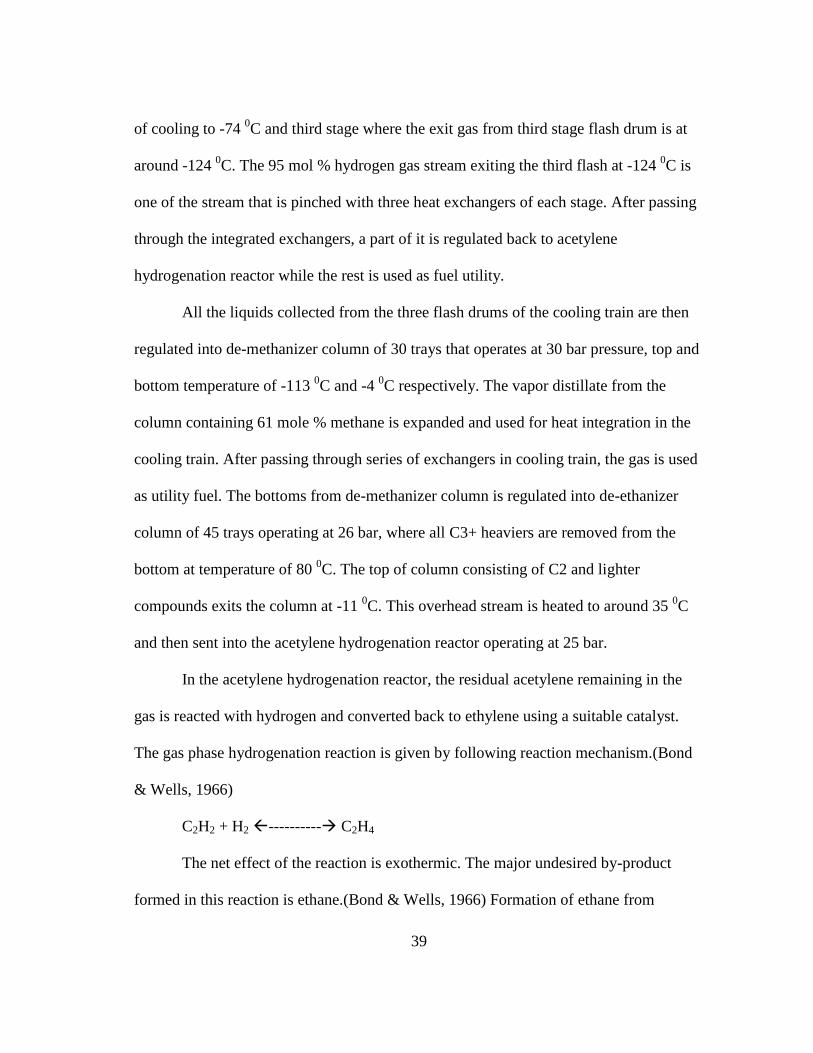
In the acetylene hydrogenation reactor, the residual acetylene remaining in the
gas is reacted with hydrogen and converted back to ethylene using a suitable catalyst.
The gas phase hydrogenation reaction is given by following reaction mechanism.(Bond
& Wells, 1966)
C2H2 + H2 ---------- C2H4
The net effect of the reaction is exothermic. The major undesired by-product
formed in this reaction is ethane.(Bond & Wells, 1966) Formation of ethane from
40
ethylene will significantly reduce the process yield. Hence, by controlling the rate of
hydrogen flowing into the reactor, ethane formation can be reduced. For this case study,
acetylene conversion of 100% and 0% ethane formation are assumed. The reactor
products now containing only C2 compounds exits at 75 0C and enters C2 splitter
columns. C2 splitter columns contains 100 trays and operates at pressure of 19 bar with
top temperature of -31 0C and bottom temperature of -9
0C. Ethylene is separated from
top with product purity of 99.99 wt % while ethane removed from bottom is recycled
back as cracker feed. The reboiler duties of all column in the separation section are given
by 6 bar saturated steam while the condenser duties are taken by propylene refrigerant at
different temperatures. The block diagram of the ethane cracking process using front-end
de-methanizer scheme is shown below in Figure 7.

41
CRACKER
TRANSFER
LINE
EXCHANGER
QUENCH
TOWER
3 STAGES OF
COMPRESSION
CAUSTIC
TOWER
4TH
STAGE
COMPRESSION
DRYERCOOLING
TRAINDEMETHANISER
DEETHANISER
C2 SPLITTER
ACETYLENE
HYDOGENATION
REACTOR
ETHANE
STEAM
WA
TE
R
SODIUM
HYDROXIDE
CH4
UTILITY
C3+
HEAVIERS
95% MOLE
HYDROGEN
RECYCLE
ETHANE
ETHYLENE
H2- UTILITY
Figure 7: Block diagram of ethane steam cracking process using front end de-methanizer scheme.
42
FEED DRUM
1
2
PREHEATER
CRACKER
TRANSFER LINE EXCHANGE
QUENCH TOWER A/B/C
3
5
6
7 8
9
RECIRCULATION HEATER
10
1112
1STAGE COMPRESSOR
INTER-STAGE COOL1 A/B
FLASH DRUM 1
13
14
15
16
2STAGE COMPRESSOR
INTER-STAGE COOL2
FLASH DRUM 2 FLASH DRUM 3
3STAGE COMPRESSOR
INTER-STAGE COOL317
18
19
20 21
22
23
24
CAUSTIC SCRUBBER
26
25
27
4STAGE COMPRESSOR INTER-STAGE COOL4
REFRIGERATION COOLER
DRYER
28
29
30
31
COOL TRAIN HX3 A/B/CCOOL TRAIN HX2
COOL TRAIN HX4 COOL TRAIN HX5
COOL TRAIN HX7 COOL TRAIN HX8
COOL-FLASH 1
COOL-FLASH 2
COOL-FLASH 3
34
35
COOL TRAIN HX1
COOL TRAIN HX6 A/B
3738
363233
41
COOL TRAIN HX9
42 43
44
40
45
46
47
48
DEMETHANIZER
REBOILER 1
52
53
CONDENSOR 1
EXPANDER
54
55
56
DEETHANIZER
CONDENSOR 2 A/B
REBOILER 2
60
C2 SPLITTER I & II
ACETYLENE HYDROGENATOR
61
51
50
CONDENSOR 3 IA/IB/IIA/IIB
63
REBOILER 3 I/II
62
39
49
58
59
ACETYLENE PREHEATER
57
4
Figure 8: Process flow diagram of ethane steam cracking process.

43
The process flow diagram of the ethane cracking process obtained after ASPEN
simulation is given above in Figure 8. Along with process simulation data, design
specifications were also given for each class of equipment. All equipment were
simulated and optimized to account for balanced energy consumption, product purity,
operation, design and safety considerations. Design of equipment was done using a top
level analysis. For columns, compressors and heat exchangers, primary design data were
fetched from ASPEN models. The assumptions made for design of certain class of
equipment are listed below.
III.1.1. Assumptions
i. A pressure drop of 0.5 bar is assumed for all heat exchangers.
ii. The convection and radiation section of the furnace are shown in separate
blocks: preheater for convection and RSTOIC models for reactor.
iii. Ethane fresh feed is assumed to contain only 0.1 wt% of carbon dioxide
as impurity and is available at 25 0C and 19 bar pressure.
iv. The off-gas generated in the process is considered in the form of
equivalent amount of natural gas required for heating and is balanced in
the final energy of fuel required.
v. Caustic scrubbing was modeled as a RSTOIC reactor where 100 %
conversion of carbon dioxide is assumed. Design of caustic scrubber was
done based on 27 trays separately in RADFRAC.

44
vi. All heat exchangers are assumed to be shell and tube type. Heat transfer
areas were calculated from ASPEN PLUS. A minimum temperature
approach of 5 0C is assumed for refrigeration operations and 7
0C for
other exchangers. Heat exchanger volume was determined by assuming a
surface area density of 100.(Shah Se uli , 2 3) The formula for
calculating volume is given by: (Shah Se uli , 2 3)
Volume = Heat transfer area / surface area density
vii. The rule of thumb for maximum heat transfer area is 1000 m2.(Branan,
2012) Any heat exchanger exceeding this value was split accordingly into
parallel heat exchangers.
viii. Similarly the maximum allowable column diameter was assumed to be 6.
Any column exceeding this value was split accordingly into parallel
columns.
ix. Volume of reactors are found using literature value for residence time.
Liquid residence time for half full flash vessels is assumed to be 5 min
according rule of thumb.(Coker, 2007) Approximate volume of column is
calculated using the formula:
Volume = π * (Column diameter) 2 * Height of column / 4
Height of column = No of trays * tray spacing + 10 feet
Default tray spacing of 0.6096m was assumed for columns.(Chuang &
Nandakumar, 2000)
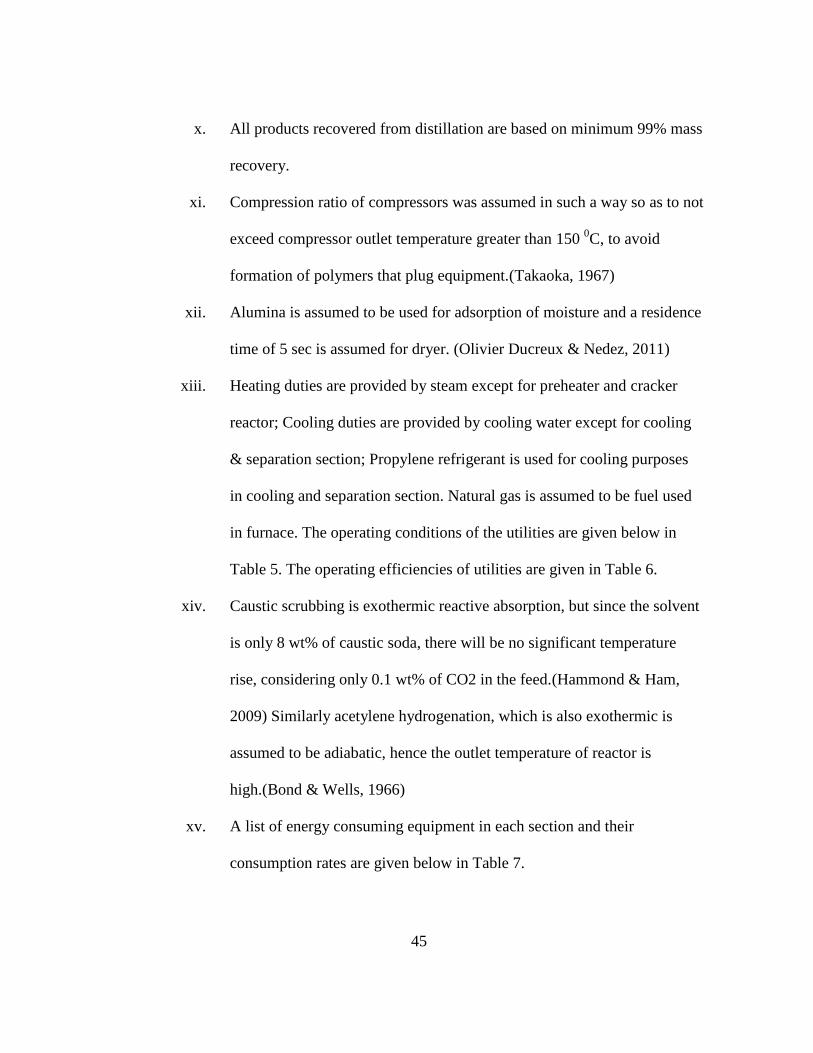
45
x. All products recovered from distillation are based on minimum 99% mass
recovery.
xi. Compression ratio of compressors was assumed in such a way so as to not
exceed compressor outlet temperature greater than 150 0C, to avoid
formation of polymers that plug equipment.(Takaoka, 1967)
xii. Alumina is assumed to be used for adsorption of moisture and a residence
time of 5 sec is assumed for dryer. (Olivier Ducreux & Nedez, 2011)
xiii. Heating duties are provided by steam except for preheater and cracker
reactor; Cooling duties are provided by cooling water except for cooling
& separation section; Propylene refrigerant is used for cooling purposes
in cooling and separation section. Natural gas is assumed to be fuel used
in furnace. The operating conditions of the utilities are given below in
Table 5. The operating efficiencies of utilities are given in Table 6.
xiv. Caustic scrubbing is exothermic reactive absorption, but since the solvent
is only 8 wt% of caustic soda, there will be no significant temperature
rise, considering only 0.1 wt% of CO2 in the feed.(Hammond & Ham,
2009) Similarly acetylene hydrogenation, which is also exothermic is
assumed to be adiabatic, hence the outlet temperature of reactor is
high.(Bond & Wells, 1966)
xv. A list of energy consuming equipment in each section and their
consumption rates are given below in Table 7.

46
Table 5: List of utilities and utility operating conditions.
S. No Utility Temperature Pressure
Deg C bar
1 Steam 158 6
2 Natural Gas 25 2
3 Propylene refrigerant -45 -
4 Propylene refrigerant -101 -
5 Propylene refrigerant -156 -
6 Cooling water 30 -
7 Chilled water 15 -
Table 6: Process efficiency values of utilities.
Process Efficiency Assumptions
Natural Gas - Thermal efficiency 60%
Cooling water- Cooling efficiency 100%
Compressor- shaft efficiency 45%
Total compressor efficiency – shaft power from natural gas 27%
Refrigeration efficiency 100%
Steam- Heating efficiency- Produced from natural gas 60%
Table 7: List of energy consuming equipment and their consumption rates- ethane
cracking process.
S.
NO SECTION Units named in PFD
Type of utility
used
Actual
energy
require
ments
MMBt
u/hr
1 PYROLY
SIS
PREHEATER Natural gas 699
2 CRACKER Natural gas 697
3 TRANSFER LINE EXCHANGE cooling water 388
4
RECIRCULATION HEATER cooling water 272
5 INTERSTAGE COOL1-A cooling water 32

47
Table 7: Continued.
S.
NO SECTION Units named in PFD
Type of utility
used
Actual
energy
require
ments
MMBt
u/hr
6
COMPRES
SION
SECTION
INTERSTAGE COOL1-B cooling water 32
7 INTERSTAGE COOL2 cooling water 40
8 INTERSTAGE COOL3 cooling water 35
9 INTERSTAGE COOL4 cooling water 36
10 1ST STAGE COMPRESSOR Power 131
11 2ND STAGE COMPRESSOR Power 126
12 3RD STAGE COMPRESSOR Power 124
13 4TH STAGE COMPRESSOR Power 117
14
SEPARATI
ON
SECTION
REFRIGERATION COOLER Chilled water 14
15 COOL TRAIN HX3-A refrigerant 10
16 COOL TRAIN HX3-B refrigerant 10
17 COOL TRAIN HX3-C refrigerant 10
18 COOL TRAIN HX6-A refrigerant 24
19 COOL TRAIN HX6-A refrigerant 24
20 COOL TRAIN HX9 refrigerant 8
21 CONDENSOR 1 refrigerant 5
22 REBOILER 1 Steam 57
23 CONDENSOR 2-A refrigerant 41
24 CONDENSOR 2-B refrigerant 41
25 REBOILER 2 Steam 133
26 ACETYLENE PREHEATER Steam 102
27 CONDENSOR 3-I-A refrigerant 45
28 CONDENSOR 3-I-B refrigerant 45
29 CONDENSOR 3-II-A refrigerant 45
30 CONDENSOR 3-II-B refrigerant 45
31 REBOILER 3-I Steam 83
32 REBOILER 3-II Steam 83
Total 3551
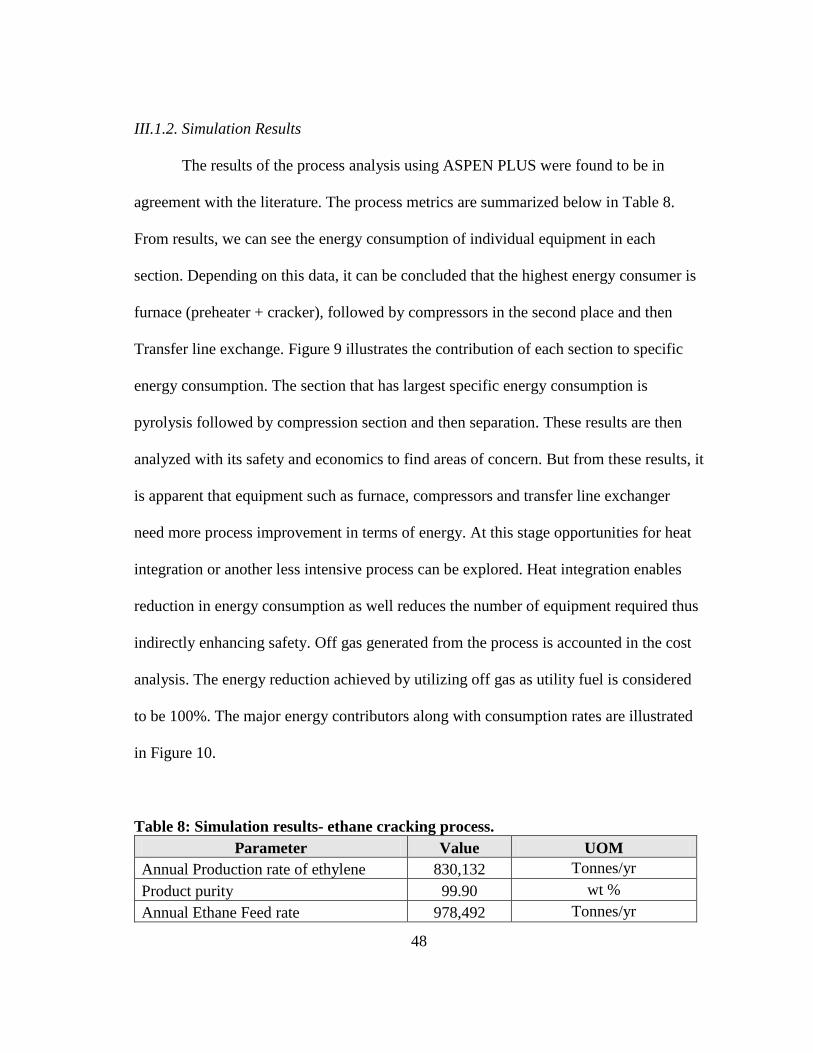
48
III.1.2. Simulation Results
The results of the process analysis using ASPEN PLUS were found to be in
agreement with the literature. The process metrics are summarized below in Table 8.
From results, we can see the energy consumption of individual equipment in each
section. Depending on this data, it can be concluded that the highest energy consumer is
furnace (preheater + cracker), followed by compressors in the second place and then
Transfer line exchange. Figure 9 illustrates the contribution of each section to specific
energy consumption. The section that has largest specific energy consumption is
pyrolysis followed by compression section and then separation. These results are then
analyzed with its safety and economics to find areas of concern. But from these results, it
is apparent that equipment such as furnace, compressors and transfer line exchanger
need more process improvement in terms of energy. At this stage opportunities for heat
integration or another less intensive process can be explored. Heat integration enables
reduction in energy consumption as well reduces the number of equipment required thus
indirectly enhancing safety. Off gas generated from the process is accounted in the cost
analysis. The energy reduction achieved by utilizing off gas as utility fuel is considered
to be 100%. The major energy contributors along with consumption rates are illustrated
in Figure 10.
Table 8: Simulation results- ethane cracking process.
Parameter Value UOM
Annual Production rate of ethylene 830,132 Tonnes/yr
Product purity 99.90 wt %
Annual Ethane Feed rate 978,492 Tonnes/yr

49
Table 8: Continued.
Parameter Value UOM
Process yield of ethylene 85 %
Cracker single-pass conversion 60 %
Cracker yield of ethylene 51 wt %
Minimum energy requirements 2,446 MMBtu/hr
Minimum Specific Energy
Consumption 26 MMBtu/tonne of ethylene
Specific consumption of raw material 1.2 Tonne of ethylene/ tonne
of ethane
Figure 9: Specific energy consumption of major sections- ethane cracking process.
50
27
23
Specific Energy Consumption
Pyrolysis Section
Compression Section
Separation Section

50
Figure 10: Major energy contributors- ethane cracking process.
III.2. Pyrolysis of Methane
Natural gas is a clean source of energy and is available in abundance. The
increase in reserves and low cost of natural gas have paved way for exploration of new
methods of converting methane to valuable chemicals rather than using it as
fuel.(Cantrell, Bullin, McIntyre, Butts, & Cheatham, 2013) Also, transportation of
natural gas by liquefaction is expensive and tougher. Hence, opportunities that directly
convert gas to petrochemicals are gaining more focus. One such new technology of that
kind is the Gas to Ethylene Technology or ECLAIRS (Ethylene from concentrated liquid
phase acetylene- Integrated rapid and safe).(Hall, 2005) This new technology utilizes
natural gas to convert it into acetylene, a stable petrochemical intermediate and
0
200
400
600
800
1000
1200
1400
1600
Furnace Compressors TLE
MM
Btu
/hr
Major energy contributors
51
converting the same into ethylene through liquid phase hydrogenation.(Hall, 2005) The
technology is still not commercialized and it is in pilot plant scale. This process claims
to be economical for low gas feed rates as low as 30 kSCMD up to any further larger
scale when compared to traditional GTL processes (Fischer Tropsch), that require larger
gas feed rates of the order of 300 MMSCFD to be economical.(Hall, 2005) Application
of safety and economic evaluation techniques on such a novel process can render useful
in justifying the replacement of one technology over the other. The intermediate
acetylene is produced primarily by subjecting methane to high temperatures at low
pressures. The process called as pyrolysis of methane is a widely used technology
adopted in the manufacture of acetylene and syngas.(Holmen, Olsvik, & Rokstad, 1995)
Since the methane pyrolysis reaction is highly endothermic, and in order to maintain
high reaction temperature heat is supplied to cracker in many different ways such as
partial oxidation of methane, indirect heating in furnace, electric arc furnace and Wullf
pyrolysis process.(Holmen et al., 1995) For our case study, partial oxidation of methane
to acetylene is considered. Partial oxidation method was chosen since it is a practically
feasible, well established process and detailed literature data on chemical kinetics are
available.
The process chemistry of natural gas pyrolysis is explained by the below
mentioned reactions. At high temperatures in the range of 2500 K and low pressures of
about 1 bar, methane undergoes dehydrogenation consequently to form acetylene, a
much stable compound than ethylene at those temperature.(Holmen et al., 1995) The
residence time required for the reaction is as low as 0.01 seconds since, decomposition

52
of acetylene to carbon has to be stopped. Hence, the hot product gases are immediately
quenched using cooling water or quench oil.(Holmen, 2009) Partial oxidation of
methane employs a direct medium of heat transfer by burning part of natural gas feed
with oxygen to produce enough heat to crack the rest of the feed.(Holmen et al., 1995) A
methane to oxygen ratio of 1.65 moles is usually selected, by which approximately 60%
of methane is burned to produce combustion products while 30% is converted to
acetylene. (Wolf, 1992)
i. 2CH4 --------- C2H4 + 2 H2
ii. 2CH4 --------- C2H2 +3 H2
iii. CH4 + O2 -------- CO + H2+ H2O (incomplete combustion)
iv. CO + H2O ------- CO2 + H2
v. C2H2 + CH4 ------ C3H4 + H2
vi. CH4 + 2O2 -------- CO2 + 2 H2O
The main products formed in the partial oxidation method are hydrogen,
acetylene, carbon dioxide, carbon monoxide, ethylene, methane and heaviers.(Pässler et
al., 2012) The products formed are immediately quenched in order of 0.02 milliseconds
to prevent formation of carbon.(Ries, 1966) The reactor yield and feed conversion values
were assumed based on the values given in literatures. (Pässler et al., 2012) The cracker
was simulated using RSTOIC by taking conversion values from chemical reaction
kinetic data and literature studies. The dry gas composition of pyrolysis reactor outlet is
given in Table 9. The conversion values assumed for the above mentioned reactions are
listed in Table 10.

53
Table 9: Reactor yield mole composition- methane pyrolysis.
Components Reactor yield mol %
Hydrogen 54.7
Methane 4.9
Acetylene 8.4
Carbon dioxide 4.8
Ethylene 0.4
Carbon
monoxide 26.4
Propadiene 0.4
Table 10: Conversions of methane pyrolysis reaction using partial oxidation
method.
Reaction
Number Conversion %
Conversion of limiting
reactant
i 1.3 Methane
ii 32 Methane
iii 56 Methane
iv 1.8 Carbon monoxide
v 4 Acetylene
vi. 9 Methane
The entire process is divided into 4 main sections namely; pyrolysis,
compression, solvent separation and product separation. In the pyrolysis section,
preheated natural gas and oxygen undergoes partial oxidation at high temperature in the
cracker to form acetylene and combustion products, which are immediately quenched
using quench water. The quenched gas is further cooled and consequently compressed in
stages to pressures of about 12 bar. Carbon dioxide present in the cooled gas is removed

54
in an amine sweetening unit between two compressor stages. The sweet gas exiting the
compression section is sent into an absorption column where N methyl 2- Pyrrolidine is
used as solvent for absorbing acetylene.(Tabe‐Mohammadi, Villaluenga, Kim, Chan, &
Rauw, 2001) The solvent laden acetylene enters into hydrogenation reactor where
acetylene is converted to ethylene. The tail gas from NMP absorption tower is partially
regulated into a pressure swing adsorption to extract pure hydrogen for using in
hydrogenation reactor.(Peramanu, Cox, & Pruden, 1999) The rest of tail gas is used as
utility fuel. The solvent containing ethylene is now regulated into a series of flash
network for separating solvent from hydrocarbon product mixture and solvent is
recycled back into absorption tower.(Abedi, 2007) The remaining hydrocarbon gas is
compressed again in two stages and sent to two distillation columns, where lighters and
heavier are separated and ethylene product is obtained with 99.99wt% purity.
The block diagram of methane pyrolysis of natural gas using partial oxidation method is
shown in Figure 11. The process flow diagram obtained from Aspen simulation is
illustrated below in Figure 12.
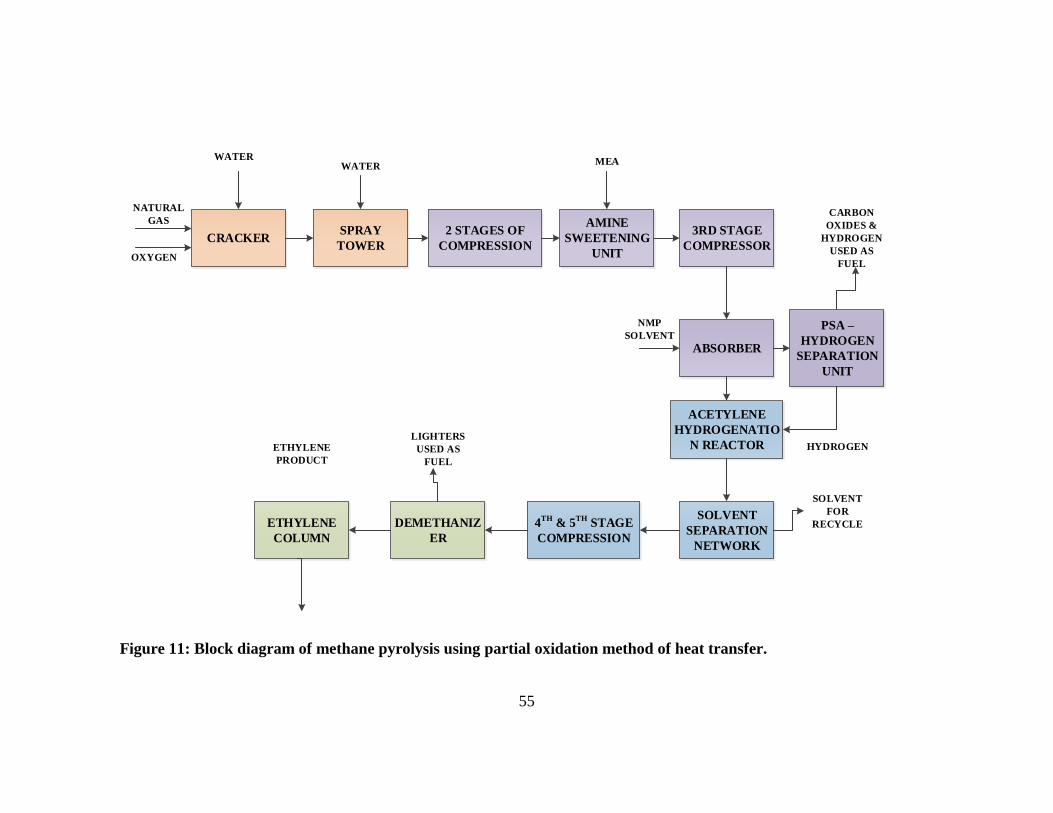
55
CRACKERSPRAY
TOWER
2 STAGES OF
COMPRESSION
ACETYLENE
HYDROGENATIO
N REACTOR
SOLVENT
SEPARATION
NETWORK
ABSORBER
PSA –
HYDROGEN
SEPARATION
UNIT
AMINE
SWEETENING
UNIT
DEMETHANIZ
ER
ETHYLENE
COLUMN
NATURAL
GAS
OXYGEN
WATERWATER
NMP
SOLVENT
CARBON
OXIDES &
HYDROGEN
USED AS
FUEL
HYDROGEN
SOLVENT
FOR
RECYCLE
MEA
ETHYLENE
PRODUCT
LIGHTERS
USED AS
FUEL
4TH
& 5TH
STAGE
COMPRESSION
3RD STAGE
COMPRESSOR
Figure 11: Block diagram of methane pyrolysis using partial oxidation method of heat transfer.
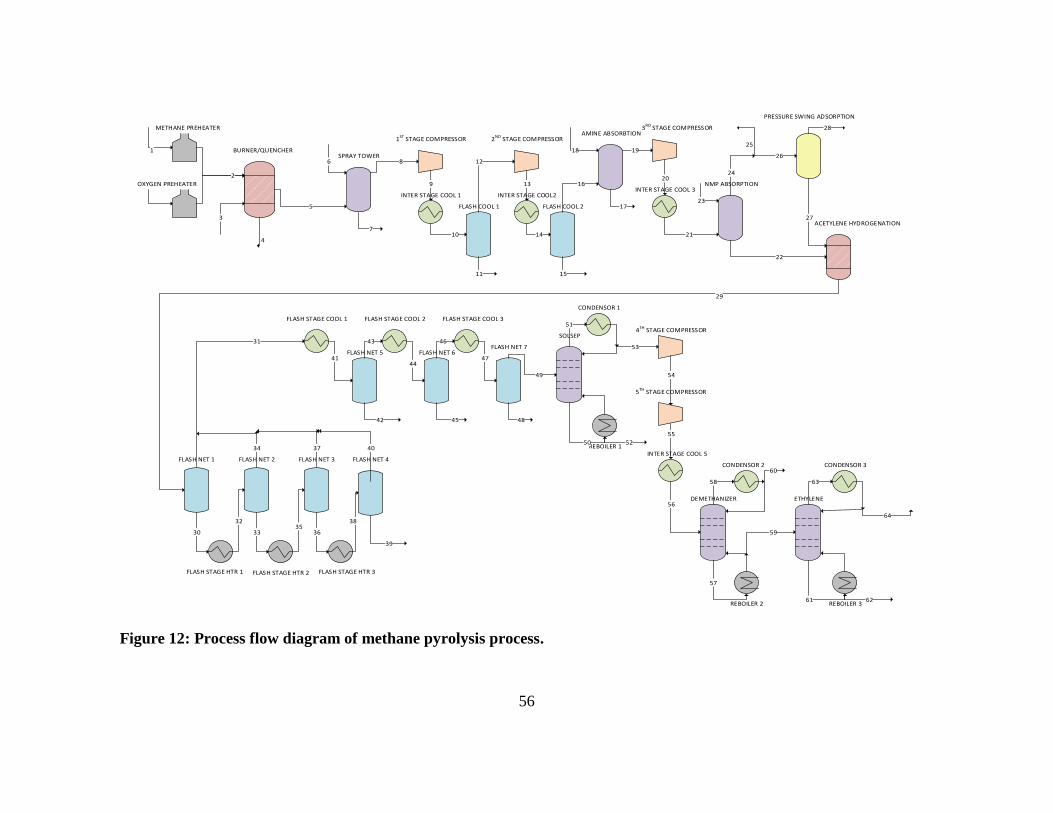
56
BURNER/QUENCHER
3
1
4
5
SPRAY TOWER6
7
8
1ST STAGE COMPRESSOR
INTER STAGE COOL 1
FLASH COOL 1
2ND STAGE COMPRESSOR
INTER STAGE COOL2
FLASH COOL 2
AMINE ABSORBTION3RD STAGE COMPRESSOR
INTER STAGE COOL 3NMP ABSORPTION
PRESSURE SWING ADSORPTION
9
10
11
12
13
14
15
16
18
17
19
20
21
22
24
23
25
26
27
28
ACETYLENE HYDROGENATION
FLASH NET 1
FLASH STAGE HTR 1
FLASH NET 2
FLASH STAGE HTR 2
FLASH NET 3
FLASH STAGE HTR 3
FLASH NET 4
FLASH STAGE COOL 1
FLASH NET 5
FLASH STAGE COOL 2
FLASH NET 6FLASH NET 7
FLASH STAGE COOL 3
SOLSEP4TH STAGE COMPRESSOR
5TH STAGE COMPRESSOR
INTER STAGE COOL 5
DEMETHANIZER ETHYLENE
CONDENSOR 1
CONDENSOR 2 CONDENSOR 3
REBOILER 2
REBOILER 1
REBOILER 3
29
30
3235
36
38
39
31
34 4037
41
42
43
44
45
46
47
48
49
51
53
50
54
52
55
56
58
60
57
59
63
64
61 62
33
METHANE PREHEATER
OXYGEN PREHEATER
2
Figure 12: Process flow diagram of methane pyrolysis process.
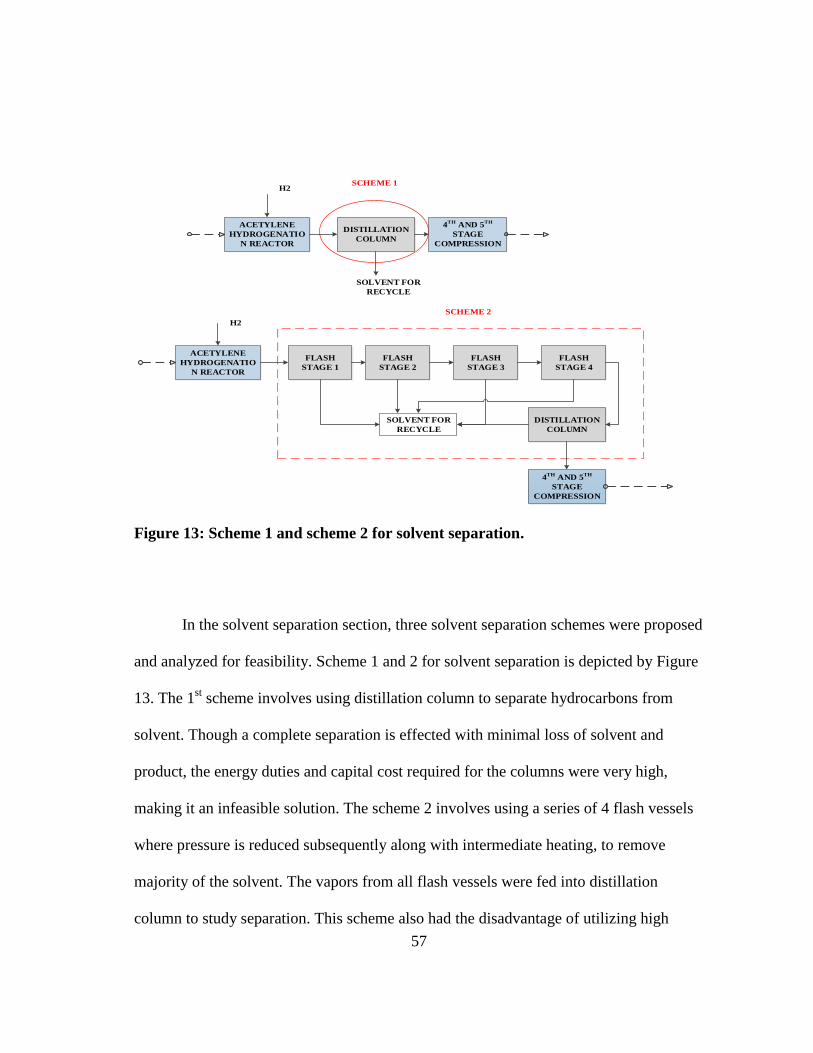
57
ACETYLENE
HYDROGENATIO
N REACTOR
H2
SOLVENT FOR
RECYCLE
4TH
AND 5TH
STAGE
COMPRESSION
DISTILLATION
COLUMN
ACETYLENE
HYDROGENATIO
N REACTOR
H2
4TH
AND 5TH
STAGE
COMPRESSION
FLASH
STAGE 1
FLASH
STAGE 2
FLASH
STAGE 3
FLASH
STAGE 4
DISTILLATION
COLUMN
SOLVENT FOR
RECYCLE
SCHEME 2
SCHEME 1
Figure 13: Scheme 1 and scheme 2 for solvent separation.
In the solvent separation section, three solvent separation schemes were proposed
and analyzed for feasibility. Scheme 1 and 2 for solvent separation is depicted by Figure
13. The 1st scheme involves using distillation column to separate hydrocarbons from
solvent. Though a complete separation is effected with minimal loss of solvent and
product, the energy duties and capital cost required for the columns were very high,
making it an infeasible solution. The scheme 2 involves using a series of 4 flash vessels
where pressure is reduced subsequently along with intermediate heating, to remove
majority of the solvent. The vapors from all flash vessels were fed into distillation
column to study separation. This scheme also had the disadvantage of utilizing high

58
energies in reboilers and condensers and also required huge capital investment and
hence, this scheme was not selected.
ACETYLENE
HYDROGENATIO
N REACTOR
H2
4TH
AND 5TH
STAGE
COMPRESSION
FLASH
STAGE 1
FLASH
STAGE 2
FLASH
STAGE 3
FLASH
STAGE 4
MIXER
SCHEME 3
FLASH
STAGE 5
FLASH
STAGE 6
FLASH
STAGE 7
DISTILLATION
COLUMN
SOLVENT
RECYCLE
SOLVENT
RECYCLE
Figure 14: Scheme 3 proposed for solvent separation.
Scheme 3 of solvent separation is shown in Figure 14. Scheme 3 is a continuation
of scheme 2, where the vapors collected from 4 flash vessels are cooled in 3 stages of
flash vessels and finally when the hydrocarbon to solvent composition is about 50 mole
%, a distillation column is used to separate the same. This scheme proved to be energy
efficient and also reduced the capital cost. Hence, this scheme is selected for developing
process flow diagram. A comparison chart of 3 schemes are shown below in Table 11.
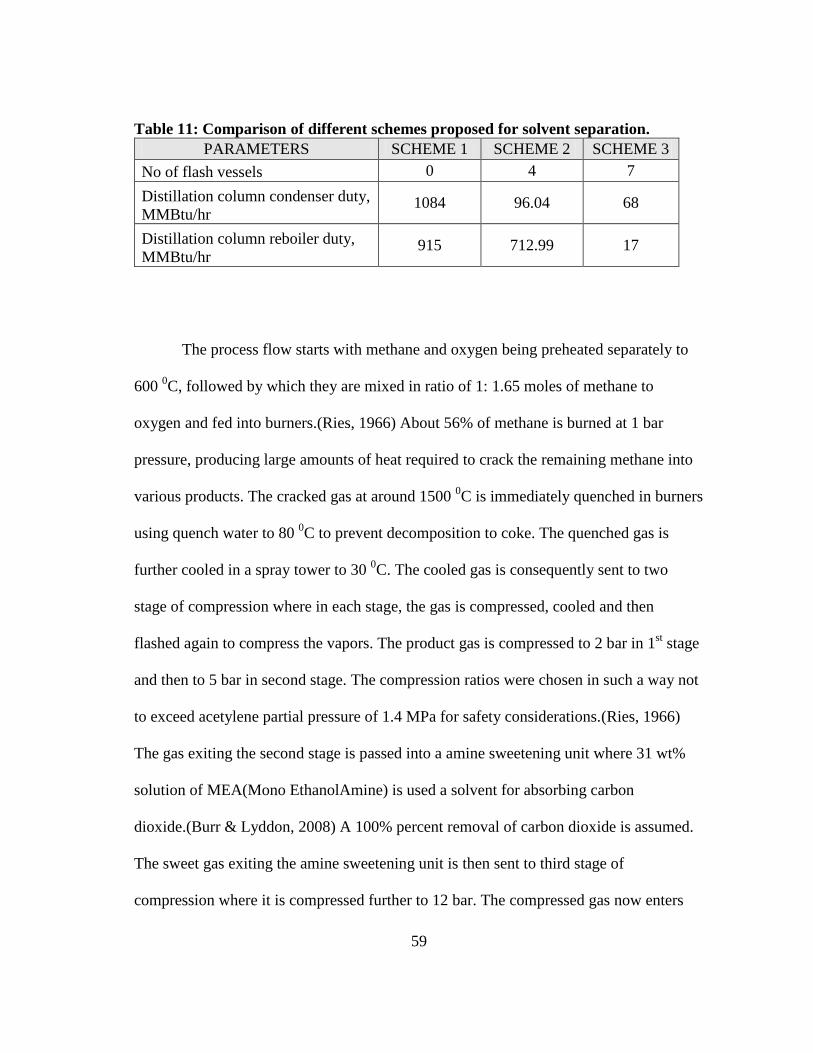
59
Table 11: Comparison of different schemes proposed for solvent separation.
PARAMETERS SCHEME 1 SCHEME 2 SCHEME 3
No of flash vessels 0 4 7
Distillation column condenser duty,
MMBtu/hr 1084 96.04 68
Distillation column reboiler duty,
MMBtu/hr 915 712.99 17
The process flow starts with methane and oxygen being preheated separately to
600 0C, followed by which they are mixed in ratio of 1: 1.65 moles of methane to
oxygen and fed into burners.(Ries, 1966) About 56% of methane is burned at 1 bar
pressure, producing large amounts of heat required to crack the remaining methane into
various products. The cracked gas at around 1500 0C is immediately quenched in burners
using quench water to 80 0C to prevent decomposition to coke. The quenched gas is
further cooled in a spray tower to 30 0C. The cooled gas is consequently sent to two
stage of compression where in each stage, the gas is compressed, cooled and then
flashed again to compress the vapors. The product gas is compressed to 2 bar in 1st stage
and then to 5 bar in second stage. The compression ratios were chosen in such a way not
to exceed acetylene partial pressure of 1.4 MPa for safety considerations.(Ries, 1966)
The gas exiting the second stage is passed into a amine sweetening unit where 31 wt%
solution of MEA(Mono EthanolAmine) is used a solvent for absorbing carbon
dioxide.(Burr & Lyddon, 2008) A 100% percent removal of carbon dioxide is assumed.
The sweet gas exiting the amine sweetening unit is then sent to third stage of
compression where it is compressed further to 12 bar. The compressed gas now enters

60
into absorption tower where chilled solvent, N methyl 2- Pyrrolidine at -50 0C is used for
absorbing acetylene.(Gattis et al., 2004) A 95% mass recovery of acetylene is assumed
to optimize the capital cost and operating cost of the tower. The tail gas devoid of
acetylene is separated into two streams where one stream is sent to utility for fuel use
while other stream is sent to pressure swing adsorption for extracting 99.9% pure
hydrogen. The pure hydrogen stream is regulated back into acetylene hydrogenation
reactor while the remaining off gas is sent as utility fuel.
The solvent laden acetylene enters the acetylene hydrogenation reactor, where
acetylene is converted into ethylene in the presence of catalyst at liquid phase.(Gattis et
al., 2004) The reaction chemistry is same as gas phase hydrogenation. The product
exiting the reactor is at 88 0C and 11 bar pressure and this is regulated into solvent
separation section. The solvent laden product is a mixed phase and hence is flashed in 4
flash columns with a pressure reduction of 2 bar for each flash vessels along with
intermediate heating. The stream had to be heated due to the presence of large amount of
solvent. Flash vessels 1,2,3 and 4 are operated at a temperature of 88 0C, 100
0C, 110
0C
and 120 0C, and pressures of 10 bar, 8 bar, 6 bar and 4 bar respectively. The liquid from
each flash were regulated to subsequent flash drums and finally the liquid collected from
the 4th flash vessel that contain approximately 99.5 wt% solvent are assumed to be
directly recycled. The vapors from all 4 flash drums are mixed, cooled and flashed in
three stages. These vapors are cooled in these stages because the solvent concentration
has reduced significantly. Flash vessel 5, 6 and 7 are operated at temperatures 102 0C, 95
0C and 85
0C with no significant pressure reduction.
61
The vapors from each flash drum is regulated to subsequent flash drums and the
final vapor exiting flash 7 is sent into distillation column, SOLSEP operating at 3 bar
with top temperature of -72 0C and bottom temperature of 19
0C. The liquids collected
from all the three flash drums 5, 6 and 7 contain 99.5wt% of solvent and are recycled.
The vapor distillate from SOLSEP column is regulated into two 4th
and 5th
stage of
compression in order to prepare for effective separation in product separation section.
Meanwhile the bottoms of SOLSEP containing 99.99wt% of solvent is again recycled
back to NMP absorption tower. The product gas is compressed to 12 bar in 4th
stage and
30 bar in 5th
stage. The hot gas exiting 5th
stage compressor is then cooled in a cooling
water heat exchanger and sent into de-methanizer column.
The de-methanizer column operates at 30 bar, with top temperature at -116 0C
and bottom temperature of -12 0C. The vapor distillate containing predominantly
methane, carbon monoxide and hydrogen are used as utility fuel. The bottoms of de-
methanizer column are then regulated into ethylene column where ethylene is removed
as liquid distillate, while heaviers are removed at bottom. The column operates at 25 bar
pressure with top temperature of -20 0C and bottom temperature of 77
0C. A product
purity of 99.99 wt% is obtained. The heating utilities for the columns and heat
exchangers are supplied by saturated steam at 6 bar pressure. The cooling utilities for
inter-stage cooling exchangers are supplied by cooling water, while propylene
refrigerant is used for condensers in columns. The process efficiencies and utilities used
are same as those used for ethane cracking technology. All equipment were simulated to
62
give optimized values of energy consumption. The general assumptions considered for
this process are given below.
III.2.1. Assumptions
i. The natural gas feed is assumed to be sweet and contain 100 % methane.
ii. 100 % pure oxygen is assumed to be available as feed.
iii. Heat duties of methane and oxygen preheaters are rendered by indirect
heating furnaces using natural gas as utility fuel.
iv. Amine sweetening tower was modeled by using RSTOIC and 100 %
conversion of CO2 is assumed. The design of amine absorber was done
separately by assuming 20 trays in RADFRAC.
v. Acetylene conversion to ethylene in acetylene hydrogenation reactor was
assumed to be 100%. The reactor is considered adiabatic and owing to
exothermic reaction of acetylene hydrogenation, the reactor outlet
temperature increases.
vi. All distillation columns were simulated for more than 99% mass recovery
of products.
vii. Residence time of 200 seconds is assumed for pressure swing adsorption
cycle.(Jain, Moharir, Li, & Wozny, 2003)
viii. Residence time of both gas phase and liquid phase acetylene
hydrogenation reaction is assumed to be 20 seconds. (Anderson, 1967)

63
ix. Only the main stream process equipment were considered hence, the
recovery units and utility treatment units were not considered for
evaluation of energy consumption.
x. A list of energy consuming equipment in each section and their
consumption rates are given below in Table 12.
Table 12: List of energy consuming equipment and rate of energy consumptions-
methane pyrolysis process.
S.
NO SECTION Units named in PFD
Type of
utility used
Actual
heat
requirem
ents
MMBtu/h
r
1
PYROLYSI
S
METHANE PREHEATER Natural gas 1105
2 OXYGEN PREHEATER Natural gas 445
3 REACTOR QUENCHER cooling water 2239
4 SPRAY TOWER COOLER cooling water 1441
5
COMPRES
SION
INTERCOOL STAGE 1-A cooling water 51
6 INTERCOOL STAGE 1-B cooling water 50
7 INTERCOOL STAGE 1-C cooling water 50
8 INTERCOOL STAGE 1-D cooling water 50
9 INTERCOOL STAGE 2-A cooling water 55
10 INTERCOOL STAGE 2-B cooling water 55
11 INTERCOOL STAGE 2-C cooling water 57
12 INTERCOOL STAGE 3-A cooling water 72
13 INTERCOOL STAGE 3-B cooling water 72
14 1ST STAGE COMPRESSOR Power 550
15 2ND STAGE COMPRESSOR Power 536
16 3RD STAGE COMPRESSOR Power 531
17 4TH STAGE COMPRESSOR Power 50
18 5TH STAGE COMPRESSOR Power 45
19
FLASH STAGE 1 HTR Steam 130
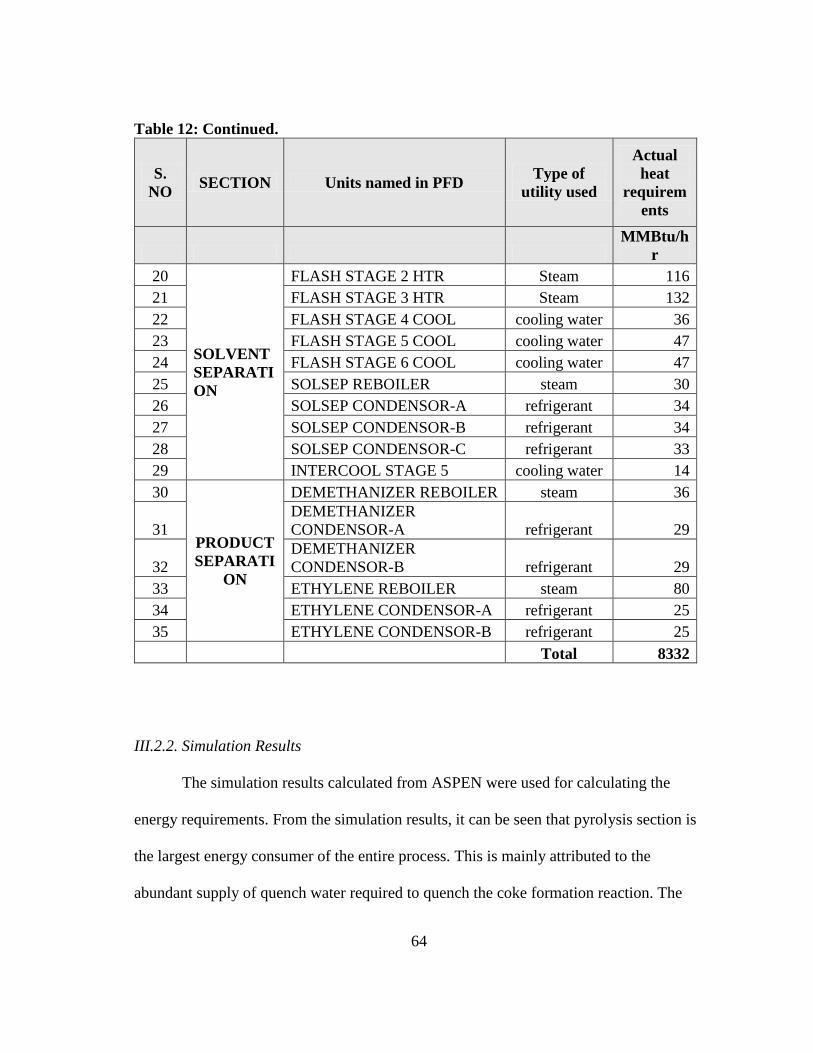
64
Table 12: Continued.
S.
NO SECTION Units named in PFD
Type of
utility used
Actual
heat
requirem
ents
MMBtu/h
r
20
SOLVENT
SEPARATI
ON
FLASH STAGE 2 HTR Steam 116
21 FLASH STAGE 3 HTR Steam 132
22 FLASH STAGE 4 COOL cooling water 36
23 FLASH STAGE 5 COOL cooling water 47
24 FLASH STAGE 6 COOL cooling water 47
25 SOLSEP REBOILER steam 30
26 SOLSEP CONDENSOR-A refrigerant 34
27 SOLSEP CONDENSOR-B refrigerant 34
28 SOLSEP CONDENSOR-C refrigerant 33
29 INTERCOOL STAGE 5 cooling water 14
30
PRODUCT
SEPARATI
ON
DEMETHANIZER REBOILER steam 36
31
DEMETHANIZER
CONDENSOR-A refrigerant 29
32
DEMETHANIZER
CONDENSOR-B refrigerant 29
33 ETHYLENE REBOILER steam 80
34 ETHYLENE CONDENSOR-A refrigerant 25
35 ETHYLENE CONDENSOR-B refrigerant 25
Total 8332
III.2.2. Simulation Results
The simulation results calculated from ASPEN were used for calculating the
energy requirements. From the simulation results, it can be seen that pyrolysis section is
the largest energy consumer of the entire process. This is mainly attributed to the
abundant supply of quench water required to quench the coke formation reaction. The

65
energy consumption was calculated on basis of energy required to cool the exit quench
water from reactor. It can also be seen that solvent and product separation energy
consumptions are considerable low. Literature studies show different methods of heat
recovery in acetylene cracker quench part by using different quench fluid such as oil or
hydrocarbon such that effective utilization of the energy removed can be done.(Ries,
1966) In this case study water without heat recovery is analyzed. The process metrics
that define the process technology are also shown below in Table 13. Following the
reactor, compressors also contribute to large energy consumption, which is again
followed by spray tower. Heat integration opportunities can be widely explored to
reduce the minimum energy consumption in pyrolysis and compression section. One of
the major limitations of using direct heat integration in pyrolysis section is the short
residence time required for quench water. A total ethylene recovery of 95% is calculated
based on the acetylene and ethylene available at reactor outlet compared to ethylene
column product flow rate. The recovery is low because much of potential acetylene is
lost in NMP absorption section. A large amount of off gas is generated in this process
primarily constituting of hydrogen and carbon monoxide. This has been accounted in the
cost analysis. Specific consumption is based on natural gas that is used for partial
oxidation also. If methane that is utilized only for pyrolysis is considered, specific
consumption will go down to 1.5 tonnes of methane/tonne of ethylene. Figure 15 shows
the contribution of each section to specific energy consumption. Figure 16 shows the list
of highest energy contributors along with their consumption rates.
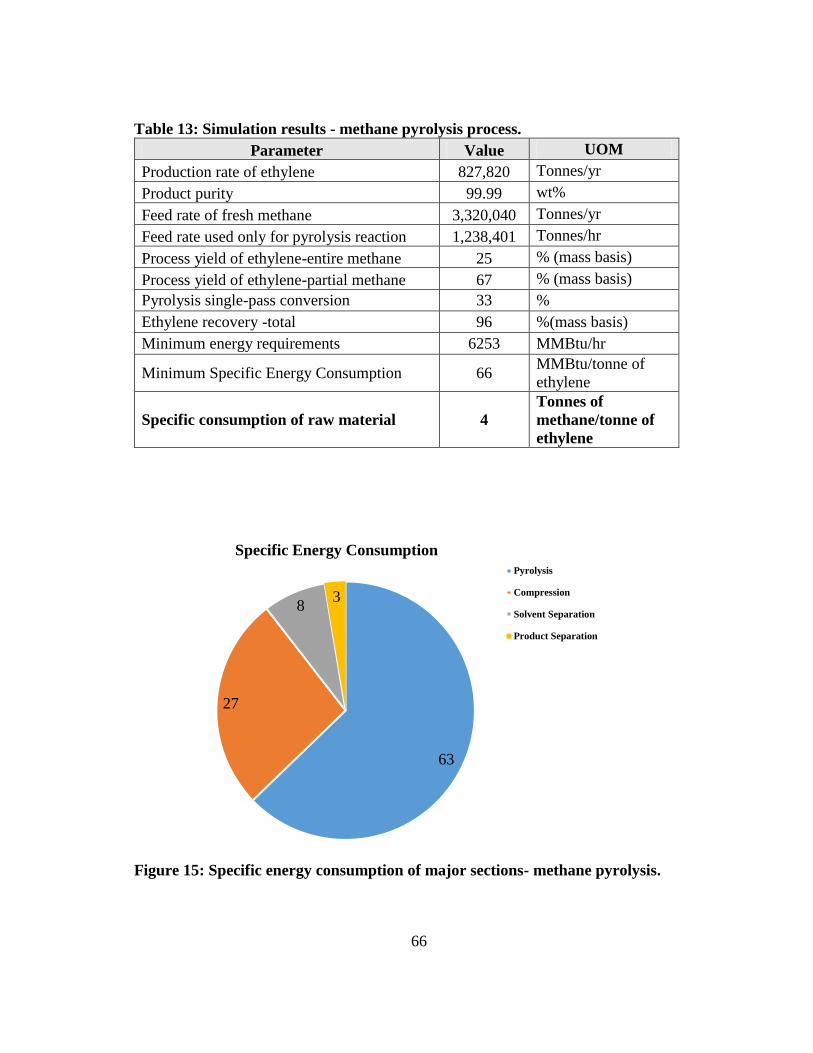
66
Table 13: Simulation results - methane pyrolysis process.
Parameter Value UOM
Production rate of ethylene 827,820 Tonnes/yr
Product purity 99.99 wt%
Feed rate of fresh methane 3,320,040 Tonnes/yr
Feed rate used only for pyrolysis reaction 1,238,401 Tonnes/hr
Process yield of ethylene-entire methane 25 % (mass basis)
Process yield of ethylene-partial methane 67 % (mass basis)
Pyrolysis single-pass conversion 33 %
Ethylene recovery -total 96 %(mass basis)
Minimum energy requirements 6253 MMBtu/hr
Minimum Specific Energy Consumption 66 MMBtu/tonne of
ethylene
Specific consumption of raw material 4
Tonnes of
methane/tonne of
ethylene
Figure 15: Specific energy consumption of major sections- methane pyrolysis.
63
27
8 3
Specific Energy Consumption
Pyrolysis
Compression
Solvent Separation
Product Separation
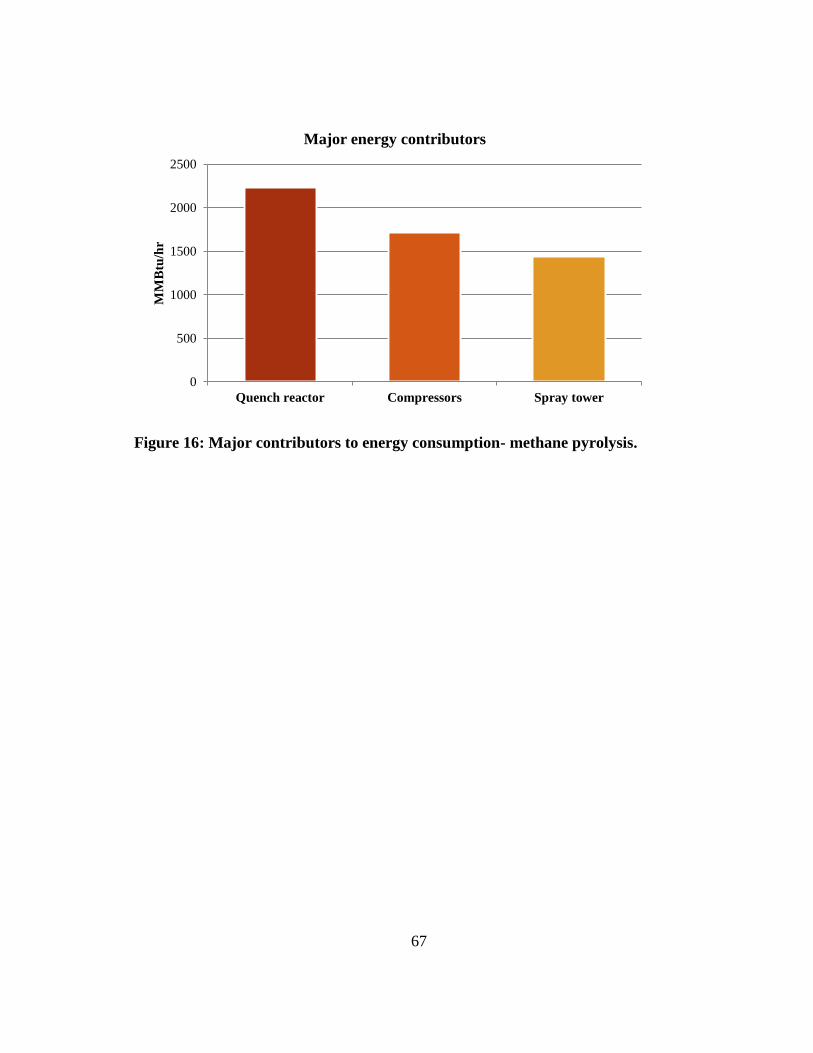
67
Figure 16: Major contributors to energy consumption- methane pyrolysis.
0
500
1000
1500
2000
2500
Quench reactor Compressors Spray tower
MM
Btu
/hr
Major energy contributors

68
CHAPTER IV
ECONOMIC ANALYSIS
In this chapter, a top level economic analysis using shortcut tools are used to
evaluate the economics of operation of both the plants. Fixed and operating costs of the
plants are calculated based on the production capacity of each plant, energy consumption
and cost of raw material and utility. The cost of maintenance or labor will not be
included as a part of the operating cost in this study. The utility assumptions made are in
accordance to the general range of prices as given in the literature (El-Halwagi, 2012).
The price of raw material is taken from energy information administration (EIA) and
ICIS website.
IV.1. Ethane Cracking
In the ethane cracking process, the major raw material used is cracker feed
ethane. The cost of ethane is found by taking an average of NGL- ethane trend from
energy information association website. Table 14 shows the estimation of raw material
cost. A comparison of price between naphtha and ethane is made to justify the use of
ethane as feedstock. From the results, it can be found that the cost of ethane is 5 times
higher than Naphtha price and hence, ethane is highly favorable than naphtha as
feedstock for producing ethylene. The prices were taken as average value of predicted
trend in EIA website. Table 15 shows the consolidated cost metrics obtained for the

69
plant. Table 16 shows the operating cost of each equipment that was calculated
according to the actual consumption in the plant.
Table 14: Estimation of raw material cost - Ethane steam cracking.
Parameter Value UOM
Specific gravity of Naptha 0.75
Density of Naphtha 46.8 lb/ft3
Average Price of Gasoline 3.5 $/gal
Average Price of Crude Oil (barrell) 100 $/bbl
Average Price of Crude Oil (Gallon) 2.3 $/gal
Assuming price of Naphtha price 3 $/gal
Average Price of Naphtha (cubic foot) 22 $/ft3
Average Price of Naphtha (Pound basis) 0.48 $/lb
Average Price of Naphtha (kg) 1.1 $/kg naphtha
Specific Consumption of Naphtha to ethylene 2.86 kg/kg ethylene
Amount of Naphtha required 272 Tonnes/hr
Price of Naphtha 288334 $/hr
Gross heating Value of ethane 1783 Btu/SCF
Average Price of NGL - Ethane 4 $/MMBtu
Basis of 1 MMBtu (SCF) 560.9 SCF ethane
Basis of 1 MMBtu (kg) 20.2 kg of ethane
Average Price of NGL - Ethane (kg) 0.2 $/kg ethane
Amount of ethane required 112 Tonnes/hr
Price of ethane 22171 $/hr
Table 15: Consolidated cost data- Ethane cracking process.
Parameter Value UOM
Cost of Energy 526.6 Million $/yr
Cost of Raw material 195.2 Million $/yr
Total Operating Cost 721.8 Million $/yr
Fixed Capital Cost 870.8 Million $/yr
Annual sales of product 1336.2 Million $/yr
Economic Gross Potential 1141 Million $/yr

70
Table 16: Operating cost of equipment- ethane cracking.
SECTION Units named in PFD Total cost
of utility
$/hr
PYROLYSIS
PREHEATER 2797
CRACKER 2788
TRANSFER LINE EXCHANGE 775
COMPRESSION
SECTION
RECIRCULATION HEATER 544
INTERSTAGE COOL1-A 64
INTERSTAGE COOL1-B 64
INTERSTAGE COOL2 80
INTERSTAGE COOL3 70
INTERSTAGE COOL4 72
1ST STAGE COMPRESSOR 523
2ND STAGE COMPRESSOR 505
3RD STAGE COMPRESSOR 495
4TH STAGE COMPRESSOR 469
SEPARATION
SECTION
REFRIGERATION COOLER 283
COOL TRAIN HX3-A 192
COOL TRAIN HX3-B 192
COOL TRAIN HX3-C 198
COOL TRAIN HX6-A 471
COOL TRAIN HX6-A 471
COOL TRAIN HX9 164
CONDENSOR 1 97
REBOILER 1 9702
CONDENSOR 2-A 826
CONDENSOR 2-B 826
REBOILER 2 17640
ACETYLENE PREHEATER 8820
CONDENSOR 3-I-A 898
CONDENSOR 3-I-B 898
CONDENSOR 3-II-A 898
CONDENSOR 3-II-B 898
REBOILER 3-I 11907
REBOILER 3-II 11907
TOTAL OFF-GAS GENERATION -4757
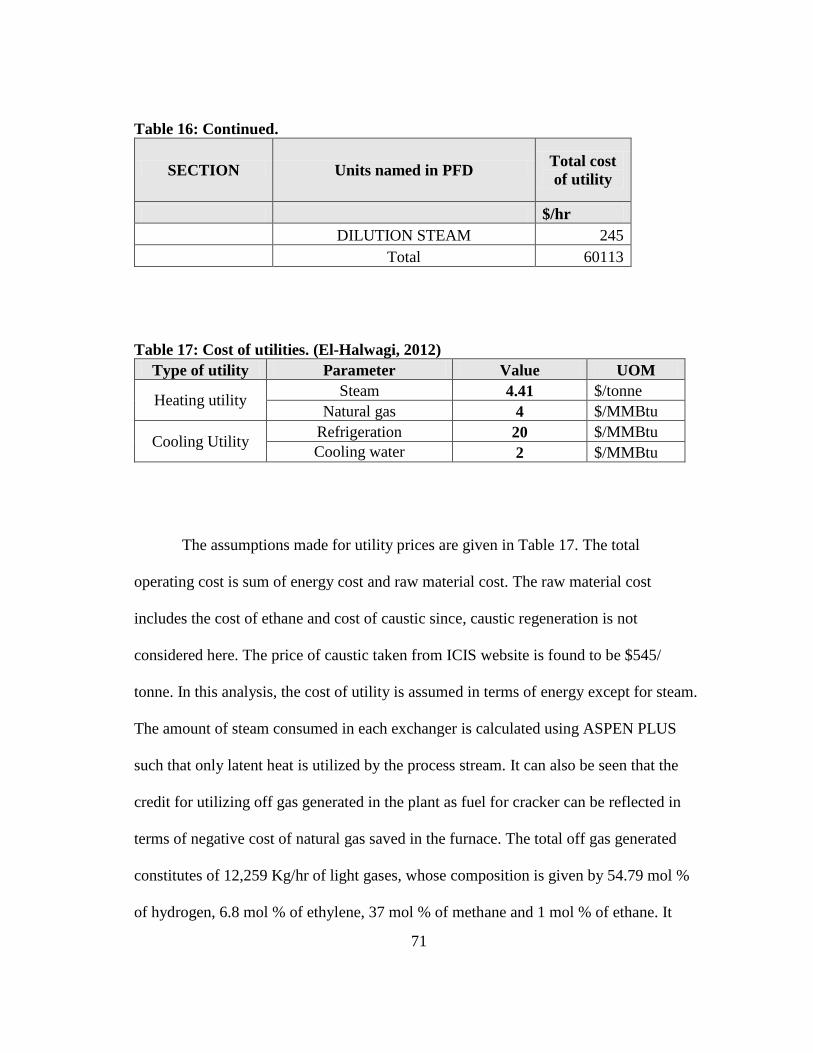
71
Table 16: Continued.
SECTION Units named in PFD Total cost
of utility
$/hr
DILUTION STEAM 245
Total 60113
Table 17: Cost of utilities. (El-Halwagi, 2012)
Type of utility Parameter Value UOM
Heating utility Steam 4.41 $/tonne
Natural gas 4 $/MMBtu
Cooling Utility Refrigeration 20 $/MMBtu
Cooling water 2 $/MMBtu
The assumptions made for utility prices are given in Table 17. The total
operating cost is sum of energy cost and raw material cost. The raw material cost
includes the cost of ethane and cost of caustic since, caustic regeneration is not
considered here. The price of caustic taken from ICIS website is found to be $545/
tonne. In this analysis, the cost of utility is assumed in terms of energy except for steam.
The amount of steam consumed in each exchanger is calculated using ASPEN PLUS
such that only latent heat is utilized by the process stream. It can also be seen that the
credit for utilizing off gas generated in the plant as fuel for cracker can be reflected in
terms of negative cost of natural gas saved in the furnace. The total off gas generated
constitutes of 12,259 Kg/hr of light gases, whose composition is given by 54.79 mol %
of hydrogen, 6.8 mol % of ethylene, 37 mol % of methane and 1 mol % of ethane. It
72
produces a combined heat duty of around 1189 MMBtu/hr, which when multiplied with
natural gas thermal efficiency and the cost of natural gas gives the credit for off gas to
energy cost. The cost of injecting dilution steam in the cracker for prevention of coke
formation is also added in the operating costs. It can be seen from cost analysis table,
that cost of energy is approximately 73% of the total operating cost.(Ren et al., 2006)
Hence this proves that this process is highly energy intensive. The fixed cost is
calculated using the formula:(El-Halwagi, 2012)
FCIB = FCIA* (Capacity of B/ Capacity of A) 0.6
Where FCIA is found to be 691 $MM for 568,000 annual rate of production of ethylene
(Capacity).(El-Halwagi, 2012) Here, capacity of B is 832000 Tonnes per year (present
case study).
IV.2. Pyrolysis of Methane
The basic raw materials involved in methane pyrolysis are natural gas and
oxygen. To get pure oxygen, an air separation unit needs to be installed at the same
process facility in order to be cost effective. In this case study, a cost of 0.021$/kg of
oxygen is assumed as raw material price.(Noureldin, Elbashir, & El-Halwagi, 2013)
Similarly the amine absorber involving the usage of MEA requires installation of
recovery system to recover MEA and recycle it back to the tower.(Chapel, Mariz, &
Ernest, 1999) In this case, capital and operating cost of MEA recovery units are included
and shown separately in order to make reasonable comparison with ethane cracking
process where no recovery system has been accounted. N methyl 2-pyrrolidine is

73
considered to be almost fully recovered and recycled directly. The NMP make up to be
added to the system according to simulation results is 549 kg/hr. The detailed cost
estimation of raw materials is given below in table. It is assumed that MEA is fully
recovered in the amine recovery unit hence, no makeup is accounted. The cost of utility
is assumed to be same as that of ethane cracking technology. The raw material
estimation is given below in Table 18.
Table 18: Estimation of raw material cost- methane pyrolysis.
Parameter Value UOM
Average Price of Natural Gas 4 $/MMBtu
Basis of 1 MMBtu (SCF) 1000 SCF methane
Basis of 1 MMBtu (kg) 19.2 kg of methane
Average Price of methane (kg) 0.21 $/kg methane
Amount of methane required 379 Tonnes/hr
Price of methane 692975349 $/year
NMP make up rate 549 kg/hr
Value of NMP 1.85 $/lb
Annual cost of NMP makeup 19771320 $/year
Cost of oxygen 0.021 $/kg oxygen
Amount of oxygen consumed 491370 kg/hr
Annual cost of oxygen 90392425 $/year
Total raw material cost 803.1 $M/year
The cost of energy consumption on an annual basis is calculated using results
derived from simulation. The cost of utilities namely steam, power, natural gas,
refrigeration and cooling water are assumed to be same as that of ethane cracking plant.
It can be seen from process simulation results that the maximum energy consumed was

74
in the quench and spray tower where cooling water is the cooling medium. Though
amount of cooling water required is high, the cost of cooling water is low per energy
basis and hence, the energy cost is comparatively lesser than the previous process. From
the raw material analysis, it can clearly be seen that cost of natural gas is very high when
compared to other materials and this is due to high consumption of gas in the reactor. It
is to be noted that only 33% of methane is converted to valuable intermediate, acetylene
and hence, the economic gross potential is also low compared to previous process. The
capital and operating cost of amine sweetening unit were calculated according to
literature data. The consolidated cost metrics is shown below in Table 19.
Table 19: Consolidated cost data- methane pyrolysis process.
Parameter Value UOM
Cost of Energy 598.5 Million $/yr
Cost of Raw material 803.1 Million $/yr
Total Operating Cost(without amine recovery ) 1401.6 Million $/yr
Operating cost of amine recovery unit 20.1 Million $/yr
Total Operating Cost(including amine recovery) 1421.7 Million$/year
Fixed Capital Cost (including amine recovery
units) 385.1 Million $/yr
Annual sales of product 1336.2 Million $/yr
Economic Gross Potential 533.1 Million $/yr
The energy cost of each equipment is shown below in Table 20. The total
operating cost is addition of raw material cost and utility cost. The amount of steam
utilized in heat exchangers are obtained using ASPEN simulation. The total off gas
generated from NMP absorption, Pressure swing adsorption and de-methanizer lighters
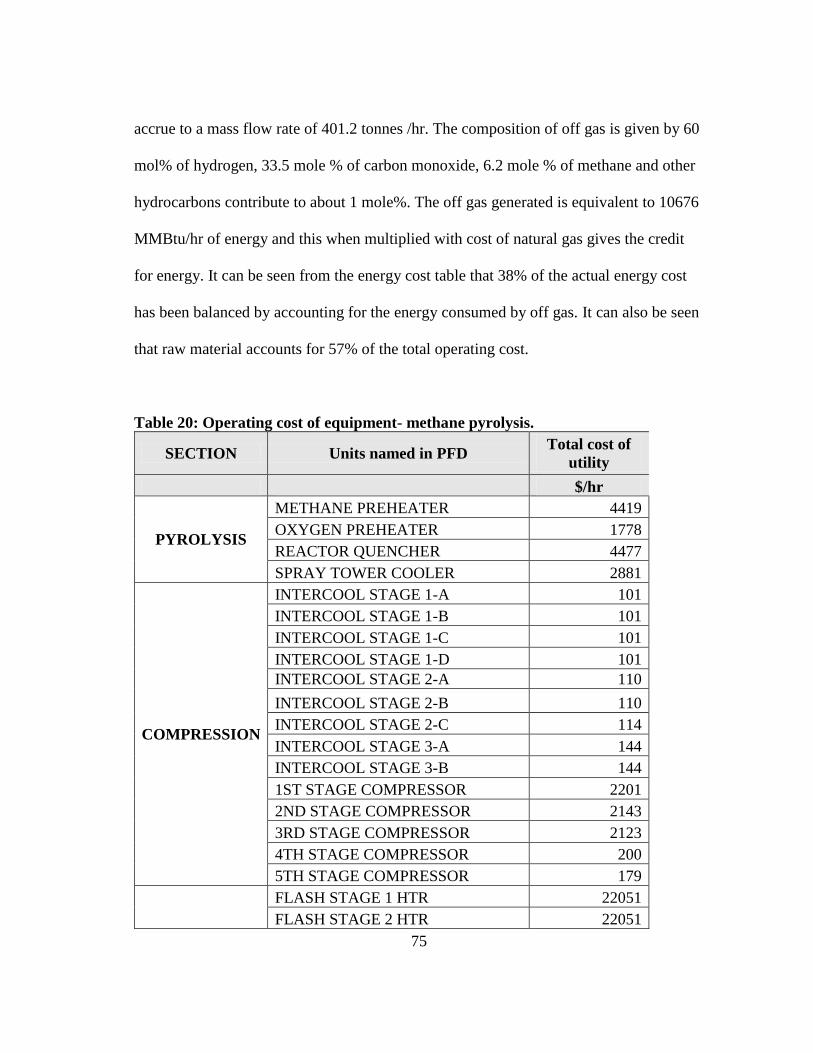
75
accrue to a mass flow rate of 401.2 tonnes /hr. The composition of off gas is given by 60
mol% of hydrogen, 33.5 mole % of carbon monoxide, 6.2 mole % of methane and other
hydrocarbons contribute to about 1 mole%. The off gas generated is equivalent to 10676
MMBtu/hr of energy and this when multiplied with cost of natural gas gives the credit
for energy. It can be seen from the energy cost table that 38% of the actual energy cost
has been balanced by accounting for the energy consumed by off gas. It can also be seen
that raw material accounts for 57% of the total operating cost.
Table 20: Operating cost of equipment- methane pyrolysis.
SECTION Units named in PFD Total cost of
utility
$/hr
PYROLYSIS
METHANE PREHEATER 4419
OXYGEN PREHEATER 1778
REACTOR QUENCHER 4477
SPRAY TOWER COOLER 2881
COMPRESSION
INTERCOOL STAGE 1-A 101
INTERCOOL STAGE 1-B 101
INTERCOOL STAGE 1-C 101
INTERCOOL STAGE 1-D 101
INTERCOOL STAGE 2-A 110
INTERCOOL STAGE 2-B 110
INTERCOOL STAGE 2-C 114
INTERCOOL STAGE 3-A 144
INTERCOOL STAGE 3-B 144
1ST STAGE COMPRESSOR 2201
2ND STAGE COMPRESSOR 2143
3RD STAGE COMPRESSOR 2123
4TH STAGE COMPRESSOR 200
5TH STAGE COMPRESSOR 179
FLASH STAGE 1 HTR 22051
FLASH STAGE 2 HTR 22051

76
Table 20: Continued.
SECTION Units named in PFD Total cost of
utility
$/hr
SOLVENT
SEPARATION
FLASH STAGE 3 HTR 22051
FLASH STAGE 4 COOL 73
FLASH STAGE 5 COOL 95
FLASH STAGE 6 COOL 94
SOLSEP REBOILER 3087
SOLSEP CONDENSOR-A 680
SOLSEP CONDENSOR-B 680
SOLSEP CONDENSOR-C 660
INTERCOOL STAGE 5 28
PRODUCT
SEPARATION
DEMETHANIZER REBOILER 4851
DEMETHANIZER CONDENSOR-A 586
DEMETHANIZER CONDENSOR-B 586
ETHYLENE REBOILER 11025
ETHYLENE CONDENSOR-A 496
ETHYLENE CONDENSOR-B 496
OFF GAS GENERATION -42704
Total 68318
The fixed capital cost of this plant is calculated by extracting equipment cost
values obtained from ASPEN plus economic analyzer. For equipment namely methane
and oxygen preheaters, cracker reactor, pressure swing absorption unit and amine
sweetening unit, the capital cost was calculated based on literature values using six tenth
factor rule. (Ries, 1966) (Peramanu et al., 1999) (Chapel et al., 1999) The equipment
costs obtained from economic analyzer were then multiplied with a Lang factor of 5 to
obtain the fixed capital cost.(El-Halwagi, 2012) For those values obtained from

77
literature, six by tenth rule was applied to calculate the equipment cost at given capacity.
The formula for scale factor of equipment cost is given by:
Equipment Cost B = Equipment Cost A* (Capacity of B/ Capacity of A) x
The value of x is determined depending on the type of equipment. For furnaces
an exponent of 0.78 was used while for rest of the equipment a general value of 0.6 was
used for calculation purposes. (El-Halwagi, 2012) Table 21 lists the fixed capital
investment calculated for each equipment.
Table 21: Capital investment of equipment- Methane pyrolysis.
S.No Physical Units FCI in USD
1 Methane preheater
83553047 2 Oxygen preheater
3 Cracker reactor 13806232.21
4 Spray tower (10 nos.) 22660000
5 1st stage compressor 45440000
6 Intercool stage 1 (4 nos.) 3239000
7 Cool flash 1 1285000
8 2nd stage compressor 44712814
9 Intercool stage 2 (3 nos.) 2197000
10 Cool flash 2 1219000
11 Amine sweetening unit (including recovery) 21876470
12 3rd stage compressor 65093500
13 Intercool stage 3 (2 nos.) 1490000
14 NMP absorption (3 nos.) 8026500
15 Pressure swing absorption unit 8512069
16 Acetylene hydrogenation 7160000
17 Flash net 1 2821500
18 Flash stage 1 heater 468000
19 Flash net 2 2428000
20 Flash stage 2 heater 492500

78
Table 21: Continued.
S.No Physical Units FCI in USD
21 Flash net 3 2292500
22 Flash stage 3 heater 749500
23 Flash net 4 1698500
24 Flash stage cool 4 213500
25 Flash net 5 574000
26 Flash stage cool 5 295500
27 Flash net 6 374000
28 Flash stage cool 6 328500
29 Flash net 7 330500
30 Solsep column 1958500
31 Solsep reboiler 268500
32 Solsep condensor (3 nos.)+ reflux pump 1798500
33 4th stage compressor 12373000
34 5th stage compressor 8341500
35 Interstage cool 5 241000
36 De-methanizer column 3949500
37 De-methanizer reboiler 177500
38 De-methanizer condenser (2 nos.)+reflux pump 5022000
39 Ethylene column 2351500
40 Ethylene reboiler 452500
41 Ethylene condenser (2 nos.) 4825500
Total 385096632
Total in Million USD 385.1
79
CHAPTER V
SAFETY ANALYSIS
In this chapter, the details of safety analysis will be outlined for both the
processes. The index chosen to measure safety is Hazard Identification and RAnking
system (HIRA). After carrying out a through literature study, it can be understood that
one of main reasons why companies do not measure inherent safety in the conceptual
stage is because almost all available safety indices require comprehensive data. At the
conceptual stage there is not much information on the process except for process flow
diagram and approximate economic analysis. The advantage of using HIRA is that this
index offers flexibility in neglecting those parameters that are not available, for example,
location, spacing and congestion. Another advantage is that this index, though not
completely qualitative, most of the operating conditions are estimated through
thermodynamic and empirical models. Hence, this index will prove to be a reliable tool
for safety analysis.
Further, most of the indices are based on quantification safety index, depending
on possible abnormal situations that can be encountered and this requires expertise and
experience to choose credible scenarios. But in this approach, the capacities of plant as
such will be used for estimating the value of index. This is because the purpose of the
analysis is not to calculate accurate value of risks in order to design layers of protection.
Instead a rough approximate estimate of safety levels is to be determined in order to rank
the equipment in terms of safety and then focus on each section to identify opportunities

80
for application of ISD approaches. Hence, this top level approach requires less time for
calculation and can be easily applied at early stage of design.
V.1.General Assumptions
a. For this analysis, only gas phase and vapor phase conditions and
compositions will be used for the purpose of calculation. The vapor phase
is more dangerous than liquid and hence has more damage potential than
liquid. Hence vapor phase conditions are used to represent the extent of
damage of each equipment.
b. Effects due to location of the nearest hazardous units and density of units
are neglected.
c. In all unit operations, only the composition of hydrocarbons is taken into
consideration.
d. For heat exchangers, the design shortcut method used yields the volume
of entire equipment. But for safety calculations, instead of counting the
volume occupied by hydrocarbon, the value for entire equipment volume
will be considered. This is due to the lack of detailed design data
available for calculation. This will slightly overestimate the measure of
damage potential in heat exchangers.
e. For distillation columns and absorption towers, the conditions at the top
of column will be considered for safety calculations. This is because top
of column contains maximum amount of lighters in comparison with to
81
bottom and most of them are in vapor phase. Only vapor load at top of
column will be assumed for calculation.
f. Invariably for all equipment, the conditions at the inlet or outlet that has
maximum temperature will be considered for safety analysis except for
reactors.
g. Since the volumes of compressors are variable and small, the volume
term in calculation of compressors and expanders are neglected.
V.1.1 Units with Chemical Reactions and Physical Operations
The procedure for calculation of Fire and explosion damage index using HIRA is
different for each equipment class. Since all the equipment considered for analysis of
both the plants fall under the category of either physical operations or reactors,
calculation algorithm for only these two equipment class is shown. In this sub division,
step by step procedure for calculating units involving chemical reaction and physical
operation will be listed. The fire and explosion damage index is given by:(Khan &
Abbasi, 1998)
FEDI = 4.76* (Damage potential) 0.333
Damage potential (Reactions) = (F1*pn1 +F *pn2+ F4*pn7 *pn8) * pn3*pn4* pn5* pn6
Damage Potential (Physical operations) = (F1*pn1 +F *pn2) * pn3*pn4* pn5* pn6
F1, F and F4 are energy factors and pn1-8 are penalties assigned to each
operating condition. F1 is the energy factor that takes account for chemical energy. F is
summation of F2 and F3, where both these sub factors account for physical energy based

82
on certain physical conditions.(Khan & Abbasi, 1998) F4 accounts for energy released
due to chemical reactions.(Khan & Abbasi, 1998) Penalties pn1 is assigned for
temperature, pn2 for pressure, pn3 for quantity of chemical handled in the unit, pn4 for
effect of chemical characteristics namely flammability and reactivity, pn5 for effect of
location of nearest hazardous unit, pn6 for density of units, pn7 for type of reaction and
pn8 for probability of side reaction.(Khan & Abbasi, 1998) The formulas for calculating
energy factors and penalties are given as follows:(Khan & Abbasi, 1998)
i. F1 = 0.1* M * (Heat of combustion) / K
ii. F2 = 1.304* 10-3
* Operating pressure * Volume
iii. F3 = 1*10-3
/ (T +273)* (Operating pressure- vapor pressure) 2 * Volume
iv. F4 = M * Heat of reaction /K
v. Pn1 = f1 (flash, fire, auto ignition, operating temperature)
Where f1 is given by the algorithm:
If (Temperature> Flash point<Fire point)
f1= 1.45
Else if (Temperature>Fire point<0.75 Auto-ignition temperature)
f1= 1.75
Else if (Temperature> 0.75 Auto-ignition temperature)
f1= 1.95
Else
f1= 1.1
vi. Pn2 is calculated using the following algorithm:

83
If (Vapor pressure>Atmospheric pressure and operating pressure>vapor
pressure)
Pn2 = 1+ (1- (vapor pressure/operating pressure))*0.6
F = F2 +F3
Else
Pn2 = 1+ (1- (vapor pressure/operating pressure))*0.4
F= F2
If (Atmospheric pressure > vapor pressure and operating pressure >
Atmospheric pressure)
Pn2 = 1+ (1- (vapor pressure/operating pressure))*0.2
F=F3
Otherwise
Pn2 = 1.1
F=F3
vii. Pn3 is calculated based on weightage for chemical handled in the unit.
This is based on the chemical characteristics namely flammability and
reactivity. Since, both the process are steady state, flow rates are with
respect to time. Hence quantity cannot be defined properly. Hence a
limiting value of 1.1 is assumed for all operations.
viii. Pn4 describes the effect of chemical characteristics. It is given by the
following equation:
Pn4 = 1+0.25* (NFPA flammability score+ NFPA reactivity score)
84
ix. Pn5 is the effect due to location of nearest hazardous unit. Since this has
been neglected for this case study, a minimum value of 1.2 is taken as
value.
x. Pn6 is the penalty due to density of units. Since this is neglected for this
case study a minimum value of 1 is assumed. The formula is given by the
equation below:
Pn6 = (1 + % space occupied by unit in an area of 30 m in radius from the
unit/100)
xi. Pn7 is the penalty used for units involving chemical reactions, where the
score is assigned based on the type of reaction.
xii. Pn8 is the penalty assigned to account for probability of undesired side
reactions in units involving reactions.
M is mass flow rate with units in kg/sec, Heat of combustion in J/mol, Operating
pressure in kPa, Volume in m3, Temperature (T) in
0C and Heat of reaction in kJ/kg. K is
a constant with value of 3.148. The damage potential and the final fire and explosion
index are measured as radius of impact in meters. In units where temperature varies as a
function of length, temperature of decision was chosen to be the one that was maximum
at any part of the length. The heat of combustion was calculated based on mole fraction
of vapor phase in each equipment. NFPA rankings for flammability and reactivity were
also calculated based on mole fractions. For equipment processing only gas, conditions
at the end where the temperature is maximum is considered for calculation.
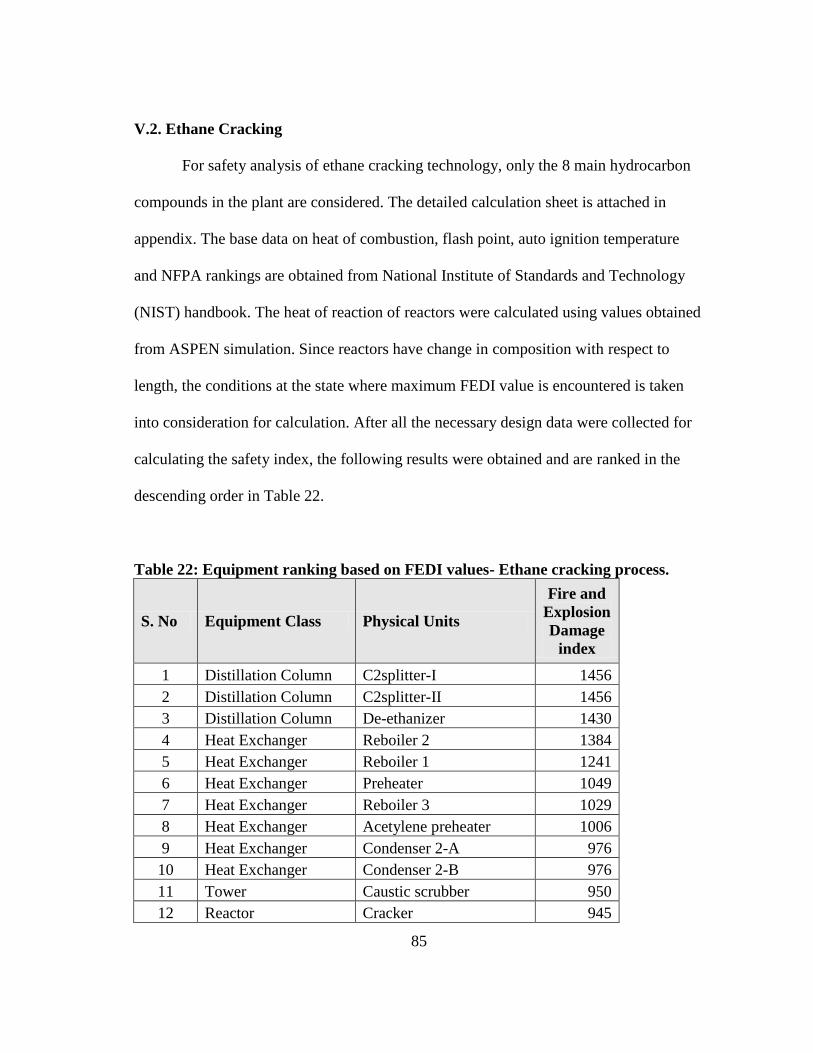
85
V.2. Ethane Cracking
For safety analysis of ethane cracking technology, only the 8 main hydrocarbon
compounds in the plant are considered. The detailed calculation sheet is attached in
appendix. The base data on heat of combustion, flash point, auto ignition temperature
and NFPA rankings are obtained from National Institute of Standards and Technology
(NIST) handbook. The heat of reaction of reactors were calculated using values obtained
from ASPEN simulation. Since reactors have change in composition with respect to
length, the conditions at the state where maximum FEDI value is encountered is taken
into consideration for calculation. After all the necessary design data were collected for
calculating the safety index, the following results were obtained and are ranked in the
descending order in Table 22.
Table 22: Equipment ranking based on FEDI values- Ethane cracking process.
S. No Equipment Class Physical Units
Fire and
Explosion
Damage
index
1 Distillation Column C2splitter-I 1456
2 Distillation Column C2splitter-II 1456
3 Distillation Column De-ethanizer 1430
4 Heat Exchanger Reboiler 2 1384
5 Heat Exchanger Reboiler 1 1241
6 Heat Exchanger Preheater 1049
7 Heat Exchanger Reboiler 3 1029
8 Heat Exchanger Acetylene preheater 1006
9 Heat Exchanger Condenser 2-A 976
10 Heat Exchanger Condenser 2-B 976
11 Tower Caustic scrubber 950
12 Reactor Cracker 945

86
Table 22: Continued.
S. No Equipment Class Physical Units
Fire and
Explosion
Damage
index
13 Reactor Acetylene hydrogenation 944
14 Distillation Column De-methanizer 932
15 Vessel Dryer 918
16 Heat Exchanger Inter-stage cool4 912
17 Heat Exchanger Inter-stage cool3 911
18 Heat Exchanger Cool train hx2 911
19 Heat Exchanger Refrigeration cooler 911
20 Heat Exchanger Cool train hx1 910
21 Vessel Flash drum 2 909
22 Compressor 3rdstage compressor 909
23 Compressor 4th stage compressor 908
24 Heat Exchanger Inter-stage cool2 908
25 Vessel Flash drum 1 907
26 Compressor 2nd stage compressor 907
27 Compressor 1stage compressor 897
28 Heat Exchanger Transfer Line exchange 896
29 Vessel Cool-flash 1 804
30 Heat Exchanger Cool train hx5 792
31 Heat Exchanger Cool train hx4 791
32 Heat Exchanger Condenser 3-I-A 774
33 Heat Exchanger Condenser 3-I-B 774
34 Heat Exchanger Condenser 3-II-A 774
35 Heat Exchanger Condenser 3-II-B 774
36 Heat Exchanger Inter-stage cool 1 A 713
37 Heat Exchanger Inter-stage cool 1 B 713
38 Heat Exchanger Cool train hx3-C 647
39 Heat Exchanger Cool train hx3-A 646
40 Heat Exchanger Cool train hx3-B 646
41 Heat Exchanger Cool train hx6-A 639
42 Heat Exchanger Cool train hx6- B 639
43 Column Quench tower-1 635
44 Column Quench tower-2 635

87
Table 22: Continued.
S. No Equipment Class Physical Units
Fire and
Explosion
Damage
index
45 Column Quench tower-3 635
46 Vessel Cool-flash 2 446
47 Heat Exchanger Condenser 1 371
48 Heat Exchanger Cool train hx9 362
49 Heat Exchanger Cool train hx8 357
50 Heat Exchanger Cool train hx7 354
51 Vessel Cool-flash 3 255
52 Expander 186
From the results it can be seen that the C2 splitter columns are the more
dangerous with highest impact radius, followed by de-ethanizer column and de-ethanizer
reboiler. The preheater and cracker are essentially in the same unit, but since the index
distinguishes different classes of equipment, they have been separated as convection
section (preheater), where the feed is preheated and radiation section (cracker) where
ethane dehydrogenation takes place respectively. Figure 17 shown below gives
approximately the number of equipment that falls under each range of fire and explosion
damage index. It can be seen that 17 out of 52 equipment fall under the category of 900<
FEDI< 1000, while 8 equipment fall under the range that has FEDI>1000. This chart
gives us an approximate idea on which equipment we need to concentrate to improve
safety. Effort should be taken at this stage to apply Inherent safety guidewords to modify
the process and the procedure should be repeated to achieve lower impact radius. It
should be noted that the value of index is a highly overestimated figure, since the units

88
were not evaluated for any abnormal conditions. Hence, the magnitude does not literally
imply the exact damage radius, but on a comparative basis, it indicates where each unit
stands with respect to other equipment on inherent safety. Similarly those 7 equipment
falling under the category of 400< FEDI <200 does not require much attention in terms
of safety.
Figure 17: Distribution of equipment under various ranges of damage radius-
Ethane Cracking.
Figure 18 shows the semi-quantitative ranking of equipment. By using the semi-
quantitative chart of HIRA for deducing the final results, it can be seen that almost 83%
of equipment are highly hazardous. This chart merely shows an analysis of how many
equipment are highly hazardous and hence gives an overview of safety present in the
8
17
3
8
8
1 5 2
Fire and Explosion Damage Index
FEDI >1000
900<FEDI<1000
800<FEDI<900
700<FEDI<800
600<FEDI<700
500<FEDI<400
400<FEDI<200
FEDI<200

89
process technology. The qualitative ranking will not be used for comparative study since
it does not identify the areas of improvement accurately.
Figure 18: Semi-quantitative ranking based on HIRA method- Ethane Cracking.
Figure 19 shows the section wise ranking of top 5 most hazardous equipment of
the process and this gives a detailed overview of areas of improvement in terms of
safety. It can be seen that since cooling and separation has maximum number of
equipment (32 nos.), this section is more hazardous because it consists of large number
of dangerous equipment. The reason for large value of indices infer to be due to
chemical composition, mass flow rate handled and chemical characteristics such as
flammability, reactivity and heat of combustion. The general safety data sheet shows that
heat of combustion values are high for ethylene, ethane, propylene, propane, butadiene
0
10
20
30
40
50
60
70
80
90
Extremelyhazardous
Highlyhazardous
Hazardous Moderatelyhazardous
Pe
rce
nta
ge o
f e
qu
ipm
en
ts
Fire and Damage Explosion index ranking
Semi quantitative ranking
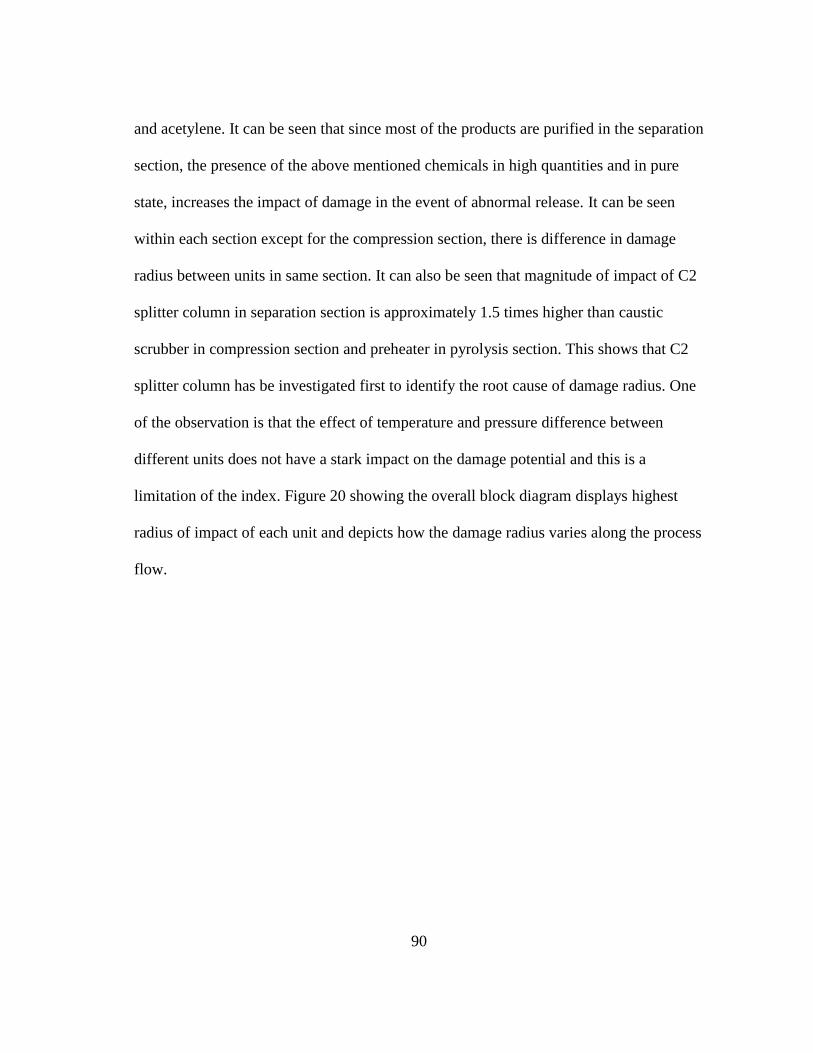
90
and acetylene. It can be seen that since most of the products are purified in the separation
section, the presence of the above mentioned chemicals in high quantities and in pure
state, increases the impact of damage in the event of abnormal release. It can be seen
within each section except for the compression section, there is difference in damage
radius between units in same section. It can also be seen that magnitude of impact of C2
splitter column in separation section is approximately 1.5 times higher than caustic
scrubber in compression section and preheater in pyrolysis section. This shows that C2
splitter column has be investigated first to identify the root cause of damage radius. One
of the observation is that the effect of temperature and pressure difference between
different units does not have a stark impact on the damage potential and this is a
limitation of the index. Figure 20 showing the overall block diagram displays highest
radius of impact of each unit and depicts how the damage radius varies along the process
flow.
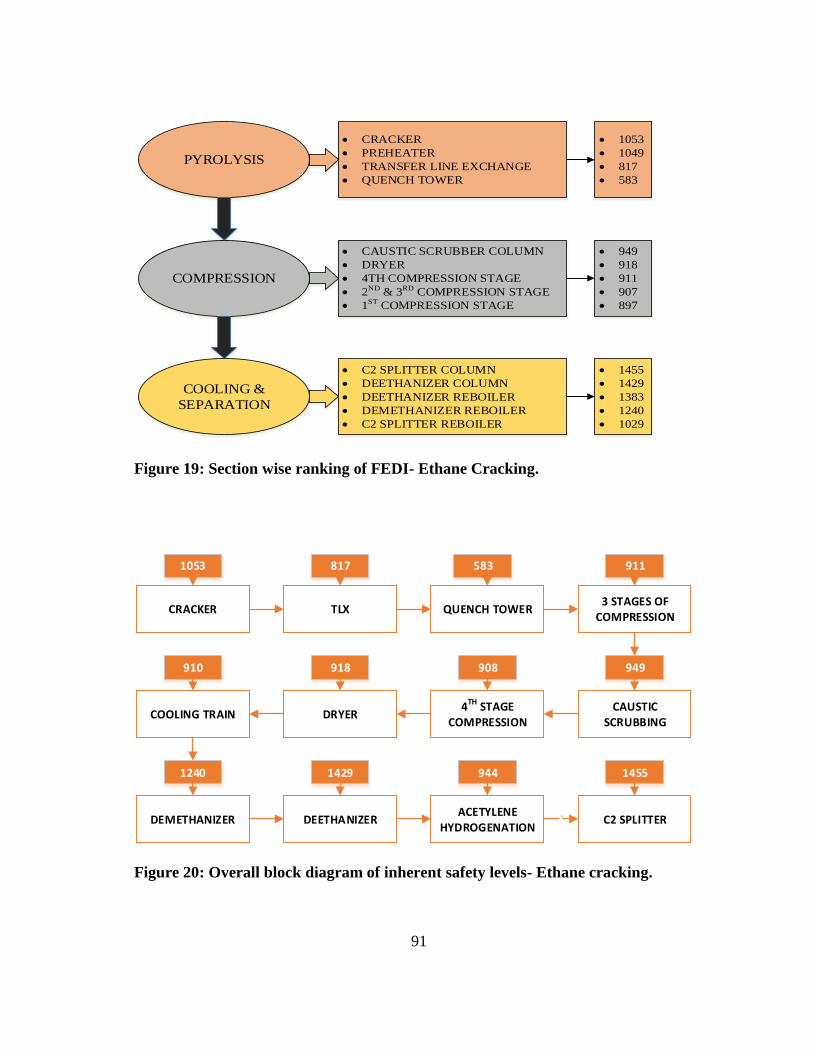
91
PYROLYSIS
CRACKER
PREHEATER
TRANSFER LINE EXCHANGE
QUENCH TOWER
COMPRESSION
CAUSTIC SCRUBBER COLUMN
DRYER
4TH COMPRESSION STAGE
2ND & 3RD COMPRESSION STAGE
1ST COMPRESSION STAGE
COOLING &
SEPARATION
C2 SPLITTER COLUMN
DEETHANIZER COLUMN
DEETHANIZER REBOILER
DEMETHANIZER REBOILER
C2 SPLITTER REBOILER
1053
1049
817
583
949
918
911
907
897
1455
1429
1383
1240
1029
Figure 19: Section wise ranking of FEDI- Ethane Cracking.
CRACKER TLX QUENCH TOWER
CAUSTIC SCRUBBING
DRYER4TH STAGE
COMPRESSION
3 STAGES OF COMPRESSION
COOLING TRAIN
DEMETHANIZER DEETHANIZER C2 SPLITTERACETYLENE
HYDROGENATION
1053 817 583 911
910 918 908 949
1240 1429 944 1455
`
Figure 20: Overall block diagram of inherent safety levels- Ethane cracking.
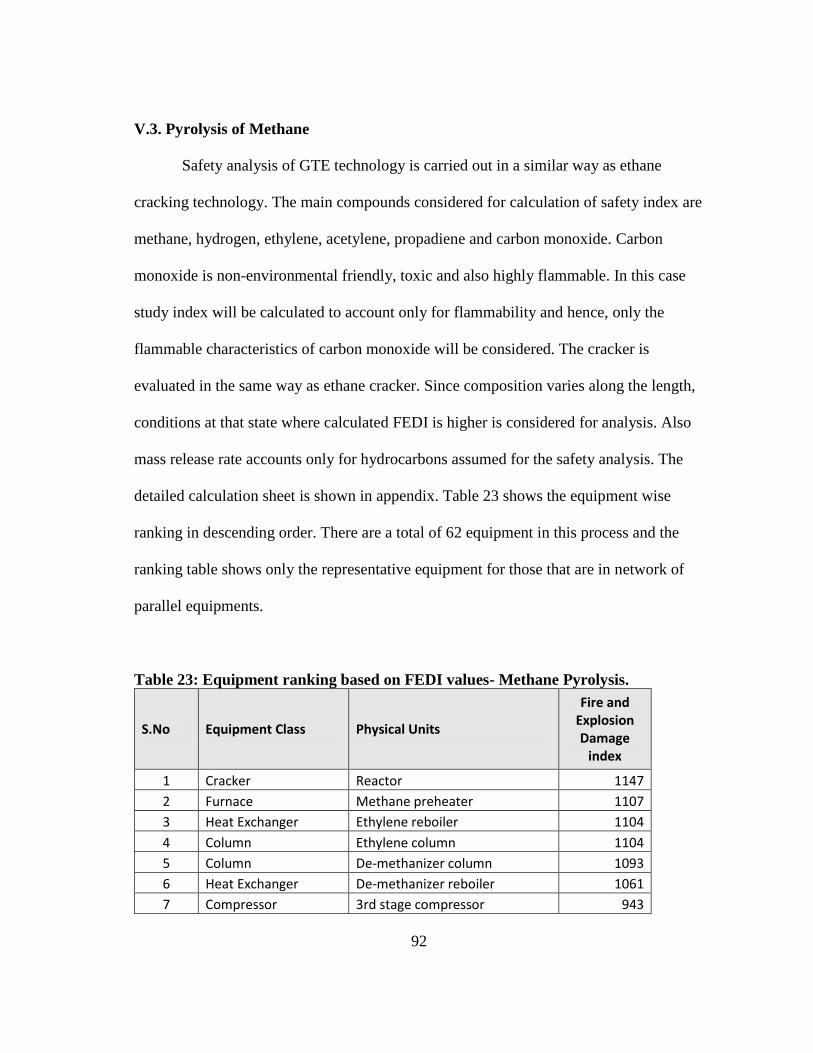
92
V.3. Pyrolysis of Methane
Safety analysis of GTE technology is carried out in a similar way as ethane
cracking technology. The main compounds considered for calculation of safety index are
methane, hydrogen, ethylene, acetylene, propadiene and carbon monoxide. Carbon
monoxide is non-environmental friendly, toxic and also highly flammable. In this case
study index will be calculated to account only for flammability and hence, only the
flammable characteristics of carbon monoxide will be considered. The cracker is
evaluated in the same way as ethane cracker. Since composition varies along the length,
conditions at that state where calculated FEDI is higher is considered for analysis. Also
mass release rate accounts only for hydrocarbons assumed for the safety analysis. The
detailed calculation sheet is shown in appendix. Table 23 shows the equipment wise
ranking in descending order. There are a total of 62 equipment in this process and the
ranking table shows only the representative equipment for those that are in network of
parallel equipments.
Table 23: Equipment ranking based on FEDI values- Methane Pyrolysis.
S.No Equipment Class Physical Units
Fire and Explosion Damage
index
1 Cracker Reactor 1147
2 Furnace Methane preheater 1107
3 Heat Exchanger Ethylene reboiler 1104
4 Column Ethylene column 1104
5 Column De-methanizer column 1093
6 Heat Exchanger De-methanizer reboiler 1061
7 Compressor 3rd stage compressor 943
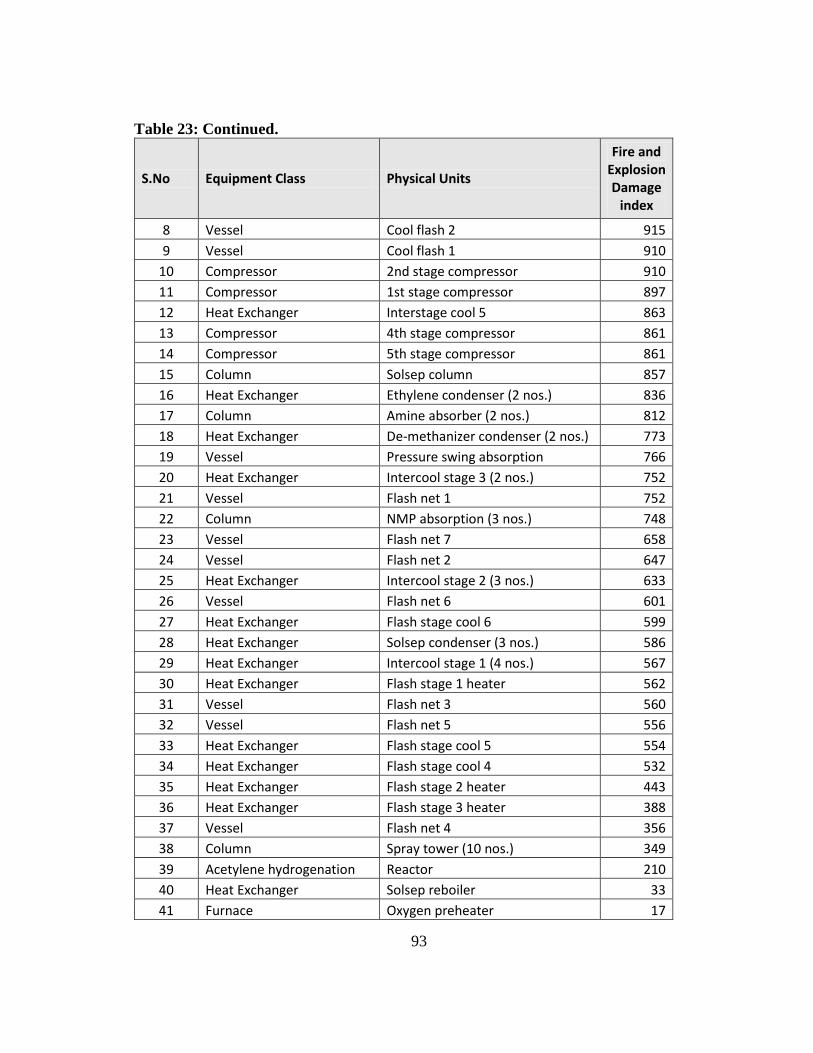
93
Table 23: Continued.
S.No Equipment Class Physical Units
Fire and Explosion Damage
index
8 Vessel Cool flash 2 915
9 Vessel Cool flash 1 910
10 Compressor 2nd stage compressor 910
11 Compressor 1st stage compressor 897
12 Heat Exchanger Interstage cool 5 863
13 Compressor 4th stage compressor 861
14 Compressor 5th stage compressor 861
15 Column Solsep column 857
16 Heat Exchanger Ethylene condenser (2 nos.) 836
17 Column Amine absorber (2 nos.) 812
18 Heat Exchanger De-methanizer condenser (2 nos.) 773
19 Vessel Pressure swing absorption 766
20 Heat Exchanger Intercool stage 3 (2 nos.) 752
21 Vessel Flash net 1 752
22 Column NMP absorption (3 nos.) 748
23 Vessel Flash net 7 658
24 Vessel Flash net 2 647
25 Heat Exchanger Intercool stage 2 (3 nos.) 633
26 Vessel Flash net 6 601
27 Heat Exchanger Flash stage cool 6 599
28 Heat Exchanger Solsep condenser (3 nos.) 586
29 Heat Exchanger Intercool stage 1 (4 nos.) 567
30 Heat Exchanger Flash stage 1 heater 562
31 Vessel Flash net 3 560
32 Vessel Flash net 5 556
33 Heat Exchanger Flash stage cool 5 554
34 Heat Exchanger Flash stage cool 4 532
35 Heat Exchanger Flash stage 2 heater 443
36 Heat Exchanger Flash stage 3 heater 388
37 Vessel Flash net 4 356
38 Column Spray tower (10 nos.) 349
39 Acetylene hydrogenation Reactor 210
40 Heat Exchanger Solsep reboiler 33
41 Furnace Oxygen preheater 17
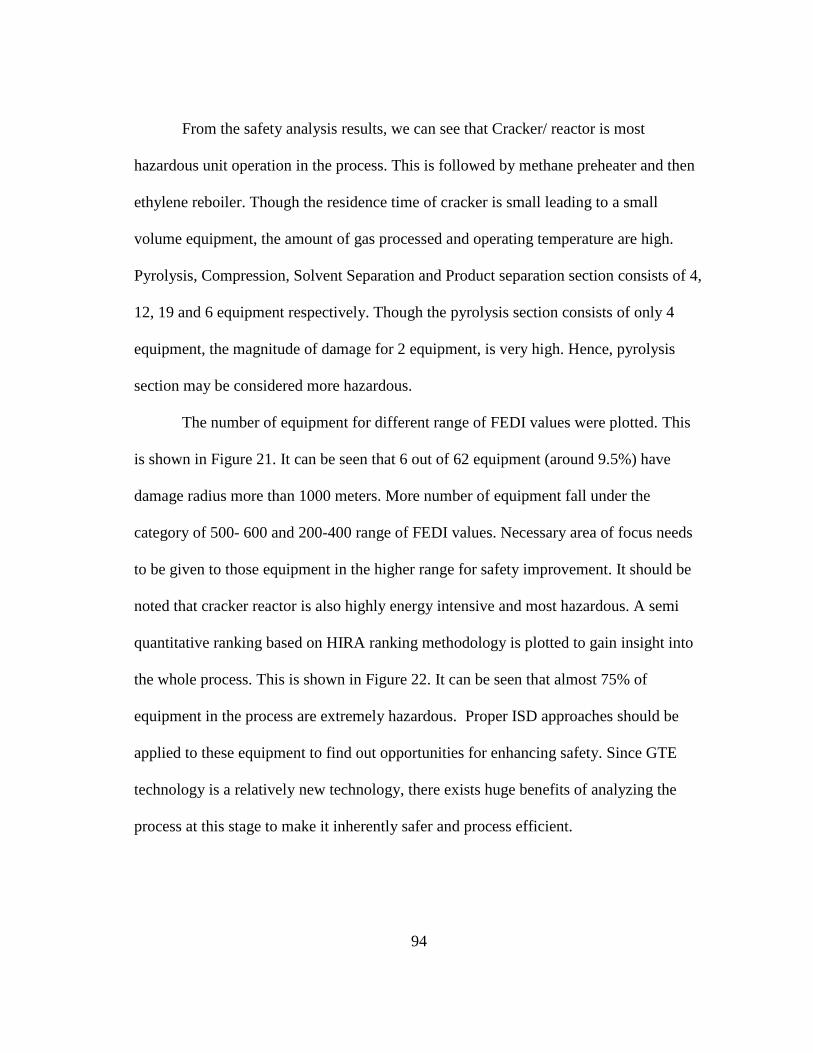
94
From the safety analysis results, we can see that Cracker/ reactor is most
hazardous unit operation in the process. This is followed by methane preheater and then
ethylene reboiler. Though the residence time of cracker is small leading to a small
volume equipment, the amount of gas processed and operating temperature are high.
Pyrolysis, Compression, Solvent Separation and Product separation section consists of 4,
12, 19 and 6 equipment respectively. Though the pyrolysis section consists of only 4
equipment, the magnitude of damage for 2 equipment, is very high. Hence, pyrolysis
section may be considered more hazardous.
The number of equipment for different range of FEDI values were plotted. This
is shown in Figure 21. It can be seen that 6 out of 62 equipment (around 9.5%) have
damage radius more than 1000 meters. More number of equipment fall under the
category of 500- 600 and 200-400 range of FEDI values. Necessary area of focus needs
to be given to those equipment in the higher range for safety improvement. It should be
noted that cracker reactor is also highly energy intensive and most hazardous. A semi
quantitative ranking based on HIRA ranking methodology is plotted to gain insight into
the whole process. This is shown in Figure 22. It can be seen that almost 75% of
equipment in the process are extremely hazardous. Proper ISD approaches should be
applied to these equipment to find out opportunities for enhancing safety. Since GTE
technology is a relatively new technology, there exists huge benefits of analyzing the
process at this stage to make it inherently safer and process efficient.
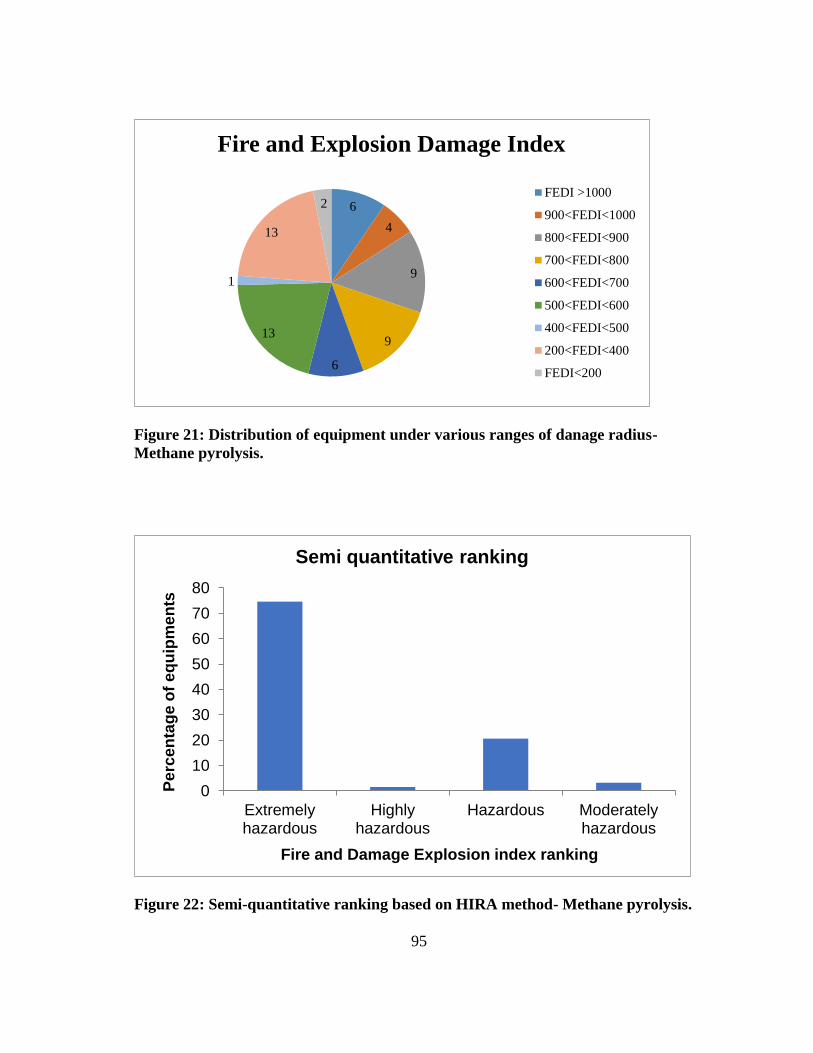
95
Figure 21: Distribution of equipment under various ranges of danage radius-
Methane pyrolysis.
Figure 22: Semi-quantitative ranking based on HIRA method- Methane pyrolysis.
6
4
9
9
6
13
1
13
2
Fire and Explosion Damage Index
FEDI >1000
900<FEDI<1000
800<FEDI<900
700<FEDI<800
600<FEDI<700
500<FEDI<600
400<FEDI<500
200<FEDI<400
FEDI<200
0
10
20
30
40
50
60
70
80
Extremelyhazardous
Highlyhazardous
Hazardous Moderatelyhazardous
Pe
rce
nta
ge
of
eq
uip
me
nts
Fire and Damage Explosion index ranking
Semi quantitative ranking
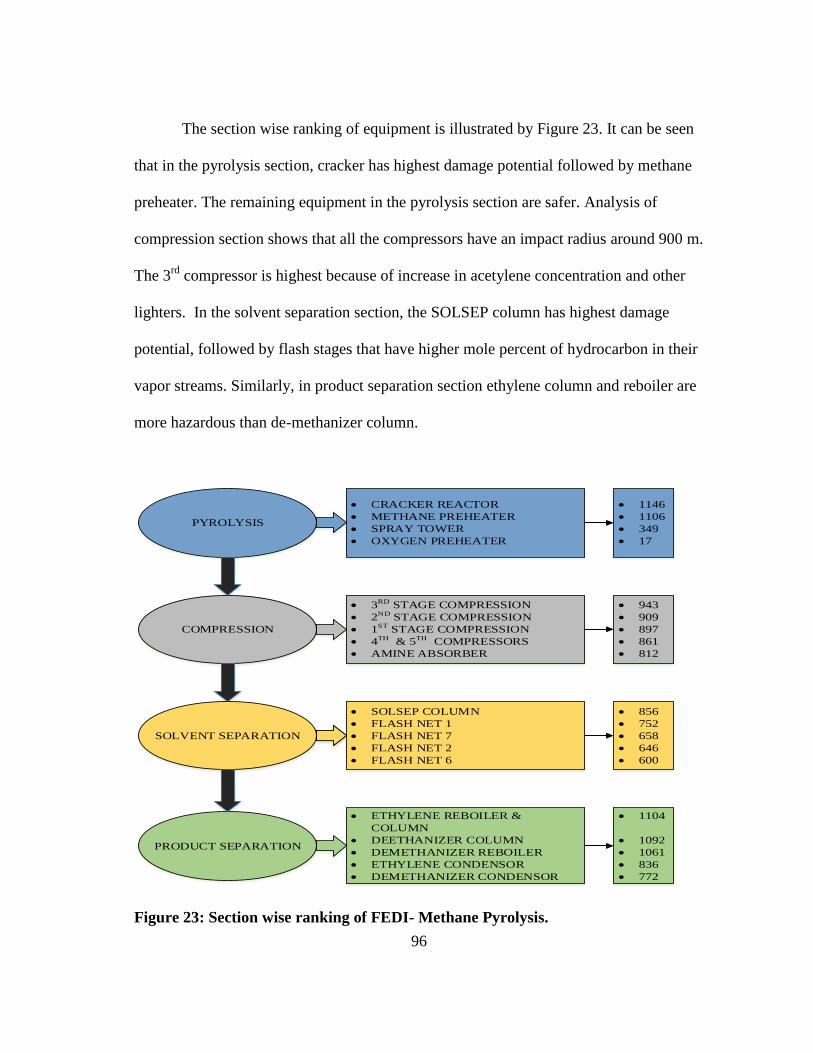
96
The section wise ranking of equipment is illustrated by Figure 23. It can be seen
that in the pyrolysis section, cracker has highest damage potential followed by methane
preheater. The remaining equipment in the pyrolysis section are safer. Analysis of
compression section shows that all the compressors have an impact radius around 900 m.
The 3rd
compressor is highest because of increase in acetylene concentration and other
lighters. In the solvent separation section, the SOLSEP column has highest damage
potential, followed by flash stages that have higher mole percent of hydrocarbon in their
vapor streams. Similarly, in product separation section ethylene column and reboiler are
more hazardous than de-methanizer column.
PYROLYSIS
CRACKER REACTOR
METHANE PREHEATER
SPRAY TOWER
OXYGEN PREHEATER
COMPRESSION
3RD STAGE COMPRESSION
2ND STAGE COMPRESSION
1ST STAGE COMPRESSION
4TH & 5TH COMPRESSORS
AMINE ABSORBER
SOLVENT SEPARATION
SOLSEP COLUMN
FLASH NET 1
FLASH NET 7
FLASH NET 2
FLASH NET 6
1146
1106
349
17
943
909
897
861
812
856
752
658
646
600
PRODUCT SEPARATION
ETHYLENE REBOILER &
COLUMN
DEETHANIZER COLUMN
DEMETHANIZER REBOILER
ETHYLENE CONDENSOR
DEMETHANIZER CONDENSOR
1104
1092
1061
836
772
Figure 23: Section wise ranking of FEDI- Methane Pyrolysis.

97
From the figure, it can be inferred that almost all the high ranked equipment in
each section have same radius of impact. Once again, the magnitude does not reflect the
exact damage index but instead sheds some knowledge about the parameters that affect
the impact radius. The main parameters that affect the impact radius are flammability,
heat of combustion, gas composition, mass flow rate and penalties for temperature and
pressure.
The block diagram displayed in Figure 24 shows how the impact radius varies
along the process flow. It can be seen that starting from cracker, the FEDI value
decreases at Spray tower and the increases. This is because Spray tower section consists
of 10 parallel networks of equipment due to design considerations. This once again
proves that reduction in size increases safety. It can be well noted that the safety index of
acetylene hydrogenation is very low in the range of 200. This is because the
hydrogenation reaction is carried out in liquid phase and only the vapor phase containing
hydrogen is considered for analysis. Starting from solvent separation the FEDI values
increase due to increase in concentration of pure hydrocarbons.
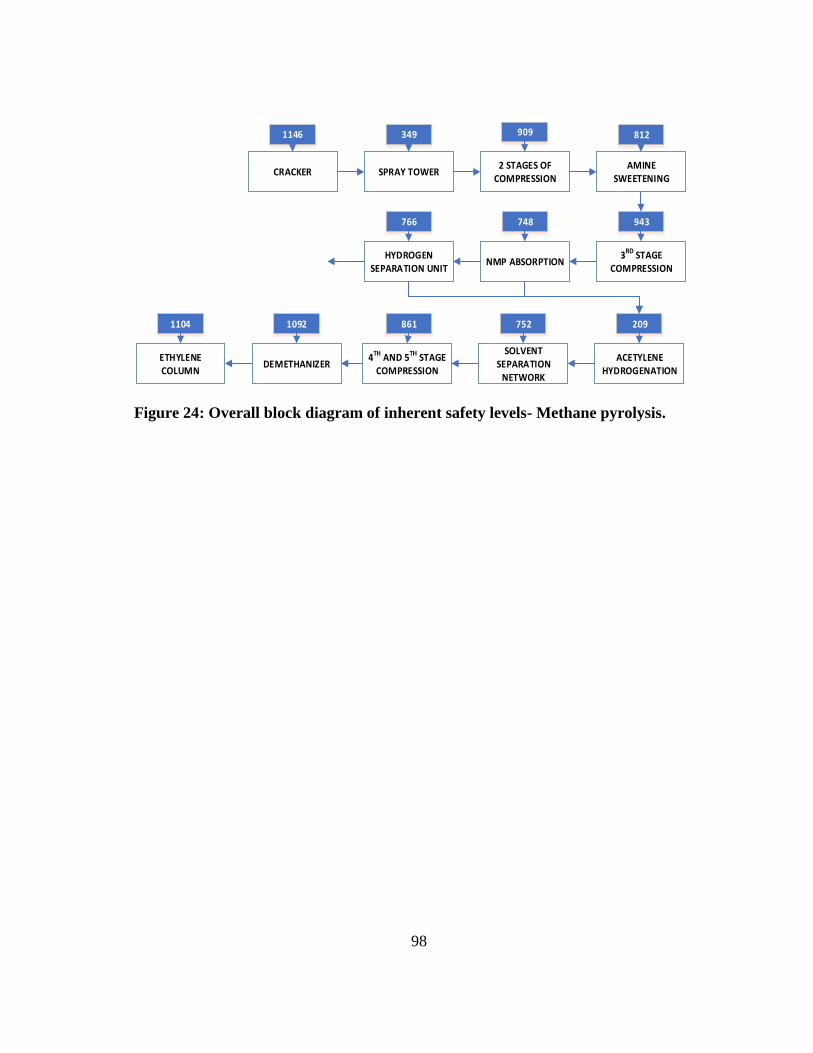
98
CRACKER SPRAY TOWER2 STAGES OF
COMPRESSION
3RD STAGE COMPRESSION
HYDROGEN SEPARATION UNIT
NMP ABSORPTION
AMINE SWEETENING
4TH AND 5TH STAGE COMPRESSION
SOLVENT SEPARATION
NETWORK
ACETYLENE HYDROGENATION
1146 349 909 812
766 748 943
752 209
ETHYLENE COLUMN
DEMETHANIZER
1104 1092 861
Figure 24: Overall block diagram of inherent safety levels- Methane pyrolysis.

99
CHAPTER VI
RESULTS AND DISCUSSION
From the previous chapters, results of techno-economic and safety analysis were
discussed separately for each base case. In this chapter, the overall objective of this
research is achieved by comparing both the processes to identify the superior process
that balances process performance, economics of operation and inherent safety. Each
analysis was performed by applying same techniques and assumptions so that a
reasonable comparison can be made. For the same reason, ethylene production rate of
830,000 Tonnes/annum is considered as the basis of process simulation for both the
plants. The final results are obtained by comparing the key performance indicators of
each metrics.
VI.1. Process Metrics
The key process metrics that are compared are process yield, specific
consumption of raw material, conversion, minimum energy requirements and specific
energy consumption. Both the plants are optimized and simulated to produce 99.9wt%
pure ethylene. The results of the analysis are shown below in Table 24. From the
comparative table, it can be clearly seen that process performance of ethane cracking
technology is better than the methane pyrolysis. The process yield of methane pyrolysis
is considerably low because of the requirement of part of the natural gas to be used as
fuel in order to generate enough heat required to crack methane. Hence, this also

100
increases the specific consumption of raw material of natural gas to produce ethylene.
Another reason for the specific consumption of methane to be very high is because the
methane crackers are once through reactors. Since most of the methane is burned,
recovery of methane in the final product purification level is relatively insignificant and
hence, there is no feed recycle unlike ethane cracking process, where unconverted ethane
is recovered and recycled back to the reactor. It can also be seen that the product
recovery in ethane cracking technology is higher than methane pyrolysis. This is dictated
by optimized use of external solvent and energy required for separation.
Table 24: Comparison of process performance metrics.
S.No Parameters Ethane
Cracking
Methane
Pyrolysis UOM
1 Process yield of ethylene 85 25 %(mass basis)
2 Specific consumption of raw
material 1.2 4
Tonne of raw
material/tonne
of product
3 Conversion of raw material 60 33 %(mass basis)
4 Product recovery 99 96 %(mass basis)
5 Minimum energy requirements 2446 6252 MMBtu/hr
6 Minimum heating requirements 1112 1244 MMBtu/hr
7 Minimum cooling requirements 1200 4546 MMBtu/hr
8 Specific energy consumption 26 66 MMBtu/tonne
of ethylene
In terms of energy requirements, it is clear that ethane cracking requires less
energy than methane pyrolysis. The underlying fact is that majority of the energy
requirements in methane pyrolysis is contributed by quench water in the reactor, which

101
is used for bringing down the temperature of the reactor immediately to stop carbon
decomposition reaction. Since this requires very less residence time, large amounts of
cooling water needs to be used and this increases cooling requirements of quench water.
The reasons can be attributed mainly due to process chemistry requiring high
temperatures for producing acetylene and insufficient heat recovery systems. This paves
way for modification in the process chemistry such that acetylene is produced at less
intensive operating conditions or heat recovery systems be introduced such that a proper
heat integration network is formed that will significantly reduce external energy
consumption.
Figure 25: Comparison of section-wise energy consumption.
0
10
20
30
40
50
60
70
Pyrolysis Compression Separation & Purification
Section wise energy consumption
Methane Pyrolysis Ethane Cracking
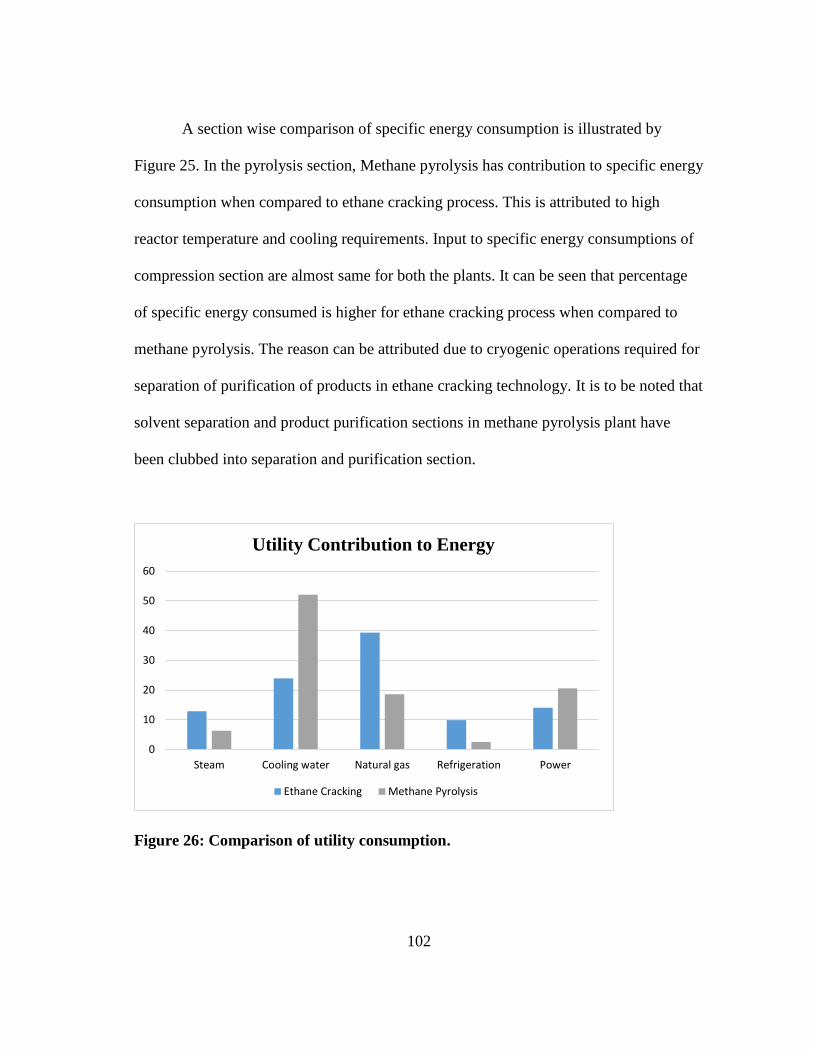
102
A section wise comparison of specific energy consumption is illustrated by
Figure 25. In the pyrolysis section, Methane pyrolysis has contribution to specific energy
consumption when compared to ethane cracking process. This is attributed to high
reactor temperature and cooling requirements. Input to specific energy consumptions of
compression section are almost same for both the plants. It can be seen that percentage
of specific energy consumed is higher for ethane cracking process when compared to
methane pyrolysis. The reason can be attributed due to cryogenic operations required for
separation of purification of products in ethane cracking technology. It is to be noted that
solvent separation and product purification sections in methane pyrolysis plant have
been clubbed into separation and purification section.
Figure 26: Comparison of utility consumption.
0
10
20
30
40
50
60
Steam Cooling water Natural gas Refrigeration Power
Utility Contribution to Energy
Ethane Cracking Methane Pyrolysis
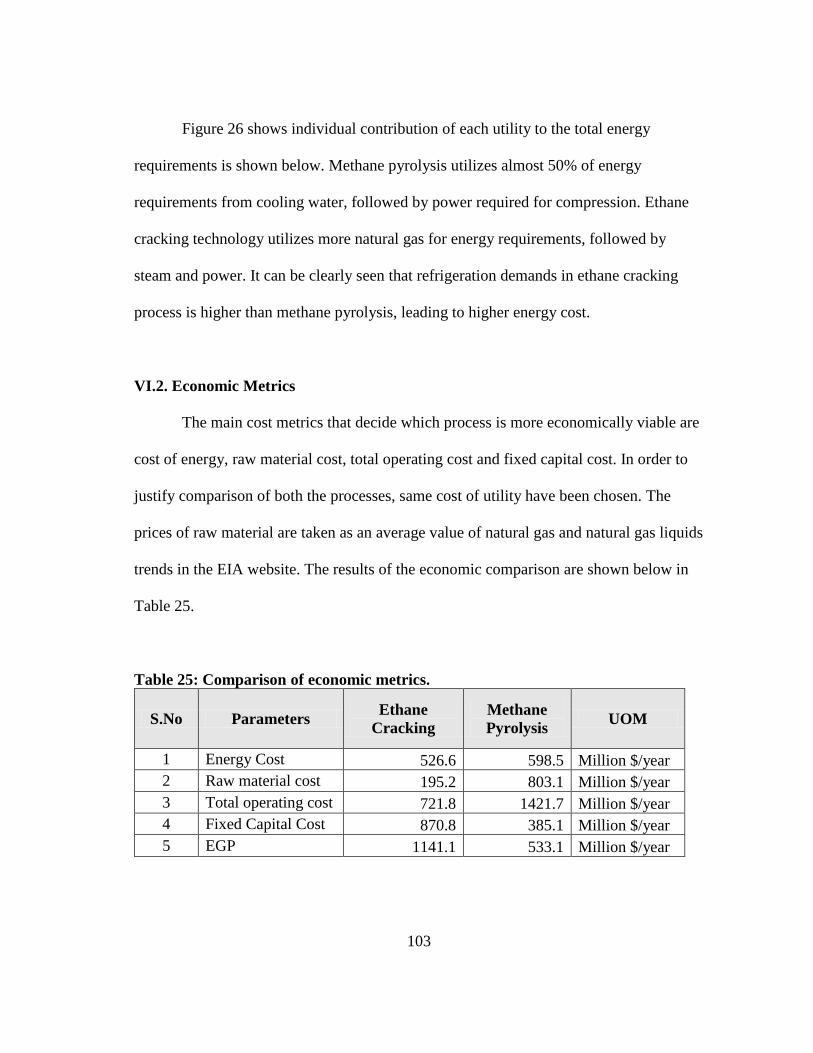
103
Figure 26 shows individual contribution of each utility to the total energy
requirements is shown below. Methane pyrolysis utilizes almost 50% of energy
requirements from cooling water, followed by power required for compression. Ethane
cracking technology utilizes more natural gas for energy requirements, followed by
steam and power. It can be clearly seen that refrigeration demands in ethane cracking
process is higher than methane pyrolysis, leading to higher energy cost.
VI.2. Economic Metrics
The main cost metrics that decide which process is more economically viable are
cost of energy, raw material cost, total operating cost and fixed capital cost. In order to
justify comparison of both the processes, same cost of utility have been chosen. The
prices of raw material are taken as an average value of natural gas and natural gas liquids
trends in the EIA website. The results of the economic comparison are shown below in
Table 25.
Table 25: Comparison of economic metrics.
S.No Parameters Ethane
Cracking
Methane
Pyrolysis UOM
1 Energy Cost 526.6 598.5 Million $/year
2 Raw material cost 195.2 803.1 Million $/year
3 Total operating cost 721.8 1421.7 Million $/year
4 Fixed Capital Cost 870.8 385.1 Million $/year
5 EGP 1141.1 533.1 Million $/year
104
From the table, it can be seen that Ethane cracking process has more economic
advantage over methane pyrolysis process. The total operating cost of methane pyrolysis
is almost twice that of ethane cracking process. This is because of the high rates of
natural gas consumption and external solvent makeup involved in the process. Also, the
study does not include cost of a separate air separation unit, but instead accounts for cost
of oxygen as a raw material. Addition of air separation unit will increase the fixed cost
but there will be no significant reduction in the total operating cost. It can be seen that
the fixed capital cost of Methane pyrolysis is much lower than ethane cracking. This is
because, the reaction chemistry involved is not much complex and does not involve
much hydrocarbons that require rigorous separation processes. The use of selective
absorption of acetylene and conversion of acetylene to ethylene in liquid phase, has
decreased the fixed cost considerably due to ease of separation of product from the
solvent. Also the fixed capital cost of methane pyrolysis may be an underestimation of
the actual cost since other minor unit operations such as pumps, blowers, and other
utility unit operations have not been accounted in the calculation. Nevertheless, the huge
difference in fixed capital cost of both plants emphasize that this error of
underestimation can be neglected thus, proving that fixed capital cost of methane
pyrolysis is lower than ethane cracking process.
Another important analysis that can be inferred from cost of energy is that though
the minimum energy requirements of methane pyrolysis plant were very high, the
operating cost of both the plants are almost same. This is because the utility price of
cooling water is cheaper and even though requirement of cooling water is very high in
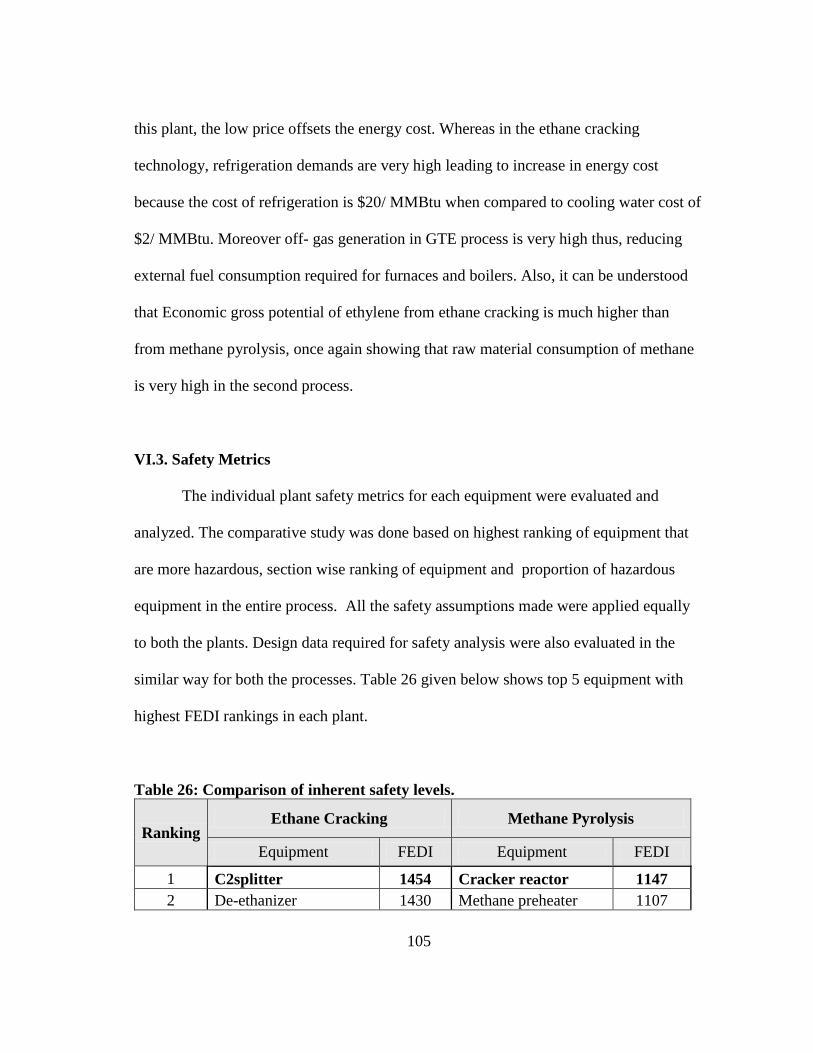
105
this plant, the low price offsets the energy cost. Whereas in the ethane cracking
technology, refrigeration demands are very high leading to increase in energy cost
because the cost of refrigeration is $20/ MMBtu when compared to cooling water cost of
$2/ MMBtu. Moreover off- gas generation in GTE process is very high thus, reducing
external fuel consumption required for furnaces and boilers. Also, it can be understood
that Economic gross potential of ethylene from ethane cracking is much higher than
from methane pyrolysis, once again showing that raw material consumption of methane
is very high in the second process.
VI.3. Safety Metrics
The individual plant safety metrics for each equipment were evaluated and
analyzed. The comparative study was done based on highest ranking of equipment that
are more hazardous, section wise ranking of equipment and proportion of hazardous
equipment in the entire process. All the safety assumptions made were applied equally
to both the plants. Design data required for safety analysis were also evaluated in the
similar way for both the processes. Table 26 given below shows top 5 equipment with
highest FEDI rankings in each plant.
Table 26: Comparison of inherent safety levels.
Ranking Ethane Cracking Methane Pyrolysis
Equipment FEDI Equipment FEDI
1 C2splitter 1454 Cracker reactor 1147
2 De-ethanizer 1430 Methane preheater 1107
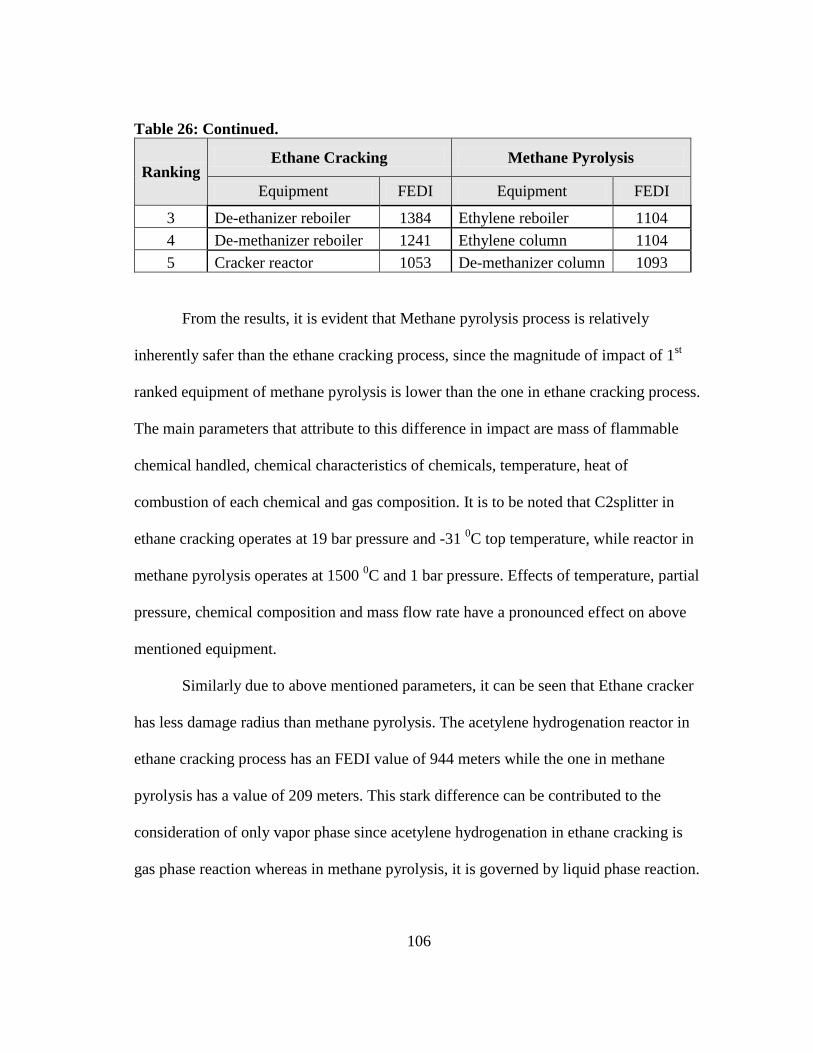
106
Table 26: Continued.
Ranking Ethane Cracking Methane Pyrolysis
Equipment FEDI Equipment FEDI
3 De-ethanizer reboiler 1384 Ethylene reboiler 1104
4 De-methanizer reboiler 1241 Ethylene column 1104
5 Cracker reactor 1053 De-methanizer column 1093
From the results, it is evident that Methane pyrolysis process is relatively
inherently safer than the ethane cracking process, since the magnitude of impact of 1st
ranked equipment of methane pyrolysis is lower than the one in ethane cracking process.
The main parameters that attribute to this difference in impact are mass of flammable
chemical handled, chemical characteristics of chemicals, temperature, heat of
combustion of each chemical and gas composition. It is to be noted that C2splitter in
ethane cracking operates at 19 bar pressure and -31 0C top temperature, while reactor in
methane pyrolysis operates at 1500 0C and 1 bar pressure. Effects of temperature, partial
pressure, chemical composition and mass flow rate have a pronounced effect on above
mentioned equipment.
Similarly due to above mentioned parameters, it can be seen that Ethane cracker
has less damage radius than methane pyrolysis. The acetylene hydrogenation reactor in
ethane cracking process has an FEDI value of 944 meters while the one in methane
pyrolysis has a value of 209 meters. This stark difference can be contributed to the
consideration of only vapor phase since acetylene hydrogenation in ethane cracking is
gas phase reaction whereas in methane pyrolysis, it is governed by liquid phase reaction.
107
This shows an example of reduction in process intensification thus proving that inherent
safety approach of design is effective.
The section wise ranking of both the plants are shown below in Table 27. From
the results, it is evident that pyrolysis section of ethane cracking is less hazardous than
methane pyrolysis plant. Transfer line exchange and Spray tower have similar purpose of
operation in both the processes. The huge difference in the value of FEDI for both the
equipment can be attributed mainly to the operating temperature. The compression
section of both the plants have almost same impact radius. Compressors in methane
pyrolysis plant rank higher than the ones in ethane cracking plant.
In the separation and purification section, it can be observed that the most
hazardous equipment in both the technologies have similar operating conditions and are
involved in separation of product. The difference in damage radius of ethylene column
in methane pyrolysis and C2splitter column in ethane cracking is due to large vapor load
rate present in C2splitter. C2splitter separates ethylene from ethane while ethylene
column separates ethylene from Propadiene. Since ethane and ethylene are close boiling
points, separation requires large number of trays and reflux ratios and hence, the vapor
load of the column is high. The separation of ethylene from Propadiene is relatively easy
and this leads to less vapor load. Another factor to be considered is the quantity of feed
mixture handled.
The above analysis in the section wise ranking gives insight into the process and
this enables easy interpretation of process with safety. This aids in selecting a suitable
separation method and also allocation of units in the process flow.

108
Table 27: Section-wise comparison of FEDI values.
Section Ethane Cracking Methane Pyrolysis
Equipment FEDI Equipment FEDI
Pyrolysis
Cracker reactor 1053 Cracker Reactor 1147
Preheater 1049 Methane Preheater 1106
Transfer Line exchange 817 Spray Tower 349
Compression
Caustic scrubber 949
3rd stage
compression 943
Dryer 918
2nd stage
compression 909
4th stage compression 911
1st stage
compression 897
Separation
and
Purification
C2 splitter column 1455
Ethylene column
& reboiler 1106
De-ethanizer column 1429
De-methanizer
column 1092
De-methanizer reboiler 1383
De-methanizer
reboiler 1061
From the semi quantitative charts shown in previous chapters, it can be observed
that approximately 86% of equipment in ethane cracking process are extremely
hazardous while 76% of equipment in methane pyrolysis are extremely hazardous. This
again proves that methane pyrolysis is inherently safer than ethane cracking process.
Moreover, the number of equipment in the higher range of FEDI (>800 meters) is higher
in ethane cracking process than in methane pyrolysis process. This analysis can be
helpful in providing focus on those areas where process improvement needs to be
achieved. From the above discussed safety analysis it can also be inferred that splitting
equipment for design considerations caused significant reduction in damage radius. This
proves effectiveness of inherent safety design principles.

109
From the above comparative study it can be understood that a top level
comparative study of process, economics and safety can provide significant insights into
the process for improvement in all of the above mentioned areas. The approach used for
this research has proved to be effective in identifying grey areas and has also enabled
easy interpretation of the results thereby, clearly revealing the root causes of
discrepancies in metrics. The analysis shows that ethane cracking process is better in
terms of process performance and economics while methane pyrolysis is better in terms
of inherent safety. This proves the current trends of new projects proposed for
installation of ethane crackers to produce ethylene. Ethane cracking technology is a well-
established, saturated technology and the opportunities for process improvement are very
less. Meanwhile, gas to ethylene process is a relatively new technology where there
exists huge opportunities for improvement. Though process performance and economics
parameters of this technology are poor when compared to ethane cracking process,
appropriate process modifications and material and heat integration can be applied to
improve the process such that safety of the process is improved.

110
CHAPTER VII
CONCLUSION AND RECOMMENDATIONS
In this research, a top level techno-economic and safety analysis of two
technologies producing ethylene, namely the ethane steam cracking and gas to ethylene
processes (Methane pyrolysis) was carried out. The results obtained from this analysis
show that the ethane cracking process is more process efficient and economically
superior while the gas to ethylene is more inherently safer. The approach adopted for
carrying out the analysis was aimed at identifying areas of process improvement and key
safety parameters at a preliminary stage of design while weighing the economic
advantages. The results clearly prove that ethane to ethylene cracking technology is
more widely adapted due to process and economic benefits. At the same time it is
inferred that the new gas to ethylene technology has more scope of process improvement
and requires detail analysis on the process to improve operating efficiency. The early
stage approach used in this thesis has served to reason out different options available for
producing a chemical utilizing minimum process information and this can help take
better future decisions that accounts for technology, cost as well as inherent safety.
From the general methodology of evaluation and results obtained from the study,
it is evident that safety has a direct impact on energy consumption and operating cost.
This enables easy interpretation of process modifications if safety is measured along
with other parameters in the preliminary stages. The limitations of this approach will be
availability of suitable indices that can measure inherent safety and huge amount of time
111
and resource spent on evaluation methods at preliminary stage. The study can be
expanded to identify different safety indices that measure inherent safety needing
minimum process information and the results can be compared to support the decision
making process. Finally, time and resources invested at the initial stage can prove to be
worthy by choosing inherently safer and economically superior process.
Based on the results obtained, the following observations and recommendations
are made that would address the methods of measurement of different metrics,
identification of key performance variables and root causes of hazards.
i. The safety index, HIRA chosen is identified to be flexible in eliminating
those factors that are not essential at the early stage and hence can serve
as a suitable index for measuring inherent safety.
ii. Inclusion of safety analysis in the traditional techno-economic
comparison of two processes provides more insight into the technology
and sparks novel ideas for improving or integrating technologies to
achieve better decision making. Though the gas to ethylene process does
not have a good process or economic potential, low inherent safety levels
of the process creates more necessity to improve the process in terms of
cost and technology.
iii. The assumptions made for safety calculations namely accounting only for
vapor phase, can be modified to suit different application of process
based on solid or fluid handling capability.
112
iv. It is observed that the index has a subtle impact to changes in temperature
and pressure, unless the operating conditions are variable with respect to
flash point and auto ignition temperature. This does not give vital
information about weak areas since most of chemicals in hydrocarbon
industry are operated above flash points and the magnitude of
temperature modification will not be properly reflected in safety index.
v. Similarly, since assumption of vapor phase is made for all unit operations,
the role of pressure deviations will not be effected unless operating
pressure is lesser than atmospheric pressure. This can be overcome by
assuming mixed phase but it can prove to be difficult for evaluating
complex operations such as absorption and distillation columns.
vi. The magnitude of damage potential does not merely point out the direct
damage radius but it indicates the ranking of each equipment with other.
This kind of analysis will help in identifying those equipment which
require more attention in terms of safety and energy consumption.
vii. The above observations indicate that there is a need for invention of new
safety indices that quantitatively measure process parameters while
requiring less process information.
viii. The areas identified for process improvement should be analyzed further
by applying four main design principles of inherent safety design, namely
minimize, moderate, simplify and substitute.

113
ix. The cooling and separation section of ethane cracking process needs to be
studied further for possible alterations in process flow to reduce the
damage radius of distillation columns. It is found that C2splitter is the
most hazardous equipment hence, substitution of another separation
process or splitting of parallel streams should be analyzed for reducing
energy consumption as well as improving safety.
x. Ethane cracking technology has other separation schemes such as front
end de-propanizer, front end de-ethanizer and front end acetylene
hydrogenation.(Takaoka, 1967) The scheme used for this study was front
end de-methanizer. This study can be expanded to analyze all different
schemes for inherent safety and choose that separation scheme that is
inherently safer.
xi. The advantage of using methane pyrolysis technology is that it is a simple
process and has an energy efficient and inherently safer product
separation process when compared to ethane cracking process. The front
end part of the process involving production of acetylene is the portion
that needs focus on safety and process improvement. Studies show that
different types of heat transfer methods can be used for pyrolysis of
methane. All of these methods also have high energy demands due to
large requirements of reaction temperatures, but a study can be done to
compare different processes that can yield less impact on safety and
energy consumption.
114
xii. Since majority of the operating cost of methane pyrolysis plant is due to
large consumption of natural gas, this technology can prove to be cost
efficient in places where natural gas is stranded thus, reducing much of
raw material cost.
xiii. Alternatively, methane pyrolysis technology can prove to be feasible on
being coupled with plants that produce either of raw materials (oxygen or
methane) or utilize the off gas generated in the process to produce some
other value added chemical. This either offsets the cost of raw material or
increases the product value thus, causing an increase in economic gross
potential.
xiv. Since off-gas generated in methane pyrolysis process has large amounts
of hydrogen and carbon monoxide, a feasibility study of integrating
syngas to gasoline or Fischer Tropsch process can be studied. Hence,
methane pyrolysis might have an economic potential on a plants-coupled
basis than as a stand-alone plant.
xv. Heat integration and material integration techniques can be applied to
identify areas that can be pinched for reducing the minimum requirements
of heating and cooling duties thereby reducing energy consumption and
also the number of equipments.

115
REFERENCES
Abedi, A. A. (2007). Economical analysis of a new gas to ethylene technology. (Master
of Science Thesis), Texas A&M University, College Station, Texas.
AichE. (1994). Procedure for Risk Analysis Calculations Dow's Fire & Explosion Index
Hazard Classification Guide (Seventh ed., pp. 3-7). Hoboken, NJ, USA: John
Wiley & Sons, Inc.
Anderson, E. L. (1967). U.S. Patent No. 3,335,198. Washington DC: U.S. Patent and
Trademark Office.
Bauer, P. E., & Maciel Filho, R. (2004). Incorporation of environmental impact criteria
in the design and operation of chemical processes. Brazilian Journal of Chemical
Engineering, 21, 405-414.
Bond, G. C., & Wells, P. B. (1966). The hydrogenation of acetylene: II. The reaction of
acetylene with hydrogen catalyzed by alumina-supported palladium. Journal of
Catalysis, 5(1), 65-73. doi: http://dx.doi.org/10.1016/S0021-9517(66)80126-4
Branan, C. R. (2012). Rules of Thumb for Chemical Engineers (5 ed.). Oxford, UK:
Elsevier Science.
Browning, J. B. (1993). Union Carbide: Disaster at Bhopal. In J. Gottschalk (Ed.),
Crisis: Inside stories of managing image under siege (pp. 365-382). Detroit:
Visible Ink.
116
Burr, B., & Lyddon, L. (2008). A comparison of physical solvents for acid gas removal.
Paper presented at the 87th Annual Gas Processors Association Convention,
Grapevine, TX.
Cantrell, J., Bullin, J., McIntyre, G., Butts, C., & Cheatham, B. (2013). Consider GTL as
an economic alternative for stranded natural gas and ethane. Hydrocarbon
processing, 92(10), 77-80.
Center for Chemical Process, S. (2008a). The Concept of Inherent Safety Inherently
Safer Chemical Processes: A Life Cycle Approach (Second ed., pp. 9-19).
Hoboken, NJ, USA: John Wiley & Sons, Inc.
Center for Chemical Process, S. (2008b). Introduction Inherently Safer Chemical
Processes: A Life Cycle Approach (Second ed., pp. 1-8). Hoboken, NJ, USA:
John Wiley & Sons, Inc.
Chang, J. (2014). New projects may raise US ethylene capacity by 52%, PE by 47%.
ICIS News. Retrieved from
http://www.icis.com/resources/news/2014/01/16/9744545/new-projects-may-
raise-us-ethylene-capacity-by-52-pe-by-47-/
Chapel, D. G., Mariz, C. L., & Ernest, J. (1999, October 4-6). Recovery of CO2 from flue
gases: commercial trends. Paper presented at the Canadian Society of Chemical
Engineers Annual Meeting, Saskatoon, Saskatchewan, Canada.
Chuang, K., & Nandakumar, K. (2000). Tray columns: design Encyclopedia of
Separation Science (pp. 1135-1140). San Diego: Academic Press.
117
Coker, A. K. (2007). Ludwig's applied process design for chemical and petrochemical
plants (Fourth ed. Vol. 1). Burlington, MA, USA: Elsevier Gulf Professional
Pub.
Dennis, C. H. (2012). lnherently Safer Design: The Fundamentals. CEP, 40-42.
Retrieved from AIChE website:
http://www.aiche.org/resources/publications/cep/2012/january
Edwards, D. W., & Lawrence, D. (1993). Assessing the inherent safety of chemical
process routes: Is there a relation between plant costs and inherent safety?
Process Safety and Environmental Protection, 71(B4), 252-258.
El-Halwagi, M. M. (2012). Sustainable design through process integration:
fundamentals and applications to industrial pollution prevention, resource
conservation, and profitability enhancement. Waltham, MA, USA: Elsevier.
Froment, G. P., Van de Steene, B. O., Van Damme, P. S., Narayanan, S., & Goossens,
A. G. (1976). Thermal cracking of ethane and ethane-propane mixtures.
Industrial & Engineering Chemistry Process Design and Development, 15(4),
495-504.
Gattis, S. C., Peterson, E. R., & Johnson, M. M. (2004). The ÉCLAIRS Process for
Converting Natural Gas to Hydrocarbon Liquids: Dallas: SYNFUELS Int. Inc.
Gupta, J. P. (2002). The Bhopal gas tragedy: could it have happened in a developed
country? Journal of Loss Prevention in the Process Industries, 15(1), 1-4. doi:
http://dx.doi.org/10.1016/S0950-4230(01)00025-0

118
Hall, K. R. (2005). A new gas to liquids (GTL) or gas to ethylene (GTE) technology.
Catalysis Today, 106(1–4), 243-246. doi:
http://dx.doi.org/10.1016/j.cattod.2005.07.176
Hammond, C., & Ham, V. (2009). Caustic Tower Operation–Considerations for
Effective Performance. Paper presented at the AIChE, Ethylene Producers’
Conference, Houston, Texas.
Heikkilä, A.-M., Hurme, M., & Järveläinen, M. (1996). Safety considerations in process
synthesis. Computers & chemical engineering, 20, S115-S120.
Holmen, A. (2009). Direct conversion of methane to fuels and chemicals. Catalysis
Today, 142(1), 2-8.
Holmen, A., Olsvik, O., & Rokstad, O. A. (1995). Pyrolysis of natural gas: chemistry
and process concepts. Fuel Processing Technology, 42(2–3), 249-267. doi:
http://dx.doi.org/10.1016/0378-3820(94)00109-7
ICIS. (2015). Ethylene & Propylene Supply and Demand. Retrieved February 25, 2015,
from http://www.icis.com/services/analysis/analysis-supply-and-demand-
database/
Jain, S., Moharir, A., Li, P., & Wozny, G. (2003). Heuristic design of pressure swing
adsorption: a preliminary study. Separation and Purification Technology, 33(1),
25-43.
Khan, F. I., & Abbasi, S. (1998). Multivariate hazard identification and ranking system.
Process Safety Progress, 17(3), 157-170.
119
Khan, F. I., & Amyotte, P. R. (2003). How to make inherent safety practice a reality. The
Canadian Journal of Chemical Engineering, 81(1), 2-16.
Khan, F. I., Husain, T., & Abbasi, S. (2001). Safety weighted hazard index (SWeHI): a
new, user-friendly tool for swift yet comprehensive hazard identification and
safety evaluation in chemical process industrie. Process Safety and
Environmental Protection, 79(2), 65-80.
Khan, F. I., Sadiq, R., & Amyotte, P. R. (2003). Evaluation of available indices for
inherently safer design options. Process Safety Progress, 22(2), 83-97.
Kletz, T. A. (1985). Inherently safer plants. Plant/Operations Progress, 4(3), 164-167.
Kletz, T. A. (2 6). Accident investigation: eep as ing “why?”. Journal of Hazardous
Materials, 130(1), 69-75.
Lewis, D. (1979). The Mond Fire, Explosion and Toxicity Index-a Development of the
Dow Index. Paper presented at the Proceedings of the AIChE on loss prevention
symposium, New York, USA.
Maher, S. T., Norton, K. D., & Surmeli, S. (2012). Design an inherently safer plant.
Chemical Engineering Progress, 108(1), 43-47.
Noureldin, M. M., Elbashir, N. O., & El-Halwagi, M. M. (2013). Optimization and
selection of reforming approaches for syngas generation from natural/shale gas.
Industrial & Engineering Chemistry Research, 53(5), 1841-1855.
Olivier Ducreux, & Nedez, C. (2011). Air and gas Drying with AxsorbTM Activated
Alumina. Retrieved from Axens website:

120
http://usa.axens.net/en/component/axensdocuments/875/air-and-gas-drying-with-
axsorb-activated-alumina/english.html
Pässler, P., Hefner, W., Buckl, K., Meinass, H., Meiswinkel, A., Wernicke, H.-J., . . .
Mayer, D. (2012). Acetylene Ullmann's Encyclopedia of Industrial Chemistry.
Weinheim: Wiley-VCH Verlag GmbH & Co. KGaA,.
Peramanu, S., Cox, B. G., & Pruden, B. B. (1999). Economics of hydrogen recovery
processes for the purification of hydroprocessor purge and off-gases.
International Journal of Hydrogen Energy, 24(5), 405-424. doi:
http://dx.doi.org/10.1016/S0360-3199(98)00105-0
Ren, T., Patel, M., & Blok, K. (2006). Olefins from conventional and heavy feedstocks:
Energy use in steam cracking and alternative processes. Energy, 31(4), 425-451.
Ries, H. C. (1966). Acetylene Process Economics program. Menlo Park, California:
Stanford Research Institute.
S2S-A Gateway for Plant and Process Safety. (2003). Layer of Protection Model.
Retrieved February 25, 2015, from http://www.safety-
s2s.eu/modules.php?name=s2s_wp4&idpart=2&op=v&idp=750
Shah, R. K., Se uli , D. a. P. (2 3). Fundamentals of heat exchanger design.
Hoboken, NJ, USA: John Wiley & Sons
Sundaram, K. M., & Froment, G. F. (1977). Modeling of thermal cracking kinetics—I:
Thermal cracking of ethane, propane and their mixtures. Chemical Engineering
Science, 32(6), 601-608. doi: http://dx.doi.org/10.1016/0009-2509(77)80225-X
121
Tabe‐Mohammadi, A., Villaluenga, J. P. G., Kim, H. J., Chan, T., & Rauw, V. (2001).
Effects of polymer solvents on the performance of cellulose acetate membranes
in methanol/methyl tertiary butyl ether separation. Journal of applied polymer
science, 82(12), 2882-2895.
Takaoka, S. (1967). Ethylene Process Economics Program. Menlo park, California:
Stanford Research Institute.
Thomas K. Swift, Martha G. Moore, & Sanchez, E. (2011). Shale Gas and New
petrochemicals Investment: Benefits for the Economy, Jobs, and US
Manufacturing Economics & Statistics: American Chemistry Council.
True, W. R. (2013). Global ethylene capacity poised for major expansion. Oil & gas
journal, 111(7), 90-95.
Wolf, E. E. (1992). Methane conversion by oxidative processes. New York, NY (United
States): Van Nostrand Reinhold Co., Inc.
Wood, D. A., Nwaoha, C., & Towler, B. F. (2012). Gas-to-liquids (GTL): A review of
an industry offering several routes for monetizing natural gas. Journal of Natural
Gas Science and Engineering, 9(0), 196-208. doi:
http://dx.doi.org/10.1016/j.jngse.2012.07.001

122
APPENDIX
Table 28: Safety data of chemicals
Chemicals Fire point
Autoignition Temperature
Flash Point
NFPA - F
NFPA - R
Heat of Combustion
Deg C Deg C KJ/mol
Hydrogen -190 570 -200 4 0 -286
Ethane -125 515 -135 4 0 -1561
Methane -177.9 580 -187.9 4 0 -891.1
Propane -94 470 -104 4 0 -2219.7
Ethylene -126 490 -136 4 2 -1410.9
Propylene -98 458 -108 4 1 -2057.8
Butadiene -75 415 -85 4 2 -2540.4
Acetylene -8 300 -18 4 3 -1299.6
Propadiene -86 453.85 -96 4 1 -1913.4
Carbon monoxide -181 609 -191 4 2 -284
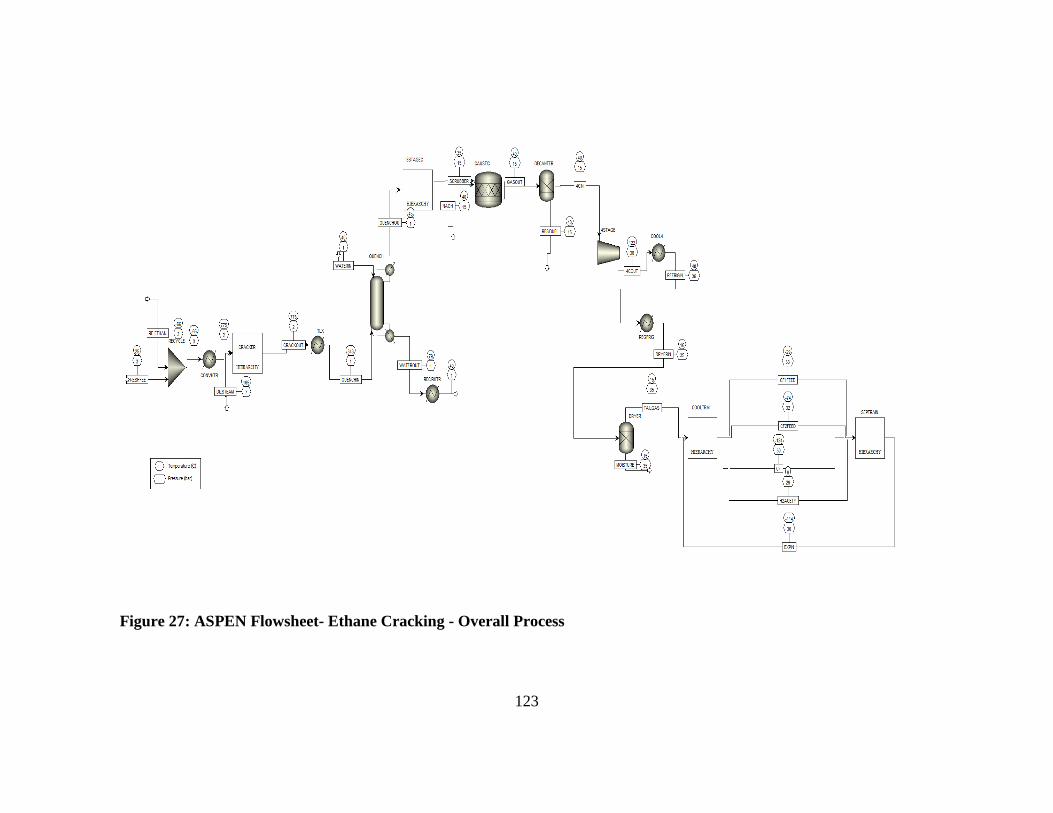
123
Figure 27: ASPEN Flowsheet- Ethane Cracking - Overall Process
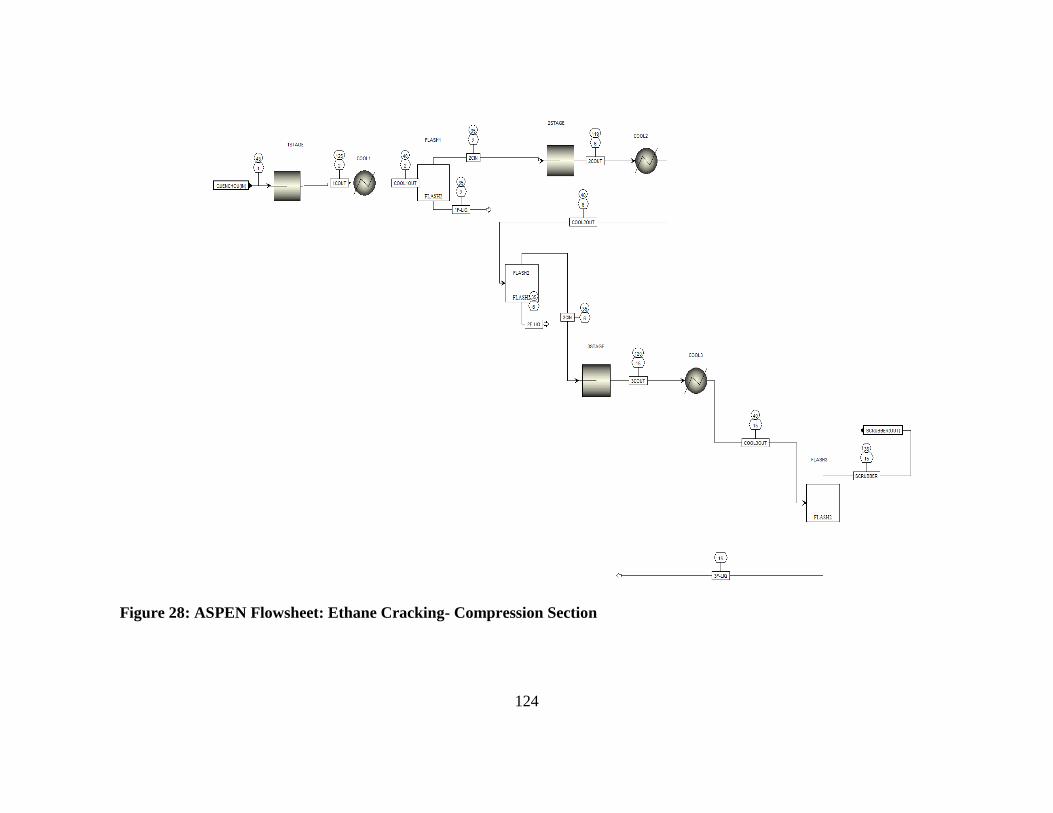
124
Figure 28: ASPEN Flowsheet: Ethane Cracking- Compression Section
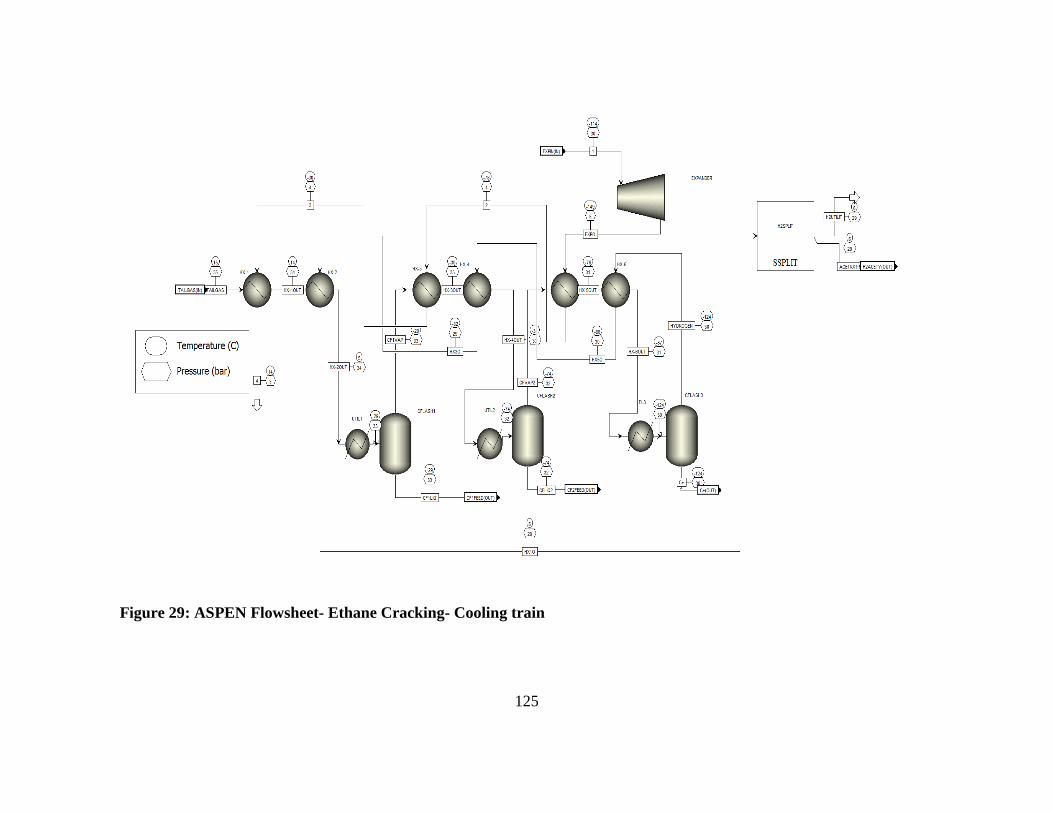
125
Figure 29: ASPEN Flowsheet- Ethane Cracking- Cooling train
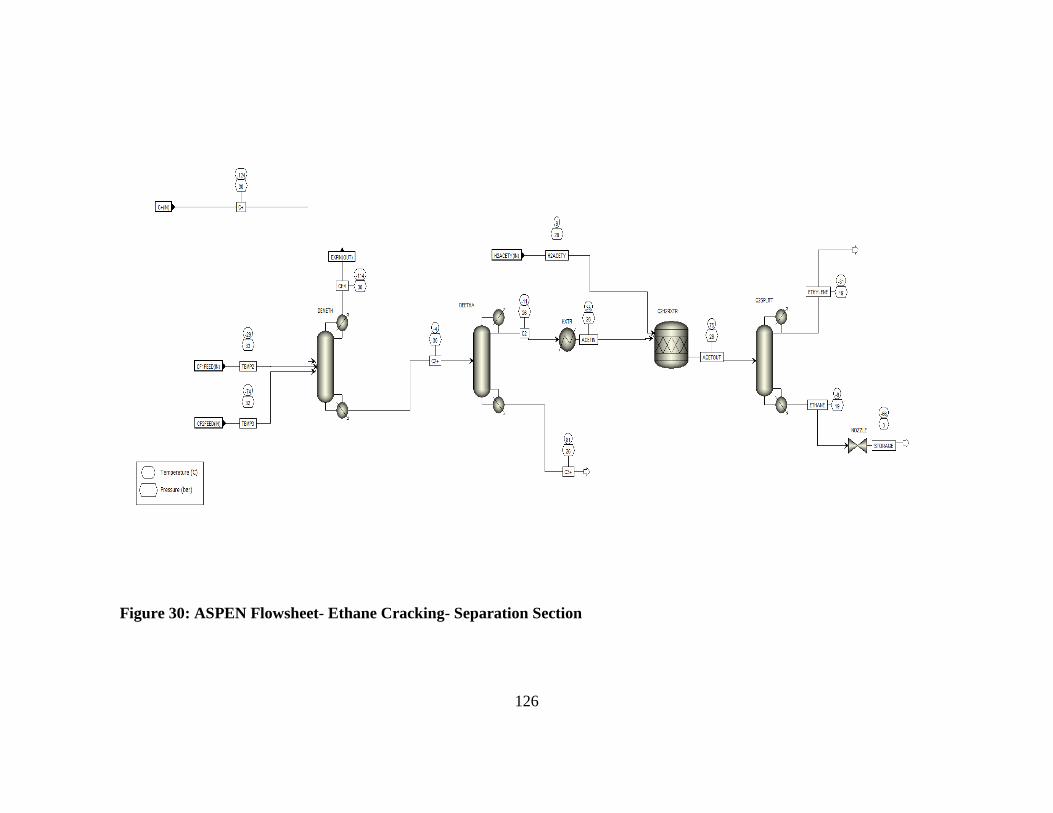
126
Figure 30: ASPEN Flowsheet- Ethane Cracking- Separation Section

127
Figure 31: ASPEN Flowsheet- Gas to Ethylene - Pyrolysis and Compression Section
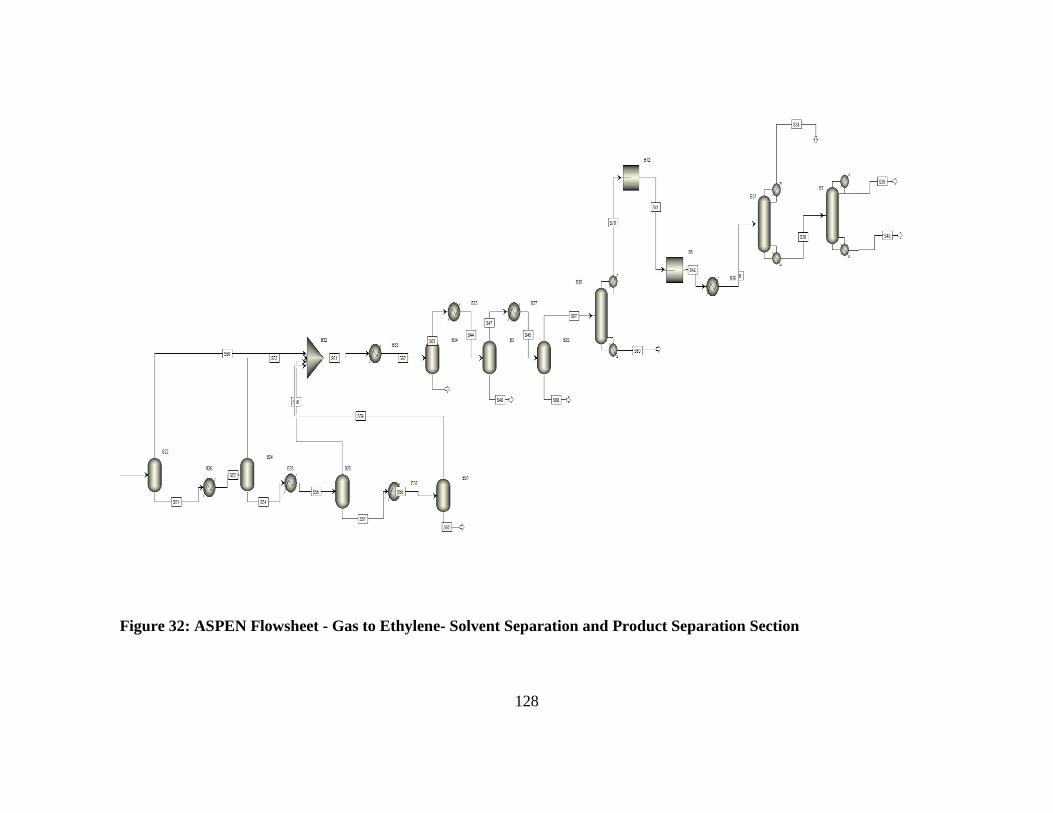
128
Figure 32: ASPEN Flowsheet - Gas to Ethylene- Solvent Separation and Product Separation Section

129
Table 29: Safety calculation sheet of physical units- Ethane Cracking
S.No Physical Units
Mass flow rate
(kg/s)
Heat of combust
ion (J/mol)
Processing Pressure
(kPa) Volume (m3)
Temperature (degC)
NFPA ranki
ng Reacti
vity
NFPA ranking flammability F1 F2
Hydrogen mol frac
Ethylene mol frac
Methane mol frac
Propane mol frac
Acetylene mol frac
Butadiene mol frac
Ethane mol frac
Propylene mol frac pn1 pn2 pn3 pn4 pn5 pn6
Damage Potential FEDI
1 Preheater 51 1552152 300 0.2 775 0.0 4.0 2530355 118 0 2.01E-02 3.84E-26 2.82E-08 0 1.05E-12 0.9762 6.12E-06 1.95 1.4 1.1 2.0 1 1 10889697 1049
2 Transfer Line exchange 51 788187 160 2.6 840 0.6 3.0 1265206 796 0.2668 0.2653 2.26E-02 8.45E-04 4.14E-03 2.76E-03 0.1893 3.71E-03 1.95 1.4 1.1 1.9 1 1 5141118 817
3 Quench tower-1 17 788187 110 247.5 343 0.6 3.0 421735.3 51884 0.2668 0.2653 2.26E-02 8.45E-04 4.14E-03 2.76E-03 0.1893 3.71E-03 1.95 1.4 1.1 1.9 1 1 1864230 583
4 Quench tower-2 17 788187 110 247.5 343 0.6 3.0 421735.3 51884 0.2668 0.2653 2.26E-02 8.45E-04 4.14E-03 2.76E-03 0.1893 3.71E-03 1.95 1.4 1.1 1.9 1 1 1864230 583
5 Quench tower-3 17 788187 110 247.5 343 0.6 3.0 421735.3 51884 0.2668 0.2653 2.26E-02 8.45E-04 4.14E-03 2.76E-03 0.1893 3.71E-03 1.95 1.4 1.1 1.9 1 1 1864230 583
6 1stage compressor 55 963468 240 125.2 0.7 3.7 1688840 0 0.3261 0.3243 2.77E-02 1.03E-03 5.06E-03 3.37E-03 0.2314 4.54E-03 1.75 1.4 1.1 2.1 1 1 6801830 897
7 Inter-stage cool 1 A 28 963468 240 5.3 125.2 0.7 3.7 844420 2437 0.3261 0.3243 2.77E-02 1.03E-03 5.06E-03 3.37E-03 0.2314 4.54E-03 1.75 1.4 1.1 2.1 1 1 3408766 713
8 Inter-stage cool 1 B 28 963468 240 5.3 125.2 0.7 3.7 844420 2437 0.3261 0.3243 2.77E-02 1.03E-03 5.06E-03 3.37E-03 0.2314 4.54E-03 1.75 1.4 1.1 2.1 1 1 3408766 713
9 Flash drum 1 52 1019824 240 0.9 35 0.7 3.9 1694487 401 0.3452 0.3433 2.93E-02 1.09E-03 5.35E-03 3.57E-03 0.2449 4.80E-03 1.75 1.4 1.1 2.2 1 1 7034283 907
10 2nd stage compressor 52 1019824 600 119 0.7 3.9 1694487 0 0.3452 0.3433 2.93E-02 1.09E-03 5.35E-03 3.57E-03 0.2449 4.80E-03 1.75 1.4 1.1 2.2 1 1 7033096 907
11 Inter-stage cool2 52 1019824 600 5.7 119 0.7 3.9 1694487 6462 0.3452 0.3433 2.93E-02 1.09E-03 5.35E-03 3.57E-03 0.2449 4.80E-03 1.75 1.4 1.1 2.2 1 1 7054551 908
12 Flash drum 2 52 1032146 600 0.2 35 0.7 4.0 1695926 203 0.3494 0.3474 2.96E-02 1.11E-03 5.42E-03 3.61E-03 0.2479 4.86E-03 1.75 1.4 1.1 2.2 1 1 7085283 909
13 3rdstage compressor 52 1032146 1500 120 0.7 4.0 1695926 0 0.3494 0.3474 2.96E-02 1.11E-03 5.42E-03 3.61E-03 0.2479 4.86E-03 1.75 1.4 1.1 2.2 1 1 7084654 909
14 Inter-stage cool3 52 1032146 1500 4.2 77 0.7 4.0 1695926 12021 0.3494 0.3474 2.96E-02 1.11E-03 5.42E-03 3.61E-03 0.2479 4.86E-03 1.75 1.4 1.1 2.2 1 1 7124827 911
Flash drum 3 NO
LIQUID 1.0 1 1
15 Caustic scrubber 52 1032146 1500 105.4 40 0.7 4.0 1690552 301400 0.3494 0.3474 2.96E-02 1.11E-03 5.42E-03 3.61E-03 0.2479 4.86E-03 1.75 1.4 1.1 2.2 1 1 8069473 950
16 4th stage compressor 52 1032146 3600 122 0.7 4.0 1690552 0 0.3494 0.3474 2.96E-02 1.11E-03 5.42E-03 3.61E-03 0.2479 4.86E-03 1.75 1.4 1.1 2.2 1 1 7062206 908
17 Inter-stage cool4 52 1032146 3600 3.4 122 0.7 4.0 1690552 23203 0.3494 0.3474 2.96E-02 1.11E-03 5.42E-03 3.61E-03 0.2479 4.86E-03 1.75 1.4 1.1 2.2 1 1 7139749 912
18 Refrigeration cooler 52 1032146 3550 2.3 40 0.7 4.0 1690552 15558 0.3494 0.3474 2.96E-02 1.11E-03 5.42E-03 3.61E-03 0.2479 4.86E-03 1.75 1.4 1.1 2.2 1 1 7114201 911
19 Dryer 51 1043266 3500 8.2 15 0.7 4.0 1691460 54646 0.3532 0.3511 2.99E-02 1.12E-03 5.48E-03 3.65E-03 0.2506 4.91E-03 1.75 1.4 1.1 2.2 1 1 7290748 918
20 Cool train hx1 51 1043266 3450 0.1 15 0.7 4.0 1691460 654 0.3532 0.3511 2.99E-02 1.12E-03 5.48E-03 3.65E-03 0.2506 4.91E-03 1.75 1.4 1.1 2.2 1 1 7109261 910
21 Cool train hx2 51 1043266 3400 0.7 14 0.7 4.0 1691460 4253 0.3532 0.3511 2.99E-02 1.12E-03 5.48E-03 3.65E-03 0.2506 4.91E-03 1.75 1.4 1.1 2.2 1 1 7121360 911
22 Cool train hx3-A 17 1043266 3350 8.0 5 0.7 4.0 563820 51253 0.3532 0.3511 2.99E-02 1.12E-03 5.48E-03 3.65E-03 0.2506 4.91E-03 1.75 1.4 1.1 2.2 1 1 2541302 646
23 Cool train hx3-B 17 1043266 3350 8.0 5 0.7 4.0 563820 51253 0.3532 0.3511 2.99E-02 1.12E-03 5.48E-03 3.65E-03 0.2506 4.91E-03 1.75 1.4 1.1 2.2 1 1 2541302 646
24 Cool train hx3-C 17 1043266 3350 8.3 5 0.7 4.0 563820 52806 0.3532 0.3511 2.99E-02 1.12E-03 5.48E-03 3.65E-03 0.2506 4.91E-03 1.75 1.4 1.1 2.2 1 1 2546523 647
25 Cool train hx4 37 946011 3300 0.1 -29 0.7 4.0 1115733 544 0.4268 0.3254 3.40E-02 4.56E-04 4.78E-03 5.74E-04 0.2057 2.32E-03 1.75 1.4 1.1 2.2 1 1 4656384 791
26 Cool train hx5 37 946011 3250 1.1 -29.7 0.7 4.0 1115733 6733 0.4268 0.3254 3.40E-02 4.56E-04 4.78E-03 5.74E-04 0.2057 2.32E-03 1.75 1.4 1.1 2.2 1 1 4677039 792
27 Cool train hx6-A 19 946011 3200 6.1 -33 0.7 4.0 557866.6 37062 0.4268 0.3254 3.40E-02 4.56E-04 4.78E-03 5.74E-04 0.2057 2.32E-03 1.75 1.4 1.1 2.2 1 1 2450974 639
28 Cool train hx6- B 19 946011 3200 6.1 -33 0.7 4.0 557866.6 37062 0.4268 0.3254 3.40E-02 4.56E-04 4.78E-03 5.74E-04 0.2057 2.32E-03 1.75 1.4 1.1 2.2 1 1 2450974 639
29 Cool train hx7 7 472554 3150 0.1 -74 0.2 4.0 105337.2 535 0.819 0.1005 4.30E-02 9.93E-06 1.06E-03 1.86E-06 3.63E-02 7.05E-05 1.75 1.4 1.1 2.1 1 1 417582 354
30 Cool train hx8 7 472554 3100 0.6 -76 0.2 4.0 105337.2 3616 0.819 0.1005 4.30E-02 9.93E-06 1.06E-03 1.86E-06 3.63E-02 7.05E-05 1.75 1.4 1.1 2.1 1 1 427313 357
31 Cool train hx9 7 472554 3050 1.7 -87 0.2 4.0 105337.2 9775 0.819 0.1005 4.30E-02 9.93E-06 1.06E-03 1.86E-06 3.63E-02 7.05E-05 1.75 1.4 1.1 2.1 1 1 446768 362
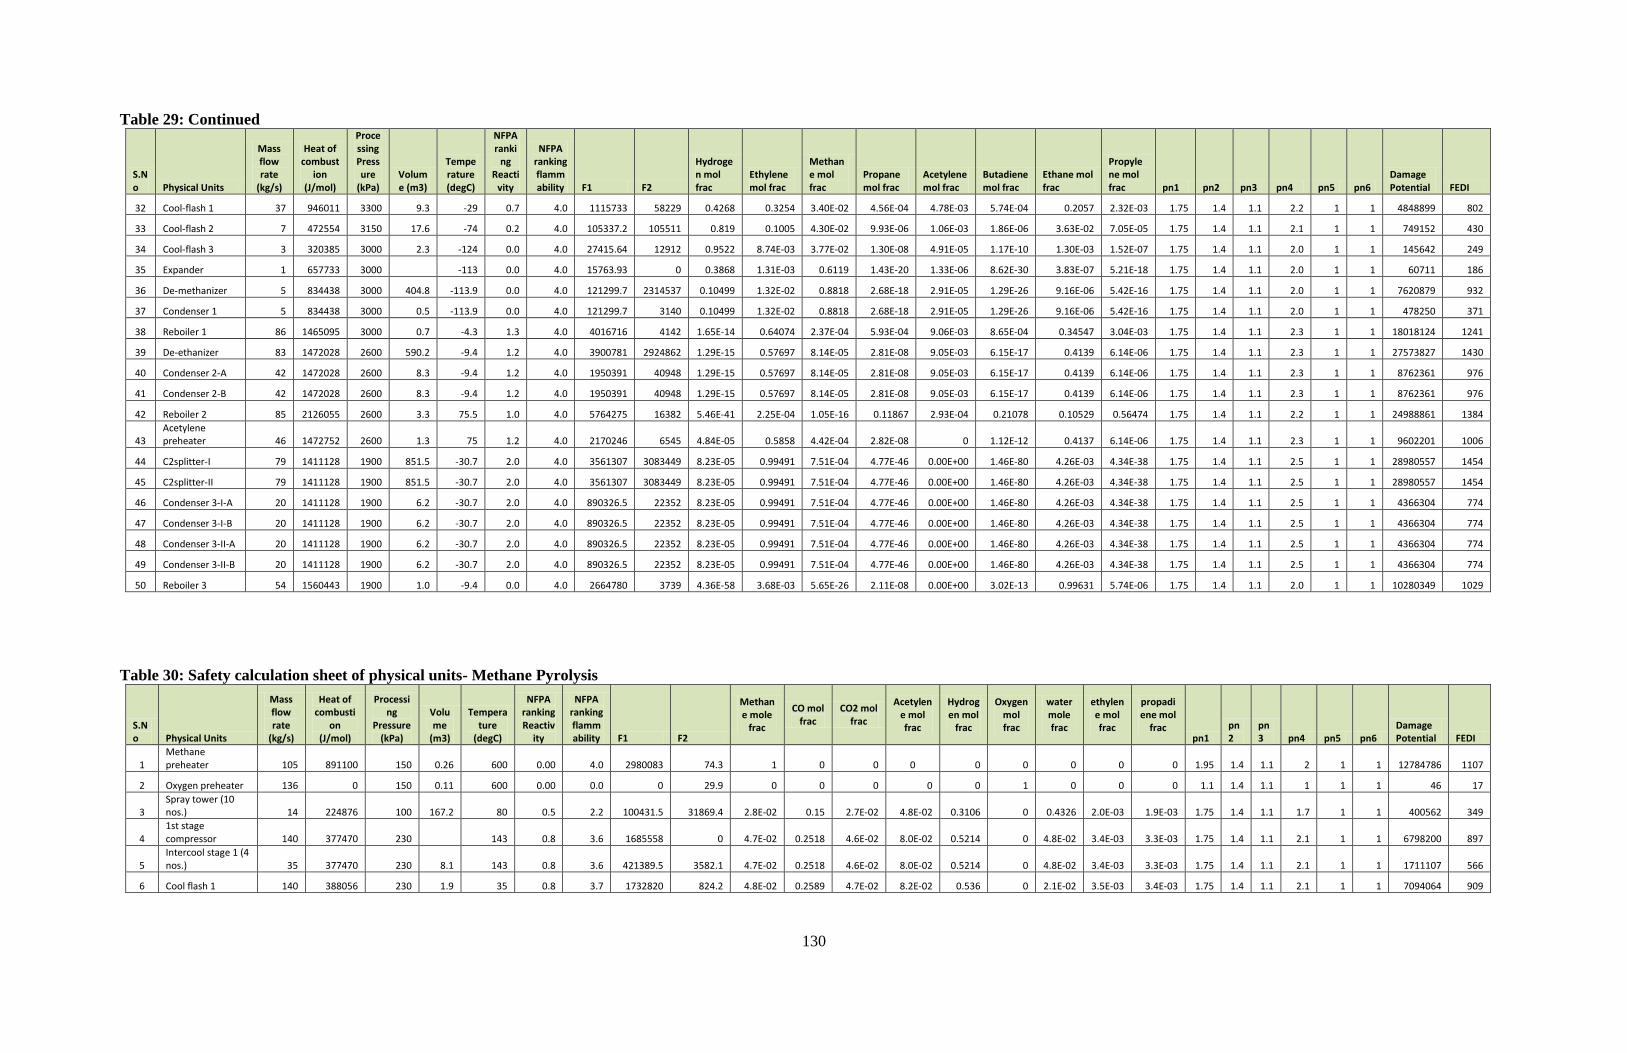
130
Table 29: Continued
S.No Physical Units
Mass flow rate
(kg/s)
Heat of combust
ion (J/mol)
Processing Pressure
(kPa) Volume (m3)
Temperature (degC)
NFPA ranki
ng Reacti
vity
NFPA ranking flammability F1 F2
Hydrogen mol frac
Ethylene mol frac
Methane mol frac
Propane mol frac
Acetylene mol frac
Butadiene mol frac
Ethane mol frac
Propylene mol frac pn1 pn2 pn3 pn4 pn5 pn6
Damage Potential FEDI
32 Cool-flash 1 37 946011 3300 9.3 -29 0.7 4.0 1115733 58229 0.4268 0.3254 3.40E-02 4.56E-04 4.78E-03 5.74E-04 0.2057 2.32E-03 1.75 1.4 1.1 2.2 1 1 4848899 802
33 Cool-flash 2 7 472554 3150 17.6 -74 0.2 4.0 105337.2 105511 0.819 0.1005 4.30E-02 9.93E-06 1.06E-03 1.86E-06 3.63E-02 7.05E-05 1.75 1.4 1.1 2.1 1 1 749152 430
34 Cool-flash 3 3 320385 3000 2.3 -124 0.0 4.0 27415.64 12912 0.9522 8.74E-03 3.77E-02 1.30E-08 4.91E-05 1.17E-10 1.30E-03 1.52E-07 1.75 1.4 1.1 2.0 1 1 145642 249
35 Expander 1 657733 3000 -113 0.0 4.0 15763.93 0 0.3868 1.31E-03 0.6119 1.43E-20 1.33E-06 8.62E-30 3.83E-07 5.21E-18 1.75 1.4 1.1 2.0 1 1 60711 186
36 De-methanizer 5 834438 3000 404.8 -113.9 0.0 4.0 121299.7 2314537 0.10499 1.32E-02 0.8818 2.68E-18 2.91E-05 1.29E-26 9.16E-06 5.42E-16 1.75 1.4 1.1 2.0 1 1 7620879 932
37 Condenser 1 5 834438 3000 0.5 -113.9 0.0 4.0 121299.7 3140 0.10499 1.32E-02 0.8818 2.68E-18 2.91E-05 1.29E-26 9.16E-06 5.42E-16 1.75 1.4 1.1 2.0 1 1 478250 371
38 Reboiler 1 86 1465095 3000 0.7 -4.3 1.3 4.0 4016716 4142 1.65E-14 0.64074 2.37E-04 5.93E-04 9.06E-03 8.65E-04 0.34547 3.04E-03 1.75 1.4 1.1 2.3 1 1 18018124 1241
39 De-ethanizer 83 1472028 2600 590.2 -9.4 1.2 4.0 3900781 2924862 1.29E-15 0.57697 8.14E-05 2.81E-08 9.05E-03 6.15E-17 0.4139 6.14E-06 1.75 1.4 1.1 2.3 1 1 27573827 1430
40 Condenser 2-A 42 1472028 2600 8.3 -9.4 1.2 4.0 1950391 40948 1.29E-15 0.57697 8.14E-05 2.81E-08 9.05E-03 6.15E-17 0.4139 6.14E-06 1.75 1.4 1.1 2.3 1 1 8762361 976
41 Condenser 2-B 42 1472028 2600 8.3 -9.4 1.2 4.0 1950391 40948 1.29E-15 0.57697 8.14E-05 2.81E-08 9.05E-03 6.15E-17 0.4139 6.14E-06 1.75 1.4 1.1 2.3 1 1 8762361 976
42 Reboiler 2 85 2126055 2600 3.3 75.5 1.0 4.0 5764275 16382 5.46E-41 2.25E-04 1.05E-16 0.11867 2.93E-04 0.21078 0.10529 0.56474 1.75 1.4 1.1 2.2 1 1 24988861 1384
43 Acetylene preheater 46 1472752 2600 1.3 75 1.2 4.0 2170246 6545 4.84E-05 0.5858 4.42E-04 2.82E-08 0 1.12E-12 0.4137 6.14E-06 1.75 1.4 1.1 2.3 1 1 9602201 1006
44 C2splitter-I 79 1411128 1900 851.5 -30.7 2.0 4.0 3561307 3083449 8.23E-05 0.99491 7.51E-04 4.77E-46 0.00E+00 1.46E-80 4.26E-03 4.34E-38 1.75 1.4 1.1 2.5 1 1 28980557 1454
45 C2splitter-II 79 1411128 1900 851.5 -30.7 2.0 4.0 3561307 3083449 8.23E-05 0.99491 7.51E-04 4.77E-46 0.00E+00 1.46E-80 4.26E-03 4.34E-38 1.75 1.4 1.1 2.5 1 1 28980557 1454
46 Condenser 3-I-A 20 1411128 1900 6.2 -30.7 2.0 4.0 890326.5 22352 8.23E-05 0.99491 7.51E-04 4.77E-46 0.00E+00 1.46E-80 4.26E-03 4.34E-38 1.75 1.4 1.1 2.5 1 1 4366304 774
47 Condenser 3-I-B 20 1411128 1900 6.2 -30.7 2.0 4.0 890326.5 22352 8.23E-05 0.99491 7.51E-04 4.77E-46 0.00E+00 1.46E-80 4.26E-03 4.34E-38 1.75 1.4 1.1 2.5 1 1 4366304 774
48 Condenser 3-II-A 20 1411128 1900 6.2 -30.7 2.0 4.0 890326.5 22352 8.23E-05 0.99491 7.51E-04 4.77E-46 0.00E+00 1.46E-80 4.26E-03 4.34E-38 1.75 1.4 1.1 2.5 1 1 4366304 774
49 Condenser 3-II-B 20 1411128 1900 6.2 -30.7 2.0 4.0 890326.5 22352 8.23E-05 0.99491 7.51E-04 4.77E-46 0.00E+00 1.46E-80 4.26E-03 4.34E-38 1.75 1.4 1.1 2.5 1 1 4366304 774
50 Reboiler 3 54 1560443 1900 1.0 -9.4 0.0 4.0 2664780 3739 4.36E-58 3.68E-03 5.65E-26 2.11E-08 0.00E+00 3.02E-13 0.99631 5.74E-06 1.75 1.4 1.1 2.0 1 1 10280349 1029
Table 30: Safety calculation sheet of physical units- Methane Pyrolysis
S.No Physical Units
Mass flow rate
(kg/s)
Heat of combusti
on (J/mol)
Processing
Pressure (kPa)
Volume
(m3)
Temperature
(degC)
NFPA ranking Reactiv
ity
NFPA ranking flammability F1 F2
Methane mole
frac
CO mol frac
CO2 mol frac
Acetylene mol frac
Hydrogen mol
frac
Oxygen mol frac
water mole frac
ethylene mol frac
propadiene mol
frac pn1
pn2
pn3 pn4 pn5 pn6
Damage Potential FEDI
1 Methane preheater 105 891100 150 0.26 600 0.00 4.0 2980083 74.3 1 0 0 0 0 0 0 0 0 1.95 1.4 1.1 2 1 1 12784786 1107
2 Oxygen preheater 136 0 150 0.11 600 0.00 0.0 0 29.9 0 0 0 0 0 1 0 0 0 1.1 1.4 1.1 1 1 1 46 17
3 Spray tower (10 nos.) 14 224876 100 167.2 80 0.5 2.2 100431.5 31869.4 2.8E-02 0.15 2.7E-02 4.8E-02 0.3106 0 0.4326 2.0E-03 1.9E-03 1.75 1.4 1.1 1.7 1 1 400562 349
4 1st stage compressor 140 377470 230 143 0.8 3.6 1685558 0 4.7E-02 0.2518 4.6E-02 8.0E-02 0.5214 0 4.8E-02 3.4E-03 3.3E-03 1.75 1.4 1.1 2.1 1 1 6798200 897
5 Intercool stage 1 (4 nos.) 35 377470 230 8.1 143 0.8 3.6 421389.5 3582.1 4.7E-02 0.2518 4.6E-02 8.0E-02 0.5214 0 4.8E-02 3.4E-03 3.3E-03 1.75 1.4 1.1 2.1 1 1 1711107 566
6 Cool flash 1 140 388056 230 1.9 35 0.8 3.7 1732820 824.2 4.8E-02 0.2589 4.7E-02 8.2E-02 0.536 0 2.1E-02 3.5E-03 3.4E-03 1.75 1.4 1.1 2.1 1 1 7094064 909
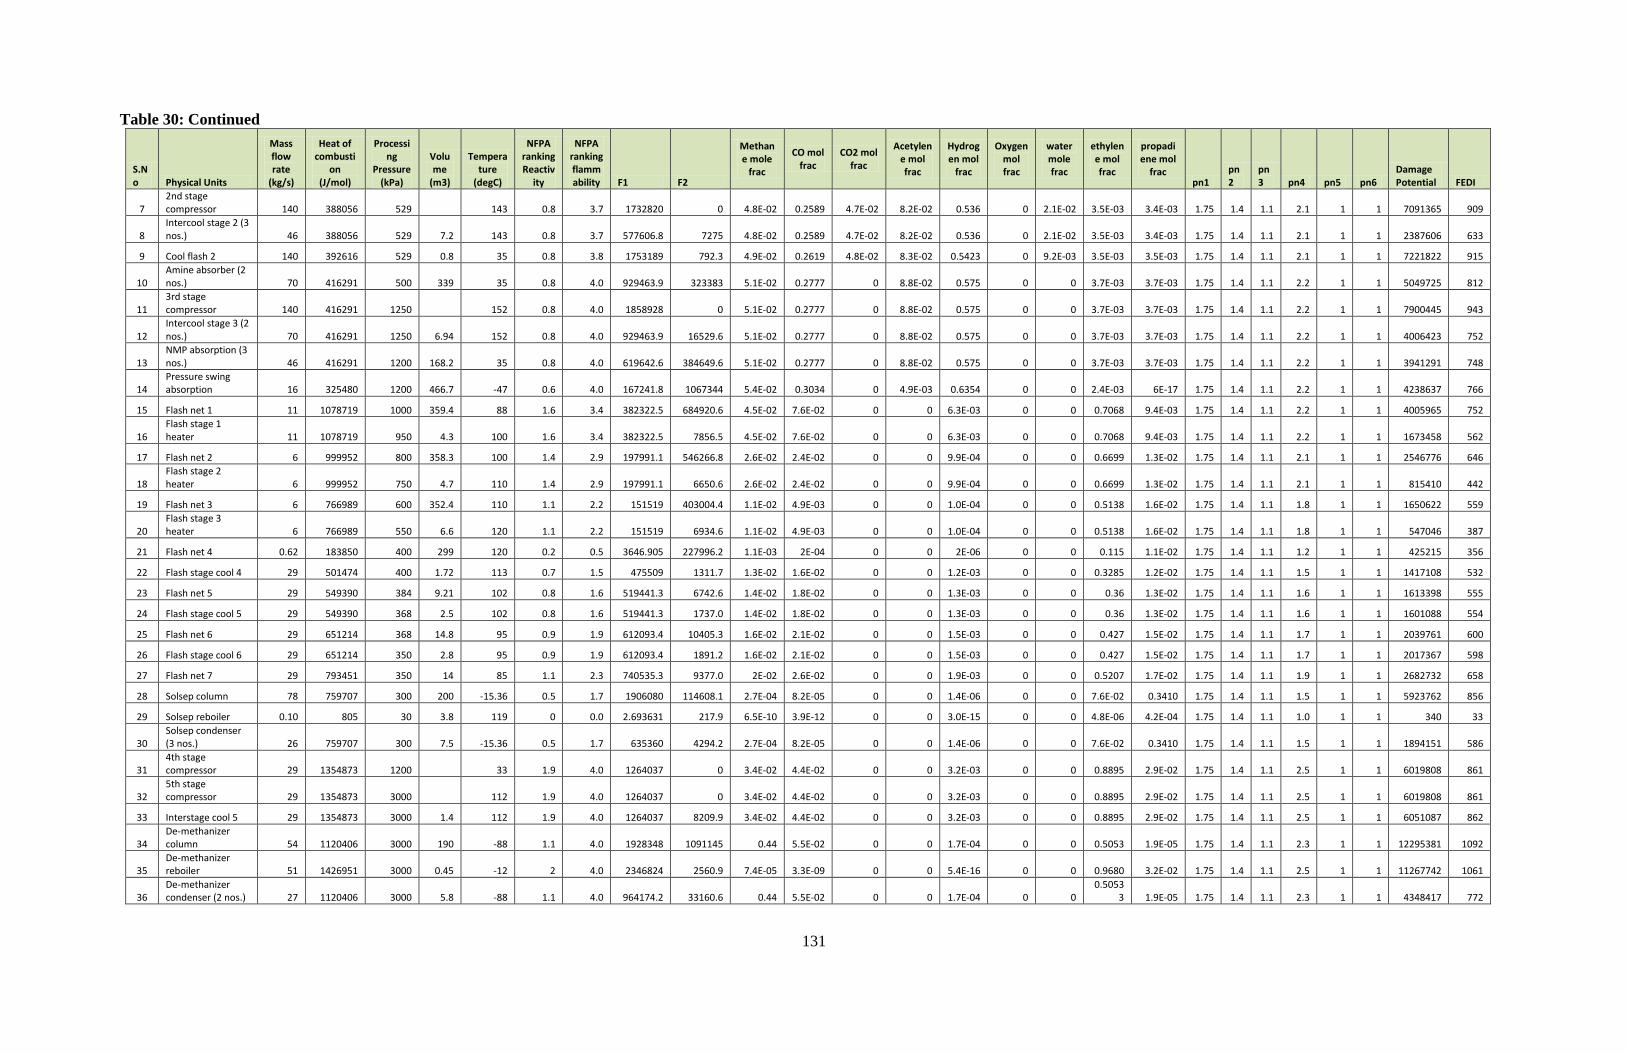
131
Table 30: Continued
S.No Physical Units
Mass flow rate
(kg/s)
Heat of combusti
on (J/mol)
Processing
Pressure (kPa)
Volume
(m3)
Temperature
(degC)
NFPA ranking Reactiv
ity
NFPA ranking flammability F1 F2
Methane mole
frac
CO mol frac
CO2 mol frac
Acetylene mol frac
Hydrogen mol
frac
Oxygen mol frac
water mole frac
ethylene mol frac
propadiene mol
frac pn1
pn2
pn3 pn4 pn5 pn6
Damage Potential FEDI
7 2nd stage compressor 140 388056 529 143 0.8 3.7 1732820 0 4.8E-02 0.2589 4.7E-02 8.2E-02 0.536 0 2.1E-02 3.5E-03 3.4E-03 1.75 1.4 1.1 2.1 1 1 7091365 909
8 Intercool stage 2 (3 nos.) 46 388056 529 7.2 143 0.8 3.7 577606.8 7275 4.8E-02 0.2589 4.7E-02 8.2E-02 0.536 0 2.1E-02 3.5E-03 3.4E-03 1.75 1.4 1.1 2.1 1 1 2387606 633
9 Cool flash 2 140 392616 529 0.8 35 0.8 3.8 1753189 792.3 4.9E-02 0.2619 4.8E-02 8.3E-02 0.5423 0 9.2E-03 3.5E-03 3.5E-03 1.75 1.4 1.1 2.1 1 1 7221822 915
10 Amine absorber (2 nos.) 70 416291 500 339 35 0.8 4.0 929463.9 323383 5.1E-02 0.2777 0 8.8E-02 0.575 0 0 3.7E-03 3.7E-03 1.75 1.4 1.1 2.2 1 1 5049725 812
11 3rd stage compressor 140 416291 1250 152 0.8 4.0 1858928 0 5.1E-02 0.2777 0 8.8E-02 0.575 0 0 3.7E-03 3.7E-03 1.75 1.4 1.1 2.2 1 1 7900445 943
12 Intercool stage 3 (2 nos.) 70 416291 1250 6.94 152 0.8 4.0 929463.9 16529.6 5.1E-02 0.2777 0 8.8E-02 0.575 0 0 3.7E-03 3.7E-03 1.75 1.4 1.1 2.2 1 1 4006423 752
13 NMP absorption (3 nos.) 46 416291 1200 168.2 35 0.8 4.0 619642.6 384649.6 5.1E-02 0.2777 0 8.8E-02 0.575 0 0 3.7E-03 3.7E-03 1.75 1.4 1.1 2.2 1 1 3941291 748
14 Pressure swing absorption 16 325480 1200 466.7 -47 0.6 4.0 167241.8 1067344 5.4E-02 0.3034 0 4.9E-03 0.6354 0 0 2.4E-03 6E-17 1.75 1.4 1.1 2.2 1 1 4238637 766
15 Flash net 1 11 1078719 1000 359.4 88 1.6 3.4 382322.5 684920.6 4.5E-02 7.6E-02 0 0 6.3E-03 0 0 0.7068 9.4E-03 1.75 1.4 1.1 2.2 1 1 4005965 752
16 Flash stage 1 heater 11 1078719 950 4.3 100 1.6 3.4 382322.5 7856.5 4.5E-02 7.6E-02 0 0 6.3E-03 0 0 0.7068 9.4E-03 1.75 1.4 1.1 2.2 1 1 1673458 562
17 Flash net 2 6 999952 800 358.3 100 1.4 2.9 197991.1 546266.8 2.6E-02 2.4E-02 0 0 9.9E-04 0 0 0.6699 1.3E-02 1.75 1.4 1.1 2.1 1 1 2546776 646
18 Flash stage 2 heater 6 999952 750 4.7 110 1.4 2.9 197991.1 6650.6 2.6E-02 2.4E-02 0 0 9.9E-04 0 0 0.6699 1.3E-02 1.75 1.4 1.1 2.1 1 1 815410 442
19 Flash net 3 6 766989 600 352.4 110 1.1 2.2 151519 403004.4 1.1E-02 4.9E-03 0 0 1.0E-04 0 0 0.5138 1.6E-02 1.75 1.4 1.1 1.8 1 1 1650622 559
20 Flash stage 3 heater 6 766989 550 6.6 120 1.1 2.2 151519 6934.6 1.1E-02 4.9E-03 0 0 1.0E-04 0 0 0.5138 1.6E-02 1.75 1.4 1.1 1.8 1 1 547046 387
21 Flash net 4 0.62 183850 400 299 120 0.2 0.5 3646.905 227996.2 1.1E-03 2E-04 0 0 2E-06 0 0 0.115 1.1E-02 1.75 1.4 1.1 1.2 1 1 425215 356
22 Flash stage cool 4 29 501474 400 1.72 113 0.7 1.5 475509 1311.7 1.3E-02 1.6E-02 0 0 1.2E-03 0 0 0.3285 1.2E-02 1.75 1.4 1.1 1.5 1 1 1417108 532
23 Flash net 5 29 549390 384 9.21 102 0.8 1.6 519441.3 6742.6 1.4E-02 1.8E-02 0 0 1.3E-03 0 0 0.36 1.3E-02 1.75 1.4 1.1 1.6 1 1 1613398 555
24 Flash stage cool 5 29 549390 368 2.5 102 0.8 1.6 519441.3 1737.0 1.4E-02 1.8E-02 0 0 1.3E-03 0 0 0.36 1.3E-02 1.75 1.4 1.1 1.6 1 1 1601088 554
25 Flash net 6 29 651214 368 14.8 95 0.9 1.9 612093.4 10405.3 1.6E-02 2.1E-02 0 0 1.5E-03 0 0 0.427 1.5E-02 1.75 1.4 1.1 1.7 1 1 2039761 600
26 Flash stage cool 6 29 651214 350 2.8 95 0.9 1.9 612093.4 1891.2 1.6E-02 2.1E-02 0 0 1.5E-03 0 0 0.427 1.5E-02 1.75 1.4 1.1 1.7 1 1 2017367 598
27 Flash net 7 29 793451 350 14 85 1.1 2.3 740535.3 9377.0 2E-02 2.6E-02 0 0 1.9E-03 0 0 0.5207 1.7E-02 1.75 1.4 1.1 1.9 1 1 2682732 658
28 Solsep column 78 759707 300 200 -15.36 0.5 1.7 1906080 114608.1 2.7E-04 8.2E-05 0 0 1.4E-06 0 0 7.6E-02 0.3410 1.75 1.4 1.1 1.5 1 1 5923762 856
29 Solsep reboiler 0.10 805 30 3.8 119 0 0.0 2.693631 217.9 6.5E-10 3.9E-12 0 0 3.0E-15 0 0 4.8E-06 4.2E-04 1.75 1.4 1.1 1.0 1 1 340 33
30 Solsep condenser (3 nos.) 26 759707 300 7.5 -15.36 0.5 1.7 635360 4294.2 2.7E-04 8.2E-05 0 0 1.4E-06 0 0 7.6E-02 0.3410 1.75 1.4 1.1 1.5 1 1 1894151 586
31 4th stage compressor 29 1354873 1200 33 1.9 4.0 1264037 0 3.4E-02 4.4E-02 0 0 3.2E-03 0 0 0.8895 2.9E-02 1.75 1.4 1.1 2.5 1 1 6019808 861
32 5th stage compressor 29 1354873 3000 112 1.9 4.0 1264037 0 3.4E-02 4.4E-02 0 0 3.2E-03 0 0 0.8895 2.9E-02 1.75 1.4 1.1 2.5 1 1 6019808 861
33 Interstage cool 5 29 1354873 3000 1.4 112 1.9 4.0 1264037 8209.9 3.4E-02 4.4E-02 0 0 3.2E-03 0 0 0.8895 2.9E-02 1.75 1.4 1.1 2.5 1 1 6051087 862
34 De-methanizer column 54 1120406 3000 190 -88 1.1 4.0 1928348 1091145 0.44 5.5E-02 0 0 1.7E-04 0 0 0.5053 1.9E-05 1.75 1.4 1.1 2.3 1 1 12295381 1092
35 De-methanizer reboiler 51 1426951 3000 0.45 -12 2 4.0 2346824 2560.9 7.4E-05 3.3E-09 0 0 5.4E-16 0 0 0.9680 3.2E-02 1.75 1.4 1.1 2.5 1 1 11267742 1061
36 De-methanizer condenser (2 nos.) 27 1120406 3000 5.8 -88 1.1 4.0 964174.2 33160.6 0.44 5.5E-02 0 0 1.7E-04 0 0
0.50533 1.9E-05 1.75 1.4 1.1 2.3 1 1 4348417 772

132
Table 30: Continued
S.No Physical Units
Mass flow rate
(kg/s)
Heat of combusti
on (J/mol)
Processing
Pressure (kPa)
Volume
(m3)
Temperature
(degC)
NFPA ranking Reactiv
ity
NFPA ranking flammability F1 F2
Methane mole
frac
CO mol frac
CO2 mol frac
Acetylene mol frac
Hydrogen mol
frac
Oxygen mol frac
water mole frac
ethylene mol frac
propadiene mol
frac pn1
pn2
pn3 pn4 pn5 pn6
Damage Potential FEDI
37 Ethylene column 49 1410968 2500 105 -20.59 2 4.0 2234360 501533 2.3E-05 4.7E-10 0 0 0 0 0 0.9999 2.6E-05 1.75 1.4 1.1 2.5 1 1 12683657 1104
38 Ethylene reboiler 48 1911795 2500 2 77 1 4.0 2920917 9799.7 1.2E-12 9.3E-21 0 0 0 0 0 3.0E-03 0.9969 1.75 1.4 1.1 2.3 1 1 12689282 1104
39 Ethylene condenser (2 nos.) 24 1410968 2500 7 -20.69 2 4.0 1117180 33319.5 2.3E-05 4.7E-10 0 0 0 0 0 0.9999 2.6E-05 1.75 1.4 1.1 2.5 1 1 5504664 836
Table 31: Safety calculation of reactors- Ethane Cracking
S.No Reactors
Mass flow rate
(kg/s)
Heat of combustion
(J/mol)
Processing
Pressure (kPa)
Volume (m3)
Temperatur
e (degC)
NFPA ranki
ng Reacti
vity
NFPA ranki
ng flam
mability F1 F2 F4
Hx rxn, kj/kg
Hydrogen mol frac
Ethylene mol frac
Methane mol frac
Propane mol frac
Butadiene mol frac
Ethane mol frac
Propylene mol frac pn1 pn2 pn3 pn4 pn5 pn6 pn7 pn8
Damage Potential FEDI
1 Cracker 51 1561000 150 140 775 0 4 2520674 27 43922 2720 0 0 0.0 0.0 0.0 1 0.0 2 1.4 1.1 2 1 1 1.5 1.5 11016939 1053
2
Acetylene hydrogenation 46 1472752 2550 32 75 1.2 4 2170245 106 -1871 -127 4.8E-05 0.5858 4.4E-04 2.8E-08 1.1E-12 0.4137 6.1E-06 1.5 1.4 1.1 2.2 1 1 1.4 1.5 7928100 944
Table 32: Safety calculation of reactors- Methane Pyrolysis
S.No Reactors
Mass flow rate
(kg/s)
Heat of combustion
(J/mol)
Processing Pressure
(kPa) Volume
(m3) Temperature (degC)
NFPA ranking
Reactivity
NFPA ranking
flammability F1 F2 F4
Hxrxn, kj/kg
Methane mole frac
Hydrogen mol frac pn1 pn2 pn3 pn4 pn5 pn6 pn7 pn8
Damage Potential FEDI
1 Cracker 105 891100 100 47 1488 0 4 2972220 6.2 316810 9498 1 0 1.95 1.4 1.1 2 1 1 1.45 1.45 14216252 1146
2 Acetylene hydrogenation 1.9 286000 1150 1057 88 0 4 17196 1585 3648 6067 0 1 1.75 1.4 1.1 2 1 1 1.35 1.45 86802 209