safety and security in the iot - ssse.chem>edit basic page
TRANSCRIPT

© 2016 IBM Corporation
Safety and Security in the IoTA Model-Based Perspective
Bruce Powel Douglass, Ph.D.
Chief Evangelist, Global Technology Ambassador
IBM Internet of Things (IoT)
Twitter: @IronmanBruce
Website: : www-01.ibm.com/software/rational/leadership/thought/brucedouglass.html

© 2016 IBM Corporation1
IoT Enterprise Architecture
AnalyticsWeb Portal & Dashboards
Device Cloud Infrastructure
M2M Gateway & Smart Edge
nodes
Other DevicesSensors & Actuator

© 2016 IBM Corporation2
Dependability
Reliability
service availability Security
resilience to attack
Safety
freedom from harm
Rear view mirror
Connected
automobile
braking
Mechanical braking
system
Mechanical gas
tank cap “On-Star”-
like service
Cruise Control
Key fob
Seat belts
Windshield
GPS
Infotainment
Mechanical trunk
latch
Interior lighting

© 2016 IBM Corporation3
Basic Safety-Related Concepts Safety is ultimately an issue at the real-world device level but other levels in the
architecture may introduce safety-relevant concerns that manifest at the device level
Accident is a loss of some kind, such as injury, death, or equipment damage
AKA mishap or harm
Risk is a combination of the likelihood of an accident and its severity:risk = p(a) * s(a)
A Hazard is a set of conditions and/or events that leads to an accident. That is, hazards result in accidents
Hazards are predictable and therefore controllable
A safety-relevant system contains two kinds of hazards
• Intrinsic hazards
• Hazards due to the inherent job and operational environment of the system
• Technology hazards
• Hazards due to the addition of specific technological solutions
A safety control measure is an action or mechanism to improve the safety of the system by either
Reducing the severity
• For example, an airbag
Reducing the likelihood
• For example, a redundant sensor

© 2016 IBM Corporation4
Some Safety Control Measures
Obviation
Education
Alarming (person-in-the-loop)
Active correction
Redundancy
Homogenous
Heterogeneous
Interlock
Safety equipment (goggles, gloves)
Restrict access
Labeling
Fail-Safe state/mode

© 2016 IBM Corporation5
Fault Tree Analysis Profile in UML
UML is a general modeling language and can be extended to model metadata beyond its
standard usage, for example
UML Profile for Schedulability Performance and Time (SPT)
Model Analysis of Real-Time Systems (MARTE)
Systems Modeling Language (SysML)
UML Profile for DoDAF and
MoDAF (UPDM)
The FTA Profile has the following views
FTA diagram
Safety Analysis Diagram
Hazard table view
FMEA table view
Fault table view
Fault – Requirement Matrix view
Fault – Design Elements Matrix views
© 2016 IBM Corporation6
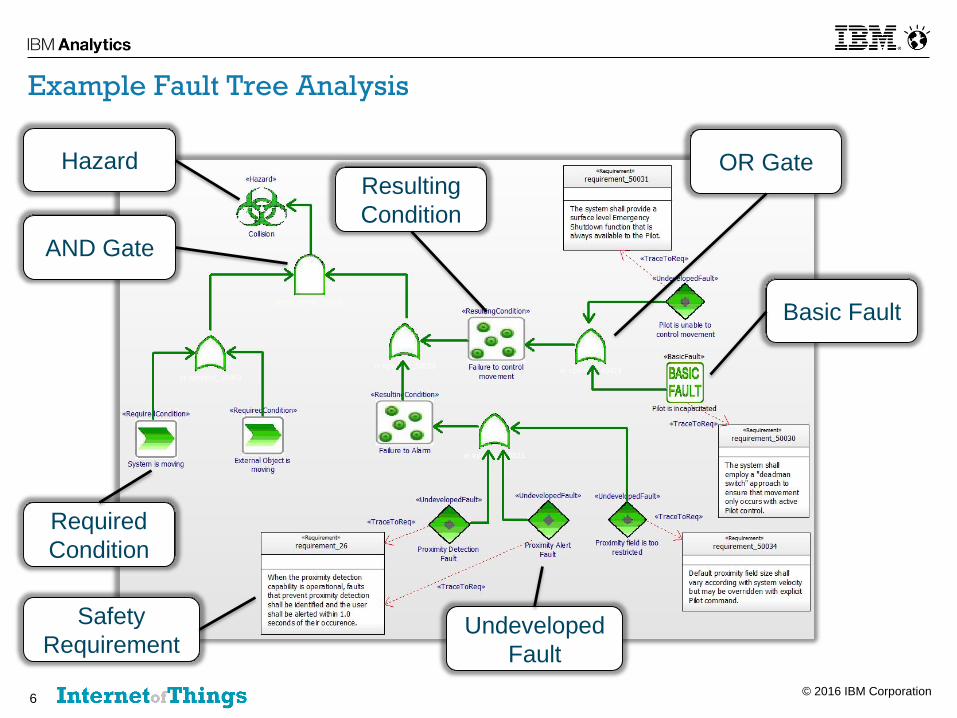
Example Fault Tree Analysis
Hazard
Basic Fault
Required
Condition
Undeveloped
Fault
Resulting
Condition
AND Gate
OR Gate
Safety
Requirement

© 2016 IBM Corporation7
Model-Based Safety Analysis with the FTA UML Profile

© 2016 IBM Corporation8
How to build a Safety Analysis
A hazard is a condition that leads to an accident or loss
A hazard is characterized by
Likelihood (L)
Severity (S)
Risk = L * S
Identify Hazards
Describe Hazards
Identify Related
Conditions
Describe Conditions
Create Causality
Tree
Add Safety
Measures

© 2016 IBM Corporation9
How to build a Safety Analysis
Identify Hazards
Describe Hazards
Identify Related
Conditions
Describe Conditions
Create Causality
Tree
Add Safety
Measures
Define the hazard
metadata to define and
understand the hazard, its
severity, and its likelihood

© 2016 IBM Corporation10
How to build a Safety Analysis
Identify Hazards
Describe Hazards
Identify Related
Conditions
Describe Conditions
Create Causality
Tree
Add Safety
Measures
Hazard
Required Condition
Hazardous Event
Normal Event
Resulting Condition
Fault
A required condition is a preconditional
invariant or assumption
A fault is a system non-
conformance. It may be
systematic (error) or random
(failure)
A normal event is an occurrence
expected by or normal to the
system and its operational context
A hazardous event is an event
that is known to pose a safety
concern
A resulting condition is one
that results from a combination of
more basic events and conditions

© 2016 IBM Corporation11
How to build a Safety Analysis
Identify Hazards
Describe Hazards
Identify Related
Conditions
Describe Conditions
Create Causality
Tree
Add Safety
Measures
Characterize conditions,
especially faults.
This information can be
used to generate a Fault
Means and Effect
Analysis (FMEA)

© 2016 IBM Corporation12
How to build a Safety Analysis
Identify Hazards
Describe Hazards
Identify Related
Conditions
Describe Conditions
Create Causality
Tree
Add Safety
Measures
The FTA shows the relation – using
logical operators such as AND, OR
and NOT – among faults, events,
and conditions.
These result in resulting conditions
that may be further logically
combined to result in manifested
hazards.

© 2016 IBM Corporation13
How to build a Safety Analysis
Identify Hazards
Describe Hazards
Identify Related
Conditions
Describe Conditions
Create Causality
Tree
Add Safety
Measures
Safety measures reduce either
- The likelihood of a fault
- The severity of a fault
The measure works because for the
hazard to manifest the original fault
must occur AND the safety measure
must also fail
These will be represented in
- Safety requirements
- Safety design elements
© 2016 IBM Corporation14
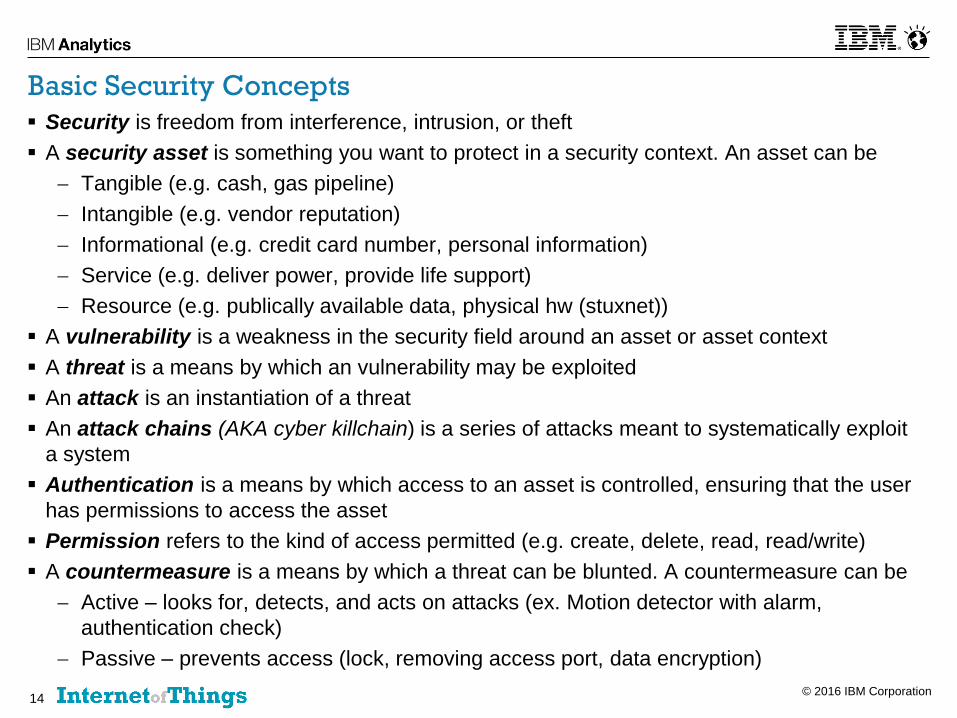
Basic Security Concepts
Security is freedom from interference, intrusion, or theft
A security asset is something you want to protect in a security context. An asset can be
Tangible (e.g. cash, gas pipeline)
Intangible (e.g. vendor reputation)
Informational (e.g. credit card number, personal information)
Service (e.g. deliver power, provide life support)
Resource (e.g. publically available data, physical hw (stuxnet))
A vulnerability is a weakness in the security field around an asset or asset context
A threat is a means by which an vulnerability may be exploited
An attack is an instantiation of a threat
An attack chains (AKA cyber killchain) is a series of attacks meant to systematically exploit
a system
Authentication is a means by which access to an asset is controlled, ensuring that the user
has permissions to access the asset
Permission refers to the kind of access permitted (e.g. create, delete, read, read/write)
A countermeasure is a means by which a threat can be blunted. A countermeasure can be
Active – looks for, detects, and acts on attacks (ex. Motion detector with alarm,
authentication check)
Passive – prevents access (lock, removing access port, data encryption)
© 2016 IBM Corporation15 15
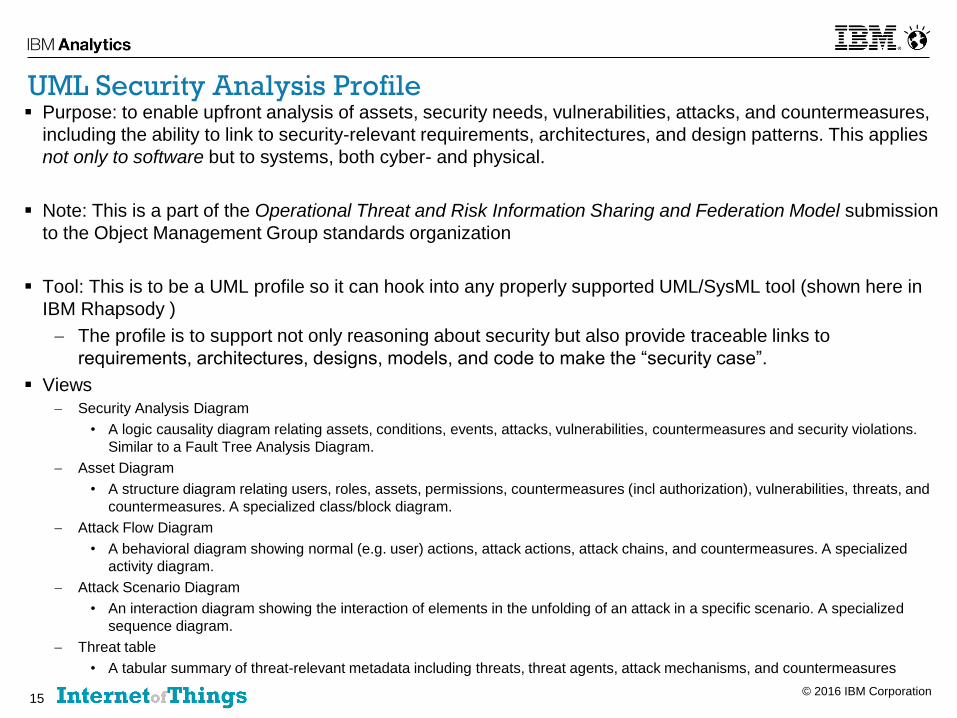
UML Security Analysis Profile Purpose: to enable upfront analysis of assets, security needs, vulnerabilities, attacks, and countermeasures,
including the ability to link to security-relevant requirements, architectures, and design patterns. This applies
not only to software but to systems, both cyber- and physical.
Note: This is a part of the Operational Threat and Risk Information Sharing and Federation Model submission
to the Object Management Group standards organization
Tool: This is to be a UML profile so it can hook into any properly supported UML/SysML tool (shown here in
IBM Rhapsody )
The profile is to support not only reasoning about security but also provide traceable links to
requirements, architectures, designs, models, and code to make the “security case”.
Views
Security Analysis Diagram
• A logic causality diagram relating assets, conditions, events, attacks, vulnerabilities, countermeasures and security violations.
Similar to a Fault Tree Analysis Diagram.
Asset Diagram
• A structure diagram relating users, roles, assets, permissions, countermeasures (incl authorization), vulnerabilities, threats, and
countermeasures. A specialized class/block diagram.
Attack Flow Diagram
• A behavioral diagram showing normal (e.g. user) actions, attack actions, attack chains, and countermeasures. A specialized
activity diagram.
Attack Scenario Diagram
• An interaction diagram showing the interaction of elements in the unfolding of an attack in a specific scenario. A specialized
sequence diagram.
Threat table
• A tabular summary of threat-relevant metadata including threats, threat agents, attack mechanisms, and countermeasures

© 2016 IBM Corporation16
Model-Based Security Threat Analysis
Security Analysis Diagram*
(SAD) is like a Fault Tree
Analysis (FTA) but for security,
rather than safety
It looks for the logical relation
between assets,
vulnerabilities, attacks, and
security violations
Permits reasoning about
security
• What kind?
• How much?
• Risk assessments
* From the Security Analysis Profile for the UML

© 2016 IBM Corporation17
Attack flow diagram Unmarked (e.g. user)
Actions plus
Stereotyped actions
From Attack Chain:
- Reconnaissance
- Delivery
- Exploitation
- Installation
- Command & Control
- Actions On Objective
From Countermeasures
- Countermeasure

© 2016 IBM Corporation18
Summary Tables and Matrices
These summaries are based on data captured across multiple diagrams
Tables list elements and show associated metadata
Asset
Countermeasures
Roles
Matrices show relations between types of security elements
Asset-Authentication
Asset-Vulnerability
Countermeasure-Vulnerability
Requirements – [Security Element] (Role, Asset, Countermeasure, Authentication …)
Role-Asset

© 2016 IBM Corporation19
IoT Enterprise Architecture Security Perspective
AnalyticsWeb Portal & Dashboards
Device Cloud Infrastructure
M2M Gateway & Smart Edge
nodes
Other DevicesSensors & Actuator
Attack Surfaces
Att
ack S
urf
aces
Atta
ck S
urfa
ces

© 2016 IBM Corporation20
From Comprehensive Experimental Analyses of Automotive Attack Surfaces
http://www.autosec.org/pubs/cars-usenixsec2011.pdf
Example Attack Surfaces at the Device Level

© 2016 IBM Corporation21
Some Security Countermeasures
Access Control
Accounting
Scanning
Active Detection
Authentication
Recovery
Boundary Control
Backup
Encryption
Deterrence
Isolation
Nonrepudiation
Policy Action

© 2016 IBM Corporation22
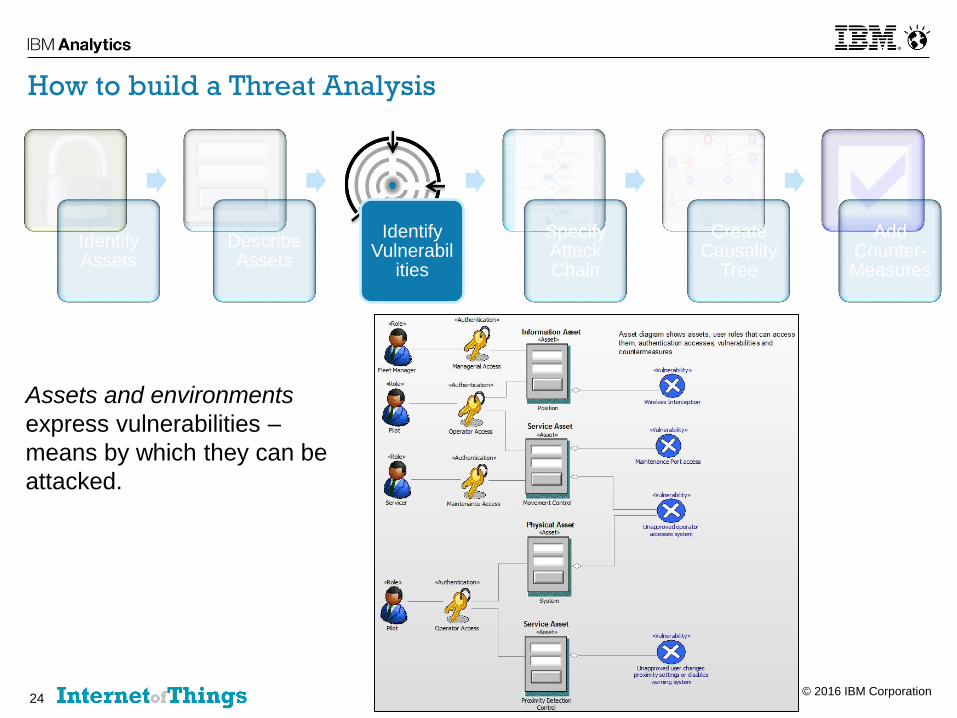
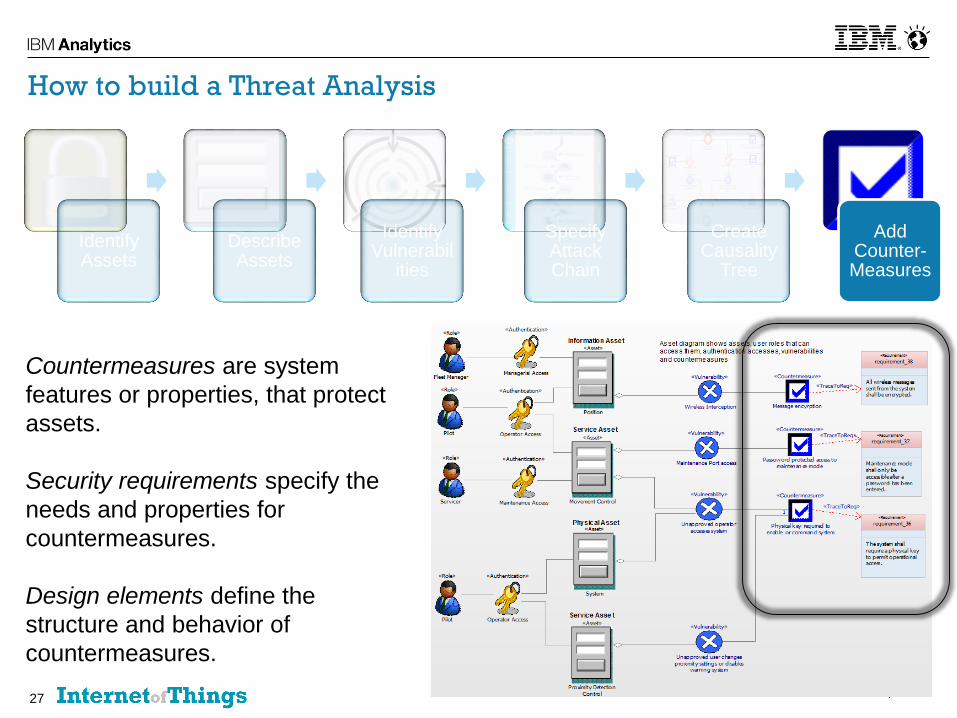
How to build a Threat Analysis
Identify Assets
Describe Assets
Identify Vulnerabil
ities
Specify Attack Chain
Create Causality
Tree
Add Counter-Measures
Assets are system features
or properties, or features of
the system’s operational
context that have value and
the system must protect.

© 2016 IBM Corporation23
How to build a Threat Analysis
Identify Assets
Describe Assets
Identify Vulnerabil
ities
Specify Attack Chain
Create Causality
Tree
Add Counter-Measures
Assets have properties
such as
- ID
- Kind
- Availability
- Value
- Access
restrictions
- Role accessibility
- Integrity
© 2016 IBM Corporation24
How to build a Threat Analysis
Identify Assets
Describe Assets
Identify Vulnerabil
ities
Specify Attack Chain
Create Causality
Tree
Add Counter-Measures
Assets and environments
express vulnerabilities –
means by which they can be
attacked.

© 2016 IBM Corporation25
How to build a Threat Analysis
Identify Assets
Describe Assets
Identify Vulnerabil
ities
Specify Attack Chain
Create Causality
Tree
Add Counter-Measures
The Attack Chain (aka Cyber
Killchain) is the means by
which an attacker identifies
and exploits vulnerabilities.
Countermeasures may
interrupt any step in the
attack chain.

© 2016 IBM Corporation26
How to build a Threat Analysis
Identify Assets
Describe Assets
Identify Vulnerabil
ities
Specify Attack Chain
Create Causality
Tree
Add Counter-Measures
A security analysis diagram
(SAD) specifies the causal
links among assets,
vulnerabilities, attacks, and
countermeasures
© 2016 IBM Corporation27
How to build a Threat Analysis
Identify Assets
Describe Assets
Identify Vulnerabil
ities
Specify Attack Chain
Create Causality
Tree
Add Counter-Measures
Countermeasures are system
features or properties, that protect
assets.
Security requirements specify the
needs and properties for
countermeasures.
Design elements define the
structure and behavior of
countermeasures.

© 2016 IBM Corporation28
Threat Analysis Summary Table
Threat Analysis TableAsset value is the value of the asset to be protected (1=very low, 10=very high)
Likelihood is the probability of the attack (1=very low, 10=certain)
Reproducability refers to how easy it is to reproduce the attack (for example, for it depend on timing or other circumstances?) (1=hard, 10 = very easy)
Exploitabilty refers to how easy it is to launch the attack (1=very easy, 10=very hard)
Breadth is the a measure of the extent of the attack. How widespread is it or how many systems are affected (1=few, 10=very many)
Discoverability is how easy is it for outsiders to find out about and exploit the vulnerability (1=very easy, 10=very hard)
Threat Priority is the product of the above values and is used to prioritize the threats for countermeasures
These are in the range of 1 - 10
Asset Vulnerability Threat Vector
Asset
Value
Likelihood
of attack
Repro duc-
ability Exploit ability Breadth
Discover
ability Threat Priority Counter measure
Patient Demo-
graphic Data
Access via
ethernet
Input
validation
weak 4 7 9 4 1 9 9072
Internal
encryption
Access via USB
Auto
execution of
USB SW 4 7 9 3 1 9 6804 Internal encryption
Access via packet
snooping
Messahes
sent in plain
text 4 7 9 5 1 8 10080
Message
encryption
New 2nd Edition
© 2016 IBM Corporation29
Want to
know more?