safe, but could be safer: why do voucher households live
TRANSCRIPT
Safe, but Could Be Safer: Why Do Voucher Households Live in Higher Crime
Neighborhoods?
Corresponding Author:
Michael C. Lens
Assistant Professor
Department of Urban Planning
UCLA Luskin School of Public Affairs
3250 Public Affairs Building
Box 951656
Los Angeles, CA 90095
310-825-1005

2
Abstract
The radical growth in the Housing Choice Voucher Program over the past 25 years has
had a number of benefits for subsidized households, including access to a greater array of
neighborhoods. However, while voucher households tend to live in safer neighborhoods than
those in supply-side subsidized housing, they still lag behind the general population in terms of
neighborhood safety.
This paper attempts to identify the urban spatial characteristics that lead voucher
households to live in higher crime neighborhoods. Using census tract-level crime and housing
data on 91 U.S. cities in 2000, I estimate a set of regression models that find that three housing
market variables have strong associations with the crime exposure of voucher households – the
percent of renters located in high crime neighborhoods, the differential between average rents in
low and high-crime tracts, and to a lesser extent, the vacancy rate in low-crime tracts.
These findings suggest that the existence of tight rental markets in low-crime
neighborhoods within cities make it harder for voucher households to access those areas. Cities
with such market characteristics can respond by landlord outreach and increasing the supply of
rental housing in lower crime neighborhoods either through reducing building restrictions or
subsidizing supply.
Keywords: Crime, Public housing, Vouchers, Low-income housing

3
Over the past 25 years, the U.S. Department of Housing and Urban Development (HUD)
and local housing authorities have radically changed how they deliver housing subsidies to low-
income households. Much of the justification for these policy changes has to do with locating
subsidized households in better neighborhoods. Although neighborhood quality is often equated
with the area poverty rate, policymakers and researchers are increasingly using additional
metrics to measure the types of neighborhoods where households live.
One of these metrics is neighborhood crime – a very important aspect of neighborhood
quality, particularly for those that live in subsidized housing. Subsidized households have
frequently cited crime as a paramount concern in their neighborhoods and as a motivating force
for wanting to leave them (Goering et al 2002; Hanratty, Pettit, and McLanahan 1998;
Rubinowitz and Rosenbaum 2000). These concerns were often justified, as there have been many
documented cases of public housing projects and other clusters of subsidized housing being
located in particularly dangerous neighborhoods (Kingsley and Pettit 2008; Popkin et al 2002;
Rubinowitz and Rosenbaum 2000). Further highlighting the relevance of crime in this context is
the fact that subsidized housing legislation has often emphasized neighborhood safety. This
includes the landmark 1949 Housing Act requirement to provide a “suitable living environment”
(Newman and Schnare 1997) and measures in The Quality Housing and Work Responsibility
Act of 1998 on safety and crime prevention (Federal Register 1999).
This all suggests that neighborhood crime is an important measure of neighborhood
quality, and that any attempts to encourage subsidized households to better neighborhoods
should be mindful of neighborhood crime. Recent work has examined the efficacy of the voucher
program and other housing subsidies at granting access to lower crime neighborhoods (Buron et
al 2002; Feins and Shroder 2005; Keels et al 2005; Kling, Ludwig, and Katz 2005; Lens, Ellen,

4
and O’Regan 2011). In the most recent of these studies, Lens, Ellen, and O’Regan (2011) found
that voucher households occupy safer neighborhoods than Low-Income Tax Credit (LIHTC) and
public housing households, but still higher crime neighborhoods than the typical non-subsidized
household. And while all of these studies provide important insights into whether voucher
households are accessing lower crime neighborhoods, no existing studies help us to understand
why voucher households may or may not be able to live in safer neighborhoods.
This paper addresses this question by examining the crime exposure of the typical
voucher household in 91 U.S. cities in 2000. Using a large sample of neighborhood crime data I
attempt to identify the city and metropolitan area spatial characteristics that are associated with a
greater concentration of an area’s voucher households in higher crime neighborhoods.
Specifically, I examine the role of economic and racial segregation, in addition to the spatial
characteristics of rental markets as possible drivers of increased exposure to neighborhood crime
for voucher families.
A better understanding these relationships provides policymakers with guidance on how
to improve housing subsidy delivery in a number of ways. First, identifying the cities where
voucher households are concentrated in higher crime neighborhoods can help these cities to
target efforts at mobilizing these households out of such neighborhoods, whenever possible.
Second, by identifying the housing and demographic factors that are associated with exposure to
neighborhood crime for voucher households, we can begin to develop context-based strategies
for housing subsidies. Specifically, if particular market features are associated with higher
concentrations of different types of subsidized households in higher crime neighborhoods, then
policymakers can tailor their housing subsidy mixes to fit the conditions in their area housing
markets. Alternatively, if these housing market features are changeable, then this would provide
5
additional motivation to do so. In this paper, I find that three housing market characteristics are
chiefly responsible for the extent that a city’s voucher population is clustered in higher crime
neighborhoods – the percent of renters located in high-crime neighborhoods, the differential
between average rents in lower and high-crime tracts, and – to a lesser extent – the vacancy rate
in lower crime tracts. In different ways, these three variables suggest that tight rental markets –
particularly in low-crime neighborhoods – make it difficult for voucher households to access
lower crime neighborhoods. In response, cities with tight rental markets should consider building
affordable housing in lower crime areas and/or removing zoning restrictions on housing
construction in those areas.
Given the bulk of the findings stress that tight rental markets are bad for voucher
household neighborhood safety, one solution could be to expand the stock of affordable housing
in such markets. Despite the fact that supply-side efforts to expand the affordable housing stock
– chiefly the LIHTC – have been documented to locate households in even higher crime
neighborhoods, such development could be intentionally located in lower crime neighborhoods.
Furthermore, it is likely that zoning is playing a substantial role here. The fact that the stock of
rental housing is much lower in lower crime neighborhoods is not likely due to chance – higher
income, safer neighborhoods often have a preponderance of single-family housing because that
is all that cities allow. If some of these regulations are removed, this may spur multifamily
development in safer neighborhoods that a wide array of families – with or without vouchers –
can afford.
Background and Literature
Since the inception of the Section 8 voucher program in the 1970s, vouchers have
steadily taken over as the primary vehicle for subsidizing housing in the United States. Figure 1

6
displays counts of vouchers, LIHTCs, and public housing from 1990 to 2007. By 1990, vouchers
had already surpassed the one million mark but by 2007 that number had more than doubled to
2.2 million vouchers. In that year, voucher households accounted for 44 percent of HUD-assisted
households.
There are a number of reasons for the dramatic rise in the voucher program. Most
pertinent for this paper is the increased flexibility that voucher households have in their location
choices compared to other subsidized households. Voucher households should be able to access a
wide array of housing units, within budget constraints, rather than a fixed supply of housing as
constructed with programs such as public housing and the LIHTC. Policymakers therefore hope
that voucher households will be able to use that enhanced flexibility to access higher quality
neighborhoods. Furthermore, there is less stigma attached to voucher households than public
housing, so it is likely that individual households will be more likely to be able to locate in lower
crime neighborhoods than public housing developments, which have tended to locate in
neighborhoods with few amenities and high crime and poverty rates.
However, voucher households choose housing and neighborhoods with a greater set of
constraints than the typical household. First, voucher households have less wealth and lower
incomes than the typical household, potentially limiting neighborhood options. Second, landlords
may stigmatize voucher holders, and resist accepting applicants who list vouchers as a source of
income (Freeman 2012; Turner, Popkin, and Cunningham 1999). Finally, voucher holders may
have limited information about alternative neighborhoods in making their choices.
As noted, there is a growing body of work that examines the extent that the flexible
(within constraints) nature of the voucher program has allowed households to reach higher
opportunity neighborhoods. There is a longstanding focus on poverty, but recent work has also

7
documented the public safety concerns and conditions of subsidized households. Much of this
work comes from studies on three important demonstration programs – Gautreaux, Moving to
Opportunity (MTO), and HOPE VI.
Neighborhood Poverty
Research examining neighborhood poverty outcomes for subsidized households
concludes that public housing tenants live in particularly high poverty neighborhoods, and
voucher households – whether they be participants in demonstration programs or the general
voucher-holding population – live in a wider array of neighborhoods that also have relatively
high poverty rates. Pendall (2000) found that the typical voucher household lives in
neighborhoods with poverty rates that are 33 percent higher than the average household.
Compared to the LIHTC, McClure (2006) found that similar proportions of voucher and LIHTC
households (30 and 26 percent, respectively) live in low-poverty neighborhoods. Importantly,
these proportions are higher than those for all poor households, although lower than for all renter
households. Less promising findings on the voucher program come from a series of papers that
find that voucher households tend to cluster in the same areas in a number of different cities
(Wang and Varady, 2005; Wang, Varady, and Wang, 2008). The general conclusion from all of
this work is that, while voucher households live in lower poverty neighborhoods than we tend to
see for traditional public housing tenants, voucher households are still locating in high-poverty
neighborhoods.
Neighborhood Crime
A smaller body of work exists that has examined the neighborhood crime rates
experienced by voucher households. Although crime is a frequent concern of both subsidized
housing residents and policymakers, data on neighborhood crime is not always accessible. The

8
earliest studies of neighborhood crime exposure for subsidized households come via
examinations of the three major demonstration programs – Gautreaux, MTO, and HOPE VI.
Although these are specialized populations even within the subsidized housing community –
these households were intentionally selected or motivated to participate chiefly because they
were in acutely distressed neighborhoods – their experiences shed light on what neighborhood
crime conditions look like for public housing and voucher residents. Generally, these groups
were located in very high-crime areas when living in their original public housing developments
and chose to move to lower crime (yet still relatively unsafe) areas after receiving their vouchers.
The Gautreaux program was created in Chicago in 1976 as a result of a series of lawsuits
against the Chicago Housing Authority (CHA) and HUD, and offered black families in CHA
housing the opportunity to move to desegregated areas around the Chicago area, including the
suburbs. Rubinowitz and Rosenbaum (2000) reported a number of statistics highlighting just
how dangerous Gautreaux participants’ and other Chicago public housing residents’
neighborhoods were. In 1980, the Robert Taylor Homes – the largest public housing
development in the country at the time – comprised only one percent of Chicago’s population yet
10 percent of the city’s murders, aggravated assaults, and rapes. Also according to Rubinowitz
and Rosenbaum (2000), nearly one-half of Gautreaux participants reported that violent incidents
occurred regularly in their neighborhoods. Criminal victimization rates were twice as high
among Chicago public housing tenants than in the city as a whole.
Unfortunately, those that used vouchers to move (often to the suburbs) continued to face
relatively high crime rates. Gautreaux suburban movers experienced violent crime rates about
five times as high as the crime rate in the Chicago suburbs at that time, and those that moved
within the city faced violent crime rates about 1.5 times as high as the rest of the city. More
9
promisingly, many years after their initial move, the Gautreaux households tracked by Keels et al
(2005) lived in neighborhoods with very comparable violent and property crime rates to the
surrounding county. These findings, paired with positive effects on education and employment
for Gautreaux participants, led housing advocates to seek additional funding for similar mobility
programs and helped usher in the dramatic expansion of the voucher program.
To replicate the Gautreaux study in a larger, experimental setting, HUD created MTO in
1993 as a five-city demonstration to move subsidized households living in high poverty public
housing developments into low-poverty neighborhoods. In contrast to Gautreaux’s focus on
racial segregation, the direct goal of MTO was to alleviate concentrated poverty by moving
public housing residents to low poverty neighborhoods. As with Gautreaux, despite the fact that
crime was not the primary indicator of neighborhood quality that the program was designed to
address, researchers report dramatically unsafe conditions for those participating in the program.
Goering et al (2002) reported that more than one-half of MTO participants identified crime,
gangs, and drugs as the principal motivation for wanting to move out of their neighborhoods.
Hanratty, McLanahan, and Pettit (1998) found that 11 percent of respondents reported that
someone in their household had been shot or stabbed in the past six months, and 46 percent
reported that somebody had tried to break into their home in the past six months. These reports
of victimization were supported by administrative data. Violent crime rates for the baseline MTO
census tracts in Boston, Chicago, and Los Angeles were three times higher than in the
metropolitan areas as a whole (Kingsley and Pettit, 2008).
After MTO households used vouchers to move, their neighborhood crime conditions
typically improved. Kingsley and Pettit (2008) found that violent crime rates in Boston, Chicago,
and Los Angeles were almost twice as high in the origin neighborhoods of the experimental

10
MTO group than in the post-move neighborhoods. Feins and Shroder (2005) reported results of
pre- and post-move surveys for the MTO treatment, comparison, and control groups (the
comparison group includes households who received vouchers but were not restricted to use
them in low-poverty neighborhoods). Survey respondents in the two groups that received
vouchers reported significantly greater improvements in neighborhood safety than the control
group for every question asked.1 Thus, MTO participants were successful in using vouchers to
move to safer neighborhoods.
HOPE VI program participants have also been successful at leaving dangerous public
housing developments for safer environments. Popkin and Cove (2007) summarized three waves
of the HOPE VI Panel Study. Baseline measures from 2001 showed that nearly 80 percent of
households reported “big problems” with people using and selling drugs, two-thirds reported big
problems with shootings, 23 percent with people being attacked, and 16 percent with rapes and
sexual assault. Large declines in all of these measures were reported by relocatees from public
housing by 2003. By 2005, nearly all of these reports were less than half as prevalent – 35
percent of relocatees reported big problems from people using and selling drugs, and shooting,
attacks, and rapes/sexual assault declined to 26, 13, and 9 percent, respectively. The evidence
that HOPE VI revitalization projects are moving households to safer neighborhoods is
preliminary, however, as the revitalization projects and voucher mobility HOPE VI spawned
were still in progress as of the latest follow up surveys in 2005.
The only existing study that looks at the voucher population as a whole – rather than
specialized subsets participating in Gautreaux, MTO, and HOPE VI – was conducted by Lens,
Ellen and O’Regan (2011). Using census tract-level crime and voucher (in addition to LIHTC,
1 Questions address perceived safety during the day, safety during the night, drug activity in view in the
neighborhood, and whether a household member was a crime victim in the past 6 months.

11
public housing, and poor renter) counts from 91 U.S. cities in 2000, they found that voucher
households occupy much safer neighborhoods than LIHTC and public housing residents, face
similar crime rates as the broader population of renters below the poverty line, but live in higher
crime neighborhoods than the population as a whole in those cities. A surprising result from this
paper is the comparison between LIHTC and voucher households in terms of crime. While
numerous studies report that LIHTC and voucher households occupy similar neighborhoods in
terms of poverty, Lens, Ellen, and O’Regan found that voucher households occupy significantly
safer neighborhoods, providing one clear advantage of tenant-based subsidies over supply-side
ones.
An important mechanism to consider in the examination of the neighborhood crime rates
experienced by subsidized households is the potential that these households can affect crime
themselves, something increasingly studied over the years. Although that is not the focus of this
study, the results of these analyses have implications for how we interpret the findings in this
paper. For instance, if voucher households increase neighborhood crime, then they are inherently
more likely to be in higher crime neighborhoods.
There are only a few studies that directly test whether and how voucher households affect
neighborhood crime, although there are a number that estimate the relationship between public
housing and crime. The general consensus is that neighborhoods with traditional public housing
are typically more dangerous, and public housing likely plays a role in that, but whether the
existence of public housing has a dramatic effect on neighborhood crime is unclear. (Farley
1982; McNulty and Holloway 2000; Roncek, Bell, and Francik 1981). Looking at scattered-site
public housing, Goetz, Lam, and Heitlinger (1996) found that such housing was associated with

12
fewer police calls in Minneapolis, MN. Galster et al (2003) found no evidence that the creation
of either dispersed public housing or supportive housing alters crime rates in Denver.
Looking at voucher households, Suresh and Vito (2009) examined the effects of public
housing demolition and the concentration of Housing Choice Voucher holders on patterns of
homicide in Louisville, KY. They found that homicides were initially clustered in and around
public housing developments, and were then located near Section 8 apartments once public
housing was demolished. However this work is purely correlational and relied on several cross-
sections rather than longitudinal analyses. Van Zandt and Mhatre (2009) analyzed crime data
within a quarter mile radius of apartment complexes containing 10 or more voucher households
during any month between October 2003 and July 2006 in Dallas. Unfortunately, the police did
not collect crime data in these areas if the number of voucher households dropped below 10,
leading to gaps in coverage and limiting the number and type of neighborhoods examined. The
authors found that clusters of voucher households are associated with higher rates of crime,
however similar to Suresh and Vito, it is unclear if this relationship was causal.
Popkin et al looked at public housing transformation in Chicago and Atlanta and track the
households that used vouchers to leave housing slated for demolition. They found that an influx
of voucher households into a neighborhood increased crimes in that neighborhood after a
threshold of voucher households entered the neighborhood, providing the most reliable evidence
to date that voucher households increase crime. However, it is unclear whether the high amount
of neighborhood turnover that large influxes of voucher households portend were to blame for
crime in this case.
Ellen, Lens, and O’Regan (2012) used longitudinal data on 10 U.S. cities covering
various years between 1997 and 2008 and estimated whether increased voucher numbers in

13
census tracts lead to elevated crime. The authors found a strong association between vouchers
and crime, however they concluded that the association appears to be largely due to the fact that
voucher households tend to move to neighborhoods that are experiencing increases in crime
and/or have high crime rates to begin with.
In sum, voucher households live in relatively unsafe neighborhoods, but occupy safer
neighborhoods than those of LIHTC and public housing households. It is also possible that
voucher households affect neighborhood crime rates, suggesting some caution when developing
policies to move voucher households to lower crime neighborhoods. But there is no prior work
that identifies the city and metropolitan area housing and demographic characteristics that are
most likely to allow voucher households access to lower crime neighborhoods. Pendall (2000)
addressed a similar question looking at poverty and other measures of neighborhood distress.
Using tract-level data on 443 metropolitan areas in 1998, Pendall identified the proportion of an
area’s voucher population that resides in a distressed neighborhood,2 and estimated a set of
models that identify the area factors most strongly associated with the voucher population’s
presence in distressed neighborhoods. Pendall found that the percentage of renters in distressed
neighborhoods and high rates of black and Hispanic households among the voucher population
are associated with a higher proportion of voucher households in distressed neighborhoods.
Relatively high rents in non-distressed neighborhoods and the poverty rate in the MSA, however,
were negatively associated with voucher concentration in distressed neighborhoods. Pendall
concludes that voucher households actually avoid neighborhoods with very low rents, perhaps
due to the value of their subsidies. In this paper, I estimate the effect of these housing market and
2 Following Kasarda (1993), Pendall defines a distressed neighborhood as one that is one standard deviation or more
above the mean in each of the following: the share receiving public assistance, percent males 16+ who worked fewer
than 27 weeks in previous year, share of female headed households, and share age 16-19 who are not in school and
lack a high school degrees.

14
urban spatial variables – in addition to others – on the ability of voucher households to reach
lower crime neighborhoods.
Data and Methods
Data
The goal of this paper is to identify the city and metropolitan area spatial characteristics
that contribute to the concentration of voucher households in high-crime areas. The empirical
piece begins by providing descriptive statistics estimating neighborhood crime exposure for the
voucher, LIHTC, and public housing populations.3 Then, I estimate a set of models to identify
that factors that explain differentials in crime exposure and location in high-crime neighborhoods
for the voucher population. The analysis relies heavily on the National Neighborhood Crime
Study, a nationally representative sample of crime data for 9,593 census tracts in 91 U.S. cities,
collected by Ruth Peterson and Lauren Krivo of Ohio State University. Peterson and Krivo
collected Part I (major) crime counts4 from city police departments in 1999, 2000, and 2001. The
public -use data consists of Part I crimes summed over the entire three years, making the 2000
crime counts equivalent to three-year averages. Collecting data in three-year averages allows for
abnormal spikes to be smoothed out over the sample period, and is frequently used in crime
research when possible (Sampson, Raudenbush, and Earls 1997). The sample of cities is a
stratified (by region of the country) random sample from all cities with at least 100,000 persons
as of the 2000 census (Peterson and Krivo, 2010). Appendix I provides a list of the 91 cities, in
addition to basic descriptive statistics on crimes and subsidized housing units for each city.
3 Some of these descriptive statistics are reprinted from Lens, Ellen, and O’Regan, (2011).
4 Part I Crimes are collected as part of the FBI’s Uniform Crime Report (UCR) system. These crimes are comprised
of the violent crimes assault, sexual assault, homicide, and robbery; and property crimes larceny, burglary, motor
vehicle theft, and arson.
15
Census tract-level counts for four types of households were merged to the crime data –
voucher households, renter households below the poverty line, and public housing and LIHTC
households – all measured in 2000. I also merge these data to 2000 Census counts of total
housing units and tract-level demographic statistics. I also provide descriptive statistics for all
tracts in U.S. cities with population greater than 100,000 as a comparison point.
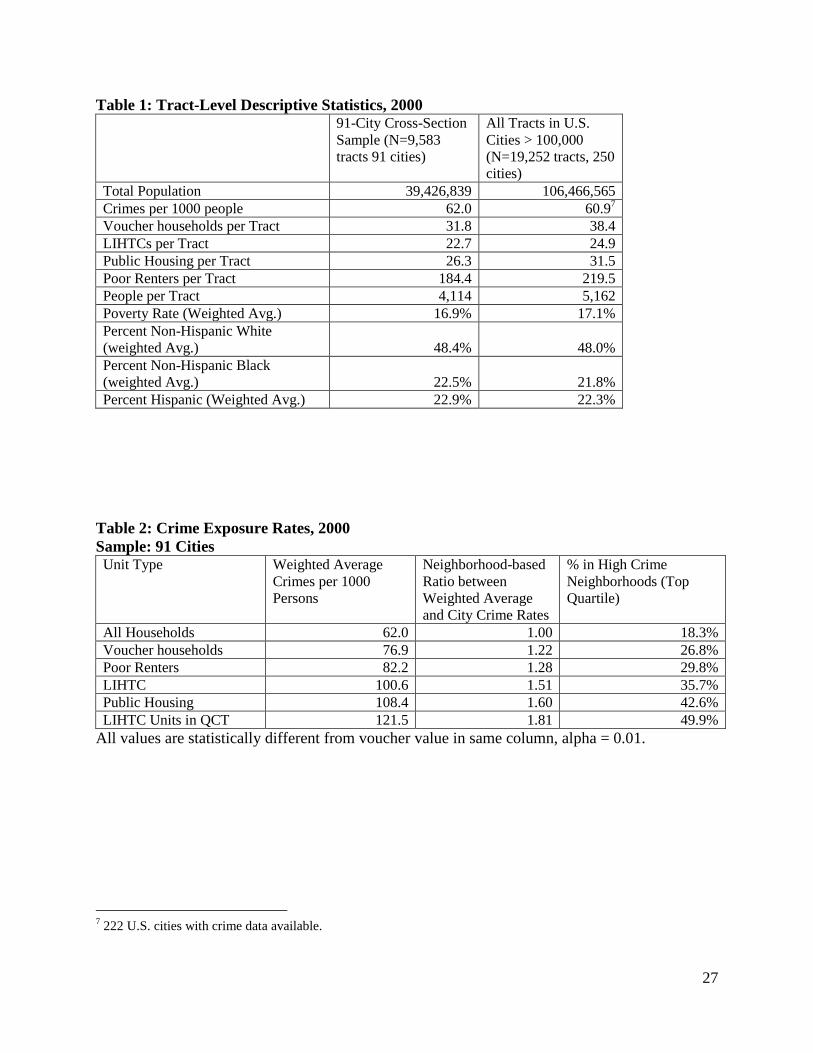
Comparing the two samples in Table 1, it is clear that the 91-city sample is indeed quite
similar to all U.S. cities. This sample represents over one-third of all U.S. cities with population
greater than 100,000, and has similar prevalence of whites, blacks, and Hispanics, people in
poverty, and public housing, voucher, and LIHTC households. In each sample, voucher
households represent approximately two percent of all housing units. Crime rates are also very
similar (62.0 and 60.9 crimes per 1000 residents) in each sample.
Estimating Crime Exposure
I construct three measures to estimate the exposure to crime for subsidized households.
The first two are continuous measures that function as weighted averages. One is an absolute
measure of crime exposure, and the other is relative to the city’s crime rate. The first weighs a
neighborhood’s crime rate by the proportion of the sample’s relevant household type (voucher,
LIHTC, etc.) within that neighborhood. This calculates the neighborhood crime rate experienced
by the average member of the given group. This absolute crime measure uses the number of
people in the tract as the denominator, expressed as crimes per 1,000 persons. For voucher
households, the crime exposure rate can be expressed as:
( ) ∑
(
)
where Crimei is the crime rate in census tract i, vi is the number of voucher households (or public
housing, LIHTC, or poor renter households) in census tract i, and V is the number of voucher
16
households (or public housing or LIHTC units, or poor renter households) in the city. The
resulting value is the weighted average crime rate.
To construct the second measure, where neighborhood crime exposure is relative to the
overall city crime rate, I take the ratio between each tract’s crime rate and that of the surrounding
city. That ratio replaces the crime rate in census tract i (Crimei), and the resulting value for each
subgroup (i.e. voucher or LIHTC households) is the weighted average of the ratio between tract
and city crime rates. Looking at both relative and absolute measures of crime exposure is
important. For the absolute measure, although voucher crime exposure is largely driven by city
crime rates, families in higher-crime neighborhoods are affected just the same. Further, the
portability of vouchers across city boundaries should allow voucher households to leave high-
crime cities for lower crime neighboring jurisdictions. The relative measure, on the other hand,
captures the isolation of voucher households in the higher-crime neighborhoods within cities,
regardless of the crime levels in a city.
The third measure captures the percent of each city’s (and the entire sample’s) housing
subgroup population that resides in a high-crime neighborhood. A high-crime neighborhood is
one with a crime rate in the top quartile of all tracts in the sample. The top quartile threshold for
the entire sample is 88 crimes per 1000.
Table 2 provides the crime exposure rates for the total population and voucher, poor
renter, LIHTC, and public housing households, and LIHTC households in Qualified Census
Tracts (QCTs)5 using the two weighted average measures and the highest quartile measure. The
three measures perform similarly across the five groups – voucher households are in higher
crime areas than the total population, but poor renters, LIHTCs, public housing households, and
5 Developers utilizing the LIHTC receive a 30 percent bonus on their tax credit for building in QCTs, which are
tracts where at least half of the residents earn less than 60 percent of the area gross median income.

17
LIHTCs in QCTs are all in higher crime areas than voucher households. In all columns, each of
the values are statistically significantly different from one another at the 1 percent level. In terms
of magnitude, the simplest comparison is in the second column of data – voucher households live
in tracts 22 percent higher than those in the surrounding city, 28 percent for poor renters, 51
percent for LIHTC households, 60 percent for public housing households, and 81 percent for
LIHTC households in QCTs. The finding that voucher households experience substantially lower
neighborhood crime rates than LIHTC households differs sharply from findings in the literature
regarding poverty exposure – LIHTC and voucher households tend to be located in similarly
situated neighborhoods in terms of poverty. What remains to be seen is which cities provide
greater opportunities for these voucher households to avoid living in high-crime neighborhoods,
and what spatial characteristics of these cities are most associated with such opportunities.
Modeling City-Level Voucher Crime Exposure
Given the large number of cities included in the cross-section, I am able to estimate
regression models that shed light on the spatial characteristics of cities associated with different
levels of voucher crime exposure. It is important to examine this at the city level, because that is
the level at which voucher programs are often administered. Although there are often several
housing submarkets within a city or metropolitan area, public housing authorities operating at the
city, county, or MSA level often have a lot of influence on the location of subsidized households.
Simply put, very few housing policies are determined at the neighborhood level. A city’s overall
crime rate likely has much to do with voucher crime exposure, but it is important to identify
whether, controlling for city crime rates, conditions in some cities are more conducive to
allowing voucher households to access safer neighborhoods than in others.

18
A city’s voucher population is more likely to be highly exposed to crime when the total
crime rate is high, and when crime and voucher households are highly concentrated –
particularly if they are concentrated in the same neighborhoods within the city. Thus, the total
crime rate, the concentration of voucher households, the concentration of crime, and the
interaction between voucher concentration and crime concentration are all likely to be highly
correlated with voucher crime exposure. But there are additional factors that are likely to affect
the concentration of voucher households in less-desirable neighborhoods. In work on identifying
the factors that lead voucher households to live in distressed neighborhoods (high levels of male
unemployment, high school dropouts, public assistance receipt, and female-headed households),
Pendall (2000) hypothesized that you will observe a higher proportion of the voucher population
in distressed tracts when it is more difficult or costly for voucher households to locate in non-
distressed areas. The same is likely for crime. Building on Pendall’s model, I include the
following variables: the proportion of rental housing in high (or very high) crime tracts, rent
differential between lower and high-crime tracts as a percentage of rent in low-crime tracts, rent
in lower crime tracts as a percentage of HUD Fair Market Rent in 2000, differential between the
voucher minority population and city minority population, the vacancy rate in lower crime
neighborhoods, and the city poverty rate.
Following this, a model that identifies the relative importance of these effects is
expressed as:
( )
Here, a city’s voucher crime exposure rate is regressed on the city’s total crime rate, the
concentration of voucher households (measured by the voucher/non-voucher dissimilarity
19
index6), and the concentration of crime in a city (the neighborhood standard deviation divided by
the neighborhood mean). I run two sets of models, one with the absolute measure of crime
exposure as the dependent variable, and the other using the relative (ratio between tract and city
crime rates) measure. In models with the relative measure as the dependent variable, I do not
include ths city crime rate on the right-hand side of the equation. δi signifies the vector of
housing market variables following Pendall (2000) listed above. I also include a vector of
demographic and segregation variables (γi) that are also likely to affect the ability of voucher
households to reach lower crime neighborhoods and a dummy variable to denote whether the city
is the core city of a MSA, to differentiate from central cities and more suburban areas.
Additionally, I include a dummy variable that signifies whether the city’s landlords were subject
to source of income (SOI) laws that prohibit them from discriminating against voucher
households. These laws should increase the number of voucher households in a city by
increasing the voucher utilization rate (the proportion of households with vouchers that are
actively using the voucher to rent a home). Freeman (2012) has found that SOI laws do in fact
raise utilization rates after jurisdictions pass such laws. Voucher households in jurisdictions with
SOI laws should also be less clustered in distressed neighborhoods, since landlords in high
demand areas are less likely to discriminate against them. In fact, Freeman (2012) also found that
voucher household locational outcomes were affected by SOI laws.
Descriptive statistics for these variables are presented in Tables 3 and 4. Table 3 contains
city-level variables while Table 4 displays characteristics of high and low-crime census tracts.
Looking at the city-level variables, we see that the average voucher crime exposure rate across
6 ( ) ∑
In this version of a standard dissimilarity index, vi is the number of vouchers in a tract, V is the number of vouchers
in the city, nvi is the number of non-voucher households in tract i, and NV is the number of non-voucher households
in the city. I calculate this index separately for each city.
20
cities is higher than the average total crime rate. The voucher/non-voucher dissimilarity index is
comparable to the white/nonwhite dissimilarity index, and higher than the poor/non-poor
dissimilarity index. On average, about 46 percent of voucher households would have to change
census tracts in order for their spatial distribution to be equivalent to non-voucher households.
The coefficient of variation is about 0.74, meaning that average neighborhood crime rates are
only about 25 percent higher than the standard deviation.
In Table 4, we observe that high and low-crime tracts are quite different across a number
of indicators. Low-crime tracts are more populous and have dramatically lower crime rates (by
definition). Voucher households are slightly more likely to live in high-crime neighborhoods
than low-crime neighborhoods, but LIHTC and public housing households are much more likely
to live in high-crime tracts than all other tracts. Average rents are clearly lower in high-crime
neighborhoods, and vacancy, poverty, and minority rates are higher.
Results
Results from a set of models identifying the city characteristics associated with higher
levels of voucher crime exposure are presented in Tables 5, 6, and 7. In Table 5, the dependent
variable is the crime rate weighted by the prevalence of voucher households in the tract, in Table
6, I use the relative measure that captures the ratio between tract and city crime. Table 7 provides
results from the models with the percent of voucher households in the highest crime quartile as
the dependent variable. In each table, the independent variables are the same with the exception
of city crime rate being dropped from Table 6, as the city crime rate is already controlled for in
the construction of the crime exposure measure on the right-hand side of the equation. In model
1, I include only housing market variables – the rent differential between high and low crime
tracts, average rent in lower crime tracts as a percent of HUD FMR, percent of renters in high-
21
crime tracts, and the vacancy rate. Model 2 adds the poverty rate, the poor/non-poor dissimilarity
index, and the white/non-white dissimilarity index. In the third model, I drop the dissimilarity
indices in favor of racial differentials between the city and voucher population (for blacks and
Hispanics separately) and add dummy variables signifying whether the city’s landlords are
subjected to source of income laws and whether the city is a central city in a metropolitan area.
In the fourth and final model, I include all previously mentioned variables and all models control
for the region of the country. Note that in both tables, the number of observations is either 89 or
87, as I drop two cities (Livonia and Pembroke Pines) with less than 100 vouchers, and two
cities, Hialeah and Miami, do not have data on the race of voucher householders, meaning they
are dropped from models with the black and Hispanic voucher/general population variables.
Some clear patterns emerge across the two tables. The rent differential between high and
low crime tracts is a fairly consistent correlate of voucher crime exposure – in cities where lower
crime tract rents are relatively higher than higher crime tract rents, we see that voucher
households are more exposed to neighborhood crime. Interestingly, these findings contrast
sharply with Pendall’s (2000) findings looking at distressed tracts. His analyses concluded that
voucher households are more likely to live in non-distressed neighborhoods when rents in
distressed neighborhoods are relatively lower, suggesting that they avoid distressed tracts when
rents there are very low – not the case for higher crime tracts.
The percent of renters in high-crime tracts is strongly related to the relative measure of
voucher crime exposure. This makes sense, as voucher households are locating where the rental
opportunities are. This finding is similar to Pendall (2000) and suggest that broader efforts to
increase multifamily development and density in safer neighborhoods (reducing costs by driving

22
up supply) could work to reduce the clustering of voucher households in high-crime
neighborhoods.
The vacancy rate in low crime areas is weakly related to each of the continuous measures
of crime exposure, as is the average rent in lower crime tracts as a percent of the fair market rent.
However, in Table 7, where the dependent variable is the percent of voucher households in high-
crime tracts (the top quartile), the vacancy rate in low-crime tracts is very strongly associated
with such voucher concentrations in high-crime tracts. Further, these results are consistent with
the rent differential between low and high-crime tracts and the percent of renters in high-crime
tracts. The findings for these housing market variables provide support for what many have
suggested about the limits of the voucher program – in very tight rental markets, landlords often
discriminate against voucher households (Cunningham and Sawyer 2005; Freeman 2012;
Fosburg, Popkin, and Locke 1996). In these markets, supply-side efforts – or increases in the
value of the voucher subsidy – may be more effective. However, public housing and LIHTC
households are even more clustered in higher crime neighborhoods, suggesting we have yet to
find ways of building subsidized housing in low-crime areas.
The most counterintuitive finding is with regards to the poverty rate. The poverty rate has
a strong, negative relationship with the crime exposure measures in Tables 5 and 6 (and a weak
relationship with the top quartile measures). The negative relationship suggests that the higher
the poverty rate, the lower the voucher clustering in high crime tracts. Thus, in cities with higher
poverty rates, voucher households are relatively less exposed to high crime. This could be due to
the fact that in high poverty cities, there are more areas for voucher households to locate because
rents are generally lower. It is notable that these correlations are quite strong – scatterplots of
23
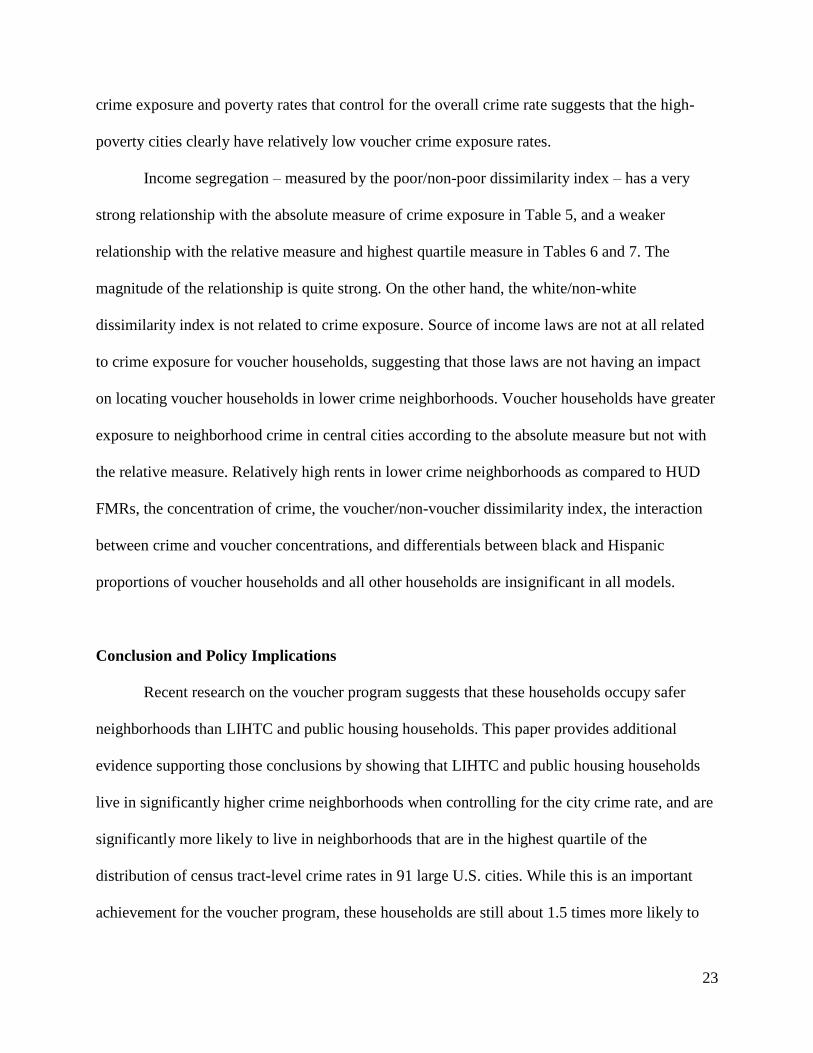
crime exposure and poverty rates that control for the overall crime rate suggests that the high-
poverty cities clearly have relatively low voucher crime exposure rates.
Income segregation – measured by the poor/non-poor dissimilarity index – has a very
strong relationship with the absolute measure of crime exposure in Table 5, and a weaker
relationship with the relative measure and highest quartile measure in Tables 6 and 7. The
magnitude of the relationship is quite strong. On the other hand, the white/non-white
dissimilarity index is not related to crime exposure. Source of income laws are not at all related
to crime exposure for voucher households, suggesting that those laws are not having an impact
on locating voucher households in lower crime neighborhoods. Voucher households have greater
exposure to neighborhood crime in central cities according to the absolute measure but not with
the relative measure. Relatively high rents in lower crime neighborhoods as compared to HUD
FMRs, the concentration of crime, the voucher/non-voucher dissimilarity index, the interaction
between crime and voucher concentrations, and differentials between black and Hispanic
proportions of voucher households and all other households are insignificant in all models.
Conclusion and Policy Implications
Recent research on the voucher program suggests that these households occupy safer
neighborhoods than LIHTC and public housing households. This paper provides additional
evidence supporting those conclusions by showing that LIHTC and public housing households
live in significantly higher crime neighborhoods when controlling for the city crime rate, and are
significantly more likely to live in neighborhoods that are in the highest quartile of the
distribution of census tract-level crime rates in 91 large U.S. cities. While this is an important
achievement for the voucher program, these households are still about 1.5 times more likely to

24
live in higher crime neighborhoods than the general population, and on average, live in
neighborhoods that with crime rates that are over 20 percent higher. In response to this
differential, this paper attempts to identify why voucher households are clustered in higher crime
neighborhoods.
Two housing market characteristics explain much of the variation in the extent to which
voucher households cluster in high crime neighborhoods – the percent of renters located in high
crime neighborhoods and the differential between average rents in lower and high crime tracts.
For the proportion of voucher households living in high-crime neighborhoods, the vacancy rate
in lower crime tracts is also an important correlate. These results suggest that tight rental markets
make it difficult for voucher households to access lower crime neighborhoods: when low-crime
neighborhoods in a city have high rents and low vacancy rates, voucher households are exposed
to more crime.
In most models, the higher the city’s poverty rate, the lower the crime exposure of
voucher households. This suggests that perhaps those cities have lower rents, and voucher
subsidies provide those households additional purchasing power. With the exception of the
poor/non-poor dissimilarity index, which was strongly related to higher crime exposure for
voucher households, a number of segregation and demographic characteristics were weak
predictors of voucher crime exposure.
Given the bulk of the findings stress that tight rental markets are bad for voucher
neighborhood safety, a sensible solution is to expand the stock of affordable housing in such
markets. Despite the fact that supply-side efforts to expand the affordable housing stock – chiefly
the LIHTC – have been documented to locate households in even higher crime neighborhoods,
such development could be intentionally located in lower crime neighborhoods. Furthermore, it

25
is likely that zoning plays a substantial role here. The fact that the stock of rental housing is
much lower in lower crime neighborhoods is not likely due to chance – higher income, safer
neighborhoods often have a preponderance of single-family housing because that is all that cities
allow. If some of these regulations are removed, this may spur multifamily development in safer
neighborhoods that a wide array of families – with or without vouchers – can afford.
These findings also suggest possible alterations to the voucher program. First, an increase
in the value of the voucher subsidy should reduce the likelihood that voucher households will
locate in higher-crime neighborhoods. Of the housing variables, the strongest correlate with
voucher crime exposure is the rent differential between high and low crime neighborhoods. High
and low-crime neighborhoods are always going to have disparate average rents, meaning
voucher households require generous subsidies to allow them to reach lower crime
neighborhoods.
Mobility counseling is another underfunded and under-utilized potential way to reduce
the exposure of voucher households to neighborhood crime. There are many reasons why
voucher and other low-income households tend to congregate in higher-crime neighborhoods,
but one is likely a lack of information about housing opportunities in other locations.
Cunningham and Sawyer (2005) document the efforts of the Housing Opportunity Program
(HOP) in Chicago. Voucher households that received mobility counseling were twice as likely to
locate in low-poverty neighborhoods as those that did not receive such counseling. Housing
authorities should be provided with funding to replicate these efforts with the goal of helping
households avoid higher crime neighborhoods.

26
Figure 1: Voucher, LIHTC, and Public Housing Units by Year, 1990-2007
Source: Author’s calculations of HUD data; Schwartz 2006
0
500,000
1,000,000
1,500,000
2,000,000
2,500,000
19
90
19
91
19
92
19
93
19
94
19
95
19
96
19
97
19
98
19
99
20
00
20
01
20
02
20
03
20
04
20
05
20
06
20
07
Voucher Units
LIHTC
Public Housing Units
27
Table 1: Tract-Level Descriptive Statistics, 2000 91-City Cross-Section
Sample (N=9,583
tracts 91 cities)
All Tracts in U.S.
Cities > 100,000
(N=19,252 tracts, 250
cities)
Total Population 39,426,839 106,466,565
Crimes per 1000 people 62.0 60.97
Voucher households per Tract 31.8 38.4
LIHTCs per Tract 22.7 24.9
Public Housing per Tract 26.3 31.5
Poor Renters per Tract 184.4 219.5
People per Tract 4,114 5,162
Poverty Rate (Weighted Avg.) 16.9% 17.1%
Percent Non-Hispanic White
(weighted Avg.) 48.4% 48.0%
Percent Non-Hispanic Black
(weighted Avg.) 22.5% 21.8%
Percent Hispanic (Weighted Avg.) 22.9% 22.3%
Table 2: Crime Exposure Rates, 2000
Sample: 91 Cities Unit Type Weighted Average
Crimes per 1000
Persons
Neighborhood-based
Ratio between
Weighted Average
and City Crime Rates
% in High Crime
Neighborhoods (Top
Quartile)
All Households 62.0 1.00 18.3%
Voucher households 76.9 1.22 26.8%
Poor Renters 82.2 1.28 29.8%
LIHTC 100.6 1.51 35.7%
Public Housing 108.4 1.60 42.6%
LIHTC Units in QCT 121.5 1.81 49.9%
All values are statistically different from voucher value in same column, alpha = 0.01.
7 222 U.S. cities with crime data available.

28
Table 3: Descriptive Statistics for City-Level Regression Variables, 2000 Variable Mean Standard Deviation
Voucher Crime Exp per 1000 72.1 27.9
Total Crime Rate per 1000 64.6 23.9
Voucher/Non Voucher Dissimilarity 0.455 0.100
Neighborhood Crime Concentration 0.739 0.149
Poor/Nonpoor Dissimilarity 0.320 0.059
White-Nonwhite Dissimilarity 0.389 0.158
Population 432,278 556,237
Poverty Rate 0.156 0.063
Pct Black 0.189 0.167
Median Income, $1000s 40.8 11.9
Vacancy Rate 0.068 0.030
Voucher households per Capita 0.008 0.005
Table 4: Characteristics of High and Low Crime Tracts Top Quartile (N=2,396) Bottom 75% (N=7,187)
Total Population 7,215,897 32,210,942
People per Tract 3,011.6 4,481.8
Crimes per 1000 people* 142.8 43.9
Voucher households per Tract* 44.1 36.2
LIHTCs per Tract* 37.4 23.0
Public Housing per Tract* 39.6 19.3
Poor Renters per Tract* 274.9 201.0
Renters per tract* 1003.7 906.0
Average rent $561.35 $716.0
Vacancy Rate 11.7% 6.1%
Poverty Rate 26.8% 15.7%
Percent Non-Hispanic White 36.2% 51.2%
Percent Non-Hispanic Black 43.3% 20.9%
Percent Hispanic 16.3% 21.8%
*Weighted by tract population

29
Table 5: Modeling City Voucher Crime Exposure, 2000
DV: Voucher Crime Exposure (Crime Rate Weighted Average)
Model 1 Model 2 Model 3 Model 4
High-low crime rent differential 21.88*** 14.70*** 17.27*** 13.72**
(6.089) (5.005) (5.872) (5.908)
Avg rent in lower crime as % of FMR 16.30** -4.532 -8.784 -4.013
(7.811) (8.044) (8.689) (8.889)
% Renters in high crime 56.06 27.86 19.60 24.81
(41.54) (35.12) (33.85) (31.19)
Vacancy rate, low crime -80.17* -49.63 -30.49 -18.76
(42.96) (38.04) (48.17) (46.27)
Crime concentration
5.429 3.213
(15.16) (14.29)
Voucher dissimilarity index
27.06 8.726
(36.75) (36.96)
Voucher and crime interaction term
-18.97 -15.47
(33.65) (32.48)
Poverty rate
-104.4*** -118.7*** -148.4***
(25.98) (35.69) (35.54)
%Black vouchers minus %Black city
4.484 -6.546
(10.85) (9.978)
%Hisp vouchers minus %Hisp city
-5.878 -24.21*
(15.03) (13.89)
Poor dissimilarity index
53.69***
67.16***
(16.11)
(21.38)
White/non-white dissimilarity index
6.102
6.220
(8.550)
(12.14)
Source of income law dummy
1.434 0.127
(2.687) (3.011)
Central city dummy
7.237*** 6.022***
(2.457) (2.264)
Total crime rate per 1000 1.142*** 1.244*** 1.209*** 1.234***
(0.0762) (0.0844) (0.0805) (0.0793)
Constant -9.659 3.526 15.93 5.619
(8.403) (11.82) (21.11) (20.66)
Region Controls Yes Yes Yes Yes
Observations 89 89 87 87
Adjusted R-squared 0.870 0.904 0.894 0.905
Robust standard errors in parentheses
*** p<0.01, ** p<0.05, * p<0.1

30
Table 6: Modeling City Voucher Crime Exposure, 2000
DV: City-Relative Voucher Crime Exposure (Weighted Average)
Model 1 Model 2 Model 3 Model 4
High-low crime rent differential 0.435*** 0.311** 0.403*** 0.312**
(0.158) (0.130) (0.148) (0.142)
Avg rent in lower crime as % of FMR 0.305** -0.0553 -0.121 -0.00324
(0.124) (0.142) (0.142) (0.150)
% Renters in high crime 0.560 0.536 0.799** 0.924**
(0.390) (0.432) (0.373) (0.398)
Vacancy rate, low crime -1.140 -0.406 -0.185 0.224
(0.694) (0.609) (0.732) (0.742)
Crime concentration
0.542* 0.527*
(0.288) (0.293)
Voucher dissimilarity index
0.947 0.525
(0.705) (0.753)
Voucher and crime interaction term
-0.928 -0.891
(0.668) (0.666)
Poverty rate
-1.782*** -1.986*** -2.832***
(0.517) (0.709) (0.880)
%Black vouchers minus %Black city
-0.0722 -0.290
(0.205) (0.192)
%Hisp vouchers minus %Hisp city
-0.223 -0.478*
(0.224) (0.254)
Poor dissimilarity index
0.603*
0.876*
(0.357)
(0.515)
White/non-white dissimilarity index
0.191
0.414
(0.166)
(0.266)
Source of income law dummy
-0.0106 -0.0109
(0.0477) (0.0507)
Central city dummy
0.0753 0.0481
(0.0512) (0.0492)
Constant 0.961*** 1.315*** 1.099** 0.902**
(0.112) (0.254) (0.456) (0.448)
Region Controls Yes Yes Yes Yes
Observations 89 89 87 87
Adjusted R-squared 0.195 0.338 0.289 0.340
Robust standard errors in parentheses
*** p<0.01, ** p<0.05, * p<0.1

31
Table 7: Modeling City Voucher Crime Exposure, 2000
DV: Percent of voucher households in high crime tracts (highest quartile)
Model 1 Model 2 Model 3 Model 4
High-low crime rent differential 0.189*** 0.182*** 0.172** 0.167**
(0.0680) (0.0628) (0.0765) (0.0666)
Avg rent in lower crime as % of FMR 0.0755 0.0191 0.0241 0.0351
(0.0517) (0.0627) (0.0685) (0.0792)
% Renters in high crime 1.248*** 1.172*** 1.199*** 1.134***
(0.104) (0.108) (0.108) (0.105)
Vacancy rate, low crime -0.836*** -0.794*** -0.665* -0.681**
(0.265) (0.278) (0.353) (0.335)
Crime concentration
0.0229 -0.000224
(0.102) (0.107)
Voucher dissimilarity index
0.128 0.0362
(0.322) (0.324)
Voucher and crime interaction term
-0.100 -0.0527
(0.232) (0.247)
Poverty rate
-0.341* -0.409 -0.503*
(0.180) (0.261) (0.255)
%Black vouchers minus %Black city
0.0495 0.00800
(0.0741) (0.0805)
%Hisp vouchers minus %Hisp city
-0.111 -0.187
(0.113) (0.113)
Poor dissimilarity index
0.158
0.319*
(0.134)
(0.177)
White/non-white dissimilarity index
0.0310
-0.0124
(0.0707)
(0.101)
Source of income law dummy
-0.0130 -0.0215
(0.0221) (0.0246)
Central city dummy
0.00945 0.00555
(0.0192) (0.0206)
Total crime rate per 1000 -0.000174 0.000721 0.000615 0.00138
(0.000879) (0.000994) (0.000990) (0.00101)
Constant -0.0851 -0.0697 -0.0371 -0.0835
(0.0559) (0.0785) (0.165) (0.165)
Region Controls Yes Yes Yes Yes
Observations 86 86 84 84
Adjusted R-squared 0.913 0.915 0.913 0.914
Robust standard errors in parentheses
*** p<0.01, ** p<0.05, * p<0.1

32
References
Buron, Larry, Susan J. Popkin, Diane K. Levy, Laura E. Harris, and Jill Khadduri. 2002. The
HOPE VI Resident Tracking Study: A Snapshot of the Current Living Situation of Original
Residents From Eight Sites. Report prepared for the U.S. Department of Housing and Urban
Development, Office of Public Housing Investments. Washington, DC: The Urban Institute.
Cunningham, Mary and Noah Sawyer. 2005. “Moving to Better Neighborhoods with Mobility
Counseling.” Washington, DC: The Urban Institute.
Ellen, Ingrid G., Michael C. Lens, and Katherine. M. O’Regan. 2012. “American Murder
Mystery Revisited: Do Housing Voucher Households Cause Crime?” Housing Policy Debate, 22
(4): 551-572.
Farley, John E. 1982. “Has Public Housing Gotten a Bum Rap?: The Incidence of Crime in St.
Louis Public Housing Developments,” Environment and Behavior 14 (4): 443-477.
Feins, Judith D., and Mark D. Shroder. 2005. “Moving to Opportunity: The Demonstration’s
Design and its Effects on Mobility,” Urban Studies 42 (8): 1275–1299.
Fosburg, Linda, Susan J. Popkin, and Gretchen Locke. 1996. An Historical and Baseline
Assessment of HOPE VI. Vol. 1.Washington, D.C.: U.S. Department of Housing and Urban
Development.
Freeman, Lance. 2012. “The Impact of Source of Income Laws on Voucher Utilization,”
Housing Policy Debate 22 (2): 297-318.
Goering, John, Judith D. Feins, and Todd M. Richardson. 2002. “A Cross-Site Analysis of Initial
Moving to Opportunity Demonstration Results,” Journal of Housing Research 13 (1): 1–30.
Hanratty, Maria, Sara McLanahan, and Becky Pettit. 1998. “The Impact of the Los Angeles
Moving to Opportunity Program on Residential Mobility, Neighborhood Characteristics, and
Early Child and Parent Outcomes.” Working Paper. Princeton, NJ: Princeton University, Center
for Research on Child Wellbeing.
Galster, George. C., Peter A. Tatian, Anna M. Santiago, Kathryn L.S. Pettit, and Robin E. Smith.
2003. Why Not in My Backyard?: Neighborhood Impacts of Deconcentrating Assisted Housing.
New Brunswick, N.J.: Center for Urban Policy Research.
Goetz, Edward G., Hin Kin Lam, and Anne Heitlinger, 1996. There Goes the Neighborhood?:
The Impact of Subsidized Multi-Family Housing on Urban Neighborhoods. Minneapolis, MN:
University of Minnesota Center for Urban and Regional Affairs.
Federal Register. 1999. Department of Housing and Urban Development, Quality Housing and
Work Responsibility Act: Initial Guidance. Vol. 64, (32).
Katz, Bruce J. and Margery Austin Turner. 2001. “Who Should Run the Housing

33
Voucher Program? A Reform Proposal, Housing Policy Debate, 12 (2): 239-262.
Keels, Micere, Greg J. Duncan, Stefanie Deluca, Ruby Mendenhall, and James Rosenbaum.
2005. “Fifteen Years Later: Can Residential Mobility Programs Provide a Long-Term Escape
From Neighborhood Segregation, Crime, and Poverty?” Demography 42 (1): 51–73.
Kingsley, G. Thomas, and Kathryn L.S. Pettit. 2008. Have MTO Families Lost Access to
Opportunity Neighborhoods Over Time? Washington, DC: Urban Institute Press.
Kling, Jeffrey R., Jens Ludwig, and Lawrence F. Katz. 2005. “Neighborhood Effects on Crime
for Female and Male Youth: Evidence from a Randomized Housing Voucher Experiment,” The
Quarterly Journal of Economics 120 (1): 87.
Lens, Michael C., Ingrid G. Ellen, and Katherine M. O’Regan. 2011. “Do Vouchers Help Low-
Income Households Live in Safer Neighborhoods? Evidence on the Housing Choice Voucher
Program,” Cityscape 13 (3): 135-159.
McClure, Kirk. 2006. “The Low-Income Housing Tax Credit Program Goes Mainstream and
Moves to the Suburbs,” Housing Policy Debate 17 (3): 419–446.
McNulty, Thomas L., and Steven R. Holloway. 2000. “Race, Crime, and Public Housing in
Atlanta: Testing a Conditional Effect Hypothesis,” Social Forces 79, (2) (Dec.): 707-729.
Newman, Sandra J., and Ann B. Schnare. 1997. “‘…And a Suitable Living Environment’: The
Failure of Housing Programs To Deliver on Neighborhood Quality,” Housing Policy Debate 8
(3): 703–741.
Pendall, Rolf. 2000. “Why Voucher and Certificate Users Live in Distressed Neighborhoods,”
Housing Policy Debate 11 (4): 881–910.
Peterson, Ruth D., and Lauren Krivo. 2010. “ICPSR #27501: National Neighborhood Crime
Study (NNCS) 2000 Codebook.” Ann Arbor: Inter-University Consortium for Political and
Social Research.
Popkin, Susan J. and Elizabeth Cove. 2007. “Safety Is the Most Important Thing: How HOPE VI
Helped Families.” Washington, DC: The Urban Institute.
Popkin, Susan J., Diane K. Levy, Laura E. Harris, Jennifer Comey, Mary K. Cunningham, and
Larry Buron. 2002. Hope VI Panel Study: Baseline Report. Washington, D.C.: The Urban
Institute.
Popkin, Susan J., Michael J. Rich, Leah Hendey, Joseph Parilla, and George Galster. 2012.
“Public Housing Transformation and Crime: Making the Case for Responsible Relocation.”
Cityscape 14(3): 137-160.
Roncek, Dennis W., Ralph Bell, and Jeffrey M. A. Francik. 1981. “Housing Projects and Crime:
Testing a Proximity Hypothesis,” Social Problems 29 (2): 151-166.

34
Rubinowitz, Leonard S., and James E. Rosenbaum. 2000. Crossing the Class and Color Lines:
From Public Housing to White Suburbia. Chicago: University of Chicago Press.
Sampson, Robert J., Stephen W. Raudenbush, and Felton Earls. 1997. “Neighborhoods and
Violent Crime: A Multilevel Study of Collective Efficacy,” Science 277 (5328): 918–924.
Suresh, Geetha and Vito, Gennaro F. 2009. Homicide Patterns and Public Housing: The Case of
Louisville, KY (1989-2007), Homicide Studies, 13 (4): 411-433.
Turner, Margery Austin, Susan J. Popkin, and Mary Cunningham. 1999. Section 8 Mobility and
Neighborhood Health: Emerging Issues and Policy Challenges. Washington, D.C.: The Urban
Institute.
Van Zandt, S. and Mhatre, P. (2009) “The Effect of Housing Choice Voucher Households on
Neighborhood Crime: Longitudinal Evidence from Dallas,” Working Paper 09-01, Sustainable
Housing Research Unit (SHRU), College of Architecture, Texas A&M University.
Wang, Xinhao, and David Varady. 2005. “Using Hot-Spot Analysis To Study the Clustering of
Section 8 Housing Choice Voucher Families,” Housing Studies 20 (1): 29–48.
Wang, Xinhao, David Varady, and Yimei Wang. 2008. “Measuring the Deconcentration of
Housing Choice Voucher Program Recipients in Eight U.S. Metropolitan Areas Using Hot-Spot
Analysis,” Cityscape 10 (1): 65–90.