safe automotive software architecture (safe)safe-project.eu/safe-publications/safe_d3.3.1.b.pdf ·...
TRANSCRIPT
SAFE – an ITEA2 project D331b
2013 The SAFE Consortium 1 (80)
Contract number: ITEA2 – 10039
Safe Automotive soFtware architEcture (SAFE)
ITEA Roadmap application domains: Major: Services, Systems & Software Creation Minor: Society ITEA Roadmap technology categories: Major: Systems Engineering & Software Engineering Minor 1: Engineering Process Support
WP3 Deliverable D331b: Methodology and Tool
specification for analysis of qualitative and quantitative cut-sets issued from error failure
propagation analyses
Due date of deliverable: 31/12/13 Actual submission date: 18/12/13 Start date of the project: 01/05/2012 Duration: 16 months Project coordinator name: Stefan Voget Organization name of lead contractor for this deliverable: Valeo Editor: Florent Meurville ([email protected]) Contributors: Philippe CUENOT – Chapter 9 ([email protected]) Reviewers: P. Cuenot (Continental), R. Geiger (ZF), M. Amann (ZF), L. Bulwahn (BMW Car IT), N. Adler (FZI)

SAFE – an ITEA2 project D331b
2013 The SAFE Consortium 2 (80)
Revision chart and history log
Version Date Reason
0.5 02/12/2013 D331b Ready for Review
0.6 03/12/2013 Conti-F review
0.7 09/12/2013 ZF review
0.75 10/12/2013 BMW CAR IT 1st review
0.8 10/12/2013 Valeo 1st correction
0.85 11/12/2013 FZI review
0.9 11/12/2013 Valeo 2nd correction
0.95 16/12/2013 Ready for Release
1.0 18/12/2013 Released
SAFE – an ITEA2 project D331b
2013 The SAFE Consortium 3 (80)
1 Table of contents
1 Table of contents ............................................................................................................................................ 3 2 List of figures .................................................................................................................................................. 6 3 List of tables ................................................................................................................................................... 7 4 Executive Summary ....................................................................................................................................... 8 5 Introduction and overview of the document .................................................................................................... 9
5.1 Introduction ............................................................................................................................................ 9 5.2 Scope of deliverable D331b ................................................................................................................. 10 5.3 Structure of the document ................................................................................................................... 10
6 Proposal of a Global Safety Analysis Methodology ...................................................................................... 11 6.1 Knowledge sharing between partners on practiced safety analysis methods ...................................... 11 6.2 Terminology used in the deliverable for physical elements .................................................................. 12 6.3 Global Safety Analysis Methodology Proposal .................................................................................... 13 6.4 Use case presentation for illustration ................................................................................................... 15 6.5 System Safety Analyzes [Design Phase] ............................................................................................. 16
6.5.1 STEP 1A: Perform Qualitative System FMEA [Mandatory] [System Safety Analysis] [Design Phase] 16
6.5.1.1 Qualitative SFMEA: Application Rules .................................................................................... 16 6.5.1.2 Qualitative SFMEA: Introduction ............................................................................................. 16 6.5.1.3 Qualitative SFMEA: Main Purpose ......................................................................................... 16 6.5.1.4 Qualitative SFMEA: Standards applicable .............................................................................. 16 6.5.1.5 Qualitative SFMEA: Input ....................................................................................................... 17 6.5.1.6 Qualitative SFMEA: Main Principles ....................................................................................... 17 6.5.1.7 Qualitative SFMEA: Output..................................................................................................... 18 6.5.1.8 Qualitative SFMEA: Illustration via our example ..................................................................... 18
6.5.2 STEP 1B: Perform Qualitative System FTA [ASIL dependent] [System Safety Analysis] [Design Phase] .............................................................................................................................. 20
6.5.2.1 Qualitative System FTA: Application Rules ............................................................................ 20 6.5.2.2 Qualitative System FTA: Main Purpose .................................................................................. 20 6.5.2.3 Qualitative System FTA: Standards applicable....................................................................... 20 6.5.2.4 Qualitative System FTA: Input ................................................................................................ 20 6.5.2.5 Qualitative System FTA: Main Principles ................................................................................ 21 6.5.2.6 Qualitative System FTA: Output ............................................................................................. 21 6.5.2.7 Qualitative System FTA: Illustration via our example ............................................................. 22
6.5.3 STEP 1C: Perform Quantitative System FTA for residual risk allocation [ASIL dependent] [System Safety Analysis] [Design Phase] ................................................................................................................... 23
6.5.3.1 Quantitative System FTA: Application Rules .......................................................................... 23 6.5.3.2 Quantitative System FTA: Main Purpose ................................................................................ 23 6.5.3.3 Quantitative System FTA: Standards applicable .................................................................... 23 6.5.3.4 Quantitative System FTA: Input .............................................................................................. 23 6.5.3.5 Quantitative System FTA: Main Principle ............................................................................... 23 6.5.3.6 Quantitative System FTA: Output ........................................................................................... 24 6.5.3.7 Quantitative System FTA: Illustration via our example ........................................................... 25
6.5.4 STEP 1D: Allocate HW Architectural Metrics to components (Optional) [System Safety Analysis] [Design Phase] ............................................................................................................................................. 26
6.5.4.1 HW Architectural Metrics Allocation: Application Rules .......................................................... 26 6.5.4.2 HW Architectural Metrics Allocation: Main Purpose ................................................................ 26 6.5.4.3 HW Architectural Metrics Allocation: Standards applicable .................................................... 26 6.5.4.4 HW Architectural Metrics Allocation: Input .............................................................................. 26 6.5.4.5 HW Architectural Metrics Allocation: Main Principle ............................................................... 26 6.5.4.6 HW Architectural Metrics Allocation: Output ........................................................................... 28
6.6 Component Safety Analyzes: Design Phase ....................................................................................... 29 6.6.1 STEP 2A: Perform Qualitative Component FMEDA [Mandatory] [Component Safety Analysis] [Design Phase] ................................................................................................................... 29
6.6.1.1 Qualitative Component FMEDA: Application Rules ................................................................ 29 6.6.1.2 Qualitative Component FMEDA: Introduction ......................................................................... 29 6.6.1.3 Qualitative Component FMEDA: Main Purpose ...................................................................... 29 6.6.1.4 Qualitative Component FMEDA: Standards applicable .......................................................... 29 6.6.1.5 Qualitative Component FMEDA: Input .................................................................................... 29 6.6.1.6 Qualitative Component FMEDA: Main Principles ................................................................... 30 6.6.1.7 Qualitative Component FMEDA: Output ................................................................................. 30 6.6.1.8 Qualitative Component FMEDA: Illustration via our example ................................................. 31
6.6.2 STEP 2B: Perform Qualitative Component FTA [Optional] [Component Safety Analysis] [Design Phase] ................................................................................................................... 33
6.6.2.1 Qualitative Component FTA: Application Rules ...................................................................... 33 6.6.2.2 Qualitative Component FTA: Main Purpose ........................................................................... 33
SAFE – an ITEA2 project D331b
2013 The SAFE Consortium 4 (80)
6.6.2.3 Qualitative Component FTA: Standards applicable ................................................................ 33 6.6.2.4 Qualitative Component FTA: Input ......................................................................................... 33 6.6.2.5 Qualitative Component FTA: Main Principles ......................................................................... 33 6.6.2.6 Qualitative Component FTA: Output ....................................................................................... 34 6.6.2.7 Qualitative Component FTA: Illustration via our example ....................................................... 35
6.6.3 STEP 2C: Perform Quantitative Component FTA (Optional) [Component Safety Analysis] [Design Phase] ................................................................................................................... 36 6.6.4 STEP 2D: Allocate Architectural Metrics (Optional) [Component Safety Analysis] [Design Phase] ................................................................................................................... 36
6.7 HW Safety Analysis: Design Phase ..................................................................................................... 37 6.7.1 STEP 3A: Perform eFMEA at HW Part level (Optional) [HW Safety Analysis] [Design Phase] [Alternative 1] ............................................................................................................................................... 37
6.7.1.1 eFMEA: Application Rules ...................................................................................................... 37 6.7.1.2 eFMEA: Main Purpose ........................................................................................................... 37 6.7.1.3 eFMEA: Standards applicable ................................................................................................ 37 6.7.1.4 eFMEA: Input.......................................................................................................................... 37 6.7.1.5 eFMEA: Main Principles ......................................................................................................... 38 6.7.1.6 eFMEA: Output ....................................................................................................................... 38 6.7.1.7 eFMEA: Illustration via our example ....................................................................................... 38
6.8 HW Safety Analysis: Metrics Verification Phase .................................................................................. 40 6.8.1 STEP 4A: Perform Quantitative FMEDA at HW Part Level (Optional) [HW Safety Analysis] [Verification Phase] [Alternative 2] ..................................................................................... 40
6.8.1.1 Quantitative FMEDA at HW Part Level: Application Rules ..................................................... 40 6.8.1.2 Quantitative FMEDA at HW Part Level: Main Purpose ........................................................... 40 6.8.1.3 Quantitative FMEDA at HW Part Level: Standards applicable ............................................... 40 6.8.1.4 Quantitative FMEDA at HW Part Level: Input ......................................................................... 40 6.8.1.5 Quantitative FMEDA at HW Part Level: Main Principles ......................................................... 40 6.8.1.6 Quantitative FMEDA at HW Part Level: Output ...................................................................... 42 6.8.1.7 Quantitative FMEDA at HW Part Level: Illustration via our example ...................................... 43
6.8.2 STEP 4B: Calculate Component Residual Risk (Optional) at HW Part level [HW Safety Analysis] [Verification Phase] [Alternative 2] ................................................................................................................ 46
6.8.2.1 STEP 4B1: Calculate Component Residual Risk at HW Part level using Method 1: Probabilistic Metric for random Hardware Failures (PMHF) [Alternative 2] ............................................ 46 6.8.2.2 STEP 4B2: Calculate Component Residual Risk at Part level using Method 2: Evaluation of each cause of safety goal violation [Alternative 2] ............................................................................. 47
6.9 Component Safety Analyzes: Verification Phase ................................................................................. 50 6.9.1 STEP 5A: Perform Quantitative Component FMEDA at HW Block Level (Optional) [Component Safety Analysis] [Verification Phase] [Alternative 1] ..................................................................................... 50
6.9.1.1 Quantitative Component FMEDA at HW Block Level: Application Rules ................................ 50 6.9.1.2 Quantitative Component FMEDA at HW Block Level: Main Purpose ..................................... 50 6.9.1.3 Quantitative Component FMEDA at HW Block Level: Standards applicable .......................... 50 6.9.1.4 Quantitative Component FMEDA at HW Block Level: Input ................................................... 50 6.9.1.5 Quantitative Component FMEDA at HW Block Level: Main Principles ................................... 51 6.9.1.6 Quantitative Component FMEDA at HW Block Level: Output ................................................ 53 6.9.1.7 Quantitative Component FMEDA at HW Block Level: Illustration via our example ................. 53
6.9.2 STEP 5B: Calculate Component Residual Risk at HW Block level using Method 2 / PMHF [Component Safety Analysis] [Verification Phase] [Alternative 1] & [Alternative 2] ....................................... 56
6.9.2.1 Preliminary discussion on PMHF definition ............................................................................ 56 6.9.2.2 PMHF calculation using Quantitative Component FTA: Application rules .............................. 57 6.9.2.3 PMHF calculation using Quantitative Component FTA: Main purpose ................................... 58 6.9.2.4 PMHF calculation using Quantitative Component FTA: Standards Applicable ....................... 58 6.9.2.5 PMHF calculation using Quantitative Component FTA: Input ................................................. 58 6.9.2.6 PMHF calculation using Quantitative Component FTA: Main Principles ................................ 58 6.9.2.7 PMHF calculation using Quantitative Component FTA: Output .............................................. 62 6.9.2.8 PMHF calculation using Quantitative Component FTA: Illustration via our example .............. 62
6.10 System Safety Analyzes: Verification Phase ....................................................................................... 64 6.10.1 STEP 6A: Verifying Architectural Metrics at System level (Optional) [System Safety Analysis] [Verification Phase] ...................................................................................................................................... 64
6.10.1.1 Verifying Architectural Metrics at System level: Application Rules ......................................... 64 6.10.1.2 Verifying Architectural Metrics at System level: Main Purpose ............................................... 64 6.10.1.3 Verifying Architectural Metrics at System level: Standards Applicable ................................... 64 6.10.1.4 Verifying Architectural Metrics at System level: Input ............................................................. 64 6.10.1.5 Verifying Architectural Metrics at System level: Main principles using our example ............... 64 6.10.1.6 Verifying Architectural Metrics at System level: Output .......................................................... 65
6.10.2 STEP 6B: Verifying Residual Risk at System level (Optional) [System Safety Analysis] [Verification Phase] ...................................................................................................................................... 66
6.10.2.1 Verifying Residual Risk at System level: Application Rules .................................................... 66 6.10.2.2 Verifying Residual Risk at System level: Main Purpose ......................................................... 66
SAFE – an ITEA2 project D331b
2013 The SAFE Consortium 5 (80)
6.10.2.3 Verifying Residual Risk at System level: Standards Applicable .............................................. 66 6.10.2.4 Verifying Residual Risk at System level: Input........................................................................ 66 6.10.2.5 Verifying Residual Risk at System level: Main principles using our example ......................... 66 6.10.2.6 Verifying Residual Risk at System level: Output ..................................................................... 68
7 Gaps analysis between proposed safety analyses and state of the art tools................................................ 69 7.1 « Safety» FMEAs versus Classical FMEAs. ........................................................................................ 69 7.2 Interface between qualitative and quantitative safety analyses. .......................................................... 69 7.3 Interface between different safety analyses types. .............................................................................. 70 7.4 Residual risk calculation using alternative methods ............................................................................ 70
8 Tool specification .......................................................................................................................................... 71 8.1 Safety analyses of interest taken into account in D331b ..................................................................... 71 8.2 WT331 Added Value and topics of interest derived from ISO26262 .................................................... 71 8.3 Requirements for tools......................................................................................................................... 72
9 Definition of the ontology of malfunctions at different abstraction levels for SAFE Meta-Model ................... 74 9.1 Malfunction Ontology for Functional Safety Concept ........................................................................... 74 9.2 Malfunction Ontology for Technical Safety Concept ............................................................................ 75 9.3 Malfunction Ontology for Implementation ............................................................................................ 76
10 Conclusions .................................................................................................................................................. 77 11 Abbreviations used in D331b document ....................................................................................................... 78 12 References ................................................................................................................................................... 79 [1] International Organization for Standardization: ISO 26262 Road vehicles - Functional safety. Part 1 to 9 (2011) .................................................................................................................................................................... 79 [2] International Organization for Standardization: ISO 26262 Road vehicles – Functional safety. Guideline Part 10 (2012) ............................................................................................................................................................... 79 [3] SAFE Deliverable D311b: Final proposal for extension of meta-model for hazard and environment modeling ; http://www.safe-project.eu/SAFE-Publications/SAFE_D3.1.1.b.pdf .................................................................... 79 [4] VDA Volume 4 Chapter: Product-and Process-FMEA .................................................................................. 79 [5] IEC 60812 ed.2.0, Analysis techniques for system reliability – Procedure for failure mode and effects analysis (FMEA). (2006) ....................................................................................................................................... 79 [6] SAE J1739, Potential Failure Mode and Effects Analysis in Design (Design FMEA), Potential Failure Mode and Effects Analysis in Manufacturing and Assembly Processes (Process FMEA). (2009) .................................. 79 [7] IEC61025 ed.2.0, Fault Tree Analysis. (2006) .............................................................................................. 79 [8] NUREG-0492: Fault Tree Handbook from US Nuclear Regulatory Commission. (1981) ............................. 79 [9] SAE ARP4761: Guideline and Methods for conducting the safety assessment process on civil airborne systems and equipments. (1996) .......................................................................................................................... 79 [10] MIL-STD1629A: Military Standard, Procedure for Performing a Failure Mode, Effect and Criticality Analysis. (1980) .................................................................................................................................................... 79 [11] Experience with the second method for EPS hardware analysis: Evaluation of each cause of safety goal violation due to random hardware failures; K.Svancara & W.Forbes & J.Priddy & M.Kudanowski & T. Lovric & J. Miller; VDA Automotive Sys conference May 2012. .............................................................................................. 79 [12] Advantages of the alternative method for random hardware failures quantitative evaluation – A practical survey for EPS, K.Svancara & W.Forbes & J.Priddy & M.Kudanowski & T. Lovric & J. Miller, SAE conference April 2013. ............................................................................................................................................................. 79 [13] Adler, N., Otten, S., Cuenot, P., and Müller-Glaser, K., "Performing Safety Evaluation on Detailed Hardware Level according to ISO 26262," SAE Int. J. Passeng. Cars – Electron. Electr. Syst. 6(1):102-113, 2013,
doi:10.4271/2013-01-0182. ................................................................................................................................... 79 [14] IEC 61508 standard: Functional safety of electrical/electronic/programmable electronic safety-related systems, Parts 6, 2010 (International Electrotechnical Commission, Geneva, Switzerland). ................................ 79 [15] New insight into the average probability of failure on demand and the probability of dangerous failure per hour of safety instrumented systems, F Innal & Y Dutuit & A Rauzy & J-P Signoret, Proc. IMechE Vol. 224 Part O: J. Risk and Reliability. ........................................................................................................................................... 79 [16] SAFE Deliverable D322a : Proposal for extension of Meta model for hardware modeling ; http://www.safe-project.eu/SAFE-Publications/SAFE_D3.2.2.pdf ......................................................................... 79 [17] SAFE Deliverable D331a : Proposal for extension of metamodel for error failure and propagation analysis ; http://www.safe-project.eu/SAFE-Publications/SAFE_D3.3.1.a.pdf .................................................................... 79 13 Acknowledgments ........................................................................................................................................ 80

SAFE – an ITEA2 project D331b
2013 The SAFE Consortium 6 (80)
2 List of figures
Figure 1: Scope of deliverable D331b ................................................................................................... 10 Figure 2: General Safety Analysis Process Proposal by WT331 Partners ........................................... 13 Figure 3: General flowchart of the Global Safety Analysis Process ..................................................... 14 Figure 4: Physical architecture of the lighting control system ............................................................... 15 Figure 5: Example of qualitative system FTA for the lighting control system ....................................... 22 Figure 6: Example of quantitative System FTA with possible target allocation for our example .......... 25 Figure 7: Example of parallel architecture ............................................................................................ 28 Figure 8: Example of physical architecture description for the Top Column Module............................ 31 Figure 9: Example of qualitative Component FTA for the Top Column Module ECU ........................... 35 Figure 10: Analog interface schematics ................................................................................................ 38 Figure 11: Example of flow diagram for failure mode classification ...................................................... 41 Figure 12: Analog Interface Schematics ............................................................................................... 43 Figure 13 : Example of flow diagram for failure mode classification ..................................................... 51
Figure 14: F(t) and w(t) plot with HWSR
RFSPF
,
= 50 FIT ............................................................... 56
Figure 15: F(t) and w(t) plot with 2 latent faults combined (1 = 50 FIT and 2 =30FIT) ....................... 57 Figure 16: Example of a single-point fault FTA pattern ........................................................................ 58 Figure 17: Example of 2 possible residual-fault FTA patterns .............................................................. 59 Figure 18: Example of 2 possible dual-point fault FTA patterns resulting from safety-mechanism failure ..................................................................................................................................................... 60 Figure 19: Example of 2 possible FTA patterns to model safety mechanism effect ............................. 61 Figure 20: Example of a dual-point failure pattern in a FTA ................................................................. 61 Figure 21: Example for quantitative component FTA for the TCM_ECU for SG_01 ............................ 63 Figure 22: Example of quantitative System FTA for verification ........................................................... 67 Figure 23: Illustration of a combination of FTA and FMEA [2] .............................................................. 70 Figure 24: Domains of interest for tool requirements for daily use ....................................................... 71
SAFE – an ITEA2 project D331b
2013 The SAFE Consortium 7 (80)
3 List of tables
Table 1 : Type of analysis methods required or recommended by ISO26262 [1] .................................. 9 Table 2 : Example of recognized analyzes methods listed by ISO26262 [1] .......................................... 9 Table 3 : Example of partial SFMEA performed on our use case......................................................... 19 Table 4 : Metrics allocation required or recommended by ISO26262 [1] ............................................. 23 Table 5 : HW Architectural Metrics allocation required or recommended by ISO26262 [1] ................. 26 Table 6 : Example of partial qualitative FMEDA performed on our use case ....................................... 32 Table 7 : Example of partial eFMEA for analog interface performed on our use case ......................... 39 Table 8 : Example of partial quantitative FMEDA at HW part level for analog interface performed on our use case .......................................................................................................................................... 44 Table 9 : Example of different FRC tables assuming different rationales for dangerous faults ............ 47 Table 10 : Targets of failure rate classes of HW parts regarding single-point faults ............................ 48 Table 11 : Maximum failure rate classes for a given diagnostic coverage of HW parts regarding residual faults ........................................................................................................................................ 48 Table 12 : Targets of failure rate class and coverage of HW parts regarding dual-point faults ............ 48 Table 13 : Example of partial quantitative FMEDA at HW Part level for analog interface performed on our use case .......................................................................................................................................... 54 Table 14 : Example of architectural metrics data synthesis for different components.......................... 65 Table 15 : Example of residual risk data synthesis for different components ....................................... 67

SAFE – an ITEA2 project D331b
2013 The SAFE Consortium 8 (80)
4 Executive Summary
The main goal of the deliverable D331b is to provide to readers some guidance on how to perform safety analyses when developing a safety-related product. This need to provide guidance is born from the exchange between WT331 partners because ISO26262 document recommends or requires to perform certain kind of safety analyses (qualitative or quantitative) but does not clearly state what is expected, how the different safety analyses can interact together, etc… Therefore a global safety analysis process is proposed from system design to detailed design and possible alternatives are highlighted. Of course it just serves as an example. In addition new methods for “safety” FMEAs or for calculating hardware architectural metrics at high abstraction level of hardware architecture are introduced. For each safety analysis considered, the basic idea is to provide information about when it is applicable, to which standards we can refer to, what are the inputs needed and what are the outputs provided. Moreover, this deliverables documents how to perform the safety analysis illustrated with a concrete example. From this global safety analysis process proposal, we identified some gaps between end-user needs and what can be really extracted from tool state of the art, tool capable to support FMEA and FTA methods. It leads to a list of requirements that would improve ISO26262 application thanks to strong improvement on tool usability in daily use. Finally a first attempt to define the ontology of malfunctions at different abstractions level in the SAFE Meta model is proposed for harmonization. It would facilitate the use and the share of the error model defined in the deliverable D331a via standardization of malfunction description.

SAFE – an ITEA2 project D331b
2013 The SAFE Consortium 9 (80)
5 Introduction and overview of the document
5.1 Introduction
As already explained in deliverable D331a, through the different concept and development phases from the safety lifecycle, ISO26262 recommends or requires, depending on the criticality of the items or elements to be developed, to perform safety analyses as shown hereafter:
ASIL A ASIL B ASIL C ASIL D
Inductive methods
Required Required Required Required
Deductive methods
Nothing required or recommended
Recommended Required Required
Table 1 : Type of analysis methods required or recommended by ISO26262 [1] The main objective of safety analyses is to support the derivation of safety requirements from the safety goals, and to validate and verify their effectiveness and completeness. Safety analyses are either inductive (starting from known causes and forecast possible effects) or deductive (starting from known effect and forecast possible causes). Qualitative analyses can be first appropriate and sufficient in most cases to identify malfunctions. In a second step, quantitative analyses extend qualitative safety analyses,, mostly to assess the effect of random hardware failures. So, the calculation of the hardware architectural metrics and of the residual risk to violate the safety goals is performed. Software failures, as systematic failures, do not require quantitative analyses but only qualitative analyses. ISO26262 does not force a specific analysis method but list all recognized methods as follows:
Qualitative analysis methods include: Quantitative analysis methods include:
Qualitative FMEA1 (inductive)
Qualitative FTA2 (deductive)
HAZOP3(mixed between inductive and deductive)
Qualitative ETA4 (inductive)
Ishikawa
Quantitative FMEA1 (inductive)
Quantitative FTA2 (deductive)
Quantitative ETA4 (inductive)
Markov models(inductive)
Reliability Block Diagrams(deductive) 1FMEA : Failure Mode Effect Analysis
2FTA : Fault Tree Analysis
3HAZOP : HAZard and OPerability analysis
4ETA : Event Tree Analysis
Table 2 : Example of recognized analyzes methods listed by ISO26262 [1]

SAFE – an ITEA2 project D331b
2013 The SAFE Consortium 10 (80)
Some of these safety analysis methods are well known and well defined in standards (e.g. FTA, Markov, FMEA, etc…). Some others like FMEA can be used in very different ways and are practiced out of safety analyses context and before the publication of ISO26262. The ISO26262 provides very few examples on how to perform safety analyses. In addition, the Part 10 [2] supposed to be a guideline for documentation of methodology gaps is also imprecise. Typical examples are:
ISO26262 does not explain how to perform qualitative FMEA and does not describe possible extension for quantitative FMEA?
ISO26262 does not explain how to relate different safety analyses and connect theirs results together?
ISO26262 does not explain how to allocate budget for metrics (top down) and how to verify obtained metrics (down top)?
Moreover the tools used to perform safety analyses are not dedicated to ISO26262 and require extensions to be used in practice. This deliverable aims clearly to address this gap.
5.2 Scope of deliverable D331b
The main scope of deliverable D331b is to define in a first step a methodology on how to perform safety analyses when developing a safety-related product. In a second step it provides the related list of news requirements for safety analysis tools available on the market.
Figure 1: Scope of deliverable D331b
5.3 Structure of the document
First, we highlight the result of knowledge sharing on safety analysis methodologies between partners, and then propose a possible global safety analysis process from system level down to the detailed design. Second, we benchmark the safety tools from the state of the art with the proposed safety analyses. Thirdly we propose a list of requirements to close the gap identified between our needs and feature available in tools performing FMEAs and FTAs safety analyses. Finally, in relationship with the considered methodology, we propose an ontology of malfunctions at different abstraction levels for the SAFE Meta-Model.
SAFE – an ITEA2 project D331b
2013 The SAFE Consortium 11 (80)
6 Proposal of a Global Safety Analysis Methodology
6.1 Knowledge sharing between partners on practiced safety analysis methods
In the context of deliverable D331b the main task of WT331, the different partners exchange on how they perform safety analyses when developing a new safety-related product. From this knowledge sharing we identified some lacks in safety analysis methodology, as there are not necessary well explained in ISO26262 [1] and even in ISO26262 Part 10 [2] which supposed to be a guideline. The list of the gaps is:
Performing the PMHF calculation at HW Part level from a given FTA result is unrealistic because a slight update of the HW schematics produces an update of the FTA. So at which level of architecture can we build FTA to calculate the PMHF?
How to better interact qualitative FMEDA and quantitative FMEDA?
Which kind of qualitative FMEA to use as ISO26262 recommend qualitative FMEA but without providing explanation?
How to allocate metrics from system to the different components of the system in case of distributed development?
How to rebuild residual risk metrics at system level when the different component suppliers have provided residual risk results using different methods (PMHF or Failure Rate Class as proposed in the ISO26262)?
How to reconstruct architectural metrics (single-point fault metrics and latent-fault metrics) at system level from architectural metrics provided by suppliers of the different component?
Does the quantitative FMEDA have to be performed absolutely at HW Part level, as it requires strong hardware skills for safety engineers?
As people from the different companies do not use necessary the same vocabulary (system, component, element, sub-system, part, etc…), it can lead to misunderstanding. Therefore clarification is needed.
So in the next chapters we aim to provide answers to these questions by proposing a global safety analysis process and explaining selected technical points that are not clear enough in the ISO26262.
SAFE – an ITEA2 project D331b
2013 The SAFE Consortium 12 (80)
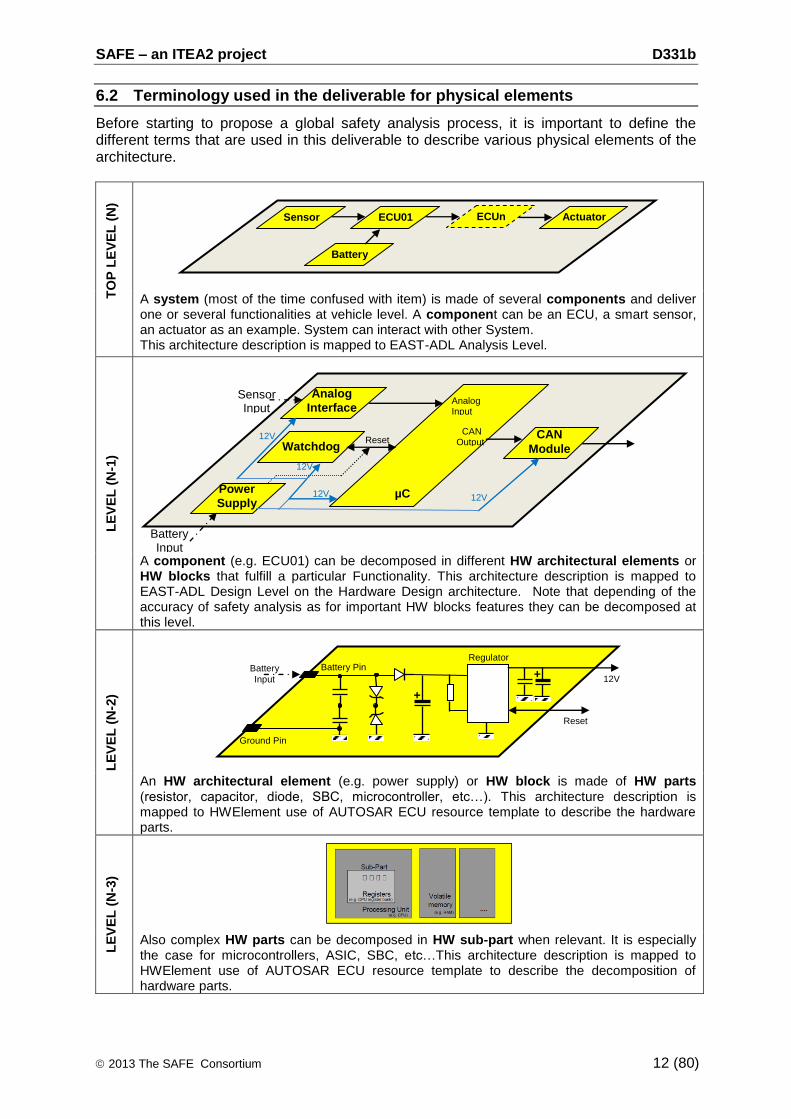
6.2 Terminology used in the deliverable for physical elements
Before starting to propose a global safety analysis process, it is important to define the different terms that are used in this deliverable to describe various physical elements of the architecture.
TO
P L
EV
EL
(N
)
A system (most of the time confused with item) is made of several components and deliver one or several functionalities at vehicle level. A component can be an ECU, a smart sensor, an actuator as an example. System can interact with other System. This architecture description is mapped to EAST-ADL Analysis Level.
LE
VE
L (
N-1
)
A component (e.g. ECU01) can be decomposed in different HW architectural elements or HW blocks that fulfill a particular Functionality. This architecture description is mapped to EAST-ADL Design Level on the Hardware Design architecture. Note that depending of the accuracy of safety analysis as for important HW blocks features they can be decomposed at this level.
LE
VE
L (
N-2
)
An HW architectural element (e.g. power supply) or HW block is made of HW parts (resistor, capacitor, diode, SBC, microcontroller, etc…). This architecture description is mapped to HWElement use of AUTOSAR ECU resource template to describe the hardware parts.
LE
VE
L (
N-3
)
Also complex HW parts can be decomposed in HW sub-part when relevant. It is especially the case for microcontrollers, ASIC, SBC, etc…This architecture description is mapped to HWElement use of AUTOSAR ECU resource template to describe the decomposition of hardware parts.
+
Regulator
12V
Reset
Battery Pin
Ground Pin
Battery
Input +
Power
Supply
Watchdog
Analog
Interface
µC
Sensor Input
Battery Input
12V
Analog Input
Reset CAN
Module 12V
12V
12V
CAN Output
Sensor ECU01 ECUn Actuator
Battery
SAFE – an ITEA2 project D331b
2013 The SAFE Consortium 13 (80)
6.3 Global Safety Analysis Methodology Proposal
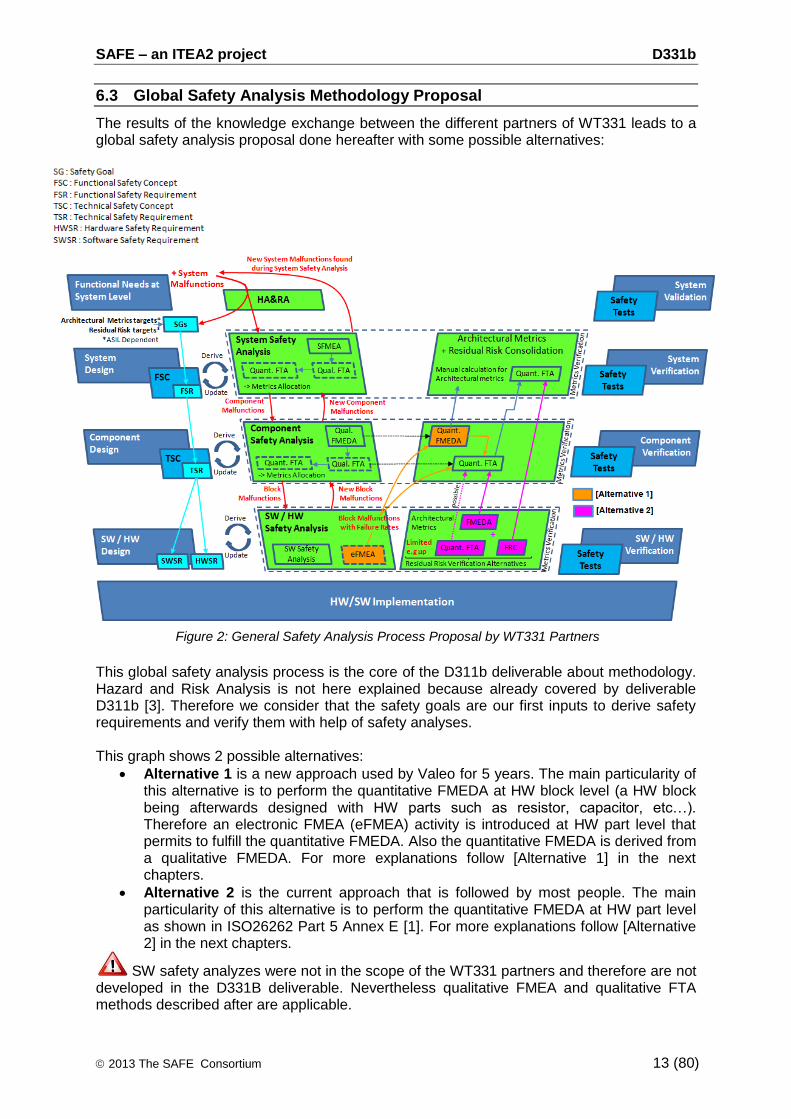
The results of the knowledge exchange between the different partners of WT331 leads to a global safety analysis proposal done hereafter with some possible alternatives:
Figure 2: General Safety Analysis Process Proposal by WT331 Partners
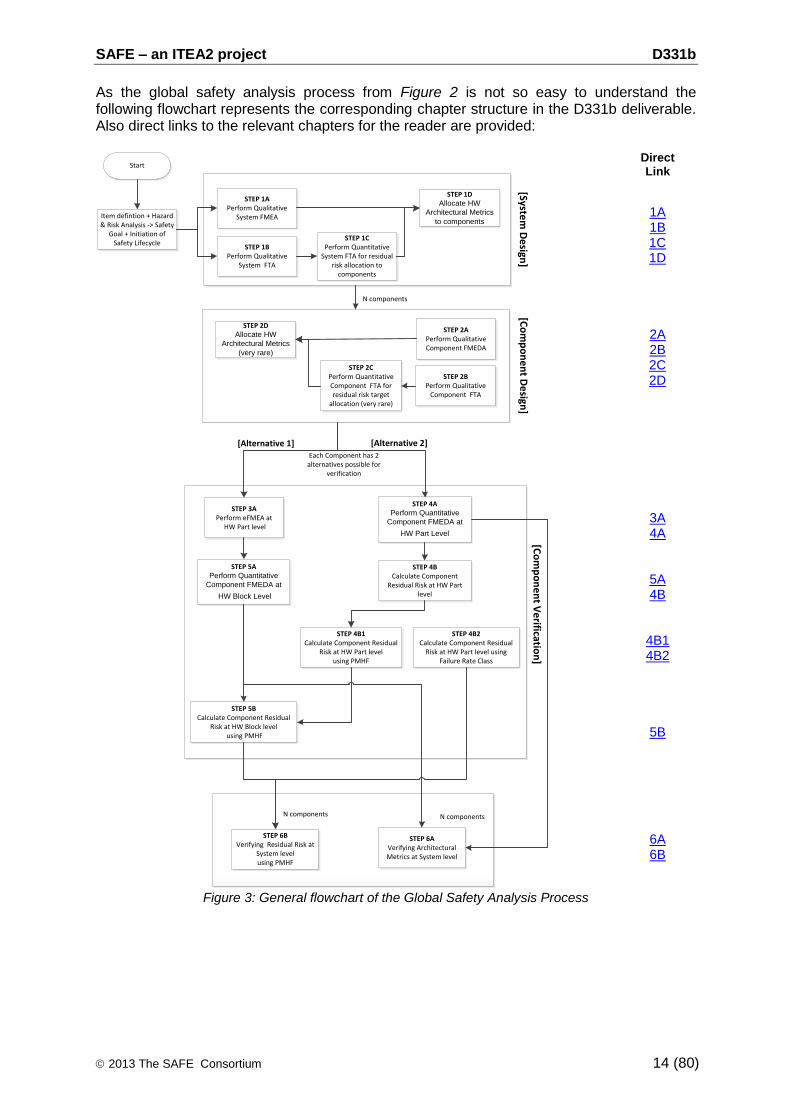
This global safety analysis process is the core of the D311b deliverable about methodology. Hazard and Risk Analysis is not here explained because already covered by deliverable D311b [3]. Therefore we consider that the safety goals are our first inputs to derive safety requirements and verify them with help of safety analyses.
This graph shows 2 possible alternatives:
Alternative 1 is a new approach used by Valeo for 5 years. The main particularity of this alternative is to perform the quantitative FMEDA at HW block level (a HW block being afterwards designed with HW parts such as resistor, capacitor, etc…). Therefore an electronic FMEA (eFMEA) activity is introduced at HW part level that permits to fulfill the quantitative FMEDA. Also the quantitative FMEDA is derived from a qualitative FMEDA. For more explanations follow [Alternative 1] in the next chapters.
Alternative 2 is the current approach that is followed by most people. The main particularity of this alternative is to perform the quantitative FMEDA at HW part level as shown in ISO26262 Part 5 Annex E [1]. For more explanations follow [Alternative 2] in the next chapters.
SW safety analyzes were not in the scope of the WT331 partners and therefore are not developed in the D331B deliverable. Nevertheless qualitative FMEA and qualitative FTA methods described after are applicable.
SAFE – an ITEA2 project D331b
2013 The SAFE Consortium 14 (80)
As the global safety analysis process from Figure 2 is not so easy to understand the following flowchart represents the corresponding chapter structure in the D331b deliverable. Also direct links to the relevant chapters for the reader are provided:
Start
STEP 1APerform Qualitative
System FMEA
STEP 1BPerform Qualitative
System FTA
STEP 1CPerform Quantitative
System FTA for residual risk allocation to
components
Item defintion + Hazard & Risk Analysis -> Safety
Goal + Initiation of Safety Lifecycle
STEP 1DAllocate HW
Architectural Metrics
to components
STEP 2APerform Qualitative Component FMEDA
STEP 2BPerform Qualitative
Component FTA
STEP 2CPerform QuantitativeComponent FTA for residual risk target
allocation (very rare)
STEP 2DAllocate HW
Architectural Metrics
(very rare)
STEP 3APerform eFMEA at
HW Part level
STEP 4APerform Quantitative
Component FMEDA at
HW Part Level
STEP 4BCalculate Component
Residual Risk at HW Part level
STEP 4B1Calculate Component Residual
Risk at HW Part level using PMHF
STEP 4B2Calculate Component Residual
Risk at HW Part level using Failure Rate Class
STEP 5APerform Quantitative
Component FMEDA at
HW Block Level
STEP 5BCalculate Component Residual
Risk at HW Block level using PMHF
STEP 6AVerifying Architectural Metrics at System level
STEP 6BVerifying Residual Risk at
System level using PMHF
[System
De
sign]
[Co
mp
on
en
t De
sign]
[Co
mp
on
en
t Ve
rification
]
[Alternative 1] [Alternative 2]
N components
N components
Each Component has 2 alternatives possible for
verification
N components
Direct Link
1A 1B 1C 1D
2A 2B 2C 2D
3A 4A
5A 4B
4B1 4B2
5B
6A 6B
Figure 3: General flowchart of the Global Safety Analysis Process
SAFE – an ITEA2 project D331b
2013 The SAFE Consortium 15 (80)
6.4 Use case presentation for illustration
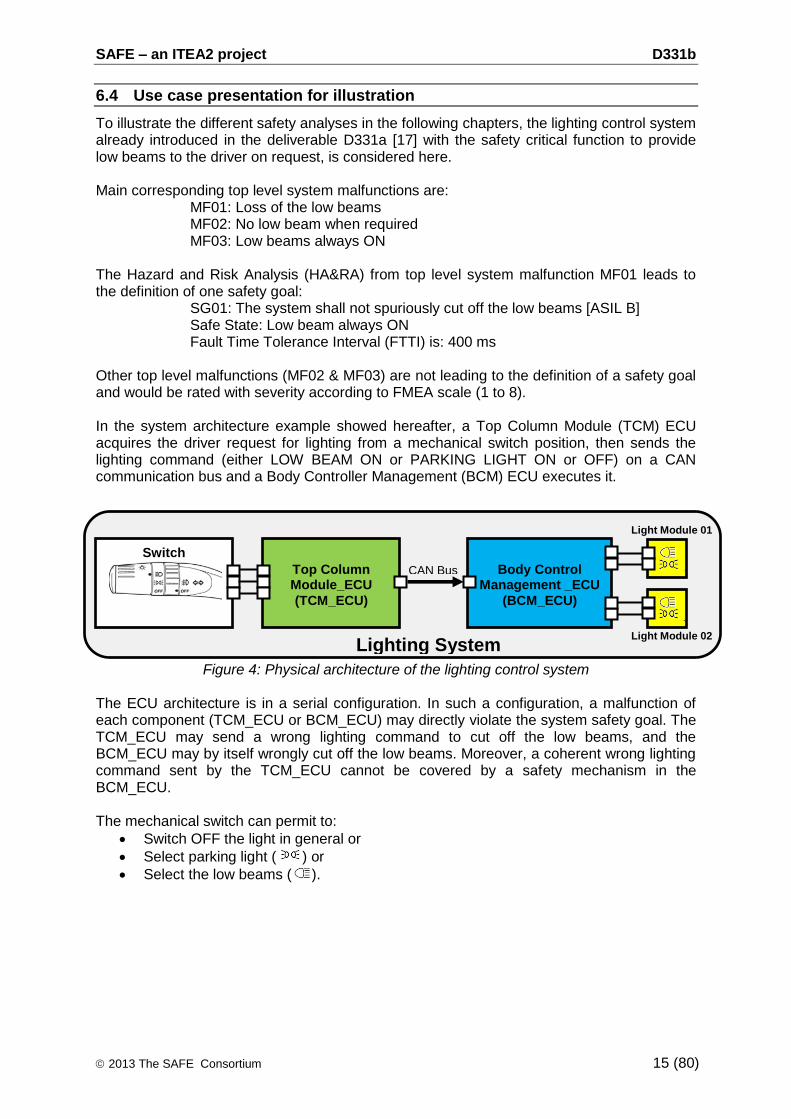
To illustrate the different safety analyses in the following chapters, the lighting control system already introduced in the deliverable D331a [17] with the safety critical function to provide low beams to the driver on request, is considered here. Main corresponding top level system malfunctions are:
MF01: Loss of the low beams MF02: No low beam when required MF03: Low beams always ON
The Hazard and Risk Analysis (HA&RA) from top level system malfunction MF01 leads to the definition of one safety goal:
SG01: The system shall not spuriously cut off the low beams [ASIL B] Safe State: Low beam always ON Fault Time Tolerance Interval (FTTI) is: 400 ms
Other top level malfunctions (MF02 & MF03) are not leading to the definition of a safety goal and would be rated with severity according to FMEA scale (1 to 8). In the system architecture example showed hereafter, a Top Column Module (TCM) ECU acquires the driver request for lighting from a mechanical switch position, then sends the lighting command (either LOW BEAM ON or PARKING LIGHT ON or OFF) on a CAN communication bus and a Body Controller Management (BCM) ECU executes it.
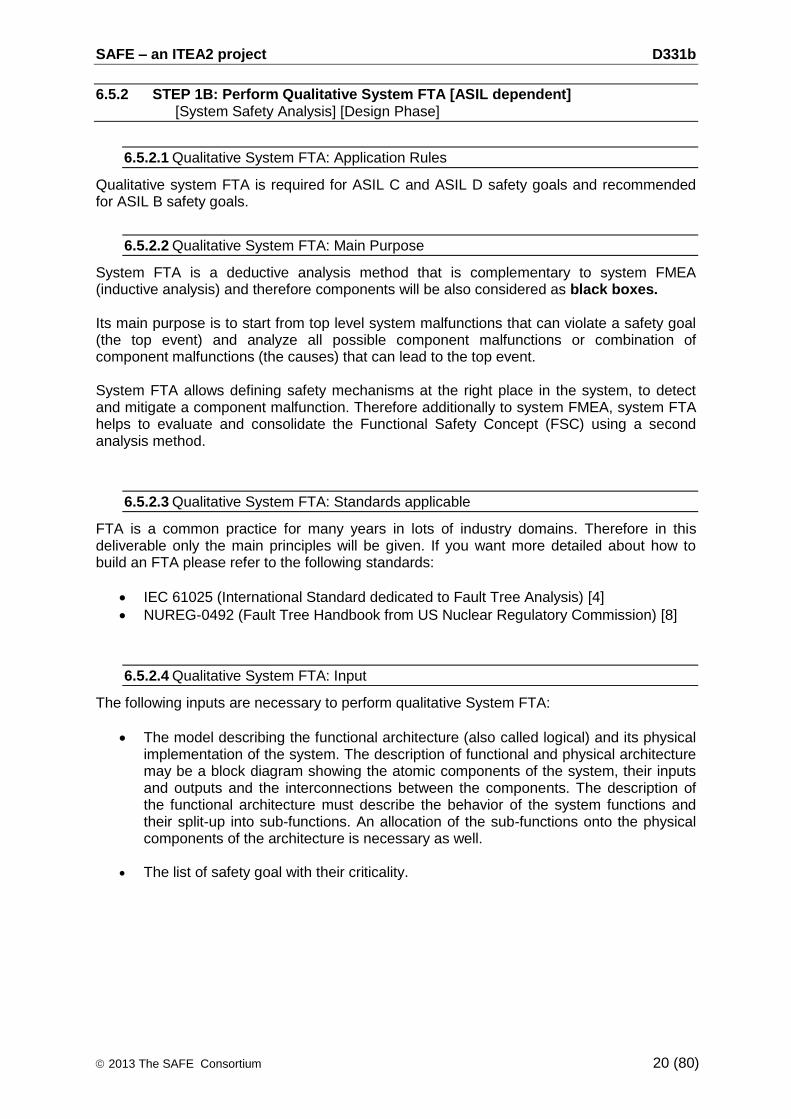
Figure 4: Physical architecture of the lighting control system The ECU architecture is in a serial configuration. In such a configuration, a malfunction of each component (TCM_ECU or BCM_ECU) may directly violate the system safety goal. The TCM_ECU may send a wrong lighting command to cut off the low beams, and the BCM_ECU may by itself wrongly cut off the low beams. Moreover, a coherent wrong lighting command sent by the TCM_ECU cannot be covered by a safety mechanism in the BCM_ECU. The mechanical switch can permit to:
Switch OFF the light in general or
Select parking light ( ) or
Select the low beams ( ).
Top Column Module_ECU
(TCM_ECU)
CAN Bus
Switch
Body Control
Management _ECU
(BCM_ECU)
Lighting System
Light Module 01
Light Module 02
SAFE – an ITEA2 project D331b
2013 The SAFE Consortium 16 (80)
6.5 System Safety Analyzes [Design Phase]
6.5.1 STEP 1A: Perform Qualitative System FMEA [Mandatory] [System Safety Analysis] [Design Phase]
6.5.1.1 Qualitative SFMEA: Application Rules
System FMEA (SFMEA) is mandatory for safety-related systems (system with at least a safety goal defined).
6.5.1.2 Qualitative SFMEA: Introduction
Classical FMEA methods that are practiced for decades in many industries are very often dealing with fault avoidance [5]. A barrier is implemented to stop the fault consequence. This approach can be kept for systematic faults. Therefore fault tolerance (control of propagation of causes to avoid critical failures, using safety mechanisms) as requested by ISO26262 [1] is not covered by the classical FMEA methods. In the VDA standard [4] SFMEA is equivalent to a Product FMEA at System-Level. Also a new Mechatronic FMEA has been introduced in order be able to cover fault tolerance and have a clear visualization of the mitigation effect. As the VDA approach is only covered by some tools from the market here in this chapter we would propose a possible alternative that is used by Valeo. Moreover later in the document some requirements will be addressed to the different tools from the market in order to be able to perform this new method (see chapter 8.3).
6.5.1.3 Qualitative SFMEA: Main Purpose
System FMEA is an inductive qualitative analysis tool. Its main purpose is to provide an evidence for sufficient fault tolerance. Its main principle is to systematically evaluate propagation of component malfunctions in the system and allows identifying the most critical malfunction of the components of the system. It is as well a design support tool to allow defining safety mechanisms at the right place in the system. Moreover it helps to evaluate and consolidate the Functional Safety Concept.
6.5.1.4 Qualitative SFMEA: Standards applicable
FMEA is a common practice for many years in lots of industry domains. Nevertheless even if there is many standards available like [5][6], all are addressing fault avoidance and not fault tolerance. For fault tolerance the only standard to which we can refer is the VDA [4] and more particularly its chapter 2.1 on Mechatronic FMEA.
SAFE – an ITEA2 project D331b
2013 The SAFE Consortium 17 (80)
6.5.1.5 Qualitative SFMEA: Input
The following inputs are necessary to perform qualitative SFMEA:
The model describing the functional architecture (also called logical) and its physical implementation of the system. The description of functional and physical architecture may be a block diagram showing the atomic components of the system, their inputs and outputs and the interconnections between the components. The description of the functional architecture must describe the behavior of the system functions and their split-up into sub-functions. An allocation of the sub-functions onto the physical components of the architecture is necessary as well.
The list of top level system malfunctions with their maximum associated criticality.
Note: Sometimes safety and unavailability studies are mixed together. Therefore for top level system malfunctions that were rated S0 during hazard and risk analysis, meaning that consequences of the malfunctioning behavior is clearly limited to material damage and do not involve harm to persons, it can be relevant to refine this S0 with the 1 to 8 severity scale used in classical FMEA methods.
6.5.1.6 Qualitative SFMEA: Main Principles
In this analysis, as hypothesis, components will be considered as black boxes. They have a function or more to realize but we do not know yet what is inside a component.
1. The first step of the System FMEA is to analyze effect of each component malfunction (linked to the function to realize) at system level without safety mechanism. It is important to notice that the system effects are the top level system malfunctions that have already been identified in the hazard and risk analysis with the customer effects. Malfunctions are already assessed and quoted (Criticality: ASIL A to D or QM).
2. Having assessed the system effect for each component malfunction, then the criticality of the effects at system level can be automatically derived. This will allow identifying the most critical malfunctions of the components of the system.
3. The second step is then, for most critical malfunctions, to define safety mechanism that will eradicate or mitigate the malfunction propagation. Safety mechanisms can be either internal to the considered component, meaning that the component controls its own internal malfunctions or external, meaning that malfunctions from one component are controlled by another component. These safety mechanisms will be then refined in safety requirements.
4. Third step is then to analyze the new effect of the critical component malfunction at system level with safety mechanism
5. Having assessed the new system effect, then the criticality of the new effect at system level with safety mechanism will be automatically derived. This will allow identifying critical malfunctions for which other safety mechanisms are still needed.
As already mentioned in the Note of chapter 6.5.1.5 for system effects that are not safety related (severity = S0) but very annoying for the driver because availability problem, it can be relevant to assess the severity with the classical FMEA scale (1 to 8).

SAFE – an ITEA2 project D331b
2013 The SAFE Consortium 18 (80)
The analysis has to be done in all relevant life phases. Car assembly, long term parking as well as decommissioning may be relevant life phases. The always relevant life phase is of course the “use” phase. In the “use” life phase, the different operation modes such as parking, ignition on, engine running, and vehicle running … have to be considered. Relevant life phases and vehicle situations are at least those identified in the hazard and risk analysis. Some life phases and operation modes may be regrouped in a single analysis. The criterion for grouping in a single analysis different life phases and vehicle situations is when the functions and therefore the functional architecture are the same in the different life phase and operational modes.
6.5.1.7 Qualitative SFMEA: Output
The main outputs are the list of component critical malfunctions, with their corresponding effect (top level system malfunction) and potentially with the safety mechanism (internal or external to the components) to be implemented.
Also during SFMEA analysis, it is possible to identified new top level system malfunctions that were not considered in hazard and risk analysis. In this case they must be provided to people in charge of hazard and risk analysis for impact analysis.
6.5.1.8 Qualitative SFMEA: Illustration via our example
In our example, we only focus on the Top Column Module (TCM) ECU Component to keep it simple.
TCM_ECU main functionality TCM_F1 is to:
Send lighting command OFF on the CAN bus when the front lighting switch is in OFF position,
Send lighting command PARKING LIGHT ON on the can bus when the front lighting switch is in parking light position,
Send lighting command LOWBEAM ON on the CAN bus when the front lighting switch is in low beam position.
Top Column Module_ECU
(TCM_ECU)
CAN Bus
Switch
Body Control
Management _ECU
(BCM_ECU)
Lighting System
Light Module 01
Light Module 02

SAFE – an ITEA2 project D331b
2013 The SAFE Consortium 19 (80)
The results of the qualitative SFMEA can be showed in the table hereafter: STEP 1 STEP 2 STEP 3
Component Function Potential
Malfunction
system effect
without safety
mechanism
Severity or Criticality Without Safety
mechanism
Safety mechanism
system effect with
safety mechanism
Severity or Criticality
With Safety
mechanism
TCM TCM_F1
MF1001: No lighting command sent on
the CAN bus by the TCM_ECU
MF02: No low beam
when required
Severity = 8
SM01 :If BCM receives no lighting command on the CAN bus from TCM, BCM switches LOW BEAM ON when ignition
switch is ON
MF03: Low beams
always ON
Severity = 4
MF1002: Invalid lighting command
sent on the CAN bus by the TCM_ECU
MF02: No low beam
when required
Severity = 8
SM02 : If BCM receives an INVALID command on the CAN bus from TCM, BCM switches LOW BEAM ON when ignition switch is ON
MF03: Low beams
always ON
Severity = 4
MF1003 : Lighting command on the
CAN bus erroneously
switches from LOWBEAM ON to
another valid position (OFF or PARKING LIGHT
ON) by the TCM_ECU
MF01: Loss of the low beams
ASIL B
SM03: If internal failure detected by TCM, TCM put
lighting command at INVALID on the CAN bus &. SM02 : If BCM receives an INVALID command on the CAN bus from TCM, BCM switches
LOW BEAM ON when ignition switch is ON
MF03: Low beams
always ON
Severity = 4
MF1004: Lighting command on the
CAN bus always put at OFF by the
TCM_ECU
MF02: No low beam
when required
Severity = 8
SM03: If internal failure detected by TCM, TCM put
lighting command at INVALID on the CAN bus &. SM02 : If BCM receives an INVALID command on the CAN bus from TCM, BCM switches
LOW BEAM ON when ignition switch is ON
MF03: Low beams
always ON
Severity = 4
MF1005: Lighting command on the
CAN bus always put at PARKING LIGHT
ON by the TCM_ECU
MF02: No low beam
when required
Severity = 8
SM03: If internal failure detected by TCM, TCM put
lighting command at INVALID on the CAN bus &. SM02 : If BCM receives an INVALID command on the CAN bus from TCM, BCM switches
LOW BEAM ON when ignition switch is ON
MF03: Low beams
always ON
Severity = 4
MF1006 : Low beam CAN parameter put always at ON value by the TCM_ECU
MF03: Low beams
always ON
Severity = 4
Table 3 : Example of partial SFMEA performed on our use case Here is a typical example where also not safety relevant malfunctions were considered. In the SFMEA table it is clearly identified that if the TCM_ECU erroneously switch the light command from LOWBEAM ON to another valid position [MF1003], without safety mechanism, it will lead directly to the violation of the safety goal SG01 which is ASIL B. An internal safety mechanism [SM003] must be implemented in the TCM_ECU, to detect internal failure that could lead to [MF1003] and send an INVALID command on the CAN bus (reaction). An external safety mechanism [SM002] must be implemented in the BCM_ECU to switch to the safe state (LOW BEAM ON) when an INVALID command is received on the CAN bus. Note: As components are here considered as black boxes we do not investigate the potential failure causes as seen in classical FMEA [5].
SAFE – an ITEA2 project D331b
2013 The SAFE Consortium 20 (80)
6.5.2 STEP 1B: Perform Qualitative System FTA [ASIL dependent] [System Safety Analysis] [Design Phase]
6.5.2.1 Qualitative System FTA: Application Rules
Qualitative system FTA is required for ASIL C and ASIL D safety goals and recommended for ASIL B safety goals.
6.5.2.2 Qualitative System FTA: Main Purpose
System FTA is a deductive analysis method that is complementary to system FMEA (inductive analysis) and therefore components will be also considered as black boxes. Its main purpose is to start from top level system malfunctions that can violate a safety goal (the top event) and analyze all possible component malfunctions or combination of component malfunctions (the causes) that can lead to the top event. System FTA allows defining safety mechanisms at the right place in the system, to detect and mitigate a component malfunction. Therefore additionally to system FMEA, system FTA helps to evaluate and consolidate the Functional Safety Concept (FSC) using a second analysis method.
6.5.2.3 Qualitative System FTA: Standards applicable
FTA is a common practice for many years in lots of industry domains. Therefore in this deliverable only the main principles will be given. If you want more detailed about how to build an FTA please refer to the following standards:
IEC 61025 (International Standard dedicated to Fault Tree Analysis) [4]
NUREG-0492 (Fault Tree Handbook from US Nuclear Regulatory Commission) [8]
6.5.2.4 Qualitative System FTA: Input
The following inputs are necessary to perform qualitative System FTA:
The model describing the functional architecture (also called logical) and its physical implementation of the system. The description of functional and physical architecture may be a block diagram showing the atomic components of the system, their inputs and outputs and the interconnections between the components. The description of the functional architecture must describe the behavior of the system functions and their split-up into sub-functions. An allocation of the sub-functions onto the physical components of the architecture is necessary as well.
The list of safety goal with their criticality.

SAFE – an ITEA2 project D331b
2013 The SAFE Consortium 21 (80)
6.5.2.5 Qualitative System FTA: Main Principles
Qualitative system FTA is a graphical representation technique that permits to analyze causes as well as combination of causes of a top event. The result is displayed results in a hierarchical tree-like structure. This kind of analysis is generally supported by a specialized tool. A top event is generally a top level system malfunctions leading to the violation of a given safety goal. Therefore there is one qualitative system FTA per considered safety goal. Qualitative system FTA starts from the top event and analyses all necessary pre-conditions that could cause the top event to occur. These conditions can be combined in any number of ways using logical gates (OR, AND, etc...). Events in a qualitative system FTA are expanded until component malfunctions appear.
If an event is repeated several times in several branches of a system FTA (common causes), same event identification has to be used otherwise it is considered by the FTA tool as another independent event. Qualitative system FTA can be used to determine if a top level system malfunction would occur, but also be used to prevent the occurrence of the top level system malfunction by inserting a safety mechanism that mitigates the local component malfunction. Boolean logic is then used to reduce the system FTA structure into combinations of events leading to the top event, generally referred as Minimal Cut Sets (MCS).
6.5.2.6 Qualitative System FTA: Output
For each safety goal considered, the main outputs are:
The list of the causes (component malfunctions) or combinations of causes (component malfunctions) than can lead to the violation of the considered safety goal.
The possible common cause failures that would then feed the complete list.
The description and position of safety mechanisms with regard to each related component malfunction.
SAFE – an ITEA2 project D331b
2013 The SAFE Consortium 22 (80)
6.5.2.7 Qualitative System FTA: Illustration via our example
In our lighting system, all components are in serial configuration and therefore the system FTA have only minimal cut sets of order 1 as non Electrical or/and Electronic (E/E) components such as light modules or switch are not considered.
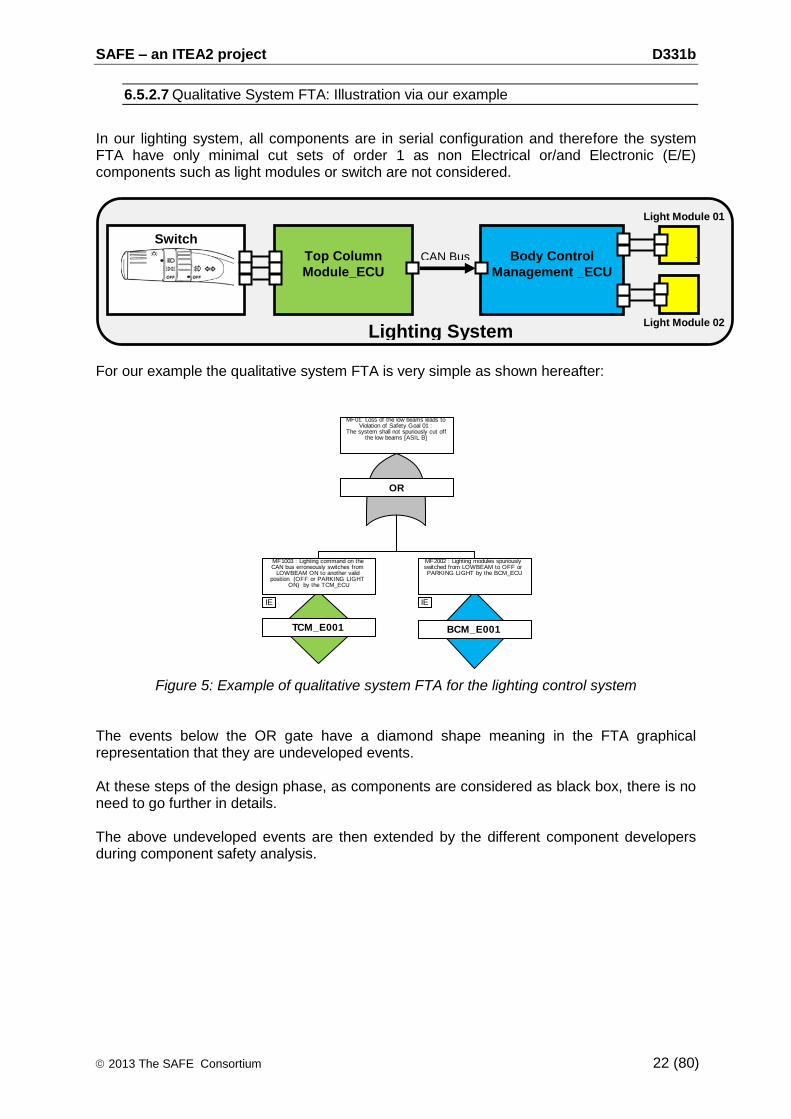
For our example the qualitative system FTA is very simple as shown hereafter:
Figure 5: Example of qualitative system FTA for the lighting control system
The events below the OR gate have a diamond shape meaning in the FTA graphical representation that they are undeveloped events. At these steps of the design phase, as components are considered as black box, there is no need to go further in details. The above undeveloped events are then extended by the different component developers during component safety analysis.
IE
TCM_E001
MF1003 : Lighting command on the CAN bus erroneously switches from
LOWBEAM ON to another valid position (OFF or PARKING LIGHT
ON) by the TCM_ECU
BCM_E001
MF2002 : Lighting modules spuriously switched from LOWBEAM to OFF or PARKING LIGHT by the BCM_ECU
IE
OR
MF01: Loss of the low beams leads to Violation of Safety Goal 01 :
The system shall not spuriously cut off the low beams [ASIL B]
Top Column
Module_ECU
CAN Bus
Switch
Body Control
Management _ECU
Lighting System
Light Module 01
Light Module 02
SAFE – an ITEA2 project D331b
2013 The SAFE Consortium 23 (80)
6.5.3 STEP 1C: Perform Quantitative System FTA for residual risk allocation [ASIL dependent] [System Safety Analysis] [Design Phase]
6.5.3.1 Quantitative System FTA: Application Rules
As for qualitative system FTA, quantitative system FTA is required for ASIL C and ASIL D safety goals and recommended for ASIL B safety goals.
6.5.3.2 Quantitative System FTA: Main Purpose
At this step of the development phase, the main purpose of quantitative system FTA is to derive the residual risk target defined for each considered safety goal for each relevant electronics component. It is particularly useful for distributed developments.
6.5.3.3 Quantitative System FTA: Standards applicable
The same standard as those recommended for qualitative system FTA can be used for quantitative system FTA. See chapter 6.5.3.3. In addition the SAE ARP4761 [9] standard from aeronautic field describes best practices of residual risk target allocation.
6.5.3.4 Quantitative System FTA: Input
The main input for quantitative system FTA, in context of residual risk definition and decomposition, is the qualitative system FTA.
6.5.3.5 Quantitative System FTA: Main Principle
Quantitative system FTA is an extension of qualitative system FTA.
1. The first step is to define the residual risk target for each considered safety goal. This value will be also the target to be reached for the top level event of the FTA.
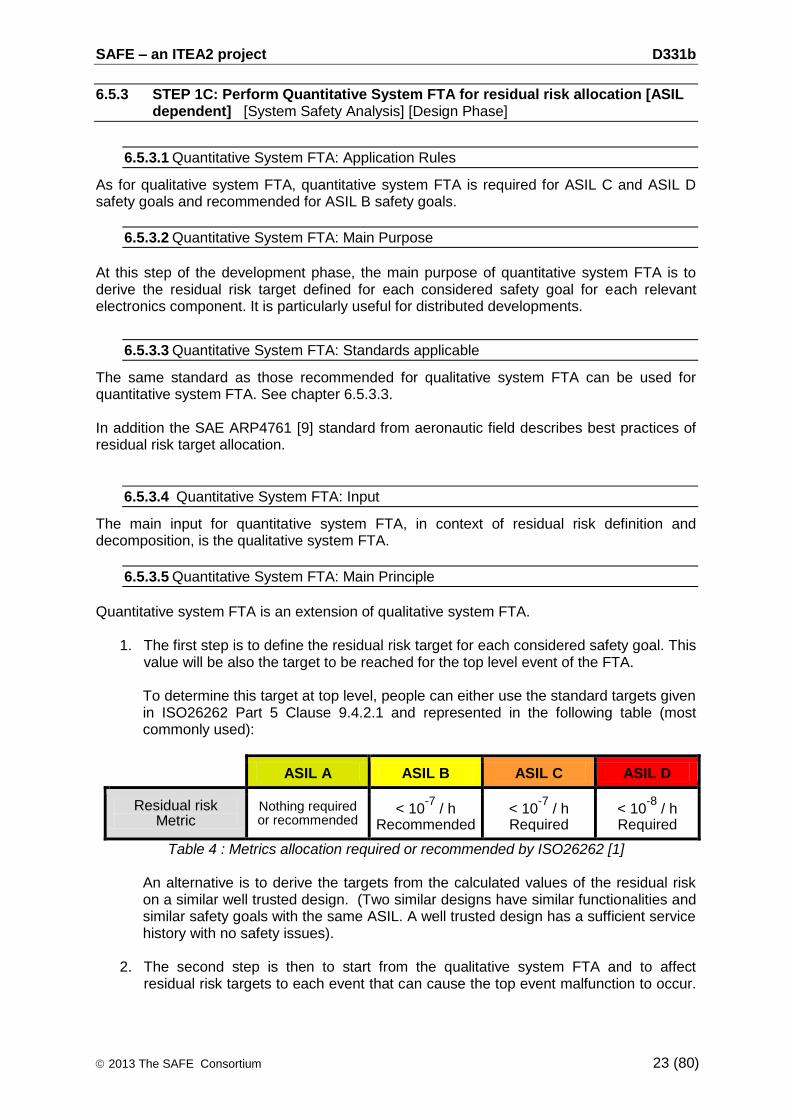
To determine this target at top level, people can either use the standard targets given in ISO26262 Part 5 Clause 9.4.2.1 and represented in the following table (most commonly used):
ASIL A ASIL B ASIL C ASIL D
Residual risk Metric
Nothing required or recommended
< 10-7
/ h Recommended
< 10-7
/ h Required
< 10-8
/ h Required
Table 4 : Metrics allocation required or recommended by ISO26262 [1]
An alternative is to derive the targets from the calculated values of the residual risk on a similar well trusted design. (Two similar designs have similar functionalities and similar safety goals with the same ASIL. A well trusted design has a sufficient service history with no safety issues).
2. The second step is then to start from the qualitative system FTA and to affect residual risk targets to each event that can cause the top event malfunction to occur.
SAFE – an ITEA2 project D331b
2013 The SAFE Consortium 24 (80)
It is strongly recommended to start with events that are minimal cut set of order 1, meaning that they can cause directly the top event to occur.
3. A simple rule to allocate residual risks target to events of minimum cut sets of order 1 can be to divide the value defined for the top event by the total number of minimal cut sets of order. Therefore the same residual risk target will be distributed uniformly to each event that is minimum cut sets of order 1. This allocation is not mandatory as we could imagine others distributions for components reused from well known physical architecture. The decision shall be taken case by case, no standard rule are provided here because this subject is context dependant and not simple.
Note: For events that are minimum cut sets of order 2, meaning that 2 independent events must be combined in order that the top event occurs, the allocation of residual risk target is also not so easy. On one hand, if we focus only on safety issues, residual risk target of each event can be much lower than the target recommended by the ISO26262 (see Table 4) as final probability of failure of both events is then combined. It shall be noticed that the independence of the two events shall be ensured latter during the component design. But on the other hand, if a too high residual risk target is allowed for each event, it might lead to a high probability of unavailability. This means that during vehicle life (often 15 years) a function of the system has a high probability of not being available for the driver, or that the system has high probability of being switched in a degraded state. These 2 situations are not safety related but very annoying for the driver. Therefore in this particular case, it is highly recommended to do the allocation in closed collaboration with people from the Quality Management.
6.5.3.6 Quantitative System FTA: Output
Non functional safety requirements such as independence required between component malfunctions or a quantitative target for a certain component malfunction.
SAFE – an ITEA2 project D331b
2013 The SAFE Consortium 25 (80)
6.5.3.7 Quantitative System FTA: Illustration via our example
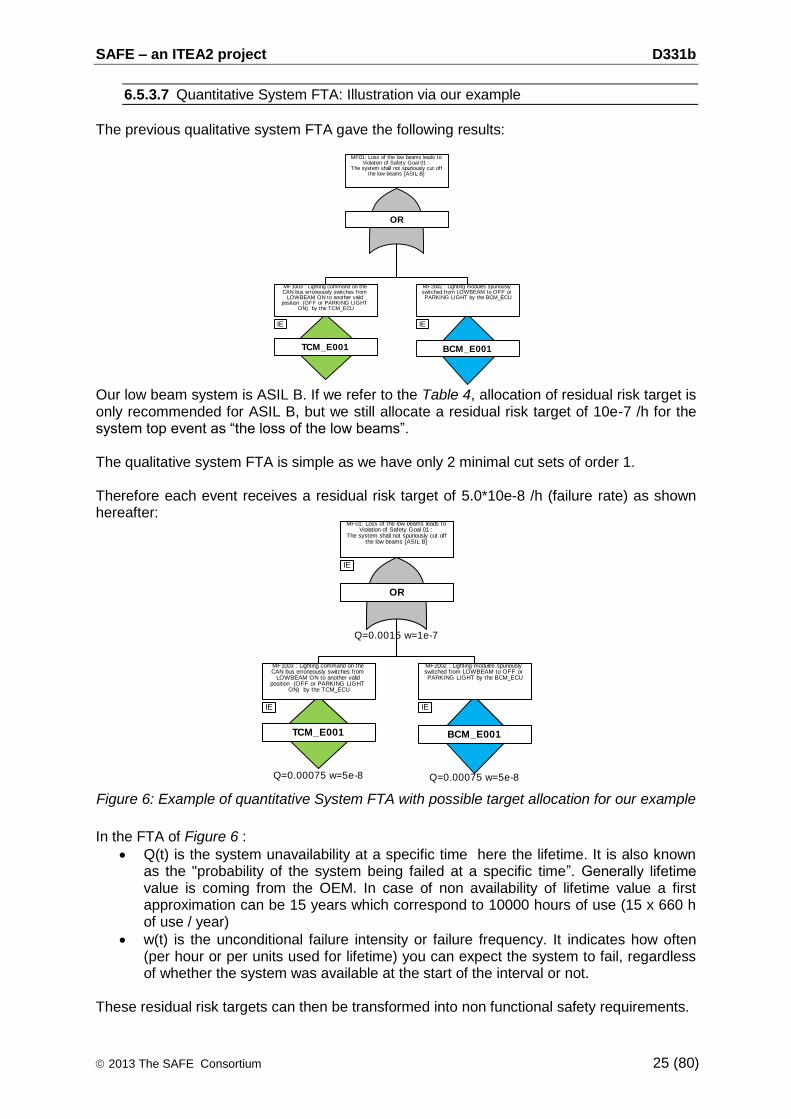
The previous qualitative system FTA gave the following results:
Our low beam system is ASIL B. If we refer to the Table 4, allocation of residual risk target is only recommended for ASIL B, but we still allocate a residual risk target of 10e-7 /h for the system top event as “the loss of the low beams”. The qualitative system FTA is simple as we have only 2 minimal cut sets of order 1. Therefore each event receives a residual risk target of 5.0*10e-8 /h (failure rate) as shown hereafter:
Figure 6: Example of quantitative System FTA with possible target allocation for our example
In the FTA of Figure 6 :
Q(t) is the system unavailability at a specific time here the lifetime. It is also known as the "probability of the system being failed at a specific time”. Generally lifetime value is coming from the OEM. In case of non availability of lifetime value a first approximation can be 15 years which correspond to 10000 hours of use (15 x 660 h of use / year)
w(t) is the unconditional failure intensity or failure frequency. It indicates how often (per hour or per units used for lifetime) you can expect the system to fail, regardless of whether the system was available at the start of the interval or not.
These residual risk targets can then be transformed into non functional safety requirements.
IE
TCM_E001
MF1003 : Lighting command on the CAN bus erroneously switches from
LOWBEAM ON to another valid position (OFF or PARKING LIGHT
ON) by the TCM_ECU
BCM_E001
MF2002 : Lighting modules spuriously switched from LOWBEAM to OFF or PARKING LIGHT by the BCM_ECU
IE
OR
MF01: Loss of the low beams leads to Violation of Safety Goal 01 :
The system shall not spuriously cut off the low beams [ASIL B]
IE
Q=0.00075 w=5e-8
TCM_E001
MF1003 : Lighting command on the CAN bus erroneously switches from
LOWBEAM ON to another valid position (OFF or PARKING LIGHT
ON) by the TCM_ECU
Q=0.00075 w=5e-8
BCM_E001
MF2002 : Lighting modules spuriously switched from LOWBEAM to OFF or PARKING LIGHT by the BCM_ECU
IE
Q=0.0015 w=1e-7
OR
MF01: Loss of the low beams leads to Violation of Safety Goal 01 :
The system shall not spuriously cut off the low beams [ASIL B]
IE

SAFE – an ITEA2 project D331b
2013 The SAFE Consortium 26 (80)
6.5.4 STEP 1D: Allocate HW Architectural Metrics to components (Optional) [System Safety Analysis] [Design Phase]
6.5.4.1 HW Architectural Metrics Allocation: Application Rules
HW architectural metrics allocation is required for ASIL C and ASIL D safety goals and recommended for ASIL B safety goals.
6.5.4.2 HW Architectural Metrics Allocation: Main Purpose
At this step of the development phase, the main purpose of this analysis is to derive the HW architectural metrics that has been defined for each considered safety goal to each relevant electronics component. It is particularly useful for distributed developments. HW architectural metrics concern single-point fault metric (SPFM) and latent-point fault metric (LFM). They only address random HW failure and not systematic failures.
6.5.4.3 HW Architectural Metrics Allocation: Standards applicable
Unfortunately, there are neither standard nor rule that describes the allocation of HW architectural metrics automatically.
6.5.4.4 HW Architectural Metrics Allocation: Input
The main inputs are:
The model describing the functional architecture (also called logical) and its physical implementation of the system. The description of functional and physical architecture may be a block diagram showing the components of the system, their inputs and outputs and the interconnections between the components. The description of the functional architecture must describe the behavior of the system functions and their split-up into sub-functions. An allocation of the sub-functions onto the physical components of the architecture is necessary as well.
List of safety goals with their criticality.
SFMEA results
Qualitative/quantitative system FTA results
6.5.4.5 HW Architectural Metrics Allocation: Main Principle
1. The first step is to define the HW architectural metrics target at the top level for each considered safety goal. As for residual risk allocation, people in charge of the allocation can either use the standard targets given in ISO26262 [1] and showed in the following table (most commonly used) :
ASIL A ASIL B ASIL C ASIL D
Single Point Fault Metric (SPFM)
Nothing required or recommended
≥ 90% Recommended
≥ 97% Required
≥ 99% Required
Latent Fault Metric (LFM)
Nothing required or recommended
≥ 60% Recommended
≥ 80% Recommended
≥ 90% Required
Table 5 : HW Architectural Metrics allocation required or recommended by ISO26262 [1]
An alternative is to derive the targets from the calculated values of the residual risk on a similar well trusted design. (Two similar designs have similar functionalities and
SAFE – an ITEA2 project D331b
2013 The SAFE Consortium 27 (80)
similar safety goals with the same ASIL. A well trusted design has a sufficient service history with no safety issues).
2. The second step is strongly linked to the physical architecture and where safety
mechanisms are implemented (internal or external).
Therefore in this chapter we will only provide only examples and not standard rules to be applied:
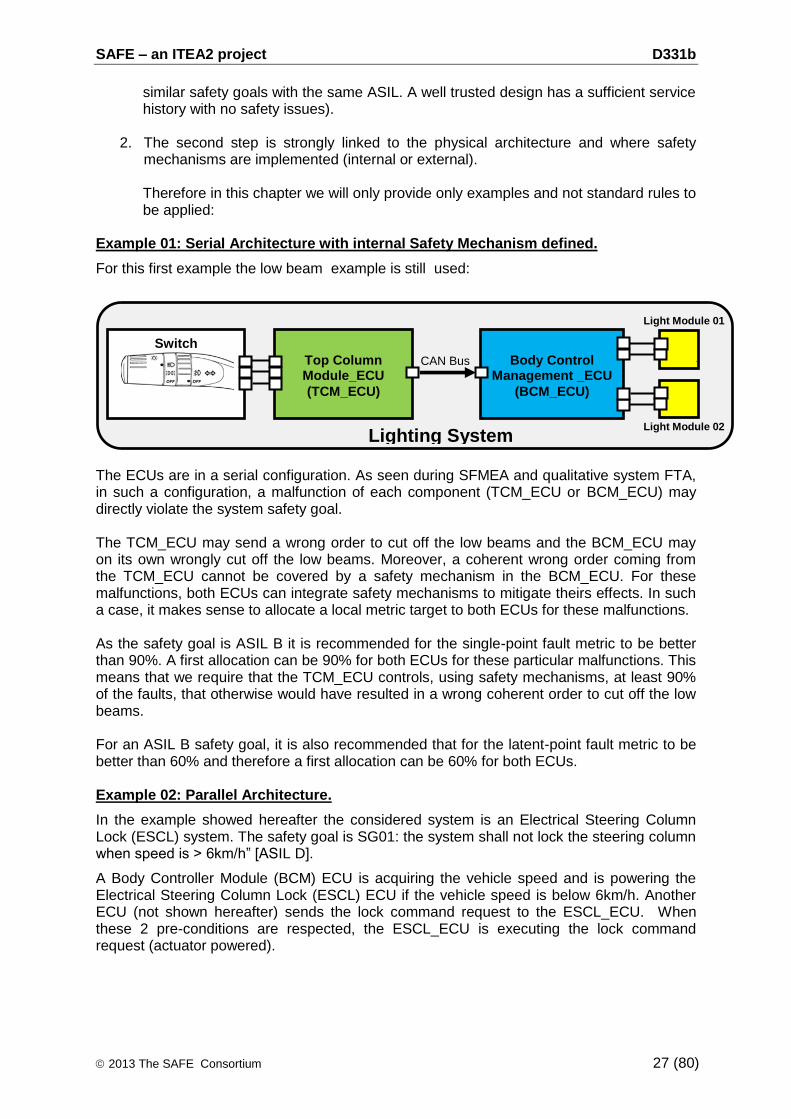
Example 01: Serial Architecture with internal Safety Mechanism defined.
For this first example the low beam example is still used:
The ECUs are in a serial configuration. As seen during SFMEA and qualitative system FTA, in such a configuration, a malfunction of each component (TCM_ECU or BCM_ECU) may directly violate the system safety goal. The TCM_ECU may send a wrong order to cut off the low beams and the BCM_ECU may on its own wrongly cut off the low beams. Moreover, a coherent wrong order coming from the TCM_ECU cannot be covered by a safety mechanism in the BCM_ECU. For these malfunctions, both ECUs can integrate safety mechanisms to mitigate theirs effects. In such a case, it makes sense to allocate a local metric target to both ECUs for these malfunctions. As the safety goal is ASIL B it is recommended for the single-point fault metric to be better than 90%. A first allocation can be 90% for both ECUs for these particular malfunctions. This means that we require that the TCM_ECU controls, using safety mechanisms, at least 90% of the faults, that otherwise would have resulted in a wrong coherent order to cut off the low beams. For an ASIL B safety goal, it is also recommended that for the latent-point fault metric to be better than 60% and therefore a first allocation can be 60% for both ECUs. Example 02: Parallel Architecture.
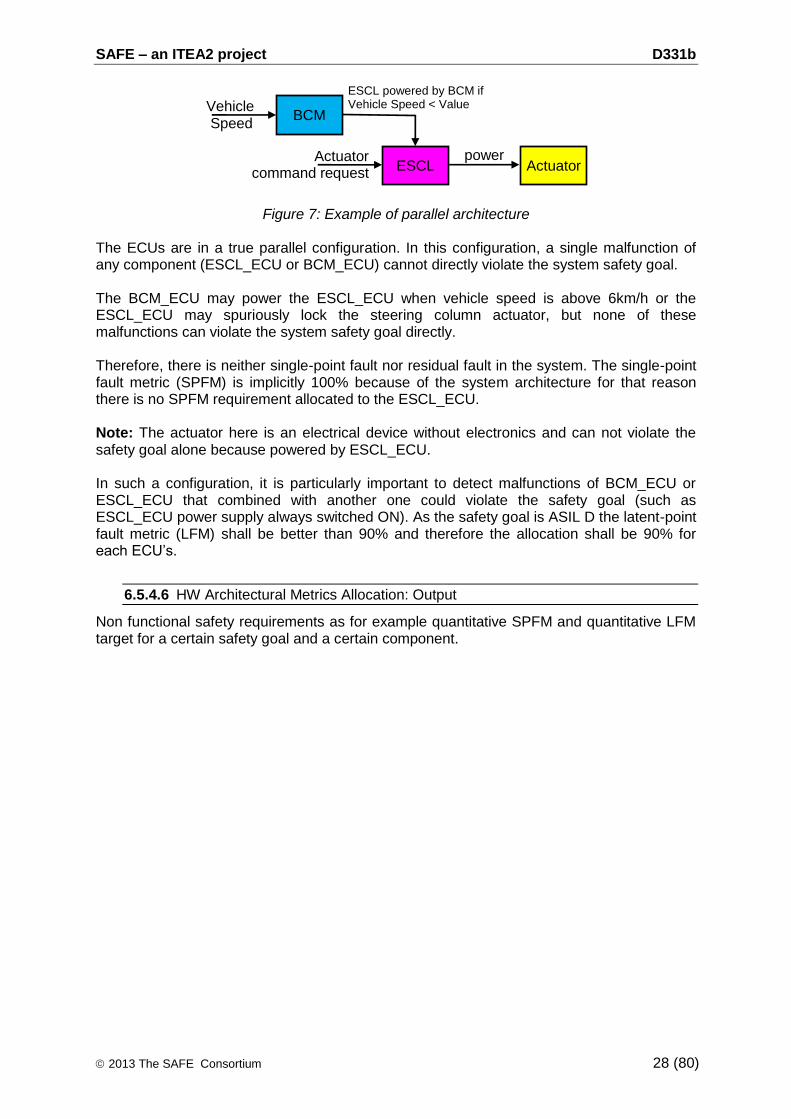
In the example showed hereafter the considered system is an Electrical Steering Column Lock (ESCL) system. The safety goal is SG01: the system shall not lock the steering column when speed is > 6km/h” [ASIL D].
A Body Controller Module (BCM) ECU is acquiring the vehicle speed and is powering the Electrical Steering Column Lock (ESCL) ECU if the vehicle speed is below 6km/h. Another ECU (not shown hereafter) sends the lock command request to the ESCL_ECU. When these 2 pre-conditions are respected, the ESCL_ECU is executing the lock command request (actuator powered).
Top Column Module_ECU
(TCM_ECU)
CAN Bus
Switch
Body Control
Management _ECU
(BCM_ECU)
Lighting System
Light Module 01
Light Module 02
SAFE – an ITEA2 project D331b
2013 The SAFE Consortium 28 (80)
Figure 7: Example of parallel architecture The ECUs are in a true parallel configuration. In this configuration, a single malfunction of any component (ESCL_ECU or BCM_ECU) cannot directly violate the system safety goal. The BCM_ECU may power the ESCL_ECU when vehicle speed is above 6km/h or the ESCL_ECU may spuriously lock the steering column actuator, but none of these malfunctions can violate the system safety goal directly. Therefore, there is neither single-point fault nor residual fault in the system. The single-point fault metric (SPFM) is implicitly 100% because of the system architecture for that reason there is no SPFM requirement allocated to the ESCL_ECU. Note: The actuator here is an electrical device without electronics and can not violate the safety goal alone because powered by ESCL_ECU. In such a configuration, it is particularly important to detect malfunctions of BCM_ECU or ESCL_ECU that combined with another one could violate the safety goal (such as ESCL_ECU power supply always switched ON). As the safety goal is ASIL D the latent-point fault metric (LFM) shall be better than 90% and therefore the allocation shall be 90% for each ECU’s.
6.5.4.6 HW Architectural Metrics Allocation: Output
Non functional safety requirements as for example quantitative SPFM and quantitative LFM target for a certain safety goal and a certain component.
BCM
ESCL
Vehicle Speed
Actuator Actuator
command request
power
ESCL powered by BCM if Vehicle Speed < Value
SAFE – an ITEA2 project D331b
2013 The SAFE Consortium 29 (80)
6.6 Component Safety Analyzes: Design Phase
6.6.1 STEP 2A: Perform Qualitative Component FMEDA [Mandatory] [Component Safety Analysis] [Design Phase]
6.6.1.1 Qualitative Component FMEDA: Application Rules
Qualitative FMEDA is mandatory for safety-related systems (system with at least a safety goal with an ASIL).
6.6.1.2 Qualitative Component FMEDA: Introduction
Classical FMEA methods that are practiced for decades in many industries are very often dealing with fault avoidance [5]. A barrier is implemented to stop the fault consequence. This approach can be kept for systematic faults. Therefore fault tolerance (control of propagation of causes to avoid critical failures, using safety mechanisms) as requested by ISO26262 [1] is not covered by the classical FMEA methods.
In the VDA standard [4] qualitative FMEDA is equivalent to a Product FMEA at sub-system Level. Also a new Mechatronic FMEA has been introduced in order be able to cover fault tolerance and have a clear visualization of the mitigation effect. As the VDA approach is only covered by some tools from the market here in this chapter we propose a possible alternative that is used by Valeo. Moreover later in the document some requirements are addressed to the different tools from the market in order to be able to perform this new method (see chapter 8.3).
6.6.1.3 Qualitative Component FMEDA: Main Purpose
Qualitative FMEDA is the equivalent of SFMEA at component level. Qualitative FMEDA is an evidence for sufficient fault tolerance when no quantitative FMEDA is performed. Therefore it is also supporting the evaluation and the consolidation of the Technical Safety Concept. Its principle is to identify the critical malfunctions of the HW functional blocks of the component and the way they propagate to cause the component malfunctions identified in the SFMEA. Therefore it allows defining adequate safety mechanisms at component level.
6.6.1.4 Qualitative Component FMEDA: Standards applicable
FMEA is a common practice for many years in lots of industry domains. Nevertheless even if there is many standards available like [5][6], all are addressing fault avoidance and not fault tolerance. For fault tolerance the only standard to which we can refer is the VDA[4] and more particularly its chapter 2.1 on Mechatronic FMEA.
6.6.1.5 Qualitative Component FMEDA: Input
The following inputs are necessary to perform qualitative FMEDA:
The model describing the functional and physical architectures of the considered component. The description of physical architecture as a block diagram showing the atomic functional blocks (HW blocks) of the component, their inputs and outputs and the interconnections between the functional blocks. The description of the functional architecture must describe the behavior of the component functions and also their split-up into sub-functions. An allocation of the sub-functions to the HW blocks is necessary as well. At this stage functional blocks are supported by HW but we do not know yet how they are realized (could be a mixed of HW/SW).
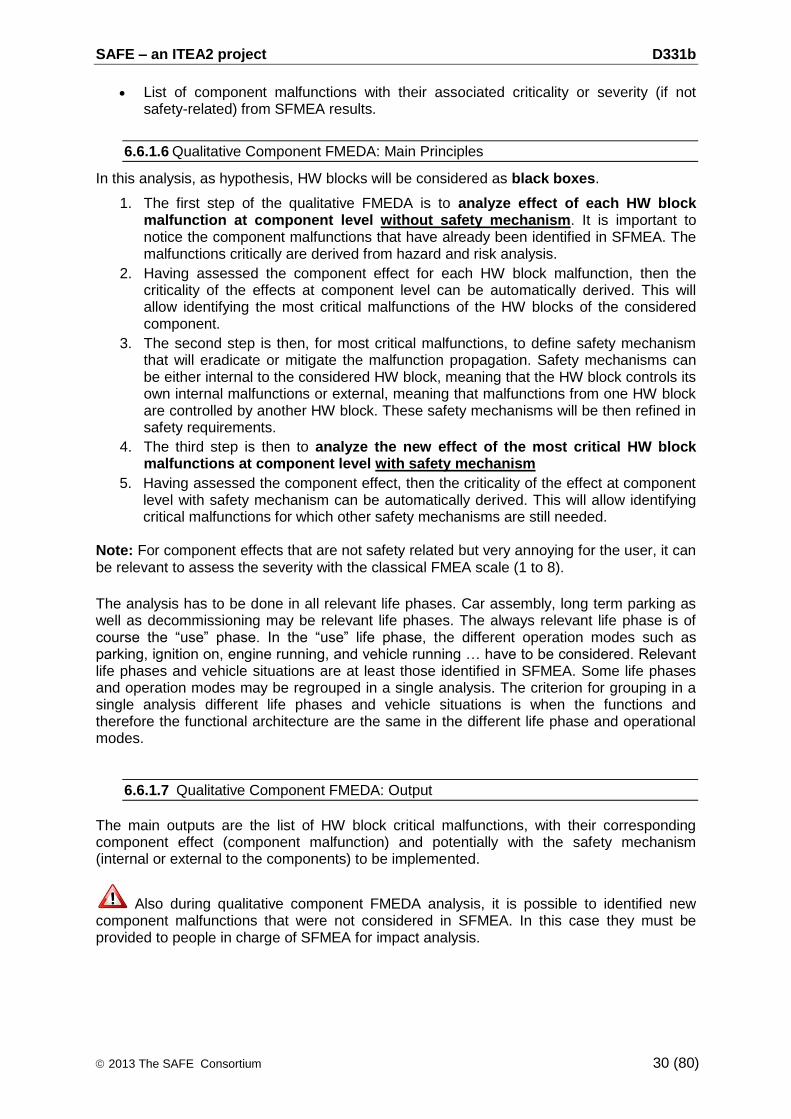
SAFE – an ITEA2 project D331b
2013 The SAFE Consortium 30 (80)
List of component malfunctions with their associated criticality or severity (if not safety-related) from SFMEA results.
6.6.1.6 Qualitative Component FMEDA: Main Principles
In this analysis, as hypothesis, HW blocks will be considered as black boxes.
1. The first step of the qualitative FMEDA is to analyze effect of each HW block malfunction at component level without safety mechanism. It is important to notice the component malfunctions that have already been identified in SFMEA. The malfunctions critically are derived from hazard and risk analysis.
2. Having assessed the component effect for each HW block malfunction, then the criticality of the effects at component level can be automatically derived. This will allow identifying the most critical malfunctions of the HW blocks of the considered component.
3. The second step is then, for most critical malfunctions, to define safety mechanism that will eradicate or mitigate the malfunction propagation. Safety mechanisms can be either internal to the considered HW block, meaning that the HW block controls its own internal malfunctions or external, meaning that malfunctions from one HW block are controlled by another HW block. These safety mechanisms will be then refined in safety requirements.
4. The third step is then to analyze the new effect of the most critical HW block malfunctions at component level with safety mechanism
5. Having assessed the component effect, then the criticality of the effect at component level with safety mechanism can be automatically derived. This will allow identifying critical malfunctions for which other safety mechanisms are still needed.
Note: For component effects that are not safety related but very annoying for the user, it can be relevant to assess the severity with the classical FMEA scale (1 to 8).
The analysis has to be done in all relevant life phases. Car assembly, long term parking as well as decommissioning may be relevant life phases. The always relevant life phase is of course the “use” phase. In the “use” life phase, the different operation modes such as parking, ignition on, engine running, and vehicle running … have to be considered. Relevant life phases and vehicle situations are at least those identified in SFMEA. Some life phases and operation modes may be regrouped in a single analysis. The criterion for grouping in a single analysis different life phases and vehicle situations is when the functions and therefore the functional architecture are the same in the different life phase and operational modes.
6.6.1.7 Qualitative Component FMEDA: Output
The main outputs are the list of HW block critical malfunctions, with their corresponding component effect (component malfunction) and potentially with the safety mechanism (internal or external to the components) to be implemented.
Also during qualitative component FMEDA analysis, it is possible to identified new component malfunctions that were not considered in SFMEA. In this case they must be provided to people in charge of SFMEA for impact analysis.
SAFE – an ITEA2 project D331b
2013 The SAFE Consortium 31 (80)
Watchdog
Power Supply µC
Analog Input
Digital Output Reset
CAN Output
CAN Driver
CAN Message with Light command
5V
Battery
Top Column Module_ECU
Analog Interface
Switch
OFF
Parking light
Low beam
6.6.1.8 Qualitative Component FMEDA: Illustration via our example
In our example we focus on Top Column Module (TCM) ECU component architecture which is mapped onto HW blocks. Each HW block is a functional block. Standard safety mechanisms such as watchdog are already included in the functional architecture. Others would be introduced during qualitative component FMEDA.
Figure 8: Example of physical architecture description for the Top Column Module
For the illustration of the qualitative component FMEDA, only the analog interface HW block is considered.
The main functionality of this HW block is to provide 3 analog values (corresponding to OFF or Parking light ON or Low Beam ON lighting switch position) to the microcontroller.
Top Column Module_ECU
(TCM_ECU)
CAN Bus
Switch
Body Control
Management _ECU
(BCM_ECU)
Lighting System
Light Module 01
Light Module 02

SAFE – an ITEA2 project D331b
2013 The SAFE Consortium 32 (80)
The proposed qualitative FMEDA considering only the analog interface is the following:
STEP 1 STEP 2 STEP 3
Block Function Potential
Block Malfunction
Component effect without safety
mechanism
Severity or Criticality Without Safety
mechanism
Safety mechanism
Component effect with
safety mechanism
Severity or Criticality
With Safety
mechanism
Analog Interface
Provide 3 analog values
(corresponding to OFF or
Parking light ON or Low Beam ON lighting
switch position) to the
microcontroller.
MF501 : Wrong
output value provided:
out of range
MF1003 : Lighting command on the CAN bus erroneously switches from LOWBEAM ON to another
valid position (OFF or PARKING LIGHT ON) by
the TCM_ECU
ASIL B
SM05: Detection of out of range
values by the µC. CAN light command put at INVALID
MF1002: Invalid lighting command sent
on the CAN bus by the TCM_ECU
Severity = 8
MF502 :Wrong
output value provided:
OFF instead of Low
Beam ON
MF1003 : Lighting command on the CAN bus erroneously switches from LOWBEAM ON to another
valid position (OFF or PARKING LIGHT ON) by
the TCM_ECU
ASIL B Not Detectable
MF503 : Wrong
output value provided:
Parking light ON instead
of Low Beam ON
MF1003 : Lighting command on the CAN bus erroneously switches from LOWBEAM ON to another
valid position (OFF or PARKING LIGHT ON) by
the TCM_ECU
ASIL B Not Detectable
MF504 : Wrong
output value provided:
Low Beam ON instead
of OFF
MF1006 : Low beam CAN parameter put always at
ON value by the TCM_ECU
Severity = 4
MF504 : Wrong
output value provided:
Low Beam ON instead of Parking light ON
MF1006 : Low beam CAN parameter put always at
ON value by the TCM_ECU
Severity = 4
Table 6 : Example of partial qualitative FMEDA performed on our use case Note: Here in the Table 6 the safety mechanism SM05 would then be refined in HWSR (Hardware Safety Requirement) and SWSR (Software Safety Requirement) in the Technical Safety Concept.

SAFE – an ITEA2 project D331b
2013 The SAFE Consortium 33 (80)
6.6.2 STEP 2B: Perform Qualitative Component FTA [Optional] [Component Safety Analysis] [Design Phase]
6.6.2.1 Qualitative Component FTA: Application Rules
Qualitative component FTA is required for ASIL C and ASIL D safety goals and recommended for ASIL B safety goals.
6.6.2.2 Qualitative Component FTA: Main Purpose
Qualitative component FTA is a deductive analysis method that is complementary to qualitative FMEDA (inductive analysis) and therefore HW blocks will be also considered as black boxes. Its main purpose is to start from the critical component malfunctions that were identified during system design (top event) and analyze all possible HW block malfunctions or combination of HW block malfunctions (the causes) that can lead to the top event. Qualitative component FTA allows defining safety mechanisms, to detect and mitigate a HW block malfunction in the considered component. Therefore additionally to qualitative FMEDA, qualitative component FTA helps to evaluate and consolidate the Technical Safety Concept.
6.6.2.3 Qualitative Component FTA: Standards applicable
FTA is a common practice for many years in lots of industry domains. Therefore in this deliverable only the main principles will be given. If you want more detailed about how to build an FTA please refer to the following standards:
IEC 61025 (International Standard dedicated to Fault Tree Analysis) [4]
NUREG-0492 (Fault Tree Handbook from US Nuclear Regulatory Commission) [8]
6.6.2.4 Qualitative Component FTA: Input
The following inputs are necessary to perform qualitative component FTA:
The model describing the functional and physical architectures of the considered component. The description of physical architecture as a block diagram showing the atomic functional blocks of the component (HW blocks), their inputs and outputs and the interconnections between the functional blocks. The description of the functional architecture must describe the behavior of the component functions and potentially also their split-up into sub-functions. An allocation of the sub-functions to the HW blocks is necessary as well. At this stage functional blocks are supported by HW but we do not know yet how they are realized (could be a mixed of HW/SW).
The list of component malfunctions with their criticality.
6.6.2.5 Qualitative Component FTA: Main Principles
Qualitative component FTA is a graphical representation technique that permits to analyze causes as well as combination of causes of a top event. The result is displayed in a hierarchical tree-like structure. This kind of analysis has to be supported by a specialized tool.
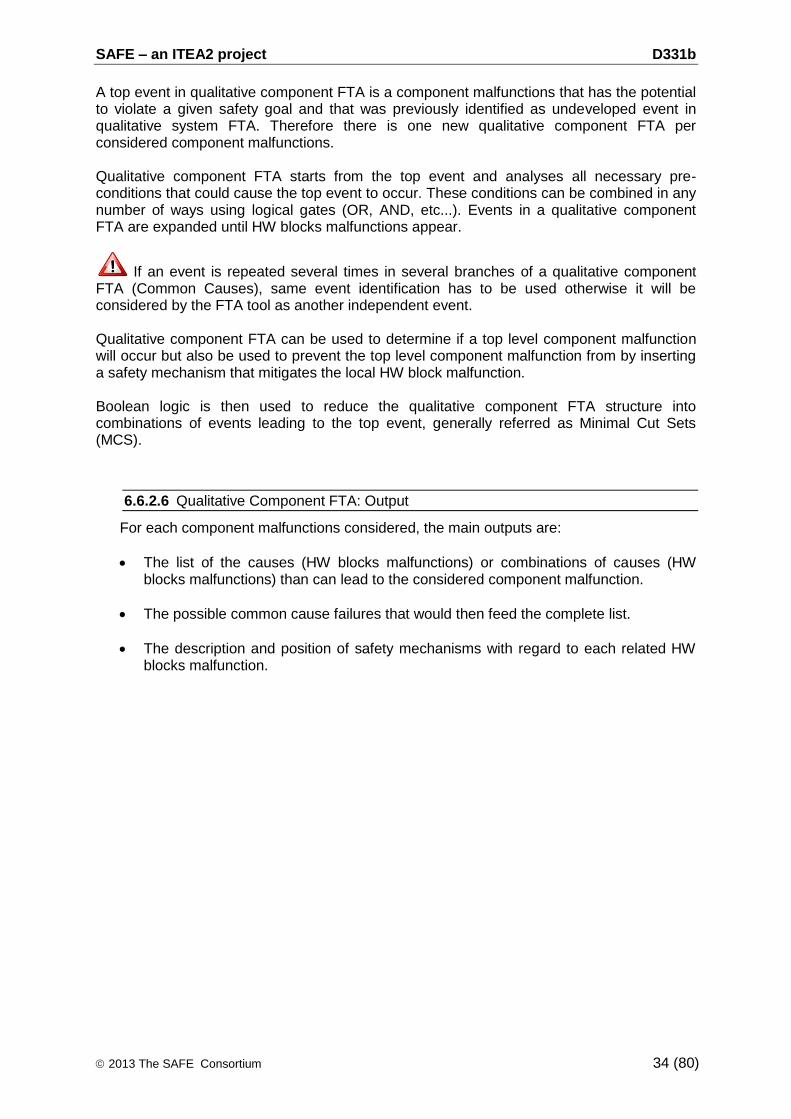
SAFE – an ITEA2 project D331b
2013 The SAFE Consortium 34 (80)
A top event in qualitative component FTA is a component malfunctions that has the potential to violate a given safety goal and that was previously identified as undeveloped event in qualitative system FTA. Therefore there is one new qualitative component FTA per considered component malfunctions. Qualitative component FTA starts from the top event and analyses all necessary pre-conditions that could cause the top event to occur. These conditions can be combined in any number of ways using logical gates (OR, AND, etc...). Events in a qualitative component FTA are expanded until HW blocks malfunctions appear.
If an event is repeated several times in several branches of a qualitative component FTA (Common Causes), same event identification has to be used otherwise it will be considered by the FTA tool as another independent event. Qualitative component FTA can be used to determine if a top level component malfunction will occur but also be used to prevent the top level component malfunction from by inserting a safety mechanism that mitigates the local HW block malfunction. Boolean logic is then used to reduce the qualitative component FTA structure into combinations of events leading to the top event, generally referred as Minimal Cut Sets (MCS).
6.6.2.6 Qualitative Component FTA: Output
For each component malfunctions considered, the main outputs are:
The list of the causes (HW blocks malfunctions) or combinations of causes (HW blocks malfunctions) than can lead to the considered component malfunction.
The possible common cause failures that would then feed the complete list.
The description and position of safety mechanisms with regard to each related HW blocks malfunction.
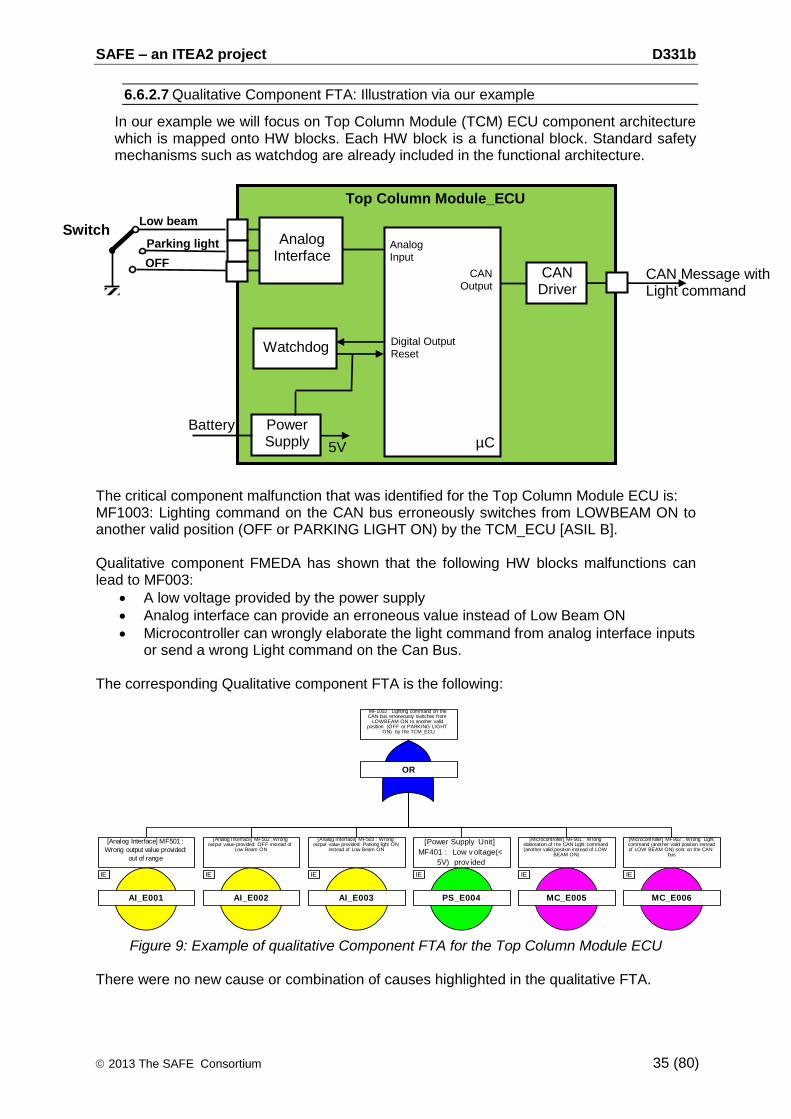
SAFE – an ITEA2 project D331b
2013 The SAFE Consortium 35 (80)
Watchdog
Power Supply µC
Analog Input
Digital Output Reset
CAN Output
CAN Driver
CAN Message with Light command
5V
Battery
Top Column Module_ECU
Analog Interface
Switch
OFF
Parking light
Low beam
6.6.2.7 Qualitative Component FTA: Illustration via our example
In our example we will focus on Top Column Module (TCM) ECU component architecture which is mapped onto HW blocks. Each HW block is a functional block. Standard safety mechanisms such as watchdog are already included in the functional architecture.
The critical component malfunction that was identified for the Top Column Module ECU is: MF1003: Lighting command on the CAN bus erroneously switches from LOWBEAM ON to another valid position (OFF or PARKING LIGHT ON) by the TCM_ECU [ASIL B]. Qualitative component FMEDA has shown that the following HW blocks malfunctions can lead to MF003:
A low voltage provided by the power supply
Analog interface can provide an erroneous value instead of Low Beam ON
Microcontroller can wrongly elaborate the light command from analog interface inputs or send a wrong Light command on the Can Bus.
The corresponding Qualitative component FTA is the following:
Figure 9: Example of qualitative Component FTA for the Top Column Module ECU
There were no new cause or combination of causes highlighted in the qualitative FTA.
AI_E001
[Analog Interface] MF501 :
Wrong output value provided:
out of range
IE
AI_E002
[Analog Interface] MF502 :Wrong output value provided: OFF instead of
Low Beam ON
IE
AI_E003
[Analog Interface] MF503 : Wrong output value provided: Parking light ON
instead of Low Beam ON
IE
PS_E004
[Power Supply Unit]
MF401 : Low v oltage(<
5V) prov ided
IE
MC_E005
[Microcontroller] MF901 : Wrong elaboration of the CAN Light command (another valid position instead of LOW
BEAM ON)
IE
MC_E006
[Microcontroller] MF902 : Wrong Light command (another valid position instead of LOW BEAM ON) sent on the CAN
bus
IE
OR
MF1003 : Lighting command on the CAN bus erroneously switches from
LOWBEAM ON to another valid position (OFF or PARKING LIGHT
ON) by the TCM_ECU
SAFE – an ITEA2 project D331b
2013 The SAFE Consortium 36 (80)
6.6.3 STEP 2C: Perform Quantitative Component FTA (Optional) [Component Safety Analysis] [Design Phase]
Allocation of residual risk targets to elements of a component is not recommended but could occur depending of business scenario. For example, in case of an ECU integrating complex elements under different supplier’s responsibility inside the ECU, an allocation to the integrated complex element would be relevant. To facilitate the allocation same principles than those described in chapter 6.5.3 can be used and therefore this chapter will not be furthermore developed.
6.6.4 STEP 2D: Allocate Architectural Metrics (Optional) [Component Safety Analysis] [Design Phase]
Allocation of architectural metrics targets to elements of a component is also not recommended but could occur depending of business scenario. The same example as above can be taken. Similar to STEP 2C, the allocation principles are not further developed please refers to chapter 6.5.4.
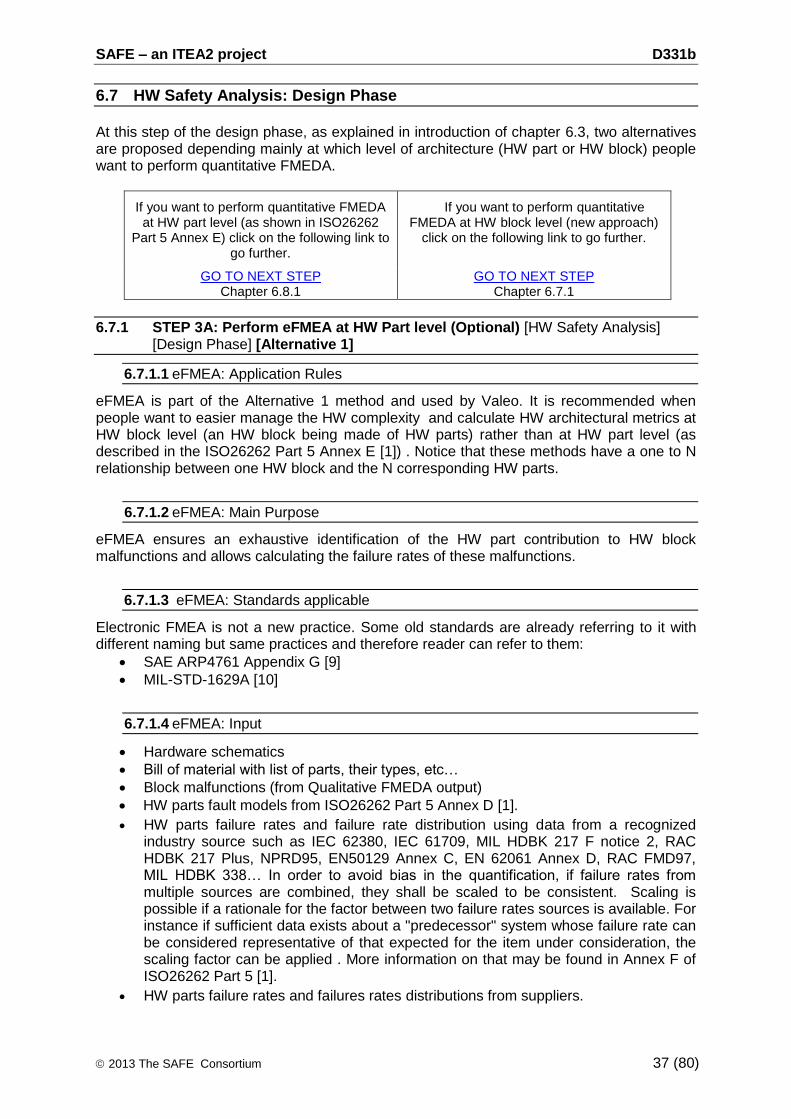
SAFE – an ITEA2 project D331b
2013 The SAFE Consortium 37 (80)
6.7 HW Safety Analysis: Design Phase
At this step of the design phase, as explained in introduction of chapter 6.3, two alternatives are proposed depending mainly at which level of architecture (HW part or HW block) people want to perform quantitative FMEDA.
If you want to perform quantitative FMEDA at HW part level (as shown in ISO26262
Part 5 Annex E) click on the following link to go further.
If you want to perform quantitative FMEDA at HW block level (new approach)
click on the following link to go further.
GO TO NEXT STEP Chapter 6.8.1
GO TO NEXT STEP Chapter 6.7.1
6.7.1 STEP 3A: Perform eFMEA at HW Part level (Optional) [HW Safety Analysis] [Design Phase] [Alternative 1]
6.7.1.1 eFMEA: Application Rules
eFMEA is part of the Alternative 1 method and used by Valeo. It is recommended when people want to easier manage the HW complexity and calculate HW architectural metrics at HW block level (an HW block being made of HW parts) rather than at HW part level (as described in the ISO26262 Part 5 Annex E [1]) . Notice that these methods have a one to N relationship between one HW block and the N corresponding HW parts.
6.7.1.2 eFMEA: Main Purpose
eFMEA ensures an exhaustive identification of the HW part contribution to HW block malfunctions and allows calculating the failure rates of these malfunctions.
6.7.1.3 eFMEA: Standards applicable
Electronic FMEA is not a new practice. Some old standards are already referring to it with different naming but same practices and therefore reader can refer to them:
SAE ARP4761 Appendix G [9]
MIL-STD-1629A [10]
6.7.1.4 eFMEA: Input
Hardware schematics
Bill of material with list of parts, their types, etc…
Block malfunctions (from Qualitative FMEDA output)
HW parts fault models from ISO26262 Part 5 Annex D [1].
HW parts failure rates and failure rate distribution using data from a recognized industry source such as IEC 62380, IEC 61709, MIL HDBK 217 F notice 2, RAC HDBK 217 Plus, NPRD95, EN50129 Annex C, EN 62061 Annex D, RAC FMD97, MIL HDBK 338… In order to avoid bias in the quantification, if failure rates from multiple sources are combined, they shall be scaled to be consistent. Scaling is possible if a rationale for the factor between two failure rates sources is available. For instance if sufficient data exists about a "predecessor" system whose failure rate can be considered representative of that expected for the item under consideration, the scaling factor can be applied . More information on that may be found in Annex F of ISO26262 Part 5 [1].
HW parts failure rates and failures rates distributions from suppliers.
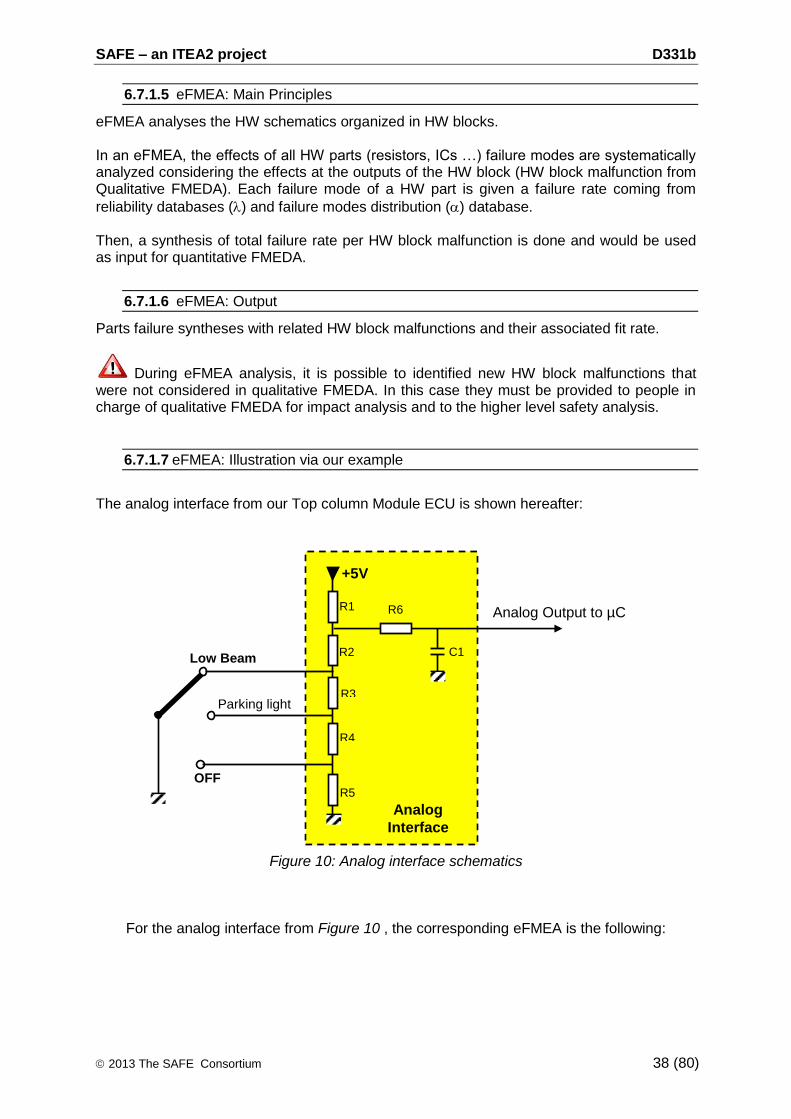
SAFE – an ITEA2 project D331b
2013 The SAFE Consortium 38 (80)
6.7.1.5 eFMEA: Main Principles
eFMEA analyses the HW schematics organized in HW blocks. In an eFMEA, the effects of all HW parts (resistors, ICs …) failure modes are systematically analyzed considering the effects at the outputs of the HW block (HW block malfunction from Qualitative FMEDA). Each failure mode of a HW part is given a failure rate coming from
reliability databases () and failure modes distribution () database. Then, a synthesis of total failure rate per HW block malfunction is done and would be used as input for quantitative FMEDA.
6.7.1.6 eFMEA: Output
Parts failure syntheses with related HW block malfunctions and their associated fit rate.
During eFMEA analysis, it is possible to identified new HW block malfunctions that were not considered in qualitative FMEDA. In this case they must be provided to people in charge of qualitative FMEDA for impact analysis and to the higher level safety analysis.
6.7.1.7 eFMEA: Illustration via our example
The analog interface from our Top column Module ECU is shown hereafter:
Figure 10: Analog interface schematics
For the analog interface from Figure 10 , the corresponding eFMEA is the following:
Analog Output to µC R1
R2
R3
R4
R5
R6
+5V
C1
Analog
Interface
OFF
Parking light
Low Beam
SAFE – an ITEA2 project D331b
2013 The SAFE Consortium 39 (80)
Worst case
HW Block name
Function description
Part id. Part
failure rate (FIT)
Part failure mode
Part failure mode
distribution (%)
Part failure mode failure
rate (FIT)
Effect at block output (Block Malfunction)
Analog Interface
Provide 3 analog values (corresponding
to OFF or Parking light ON or Low Beam ON
lighting switch position) to the microcontroller
R1 0.5
Parameter change +
30 % 0.15 MF502 :Wrong output value provided: OFF instead of Low Beam ON
Parameter change -
30 % 0.15 MF501 : Wrong output value
provided: out of range
Open 40 % 0.2 MF501 : Wrong output value
provided: out of range
R2 0.5
Parameter change +
30 % 0.15 MF502 :Wrong output value provided: OFF instead of Low Beam ON
Parameter change -
30 % 0.15 MF501 : Wrong output value
provided: out of range
Open 40 % 0.2 MF501 : Wrong output value
provided: out of range
R3 0.5
Parameter change +
30 % 0.15 MF502 :Wrong output value provided: OFF instead of Low Beam ON
Parameter change -
30 % 0.15 MF501 : Wrong output value
provided: out of range
Open 40 % 0.2 MF501 : Wrong output value
provided: out of range
R4 0.5
Parameter change +
30 % 0.15 No Effect
Parameter change -
30 % 0.15 No Effect
Open 40 % 0.2 No Effect
R5 0.5
Parameter change +
30 % 0.15 No Effect
Parameter change -
30 % 0.15 No Effect
Open 40 % 0.2 No Effect
R6 0.5
Parameter change +
30 % 0.15 MF502 :Wrong output value provided: OFF instead of Low Beam ON
Parameter change -
30 % 0.15 MF501 : Wrong output value
provided: out of range
Open 40 % 0.2 MF501 : Wrong output value
provided: out of range
C1 2 short 100% 2 MF501 : Wrong output value
provided: out of range
NOTE: In this example the worst case [OFF instead of Low beam ON] was considered and not [Parking light ON instead of Low beam ON] because the effect at component level is the same.
Table 7 : Example of partial eFMEA for analog interface performed on our use case
The synthesis of results is the following:
Analog Interface HW Block Malfunction Failure Rate (FIT) If new HW blocks malfunctions are
found during eFMEA, qualitative FMEDA needs to be updated with impact analysis.
MF502 :Wrong output value provided: OFF instead of Low Beam ON
0.6
MF501 : Wrong output value: out of range 3.4
No Effect 1
GO TO NEXT STEP Chapter 6.9.1
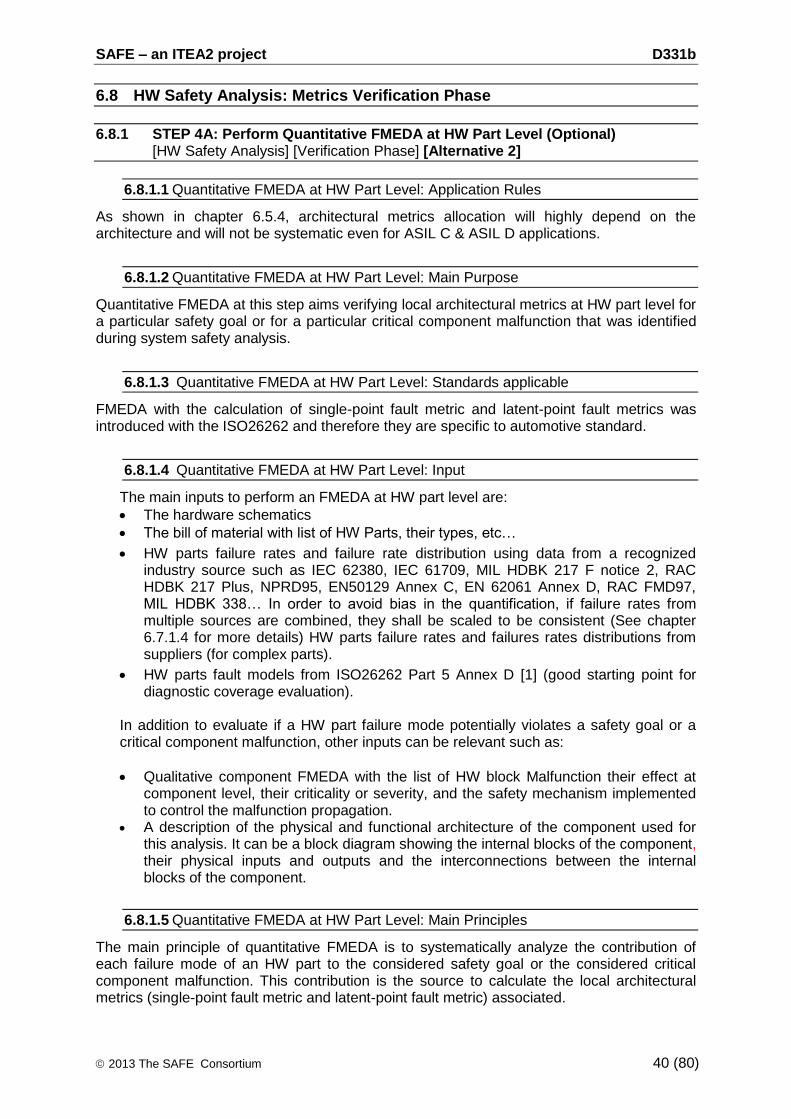
SAFE – an ITEA2 project D331b
2013 The SAFE Consortium 40 (80)
6.8 HW Safety Analysis: Metrics Verification Phase
6.8.1 STEP 4A: Perform Quantitative FMEDA at HW Part Level (Optional) [HW Safety Analysis] [Verification Phase] [Alternative 2]
6.8.1.1 Quantitative FMEDA at HW Part Level: Application Rules
As shown in chapter 6.5.4, architectural metrics allocation will highly depend on the architecture and will not be systematic even for ASIL C & ASIL D applications.
6.8.1.2 Quantitative FMEDA at HW Part Level: Main Purpose
Quantitative FMEDA at this step aims verifying local architectural metrics at HW part level for a particular safety goal or for a particular critical component malfunction that was identified during system safety analysis.
6.8.1.3 Quantitative FMEDA at HW Part Level: Standards applicable
FMEDA with the calculation of single-point fault metric and latent-point fault metrics was introduced with the ISO26262 and therefore they are specific to automotive standard.
6.8.1.4 Quantitative FMEDA at HW Part Level: Input
The main inputs to perform an FMEDA at HW part level are:
The hardware schematics
The bill of material with list of HW Parts, their types, etc…
HW parts failure rates and failure rate distribution using data from a recognized industry source such as IEC 62380, IEC 61709, MIL HDBK 217 F notice 2, RAC HDBK 217 Plus, NPRD95, EN50129 Annex C, EN 62061 Annex D, RAC FMD97, MIL HDBK 338… In order to avoid bias in the quantification, if failure rates from multiple sources are combined, they shall be scaled to be consistent (See chapter 6.7.1.4 for more details) HW parts failure rates and failures rates distributions from suppliers (for complex parts).
HW parts fault models from ISO26262 Part 5 Annex D [1] (good starting point for diagnostic coverage evaluation).
In addition to evaluate if a HW part failure mode potentially violates a safety goal or a critical component malfunction, other inputs can be relevant such as:
Qualitative component FMEDA with the list of HW block Malfunction their effect at component level, their criticality or severity, and the safety mechanism implemented to control the malfunction propagation.
A description of the physical and functional architecture of the component used for this analysis. It can be a block diagram showing the internal blocks of the component, their physical inputs and outputs and the interconnections between the internal blocks of the component.
6.8.1.5 Quantitative FMEDA at HW Part Level: Main Principles
The main principle of quantitative FMEDA is to systematically analyze the contribution of each failure mode of an HW part to the considered safety goal or the considered critical component malfunction. This contribution is the source to calculate the local architectural metrics (single-point fault metric and latent-point fault metric) associated.
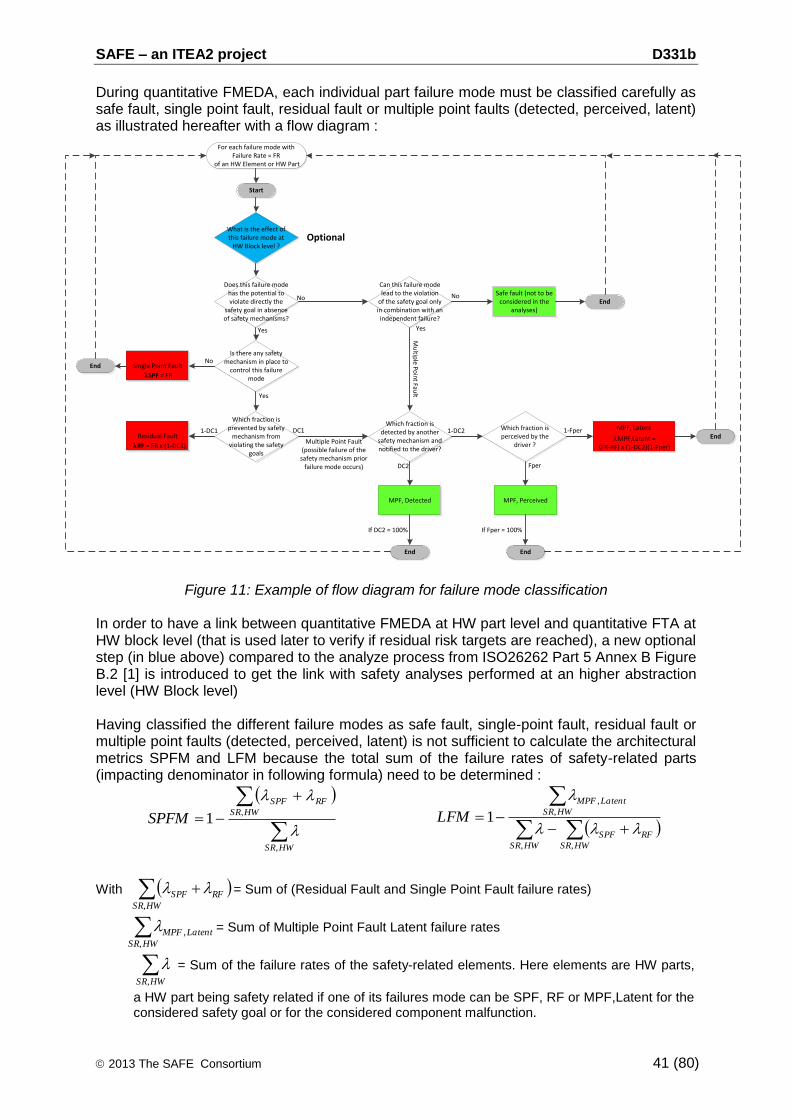
SAFE – an ITEA2 project D331b
2013 The SAFE Consortium 41 (80)
During quantitative FMEDA, each individual part failure mode must be classified carefully as safe fault, single point fault, residual fault or multiple point faults (detected, perceived, latent) as illustrated hereafter with a flow diagram :
For each failure mode with Failure Rate = FR
of an HW Element or HW Part
Is there any safety mechanism in place to
control this failure mode
Single Point Fault
Which fraction is prevented by safety
mechanism from violating the safety
goals
Does this failure mode has the potential to violate directly the
safety goal in absence of safety mechanisms?
DC11-DC1Residual Fault
Which fraction is detected by another
safety mechanism and notified to the driver?
Yes
No
Yes
No
Multiple Point Fault(possible failure of the
safety mechanism prior failure mode occurs) DC2
MPF, Detected MPF, Perceived
Which fraction is perceived by the
driver ?
MPF, Latent
Can this failure mode lead to the violation
of the safety goal onlyin combination with anindependent failure?
Mu
ltiple P
oin
t Fault
1-DC2
Safe fault (not to be considered in the
analyses)
No
Fper
Yes
1-Fper
If Fper = 100%If DC2 = 100%
End
Start
End
End End
End
SPF = FR
RF = FR x (1-DC1)MPF,Latent =
(FR-RF) x (1-DC2)(1-Fper)
What is the effect of this failure mode at
HW Block level ?Optional
Figure 11: Example of flow diagram for failure mode classification
In order to have a link between quantitative FMEDA at HW part level and quantitative FTA at HW block level (that is used later to verify if residual risk targets are reached), a new optional step (in blue above) compared to the analyze process from ISO26262 Part 5 Annex B Figure B.2 [1] is introduced to get the link with safety analyses performed at an higher abstraction level (HW Block level) Having classified the different failure modes as safe fault, single-point fault, residual fault or multiple point faults (detected, perceived, latent) is not sufficient to calculate the architectural metrics SPFM and LFM because the total sum of the failure rates of safety-related parts (impacting denominator in following formula) need to be determined :
HWSR
HWSR
RFSPF
SPFM
,
,1
HWSR
RFSPF
HWSR
HWSR
LatentMPF
LFM
,,
,
,
1
With HWSR
RFSPF
,
= Sum of (Residual Fault and Single Point Fault failure rates)
HWSR
LatentMPF
,
, = Sum of Multiple Point Fault Latent failure rates
HWSR,
= Sum of the failure rates of the safety-related elements. Here elements are HW parts,
a HW part being safety related if one of its failures mode can be SPF, RF or MPF,Latent for the considered safety goal or for the considered component malfunction.
SAFE – an ITEA2 project D331b
2013 The SAFE Consortium 42 (80)
Then knowing HWSR,
it is possible to calculate the SPFM and LFM and verify if architectural
metrics targets are reached for each considered safety goal or critical component malfunctions.
If SPFM and LFM targets are not reached, main contributors to SPFM and LFM can be identified and new safety mechanisms put in place or improved if their diagnostic coverage was very low (60%). Be careful, here the recommendation is not to play with numbers to reach the target. It must be done carefully and if architectural metrics values are closed to the targets, the best is to come with these values to the system responsible that will be able to verify that at safety goal level, the final architectural metrics targets are reached when integrating all results from all components. Remarks when performing quantitative FMEDA:
1. HW parts whose faults are multiple-point faults with n > 2 can be omitted from the
calculations unless shown to be relevant in the technical safety concept. 2. It is important to understand that the Diagnostic Coverage’s (DC) that are given in
ISO26262 Part 5 Annex D [1] are average values that consider all failure modes of a HW block. Here the maximum DC considered is 99% but it does not mean that a DC of 100% is not reachable, but this has to be demonstrated with a specific analysis.
3. A same failure mode can be placed in different classes for fault when being considered for different safety goals or critical component malfunctions.
6.8.1.6 Quantitative FMEDA at HW Part Level: Output
The main output is the architectural metrics (single-point fault metric and latent-point fault metric) for each considered safety goal or critical component malfunction. Also it can be interesting to have the list of the main contributors for each metric with potential actions identified when architectural metrics targets are not reached.
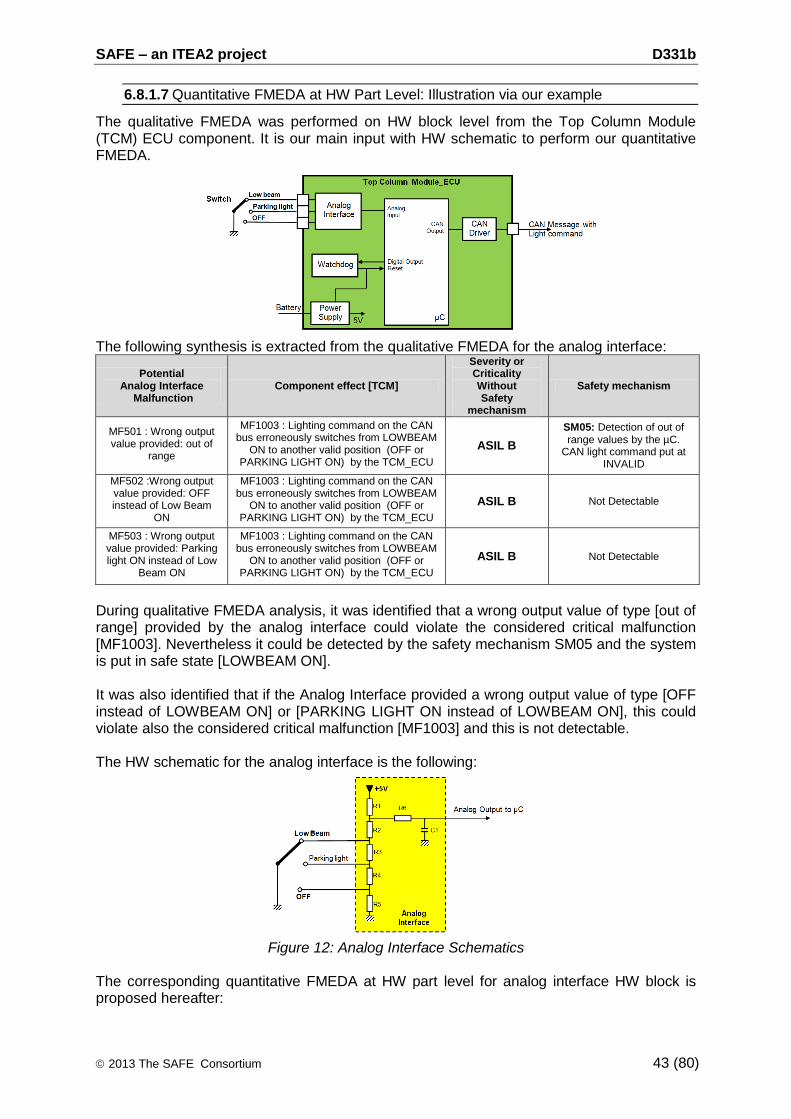
SAFE – an ITEA2 project D331b
2013 The SAFE Consortium 43 (80)
6.8.1.7 Quantitative FMEDA at HW Part Level: Illustration via our example
The qualitative FMEDA was performed on HW block level from the Top Column Module (TCM) ECU component. It is our main input with HW schematic to perform our quantitative FMEDA.
The following synthesis is extracted from the qualitative FMEDA for the analog interface:
Potential Analog Interface
Malfunction Component effect [TCM]
Severity or Criticality Without Safety
mechanism
Safety mechanism
MF501 : Wrong output value provided: out of
range
MF1003 : Lighting command on the CAN bus erroneously switches from LOWBEAM
ON to another valid position (OFF or PARKING LIGHT ON) by the TCM_ECU
ASIL B
SM05: Detection of out of range values by the µC.
CAN light command put at INVALID
MF502 :Wrong output value provided: OFF instead of Low Beam
ON
MF1003 : Lighting command on the CAN bus erroneously switches from LOWBEAM
ON to another valid position (OFF or PARKING LIGHT ON) by the TCM_ECU
ASIL B Not Detectable
MF503 : Wrong output value provided: Parking light ON instead of Low
Beam ON
MF1003 : Lighting command on the CAN bus erroneously switches from LOWBEAM
ON to another valid position (OFF or PARKING LIGHT ON) by the TCM_ECU
ASIL B Not Detectable
During qualitative FMEDA analysis, it was identified that a wrong output value of type [out of range] provided by the analog interface could violate the considered critical malfunction [MF1003]. Nevertheless it could be detected by the safety mechanism SM05 and the system is put in safe state [LOWBEAM ON]. It was also identified that if the Analog Interface provided a wrong output value of type [OFF instead of LOWBEAM ON] or [PARKING LIGHT ON instead of LOWBEAM ON], this could violate also the considered critical malfunction [MF1003] and this is not detectable. The HW schematic for the analog interface is the following:
Figure 12: Analog Interface Schematics
The corresponding quantitative FMEDA at HW part level for analog interface HW block is proposed hereafter:
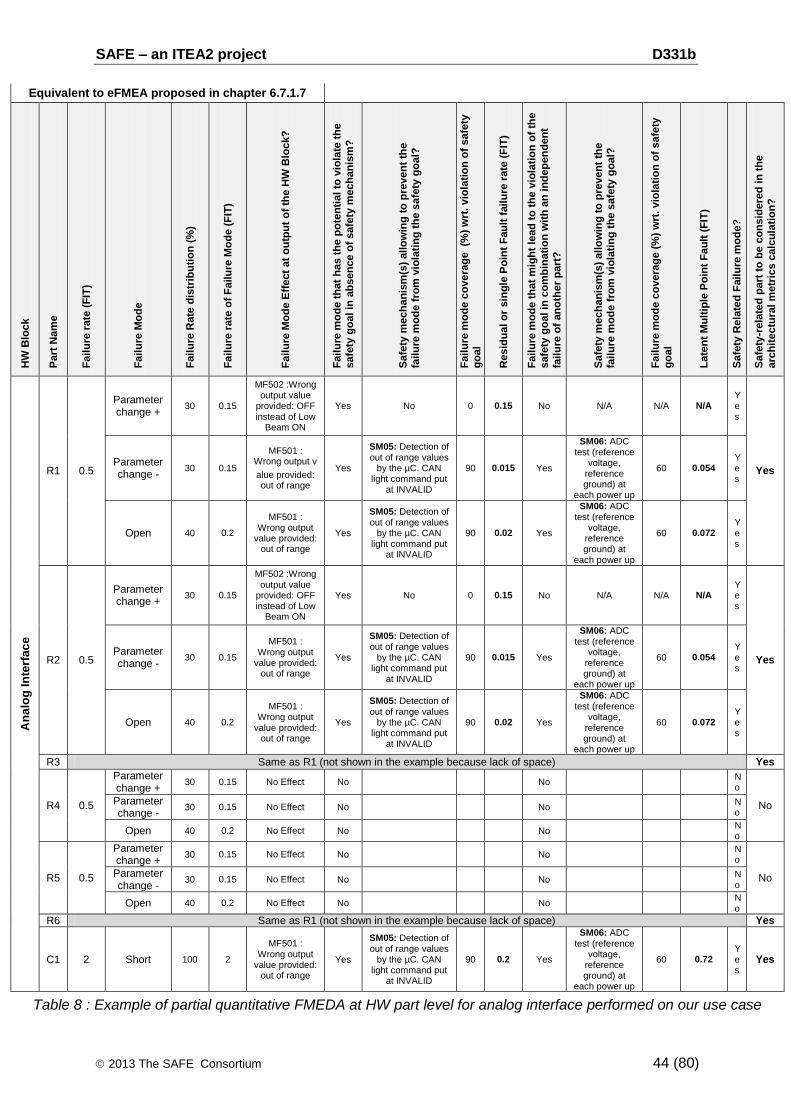
SAFE – an ITEA2 project D331b
2013 The SAFE Consortium 44 (80)
Equivalent to eFMEA proposed in chapter 6.7.1.7
HW
Blo
ck
Part
Nam
e
Fa
ilu
re r
ate
(F
IT)
Fa
ilu
re M
od
e
Fa
ilu
re R
ate
dis
trib
uti
on
(%
)
Fa
ilu
re r
ate
of
Fa
ilu
re M
od
e (
FIT
)
Fa
ilu
re M
od
e E
ffect
at
ou
tpu
t o
f th
e H
W B
loc
k?
Fa
ilu
re m
od
e t
ha
t h
as t
he p
ote
nti
al
to v
iola
te t
he
safe
ty g
oa
l in
ab
sen
ce o
f safe
ty m
ech
an
ism
?
Safe
ty m
ech
an
ism
(s)
allo
win
g t
o p
reven
t th
e
fail
ure
mo
de
fro
m v
iola
tin
g t
he
safe
ty g
oa
l?
Fa
ilu
re m
od
e c
ov
era
ge
(%
) w
rt. vio
lati
on
of
safe
ty
go
al
Resid
ua
l o
r sin
gle
Po
int
Fau
lt f
ail
ure
rate
(F
IT)
Fa
ilu
re m
od
e t
ha
t m
igh
t le
ad
to
th
e v
iola
tio
n o
f th
e
safe
ty g
oa
l in
co
mb
ina
tio
n w
ith
an
in
de
pen
den
t
fail
ure
of
an
oth
er
pa
rt?
Safe
ty m
ech
an
ism
(s)
allo
win
g t
o p
reven
t th
e
fail
ure
mo
de
fro
m v
iola
tin
g t
he
safe
ty g
oa
l?
Fa
ilu
re m
od
e c
ov
era
ge
(%
) w
rt. vio
lati
on
of
safe
ty
go
al
La
ten
t M
ult
iple
Po
int
Fa
ult
(F
IT)
Safe
ty R
ela
ted
Fail
ure
mo
de
?
Safe
ty-r
ela
ted
pa
rt t
o b
e c
on
sid
ere
d i
n t
he
arc
hit
ectu
ral m
etr
ics c
alc
ula
tio
n?
An
alo
g I
nte
rfac
e
R1 0.5
Parameter change +
30 0.15
MF502 :Wrong output value
provided: OFF instead of Low
Beam ON
Yes No 0 0.15 No N/A N/A N/A Yes
Yes Parameter change -
30 0.15
MF501 : Wrong output v
alue provided: out of range
Yes
SM05: Detection of out of range values
by the µC. CAN light command put
at INVALID
90 0.015 Yes
SM06: ADC test (reference
voltage, reference ground) at
each power up
60 0.054 Yes
Open 40 0.2
MF501 : Wrong output
value provided: out of range
Yes
SM05: Detection of out of range values
by the µC. CAN light command put
at INVALID
90 0.02 Yes
SM06: ADC test (reference
voltage, reference ground) at
each power up
60 0.072 Yes
R2 0.5
Parameter change +
30 0.15
MF502 :Wrong output value
provided: OFF instead of Low
Beam ON
Yes No 0 0.15 No N/A N/A N/A Yes
Yes Parameter change -
30 0.15
MF501 : Wrong output
value provided: out of range
Yes
SM05: Detection of out of range values
by the µC. CAN light command put
at INVALID
90 0.015 Yes
SM06: ADC test (reference
voltage, reference ground) at
each power up
60 0.054 Yes
Open 40 0.2
MF501 : Wrong output
value provided: out of range
Yes
SM05: Detection of out of range values
by the µC. CAN light command put
at INVALID
90 0.02 Yes
SM06: ADC test (reference
voltage, reference ground) at
each power up
60 0.072 Yes
R3 Same as R1 (not shown in the example because lack of space) Yes
R4 0.5
Parameter change +
30 0.15 No Effect No No No
No Parameter change -
30 0.15 No Effect No No No
Open 40 0.2 No Effect No No No
R5 0.5
Parameter change +
30 0.15 No Effect No No No
No Parameter change -
30 0.15 No Effect No No No
Open 40 0.2 No Effect No No No
R6 Same as R1 (not shown in the example because lack of space) Yes
C1 2 Short 100 2
MF501 : Wrong output
value provided: out of range
Yes
SM05: Detection of out of range values
by the µC. CAN light command put
at INVALID
90 0.2 Yes
SM06: ADC test (reference
voltage, reference ground) at
each power up
60 0.72 Yes
Yes
Table 8 : Example of partial quantitative FMEDA at HW part level for analog interface performed on our use case

SAFE – an ITEA2 project D331b
2013 The SAFE Consortium 45 (80)
As it can be seen above the FMEDA table can become quickly not readable. If we have an ECU with 300 HW parts each of them having 3 failure modes, it gives a quantitative FMEDA table with 900 lines. Therefore it is better to have a tool that can support quantitative FMEDA and permit to extract quickly the relevant information for people in charge of the analysis.. The fact to add a new column considering “the failure mode effect at output of the HW block” help defining for each failure mode (with qualitative FMEDA output) if the considered safety goal or the considered critical component malfunction can be violated and if safety mechanisms are put in place to control this failure mode. Also this additional column is a mean to link quantitative FMEDA performed at HW part level with quantitative component FTA performed at HW block level during residual risk verification (see chapter 6.9.2) It can be also noticed that the first 7 columns of the FMEDA table above are equivalent to the eFMEA approach from [Alternative 1] showed in chapter 6.7.1.7. Back to our example, if we want to calculate the local architectural metrics for the analog interface For the analog interface, the parts R1, R2, R3, R6 and C1 are safety related.
Therefore the total amount of safety related failure rate is HWSR,
=0.5+0.5+0.5+0.5+2 = 4 FIT
and HWSR
RFSPF
,
= 0.94 FIT
and HWSR
LatentMPF
,
, = 1.224 FIT
All necessary data to determine local architectural metrics for the analog interface are now available. Results are:
%5.76
4
94.011
,
,
HWSR
HWSR
RFSPF
SPFM
%60
94.04
224.111
,,
,
,
HWSR
RFSPF
HWSR
HWSR
LatentMPF
LFM
Compared to the initial architectural metrics targets defined in chapter 6.5.4.5 (SPFM = 90%; LFM = 60%) the SPFM result is not good but here only the analog interface was considered to simplify the example. In real life other HW parts of the TCM_ECU component have also to be considered for the global architectural metrics calculation.
GO TO NEXT STEP Chapter 6.8.2
SAFE – an ITEA2 project D331b
2013 The SAFE Consortium 46 (80)
6.8.2 STEP 4B: Calculate Component Residual Risk (Optional) at HW Part level [HW Safety Analysis] [Verification Phase] [Alternative 2]
ISO26262 Part 5 Chapter 9 [1] proposed two alternative methods to evaluate whether the risk of violations of safety goal is sufficient low:
1st Method called “Probabilistic Metric for random Hardware Failures” (PMHF) consists in using a probabilistic metric to evaluate the violation of the considered safety goal using, for example, quantified FTA and to compare the result of this quantification with a target value. [STEP 4B1]
2nd Method called “Evaluation of each cause of safety goal violation” consists in evaluating individually each single-point fault or residual fault or dual-point fault that can lead to the violation of the considered safety goal. [STEP 4B2]
Applicability: The calculation of residual risk is required for ASIL C and ASIL D safety goals and recommended for ASIL B safety goals.
In both methods, multiple-point faults can also be considered if shown to be relevant when building the technical safety concept. The first method using quantified FTA can be performed at different architectural levels, from HW parts to system level, whereas the second method shall be used at HW part level as stated in ISO26262 Part 5 Clause 9.4.3.2 [1].
6.8.2.1 STEP 4B1: Calculate Component Residual Risk at HW Part level using Method 1: Probabilistic Metric for random Hardware Failures (PMHF) [Alternative 2]
Considering the experience of WT331 partners, it is not recommended to use method 1 with quantitative FTA performed at HW part level because it leads to huge fault trees that should be updated each time when the HW schematics is modified. Moreover the resulting fault trees are not readable and error prone. The only case where it could be relevant to perform quantified FTA at HW part level is for complex HW parts such as microcontrollers. The resulting FTA (coming often from suppliers) could then be integrated in a quantified FTA performed at HW block level as an example. Therefore if you want to use the method 1 proposed by ISO26262 Part 5 [1] to calculate the PMHF, please go directly to chapter 6.9.2. A simplified method could be to consider as a first approximation only the minimum cut-set of order 1, given by the computation of SPF and RF fault given by the formula:
PMHF HWSR
RFSPF
,
In most of the cause this assumption is sufficient for pessimistic approximation.
GO TO NEXT STEP Chapter 6.9.2
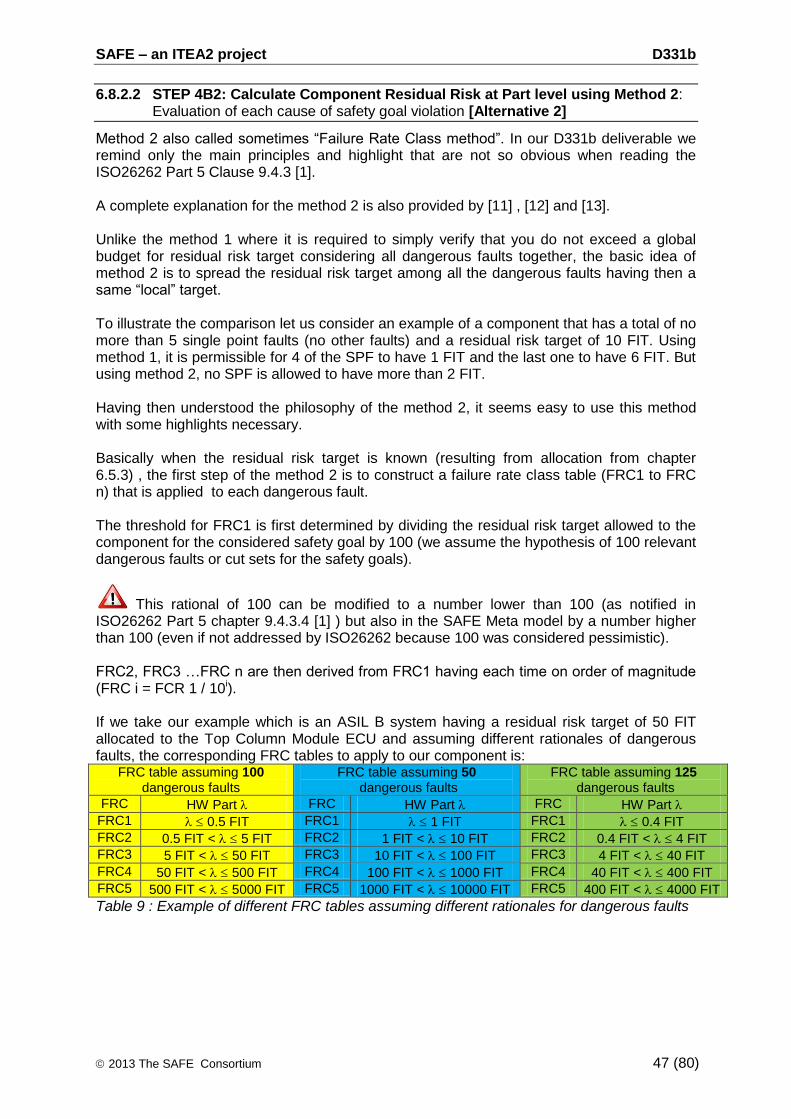
SAFE – an ITEA2 project D331b
2013 The SAFE Consortium 47 (80)
6.8.2.2 STEP 4B2: Calculate Component Residual Risk at Part level using Method 2: Evaluation of each cause of safety goal violation [Alternative 2]
Method 2 also called sometimes “Failure Rate Class method”. In our D331b deliverable we remind only the main principles and highlight that are not so obvious when reading the ISO26262 Part 5 Clause 9.4.3 [1]. A complete explanation for the method 2 is also provided by [11] , [12] and [13]. Unlike the method 1 where it is required to simply verify that you do not exceed a global budget for residual risk target considering all dangerous faults together, the basic idea of method 2 is to spread the residual risk target among all the dangerous faults having then a same “local” target. To illustrate the comparison let us consider an example of a component that has a total of no more than 5 single point faults (no other faults) and a residual risk target of 10 FIT. Using method 1, it is permissible for 4 of the SPF to have 1 FIT and the last one to have 6 FIT. But using method 2, no SPF is allowed to have more than 2 FIT. Having then understood the philosophy of the method 2, it seems easy to use this method with some highlights necessary. Basically when the residual risk target is known (resulting from allocation from chapter 6.5.3) , the first step of the method 2 is to construct a failure rate class table (FRC1 to FRC n) that is applied to each dangerous fault. The threshold for FRC1 is first determined by dividing the residual risk target allowed to the component for the considered safety goal by 100 (we assume the hypothesis of 100 relevant dangerous faults or cut sets for the safety goals).
This rational of 100 can be modified to a number lower than 100 (as notified in ISO26262 Part 5 chapter 9.4.3.4 [1] ) but also in the SAFE Meta model by a number higher than 100 (even if not addressed by ISO26262 because 100 was considered pessimistic). FRC2, FRC3 …FRC n are then derived from FRC1 having each time on order of magnitude (FRC i = FCR 1 / 10i). If we take our example which is an ASIL B system having a residual risk target of 50 FIT allocated to the Top Column Module ECU and assuming different rationales of dangerous faults, the corresponding FRC tables to apply to our component is:
FRC table assuming 100 dangerous faults
FRC table assuming 50 dangerous faults
FRC table assuming 125 dangerous faults
FRC HW Part FRC HW Part FRC HW Part
FRC1 0.5 FIT FRC1 1 FIT FRC1 0.4 FIT
FRC2 0.5 FIT < 5 FIT FRC2 1 FIT < 10 FIT FRC2 0.4 FIT < 4 FIT
FRC3 5 FIT < 50 FIT FRC3 10 FIT < 100 FIT FRC3 4 FIT < 40 FIT
FRC4 50 FIT < 500 FIT FRC4 100 FIT < 1000 FIT FRC4 40 FIT < 400 FIT
FRC5 500 FIT < 5000 FIT FRC5 1000 FIT < 10000 FIT FRC5 400 FIT < 4000 FIT
Table 9 : Example of different FRC tables assuming different rationales for dangerous faults
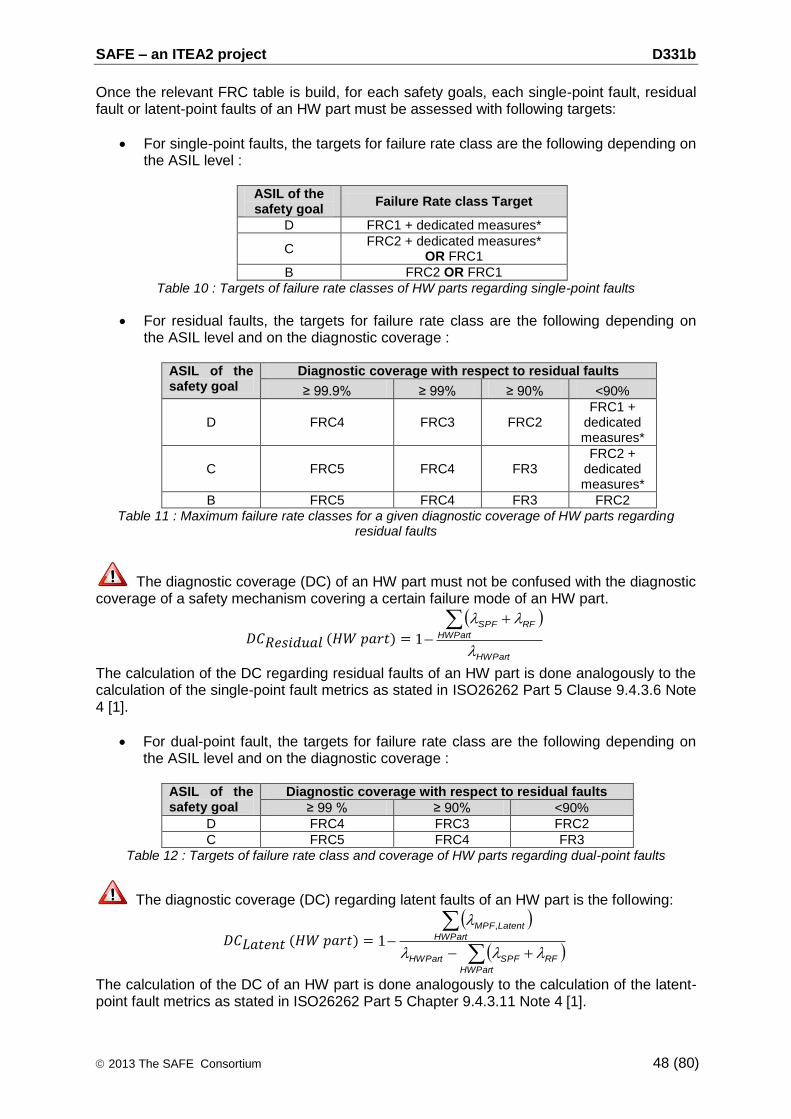
SAFE – an ITEA2 project D331b
2013 The SAFE Consortium 48 (80)
Once the relevant FRC table is build, for each safety goals, each single-point fault, residual fault or latent-point faults of an HW part must be assessed with following targets:
For single-point faults, the targets for failure rate class are the following depending on the ASIL level :
ASIL of the safety goal
Failure Rate class Target
D FRC1 + dedicated measures*
C FRC2 + dedicated measures*
OR FRC1
B FRC2 OR FRC1
Table 10 : Targets of failure rate classes of HW parts regarding single-point faults
For residual faults, the targets for failure rate class are the following depending on the ASIL level and on the diagnostic coverage :
ASIL of the safety goal
Diagnostic coverage with respect to residual faults
≥ 99.9% ≥ 99% ≥ 90% <90%
D FRC4 FRC3 FRC2 FRC1 +
dedicated measures*
C FRC5 FRC4 FR3 FRC2 +
dedicated measures*
B FRC5 FRC4 FR3 FRC2
Table 11 : Maximum failure rate classes for a given diagnostic coverage of HW parts regarding residual faults
The diagnostic coverage (DC) of an HW part must not be confused with the diagnostic coverage of a safety mechanism covering a certain failure mode of an HW part.
PartHW
HWPart
RFSPF
1
The calculation of the DC regarding residual faults of an HW part is done analogously to the calculation of the single-point fault metrics as stated in ISO26262 Part 5 Clause 9.4.3.6 Note 4 [1].
For dual-point fault, the targets for failure rate class are the following depending on the ASIL level and on the diagnostic coverage :
ASIL of the safety goal
Diagnostic coverage with respect to residual faults
≥ 99 % ≥ 90% <90%
D FRC4 FRC3 FRC2
C FRC5 FRC4 FR3
Table 12 : Targets of failure rate class and coverage of HW parts regarding dual-point faults
The diagnostic coverage (DC) regarding latent faults of an HW part is the following:
HWPart
RFSPFPartHW
HWPart
LatentMPF
,
1
The calculation of the DC of an HW part is done analogously to the calculation of the latent-point fault metrics as stated in ISO26262 Part 5 Chapter 9.4.3.11 Note 4 [1].

SAFE – an ITEA2 project D331b
2013 The SAFE Consortium 49 (80)
GO TO NEXT STEP
Chapter 6.10.1
*Dedicated Measures As stated in the ISO26262 Part 5 Clause 9.4.2.4 [1] a dedicated measure can be: a) design features such as hardware part over design (e.g. electrical or thermal stress rating) or physical separation (e.g. spacing of contacts on a printed circuit board) or b) a special sample test of incoming material to reduce the risk of occurrence of this failure mode or c) a burn-in test or d) a dedicated control set as part of the control plan and e) assignment of safety-related special characteristics.
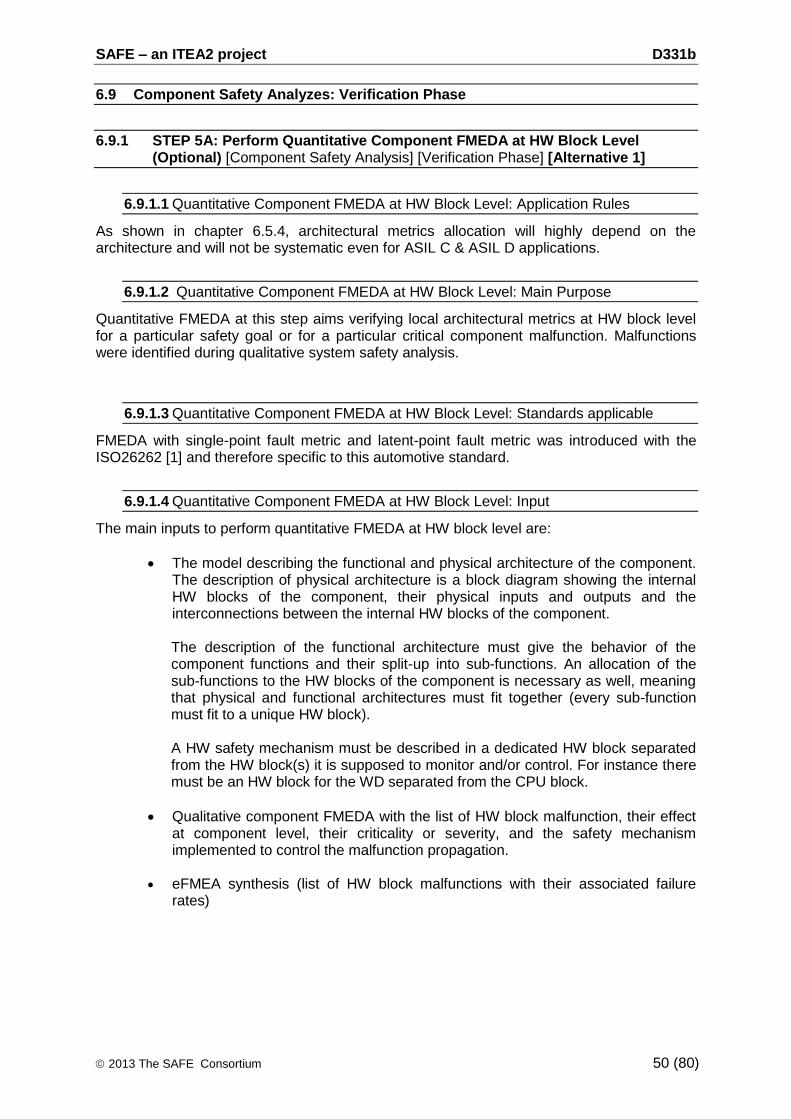
SAFE – an ITEA2 project D331b
2013 The SAFE Consortium 50 (80)
6.9 Component Safety Analyzes: Verification Phase
6.9.1 STEP 5A: Perform Quantitative Component FMEDA at HW Block Level (Optional) [Component Safety Analysis] [Verification Phase] [Alternative 1]
6.9.1.1 Quantitative Component FMEDA at HW Block Level: Application Rules
As shown in chapter 6.5.4, architectural metrics allocation will highly depend on the architecture and will not be systematic even for ASIL C & ASIL D applications.
6.9.1.2 Quantitative Component FMEDA at HW Block Level: Main Purpose
Quantitative FMEDA at this step aims verifying local architectural metrics at HW block level for a particular safety goal or for a particular critical component malfunction. Malfunctions were identified during qualitative system safety analysis.
6.9.1.3 Quantitative Component FMEDA at HW Block Level: Standards applicable
FMEDA with single-point fault metric and latent-point fault metric was introduced with the ISO26262 [1] and therefore specific to this automotive standard.
6.9.1.4 Quantitative Component FMEDA at HW Block Level: Input
The main inputs to perform quantitative FMEDA at HW block level are:
The model describing the functional and physical architecture of the component. The description of physical architecture is a block diagram showing the internal HW blocks of the component, their physical inputs and outputs and the interconnections between the internal HW blocks of the component.
The description of the functional architecture must give the behavior of the component functions and their split-up into sub-functions. An allocation of the sub-functions to the HW blocks of the component is necessary as well, meaning that physical and functional architectures must fit together (every sub-function must fit to a unique HW block). A HW safety mechanism must be described in a dedicated HW block separated from the HW block(s) it is supposed to monitor and/or control. For instance there must be an HW block for the WD separated from the CPU block.
Qualitative component FMEDA with the list of HW block malfunction, their effect at component level, their criticality or severity, and the safety mechanism implemented to control the malfunction propagation.
eFMEA synthesis (list of HW block malfunctions with their associated failure
rates)
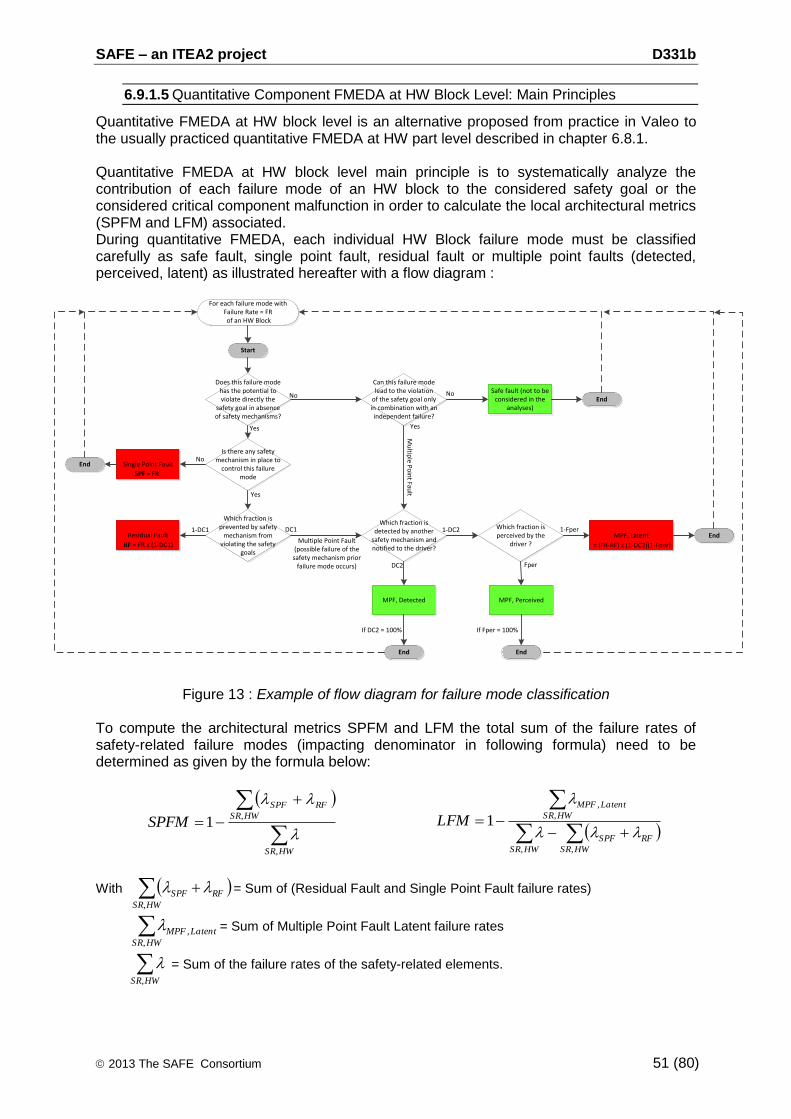
SAFE – an ITEA2 project D331b
2013 The SAFE Consortium 51 (80)
6.9.1.5 Quantitative Component FMEDA at HW Block Level: Main Principles
Quantitative FMEDA at HW block level is an alternative proposed from practice in Valeo to the usually practiced quantitative FMEDA at HW part level described in chapter 6.8.1. Quantitative FMEDA at HW block level main principle is to systematically analyze the contribution of each failure mode of an HW block to the considered safety goal or the considered critical component malfunction in order to calculate the local architectural metrics (SPFM and LFM) associated. During quantitative FMEDA, each individual HW Block failure mode must be classified carefully as safe fault, single point fault, residual fault or multiple point faults (detected, perceived, latent) as illustrated hereafter with a flow diagram :
For each failure mode with Failure Rate = FR of an HW Block
Is there any safety mechanism in place to
control this failure mode
Single Point Fault
Which fraction is prevented by safety
mechanism from violating the safety
goals
Does this failure mode has the potential to violate directly the
safety goal in absence of safety mechanisms?
DC11-DC1Residual Fault
Which fraction is detected by another
safety mechanism and notified to the driver?
Yes
No
Yes
No
Multiple Point Fault(possible failure of the
safety mechanism prior failure mode occurs) DC2
MPF, Detected MPF, Perceived
Which fraction is perceived by the
driver ?MPF, Latent
Can this failure mode lead to the violation
of the safety goal onlyin combination with anindependent failure?
Mu
ltiple P
oin
t Fault
1-DC2
Safe fault (not to be considered in the
analyses)
No
Fper
Yes
1-Fper
If Fper = 100%If DC2 = 100%
End
Start
End
End End
End
SPF = FR
RF = FR x (1-DC1) = (FR-RF) x (1-DC2)(1-Fper)
Figure 13 : Example of flow diagram for failure mode classification To compute the architectural metrics SPFM and LFM the total sum of the failure rates of safety-related failure modes (impacting denominator in following formula) need to be determined as given by the formula below:
HWSR
HWSR
RFSPF
SPFM
,
,1
HWSR
RFSPF
HWSR
HWSR
LatentMPF
LFM
,,
,
,
1
With HWSR
RFSPF
,
= Sum of (Residual Fault and Single Point Fault failure rates)
HWSR
LatentMPF
,
, = Sum of Multiple Point Fault Latent failure rates
HWSR,
= Sum of the failure rates of the safety-related elements.
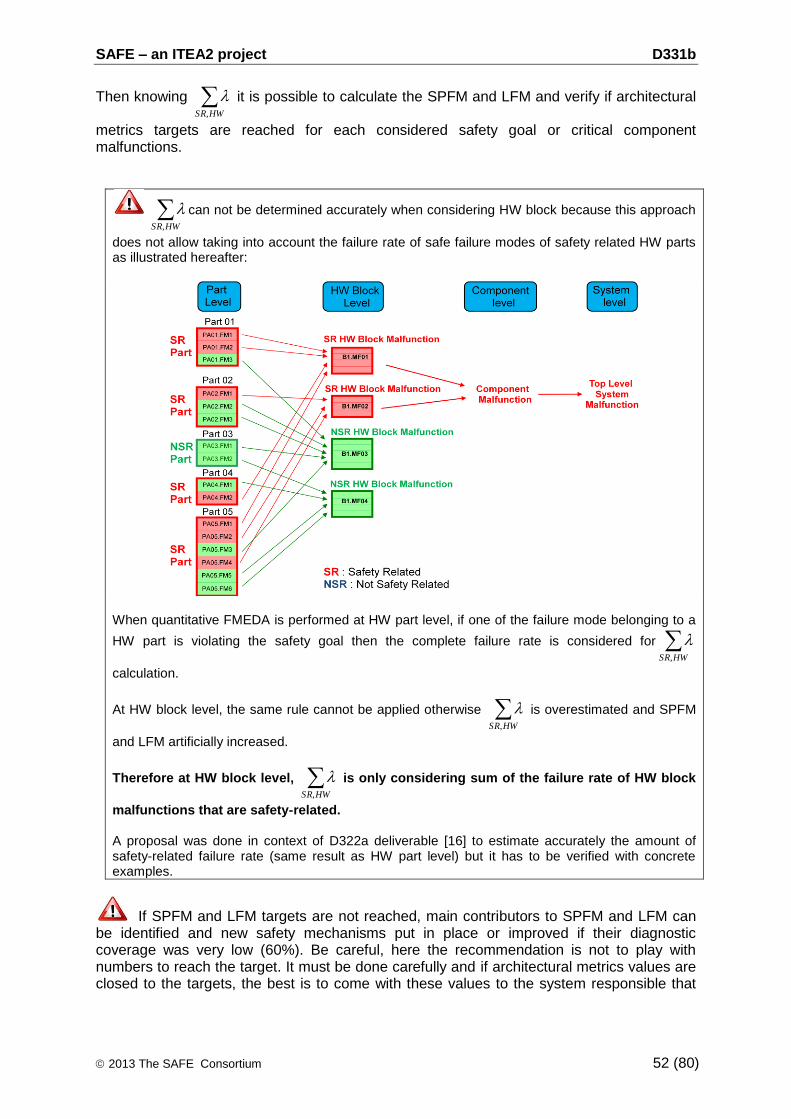
SAFE – an ITEA2 project D331b
2013 The SAFE Consortium 52 (80)
Then knowing HWSR,
it is possible to calculate the SPFM and LFM and verify if architectural
metrics targets are reached for each considered safety goal or critical component malfunctions.
HWSR,
can not be determined accurately when considering HW block because this approach
does not allow taking into account the failure rate of safe failure modes of safety related HW parts as illustrated hereafter:
When quantitative FMEDA is performed at HW part level, if one of the failure mode belonging to a
HW part is violating the safety goal then the complete failure rate is considered for HWSR,
calculation.
At HW block level, the same rule cannot be applied otherwise HWSR,
is overestimated and SPFM
and LFM artificially increased.
Therefore at HW block level, HWSR,
is only considering sum of the failure rate of HW block
malfunctions that are safety-related. A proposal was done in context of D322a deliverable [16] to estimate accurately the amount of safety-related failure rate (same result as HW part level) but it has to be verified with concrete examples.
If SPFM and LFM targets are not reached, main contributors to SPFM and LFM can be identified and new safety mechanisms put in place or improved if their diagnostic coverage was very low (60%). Be careful, here the recommendation is not to play with numbers to reach the target. It must be done carefully and if architectural metrics values are closed to the targets, the best is to come with these values to the system responsible that
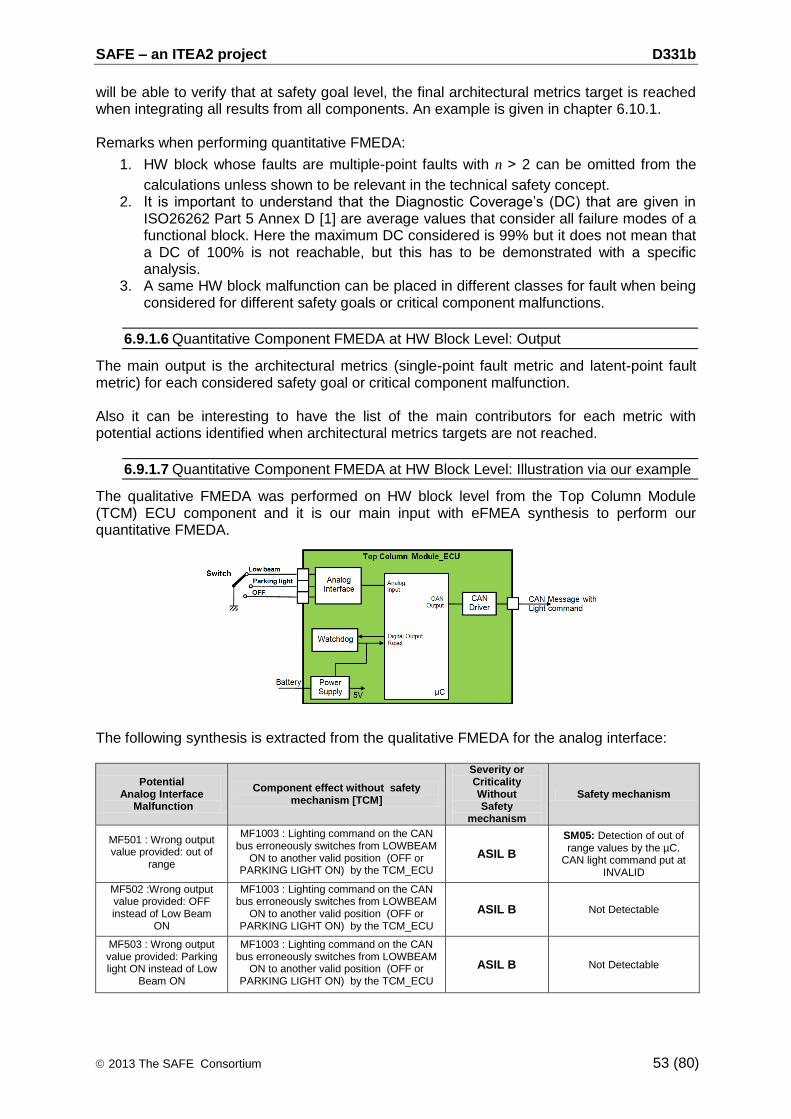
SAFE – an ITEA2 project D331b
2013 The SAFE Consortium 53 (80)
will be able to verify that at safety goal level, the final architectural metrics target is reached when integrating all results from all components. An example is given in chapter 6.10.1. Remarks when performing quantitative FMEDA:
1. HW block whose faults are multiple-point faults with n > 2 can be omitted from the
calculations unless shown to be relevant in the technical safety concept. 2. It is important to understand that the Diagnostic Coverage’s (DC) that are given in
ISO26262 Part 5 Annex D [1] are average values that consider all failure modes of a functional block. Here the maximum DC considered is 99% but it does not mean that a DC of 100% is not reachable, but this has to be demonstrated with a specific analysis.
3. A same HW block malfunction can be placed in different classes for fault when being considered for different safety goals or critical component malfunctions.
6.9.1.6 Quantitative Component FMEDA at HW Block Level: Output
The main output is the architectural metrics (single-point fault metric and latent-point fault metric) for each considered safety goal or critical component malfunction. Also it can be interesting to have the list of the main contributors for each metric with potential actions identified when architectural metrics targets are not reached.
6.9.1.7 Quantitative Component FMEDA at HW Block Level: Illustration via our example
The qualitative FMEDA was performed on HW block level from the Top Column Module (TCM) ECU component and it is our main input with eFMEA synthesis to perform our quantitative FMEDA.
The following synthesis is extracted from the qualitative FMEDA for the analog interface:
Potential Analog Interface
Malfunction
Component effect without safety mechanism [TCM]
Severity or Criticality Without Safety
mechanism
Safety mechanism
MF501 : Wrong output value provided: out of
range
MF1003 : Lighting command on the CAN bus erroneously switches from LOWBEAM
ON to another valid position (OFF or PARKING LIGHT ON) by the TCM_ECU
ASIL B
SM05: Detection of out of range values by the µC.
CAN light command put at INVALID
MF502 :Wrong output value provided: OFF instead of Low Beam
ON
MF1003 : Lighting command on the CAN bus erroneously switches from LOWBEAM
ON to another valid position (OFF or PARKING LIGHT ON) by the TCM_ECU
ASIL B Not Detectable
MF503 : Wrong output value provided: Parking light ON instead of Low
Beam ON
MF1003 : Lighting command on the CAN bus erroneously switches from LOWBEAM
ON to another valid position (OFF or PARKING LIGHT ON) by the TCM_ECU
ASIL B Not Detectable
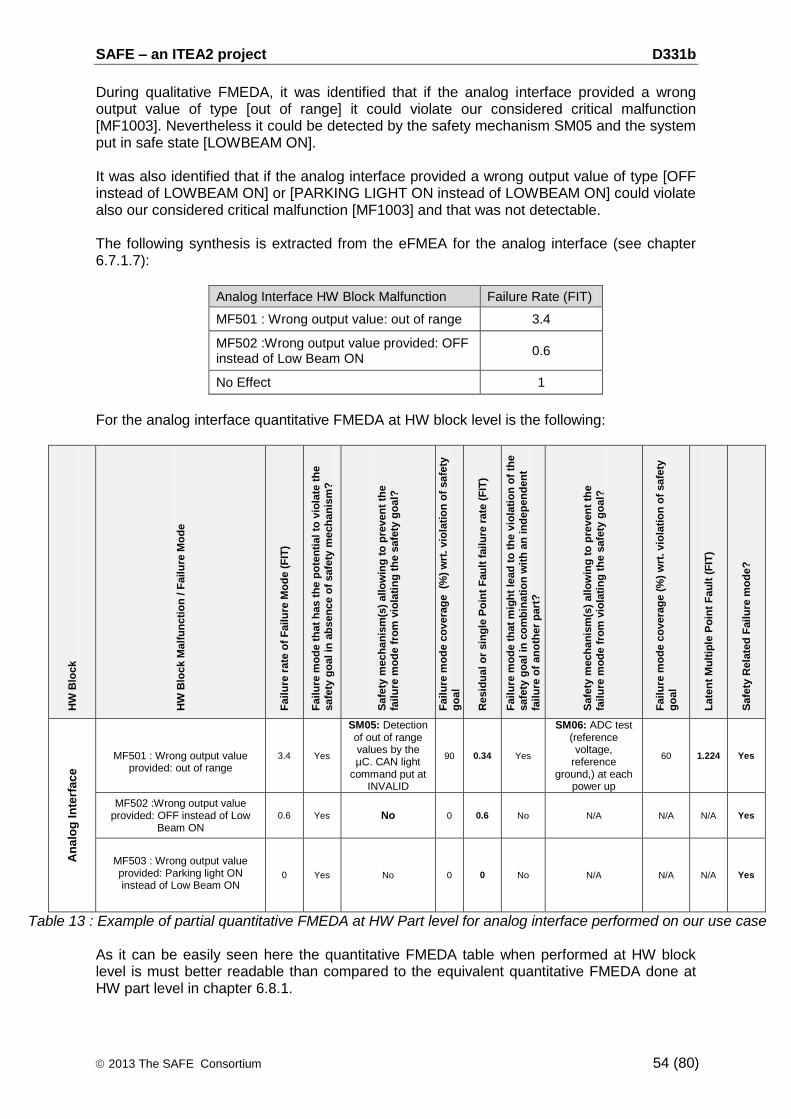
SAFE – an ITEA2 project D331b
2013 The SAFE Consortium 54 (80)
During qualitative FMEDA, it was identified that if the analog interface provided a wrong output value of type [out of range] it could violate our considered critical malfunction [MF1003]. Nevertheless it could be detected by the safety mechanism SM05 and the system put in safe state [LOWBEAM ON]. It was also identified that if the analog interface provided a wrong output value of type [OFF instead of LOWBEAM ON] or [PARKING LIGHT ON instead of LOWBEAM ON] could violate also our considered critical malfunction [MF1003] and that was not detectable. The following synthesis is extracted from the eFMEA for the analog interface (see chapter 6.7.1.7):
Analog Interface HW Block Malfunction Failure Rate (FIT)
MF501 : Wrong output value: out of range 3.4
MF502 :Wrong output value provided: OFF instead of Low Beam ON
0.6
No Effect 1
For the analog interface quantitative FMEDA at HW block level is the following:
HW
Blo
ck
HW
Blo
ck M
alf
un
cti
on
/ F
ailu
re M
od
e
Fa
ilu
re r
ate
of
Fa
ilu
re M
od
e (
FIT
)
Fa
ilu
re m
od
e t
ha
t h
as t
he p
ote
nti
al
to v
iola
te t
he
safe
ty g
oa
l in
ab
sen
ce o
f safe
ty m
ech
an
ism
?
Safe
ty m
ech
an
ism
(s)
allo
win
g t
o p
reven
t th
e
fail
ure
mo
de
fro
m v
iola
tin
g t
he
safe
ty g
oa
l?
Fa
ilu
re m
od
e c
ov
era
ge
(%
) w
rt. vio
lati
on
of
safe
ty
go
al
Resid
ua
l o
r sin
gle
Po
int
Fau
lt f
ail
ure
rate
(F
IT)
Fa
ilu
re m
od
e t
ha
t m
igh
t le
ad
to
th
e v
iola
tio
n o
f th
e
safe
ty g
oa
l in
co
mb
ina
tio
n w
ith
an
in
de
pen
den
t
fail
ure
of
an
oth
er
pa
rt?
Safe
ty m
ech
an
ism
(s)
allo
win
g t
o p
reven
t th
e
fail
ure
mo
de
fro
m v
iola
tin
g t
he
safe
ty g
oa
l?
Fa
ilu
re m
od
e c
ov
era
ge
(%
) w
rt. vio
lati
on
of
safe
ty
go
al
La
ten
t M
ult
iple
Po
int
Fa
ult
(F
IT)
Safe
ty R
ela
ted
Fail
ure
mo
de
?
An
alo
g I
nte
rfac
e
MF501 : Wrong output value provided: out of range
3.4 Yes
SM05: Detection of out of range values by the µC. CAN light
command put at INVALID
90 0.34 Yes
SM06: ADC test (reference voltage,
reference ground,) at each
power up
60 1.224 Yes
MF502 :Wrong output value provided: OFF instead of Low
Beam ON
0.6 Yes No 0 0.6 No N/A N/A N/A Yes
MF503 : Wrong output value provided: Parking light ON instead of Low Beam ON
0 Yes No 0 0 No N/A N/A N/A Yes
Table 13 : Example of partial quantitative FMEDA at HW Part level for analog interface performed on our use case
As it can be easily seen here the quantitative FMEDA table when performed at HW block level is must better readable than compared to the equivalent quantitative FMEDA done at HW part level in chapter 6.8.1.
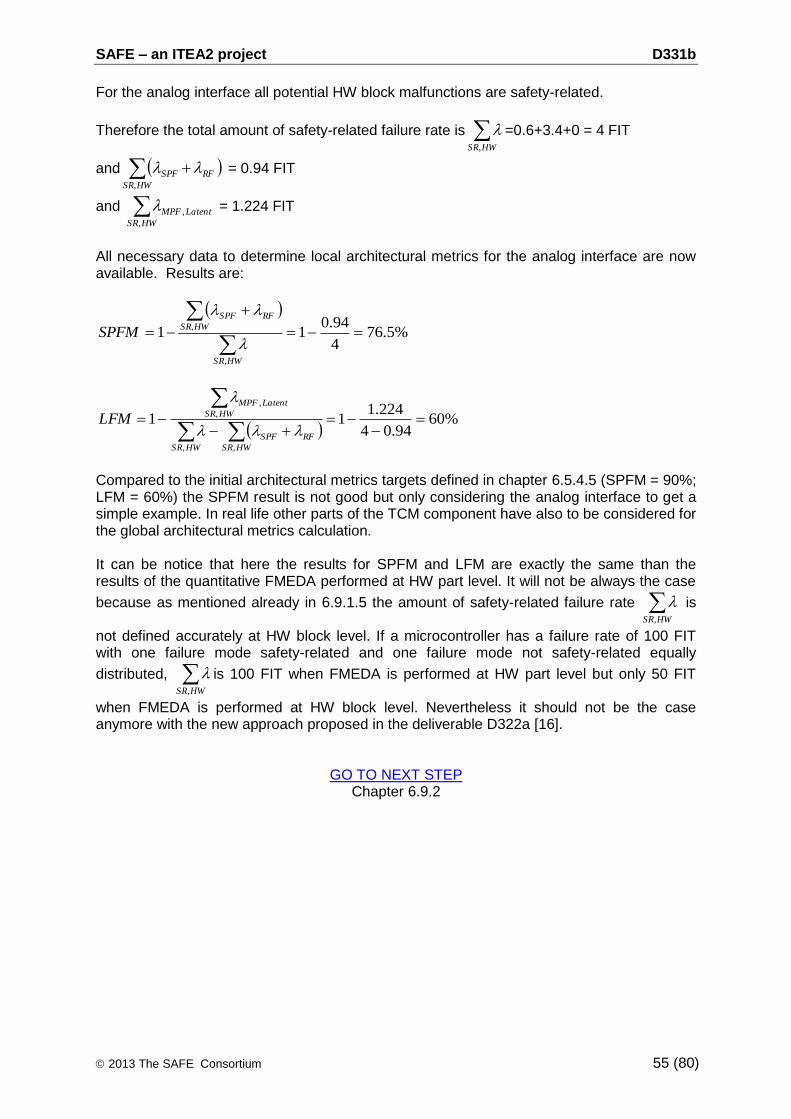
SAFE – an ITEA2 project D331b
2013 The SAFE Consortium 55 (80)
For the analog interface all potential HW block malfunctions are safety-related.
Therefore the total amount of safety-related failure rate is HWSR,
=0.6+3.4+0 = 4 FIT
and HWSR
RFSPF
,
= 0.94 FIT
and HWSR
LatentMPF
,
, = 1.224 FIT
All necessary data to determine local architectural metrics for the analog interface are now available. Results are:
%5.76
4
94.011
,
,
HWSR
HWSR
RFSPF
SPFM
%60
94.04
224.111
,,
,
,
HWSR
RFSPF
HWSR
HWSR
LatentMPF
LFM
Compared to the initial architectural metrics targets defined in chapter 6.5.4.5 (SPFM = 90%; LFM = 60%) the SPFM result is not good but only considering the analog interface to get a simple example. In real life other parts of the TCM component have also to be considered for the global architectural metrics calculation.
It can be notice that here the results for SPFM and LFM are exactly the same than the results of the quantitative FMEDA performed at HW part level. It will not be always the case
because as mentioned already in 6.9.1.5 the amount of safety-related failure rate HWSR,
is
not defined accurately at HW block level. If a microcontroller has a failure rate of 100 FIT with one failure mode safety-related and one failure mode not safety-related equally
distributed, HWSR,
is 100 FIT when FMEDA is performed at HW part level but only 50 FIT
when FMEDA is performed at HW block level. Nevertheless it should not be the case anymore with the new approach proposed in the deliverable D322a [16].
GO TO NEXT STEP Chapter 6.9.2
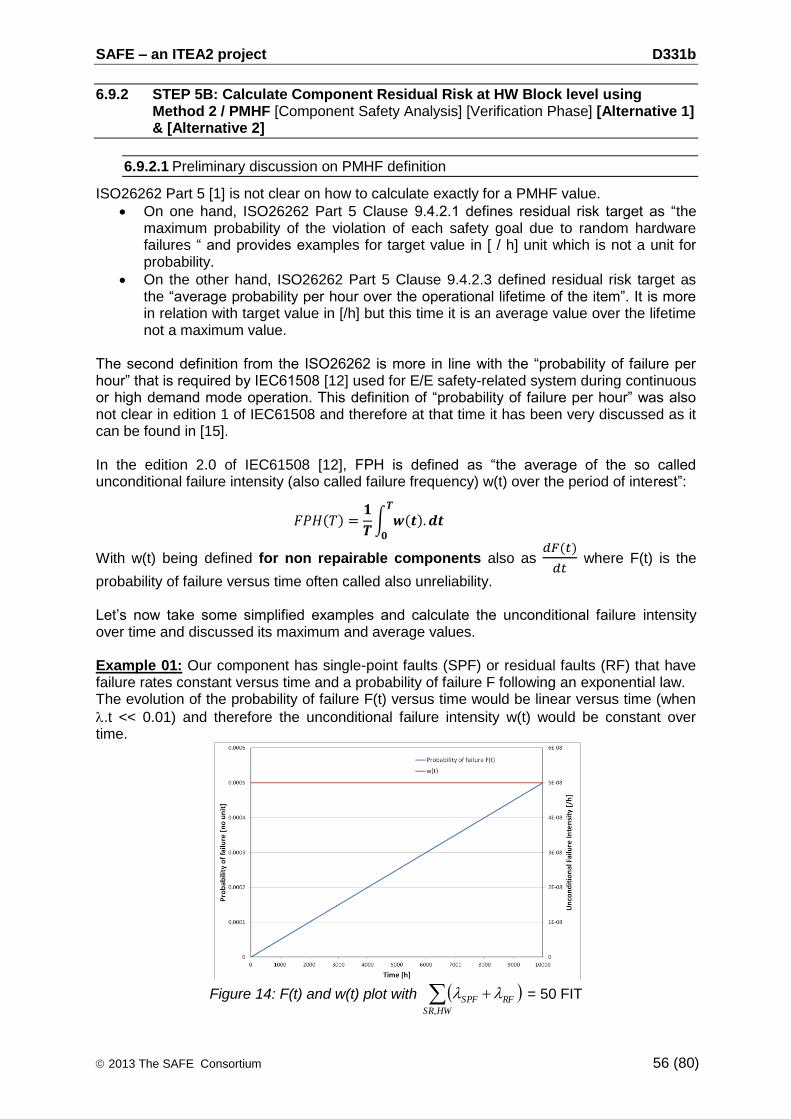
SAFE – an ITEA2 project D331b
2013 The SAFE Consortium 56 (80)
6.9.2 STEP 5B: Calculate Component Residual Risk at HW Block level using Method 2 / PMHF [Component Safety Analysis] [Verification Phase] [Alternative 1] & [Alternative 2]
6.9.2.1 Preliminary discussion on PMHF definition
ISO26262 Part 5 [1] is not clear on how to calculate exactly for a PMHF value.
On one hand, ISO26262 Part 5 Clause 9.4.2.1 defines residual risk target as “the maximum probability of the violation of each safety goal due to random hardware failures “ and provides examples for target value in [ / h] unit which is not a unit for probability.
On the other hand, ISO26262 Part 5 Clause 9.4.2.3 defined residual risk target as the “average probability per hour over the operational lifetime of the item”. It is more in relation with target value in [/h] but this time it is an average value over the lifetime not a maximum value.
The second definition from the ISO26262 is more in line with the “probability of failure per hour” that is required by IEC61508 [12] used for E/E safety-related system during continuous or high demand mode operation. This definition of “probability of failure per hour” was also not clear in edition 1 of IEC61508 and therefore at that time it has been very discussed as it can be found in [15]. In the edition 2.0 of IEC61508 [12], FPH is defined as “the average of the so called unconditional failure intensity (also called failure frequency) w(t) over the period of interest”:
With w(t) being defined for non repairable components also as
where F(t) is the
probability of failure versus time often called also unreliability. Let’s now take some simplified examples and calculate the unconditional failure intensity over time and discussed its maximum and average values. Example 01: Our component has single-point faults (SPF) or residual faults (RF) that have failure rates constant versus time and a probability of failure F following an exponential law. The evolution of the probability of failure F(t) versus time would be linear versus time (when
.t << 0.01) and therefore the unconditional failure intensity w(t) would be constant over time.
Figure 14: F(t) and w(t) plot with HWSR
RFSPF
,
= 50 FIT
SAFE – an ITEA2 project D331b
2013 The SAFE Consortium 57 (80)
Then in this case the w(t) HWSR
RFSPF
,
and latent dual-point fault can be generally
neglected even if they have high failure rate. So calculating this time an average value of the unconditional failure intensity over the period of interest or considering the maximum value over the period of interest produces the same result. Example 02: Our component has neither single-point fault (SPF) nor residual fault (RF) but only latent dual-point faults (remaining latent over the lifetime) that have failure rates constant versus time and a probability of failure F following an exponential law.
In this case the resulting probability of failure is not anymore linear (when .t << 0.01) but
follows a polynomial law of degree 2 (F(t) 1.2.t²). Therefore the unconditional failure intensity is also not anymore constant versus time but linear. Considering the maximum value or the average value does not give the same results. In this case even the average value is optimistic (factor 2) compared to maximum value.
Figure 15: F(t) and w(t) plot with 2 latent faults combined (1 = 50 FIT and 2 =30FIT)
So it can be seen with these two simple examples that calculating the maximum value of unconditional failure intensity during lifetime or taking the average value does not provide the same results. Also if we also consider periodic testing, repair when a critical fault is detected, etc…it is much more complex and therefore the best definition and more secure one is to calculate the evolution of unconditional failure intensity during lifetime and get the maximum value.
PMHF = max of w (t) during the lifetime
6.9.2.2 PMHF calculation using Quantitative Component FTA: Application rules
As for Qualitative System FTA, quantitative System FTA is required for ASIL C and ASIL D safety goals and recommended for ASIL B safety goals.
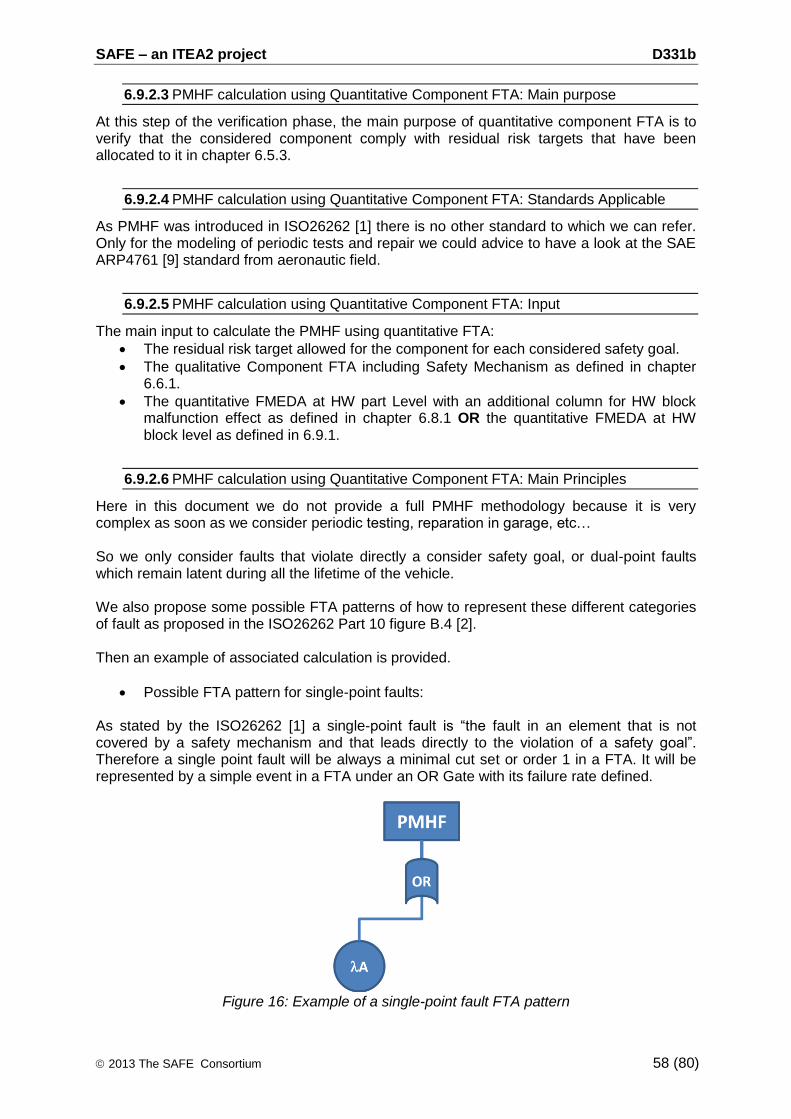
SAFE – an ITEA2 project D331b
2013 The SAFE Consortium 58 (80)
6.9.2.3 PMHF calculation using Quantitative Component FTA: Main purpose
At this step of the verification phase, the main purpose of quantitative component FTA is to verify that the considered component comply with residual risk targets that have been allocated to it in chapter 6.5.3.
6.9.2.4 PMHF calculation using Quantitative Component FTA: Standards Applicable
As PMHF was introduced in ISO26262 [1] there is no other standard to which we can refer. Only for the modeling of periodic tests and repair we could advice to have a look at the SAE ARP4761 [9] standard from aeronautic field.
6.9.2.5 PMHF calculation using Quantitative Component FTA: Input
The main input to calculate the PMHF using quantitative FTA:
The residual risk target allowed for the component for each considered safety goal.
The qualitative Component FTA including Safety Mechanism as defined in chapter 6.6.1.
The quantitative FMEDA at HW part Level with an additional column for HW block malfunction effect as defined in chapter 6.8.1 OR the quantitative FMEDA at HW block level as defined in 6.9.1.
6.9.2.6 PMHF calculation using Quantitative Component FTA: Main Principles
Here in this document we do not provide a full PMHF methodology because it is very complex as soon as we consider periodic testing, reparation in garage, etc… So we only consider faults that violate directly a consider safety goal, or dual-point faults which remain latent during all the lifetime of the vehicle. We also propose some possible FTA patterns of how to represent these different categories of fault as proposed in the ISO26262 Part 10 figure B.4 [2]. Then an example of associated calculation is provided.
Possible FTA pattern for single-point faults:
As stated by the ISO26262 [1] a single-point fault is “the fault in an element that is not covered by a safety mechanism and that leads directly to the violation of a safety goal”. Therefore a single point fault will be always a minimal cut set or order 1 in a FTA. It will be represented by a simple event in a FTA under an OR Gate with its failure rate defined.
Figure 16: Example of a single-point fault FTA pattern
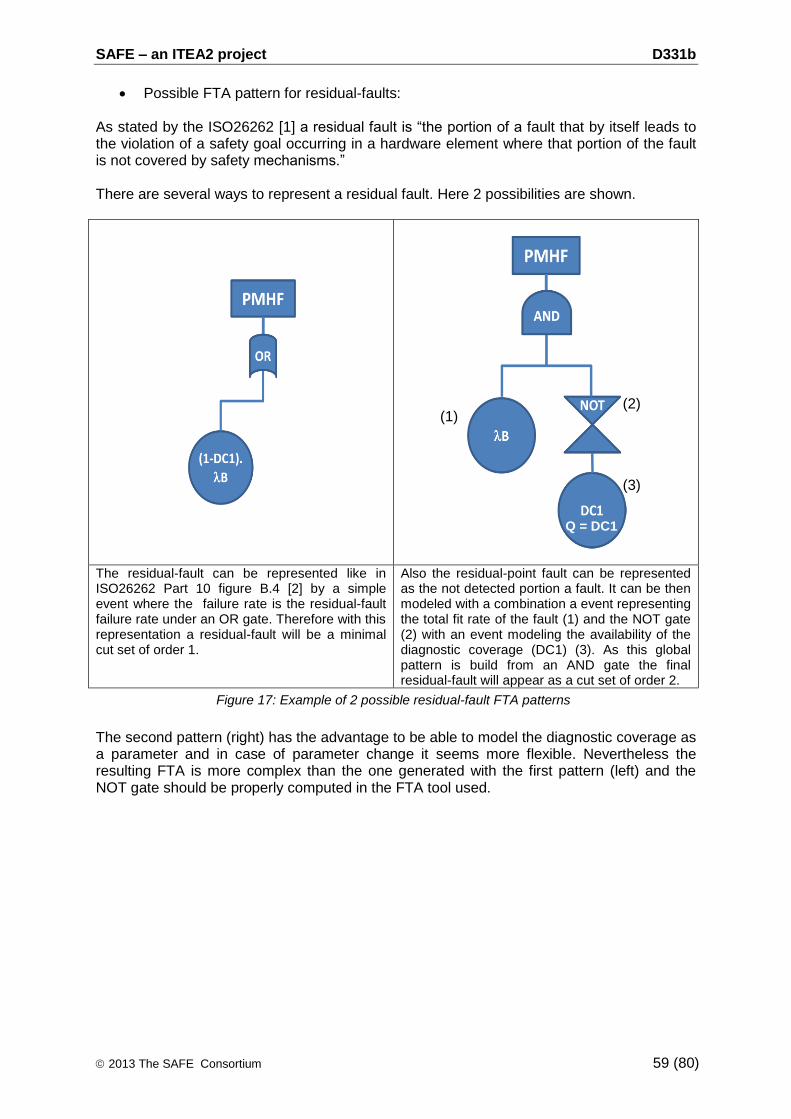
SAFE – an ITEA2 project D331b
2013 The SAFE Consortium 59 (80)
Possible FTA pattern for residual-faults:
As stated by the ISO26262 [1] a residual fault is “the portion of a fault that by itself leads to the violation of a safety goal occurring in a hardware element where that portion of the fault is not covered by safety mechanisms.” There are several ways to represent a residual fault. Here 2 possibilities are shown.
The residual-fault can be represented like in ISO26262 Part 10 figure B.4 [2] by a simple event where the failure rate is the residual-fault failure rate under an OR gate. Therefore with this representation a residual-fault will be a minimal cut set of order 1.
Also the residual-point fault can be represented as the not detected portion a fault. It can be then modeled with a combination a event representing the total fit rate of the fault (1) and the NOT gate (2) with an event modeling the availability of the diagnostic coverage (DC1) (3). As this global pattern is build from an AND gate the final residual-fault will appear as a cut set of order 2.
Figure 17: Example of 2 possible residual-fault FTA patterns
The second pattern (right) has the advantage to be able to model the diagnostic coverage as a parameter and in case of parameter change it seems more flexible. Nevertheless the resulting FTA is more complex than the one generated with the first pattern (left) and the NOT gate should be properly computed in the FTA tool used.
(1) (2)
(3)
Q = DC1
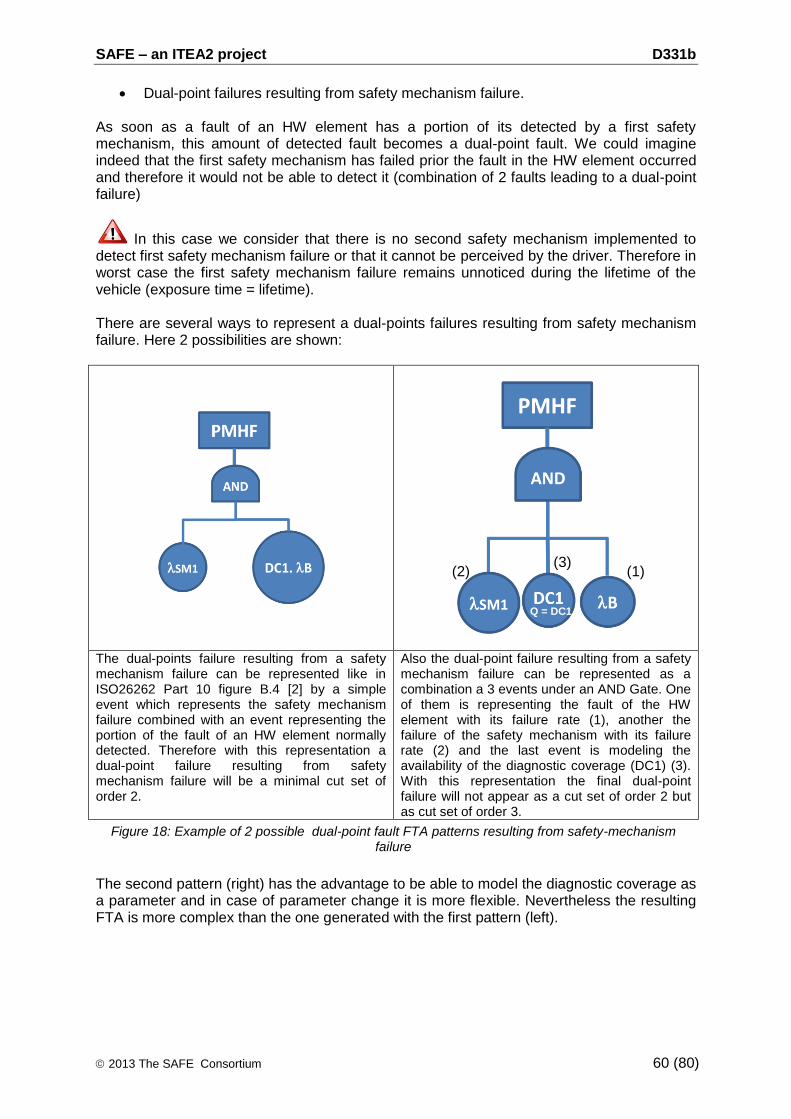
SAFE – an ITEA2 project D331b
2013 The SAFE Consortium 60 (80)
Dual-point failures resulting from safety mechanism failure.
As soon as a fault of an HW element has a portion of its detected by a first safety mechanism, this amount of detected fault becomes a dual-point fault. We could imagine indeed that the first safety mechanism has failed prior the fault in the HW element occurred and therefore it would not be able to detect it (combination of 2 faults leading to a dual-point failure)
In this case we consider that there is no second safety mechanism implemented to detect first safety mechanism failure or that it cannot be perceived by the driver. Therefore in worst case the first safety mechanism failure remains unnoticed during the lifetime of the vehicle (exposure time = lifetime). There are several ways to represent a dual-points failures resulting from safety mechanism failure. Here 2 possibilities are shown:
The dual-points failure resulting from a safety mechanism failure can be represented like in ISO26262 Part 10 figure B.4 [2] by a simple event which represents the safety mechanism failure combined with an event representing the portion of the fault of an HW element normally detected. Therefore with this representation a dual-point failure resulting from safety mechanism failure will be a minimal cut set of order 2.
Also the dual-point failure resulting from a safety mechanism failure can be represented as a combination a 3 events under an AND Gate. One of them is representing the fault of the HW element with its failure rate (1), another the failure of the safety mechanism with its failure rate (2) and the last event is modeling the availability of the diagnostic coverage (DC1) (3). With this representation the final dual-point failure will not appear as a cut set of order 2 but as cut set of order 3.
Figure 18: Example of 2 possible dual-point fault FTA patterns resulting from safety-mechanism failure
The second pattern (right) has the advantage to be able to model the diagnostic coverage as a parameter and in case of parameter change it is more flexible. Nevertheless the resulting FTA is more complex than the one generated with the first pattern (left).
(1)
Q = DC1
(2) (3)
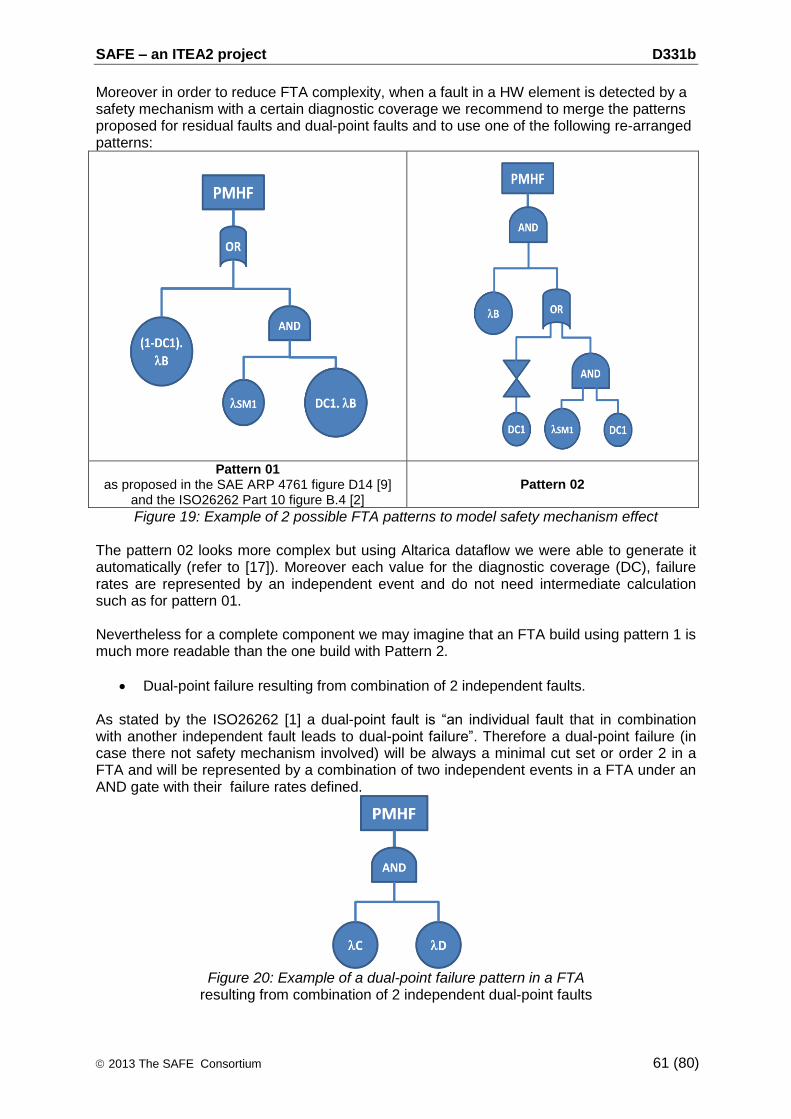
SAFE – an ITEA2 project D331b
2013 The SAFE Consortium 61 (80)
Moreover in order to reduce FTA complexity, when a fault in a HW element is detected by a safety mechanism with a certain diagnostic coverage we recommend to merge the patterns proposed for residual faults and dual-point faults and to use one of the following re-arranged patterns:
Pattern 01 as proposed in the SAE ARP 4761 figure D14 [9]
and the ISO26262 Part 10 figure B.4 [2] Pattern 02
Figure 19: Example of 2 possible FTA patterns to model safety mechanism effect The pattern 02 looks more complex but using Altarica dataflow we were able to generate it automatically (refer to [17]). Moreover each value for the diagnostic coverage (DC), failure rates are represented by an independent event and do not need intermediate calculation such as for pattern 01. Nevertheless for a complete component we may imagine that an FTA build using pattern 1 is much more readable than the one build with Pattern 2.
Dual-point failure resulting from combination of 2 independent faults.
As stated by the ISO26262 [1] a dual-point fault is “an individual fault that in combination with another independent fault leads to dual-point failure”. Therefore a dual-point failure (in case there not safety mechanism involved) will be always a minimal cut set or order 2 in a FTA and will be represented by a combination of two independent events in a FTA under an AND gate with their failure rates defined.
Figure 20: Example of a dual-point failure pattern in a FTA
resulting from combination of 2 independent dual-point faults

SAFE – an ITEA2 project D331b
2013 The SAFE Consortium 62 (80)
There will be one FTA per considered safety goal. The unconditional failure intensity has to be calculated over the lifetime and the maximum value considered for the PMHF.
6.9.2.7 PMHF calculation using Quantitative Component FTA: Output
The main output from this verification phase is:
Compliance status for the residual risk metrics for each safety goal at component level compared to targets.
Adequate measures with action plan if we are not compliant with targets for a considered safety goal.
6.9.2.8 PMHF calculation using Quantitative Component FTA: Illustration via our example
Let’s consider the light system example and here more particularly the Top Column Module (TCM) ECU.
The Component FTA was performed in chapter 6.6.2.7 from which we got the following results:
For the malfunction of the analog interface [MF501] a safety mechanism was implemented to detect a portion of it. It was not shown in the previous examples safety mechanism to control the other analog interface malfunction [MF401] and [MF902].
AI_E001
[Analog Interface] MF501 :
Wrong output value provided:
out of range
IE
AI_E002
[Analog Interface] MF502 :Wrong output value provided: OFF instead of
Low Beam ON
IE
AI_E003
[Analog Interface] MF503 : Wrong output value provided: Parking light ON
instead of Low Beam ON
IE
PS_E004
[Power Supply Unit]
MF401 : Low v oltage(<
5V) prov ided
IE
MC_E005
[Microcontroller] MF901 : Wrong elaboration of the CAN Light command (another valid position instead of LOW
BEAM ON)
IE
MC_E006
[Microcontroller] MF902 : Wrong Light command (another valid position instead of LOW BEAM ON) sent on the CAN
bus
IE
OR
MF1003 : Lighting command on the CAN bus erroneously switches from
LOWBEAM ON to another valid position (OFF or PARKING LIGHT
ON) by the TCM_ECU

SAFE – an ITEA2 project D331b
2013 The SAFE Consortium 63 (80)
The resulting quantitative FTA modeling the different safety mechanisms could be:
Figure 21: Example for quantitative component FTA for the TCM_ECU for SG_01
As it can be seen such FTA performed at HW block level is much readable that those performed at HW part level. The final calculation give an unconditional failure intensity or failure frequency of 9.7 FIT. We are much below the initial target of 50 FIT that was allocated to our componenent. IResult can be predicted as there are single-point faults and residual faults in our
component, the PMHF can be easily approximate to HWSR
RFSPF
,
.
When single-point faults and residual faults are remaining in a component for a considered safety goal, a good mean to compare consistency of results between quantitative FMEDA and quantitative FTA is to compare the results as they will be very similar. Therefore the strong effort spent to model dual point faults with possible different exposure time, etc… is done most of the time for nearly limited added value.
When quantitative FMEDA is performed at HW part level (see chapter 6.8.1) the fact to add a new column with the potential failure mode effect at output of the HW block permit to have the link with the quantitative FTA performed at HW block level.
Q=3.4e-9 w=3.4e-9
AI_E001
[MF501] : Wrong output v alue prov ided: out of
range
IE
Q=4.5e-8 w=4.5e-8
SM05_E001
Safety Mechansim [TCM_SM05] failure
IE
Q=0.9 w=0.0
SC_SM05
Diagnostic Cov erage of Saf ety Mechansim
[TCM_SM05]
IE R
Q=4e-8 w=4e-8
AND02
[TCM_SM05] failure prior [MF501] failure
IE
Q=0.9 w=0.0
SC_SM05
Diagnostic Cov erage of Saf ety Mechansim
[TCM_SM05]
IE R
Q=0.1 w=0.0
NOT01
Portion of f ault NOT detected by [TCM_SM05]
IE
Q=0.1 w=3.6e-8
OR01
Non detection of [MF501] by [TCM_SM05]
IE
Q=3.4e-10 w=3.4e-10
AND01
[Analog Interface] MF501 : Wrong output value provided: out of range without [TCM_SM01]
detection
IE
Q=6e-10 w=6e-10
AI_E002
[Analog Interface] MF502 :Wrong output value provided: OFF instead of Low Beam ON
IE
Q=0.0 w=0.0
AI_E003
[Analog Interface] MF503 : Wrong output value provided: Parking light ON instead of Low
Beam ON
IE
Q=5e-9 w=5e-9
PS_E004
[Power Supply Unit] MF401 : Low v oltage(<
5V) prov ided
IE
Q=0.6 w=0.0
DC_SM09
Diagnostic Cov erage of Saf ety Mechansim
[TCM_SM09]
IE
Q=0.4 w=0.0
NOT02
Portion of f ault NOT detected by [TCM_SM09]
IE
Q=3e-8 w=3e-8
SM09_E001
Safety Mechansim [TCM_SM09] failure
IE
Q=0.6 w=0.0
DC_SM09
Diagnostic Cov erage of Saf ety Mechansim
[TCM_SM09]
IE R
Q=1.8e-8 w=1.8e-8
AND04
[TCM_SM09] failure prior [MF401] failure
IE
Q=0.4 w=1.1e-8
OR02
Non detection of [MF401] by [TCM_SM09]
IE
Q=2e-9 w=2e-9
AND03
[Power Supply Unit] MF401 : Low voltage(< 5V) provided without [TCM_SM09] detection
IE
Q=4.3e-9 w=4.3e-9
MC_E006
[Microcontroller] MF902 : Wrong Light command (another valid position instead of LOW BEAM ON) sent on the CAN bus
IE
Q=2.5e-8 w=2.5e-8
MC_E005
[Microcontroller] MF901 : Wrong elaboration of the CAN Light command (another valid position instead of LOW BEAM ON)
IE
Q=0.9 w=0.0
DC_SM11
Diagnostic Cov erage of Saf ety Mechansim
[TCM_SM11]
IE
Q=0.1 w=0.0
NOT03
Portion of f ault NOT detected by [TCM_SM11]
IE
Q=4.5e-8 w=4.5e-8
SM11_E001
Safety Mechansim [TCM_SM11] failure
IE
Q=0.9 w=0.0
DC_SM11
Diagnostic Cov erage of Saf ety Mechansim
[TCM_SM11]
IE R
Q=4e-8 w=4e-8
AND06
[TCM_SM11] failure prior [MF901] failure
IE
Q=0.1 w=3.6e-8
OR03
Non detection of [MF401] by [TCM_SM11]
IE
Q=2.5e-9 w=2.5e-9
AND05
[Microcontroller] MF902 : Wrong Light command (another valid position instead of LOW BEAM ON) sent on the CAN bus
without [TCM_SM11] detection
IE
Q=9.7e-9 w=9.7e-9
OR
MF1003 : Lighting command on the CAN bus erroneously switches from LOWBEAM ON to
another valid position (OFF or PARKING LIGHT ON) by the TCM_ECU
IE
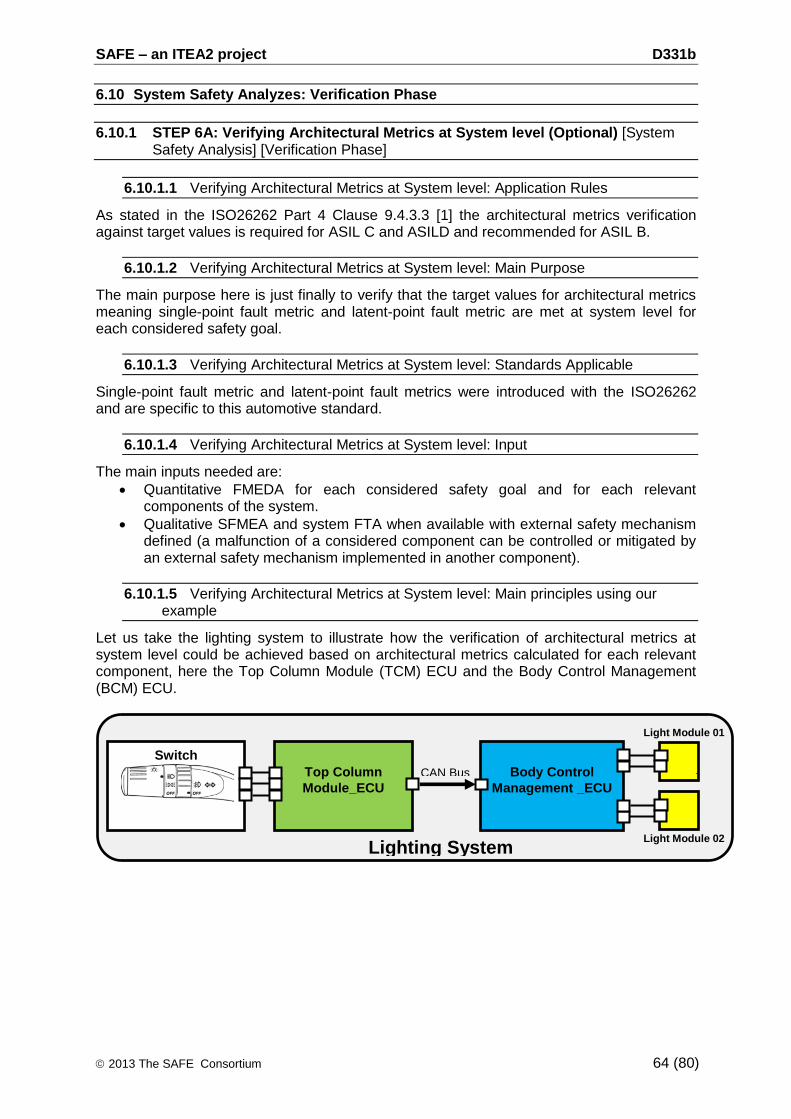
SAFE – an ITEA2 project D331b
2013 The SAFE Consortium 64 (80)
6.10 System Safety Analyzes: Verification Phase
6.10.1 STEP 6A: Verifying Architectural Metrics at System level (Optional) [System Safety Analysis] [Verification Phase]
6.10.1.1 Verifying Architectural Metrics at System level: Application Rules
As stated in the ISO26262 Part 4 Clause 9.4.3.3 [1] the architectural metrics verification against target values is required for ASIL C and ASILD and recommended for ASIL B.
6.10.1.2 Verifying Architectural Metrics at System level: Main Purpose
The main purpose here is just finally to verify that the target values for architectural metrics meaning single-point fault metric and latent-point fault metric are met at system level for each considered safety goal.
6.10.1.3 Verifying Architectural Metrics at System level: Standards Applicable
Single-point fault metric and latent-point fault metrics were introduced with the ISO26262 and are specific to this automotive standard.
6.10.1.4 Verifying Architectural Metrics at System level: Input
The main inputs needed are:
Quantitative FMEDA for each considered safety goal and for each relevant components of the system.
Qualitative SFMEA and system FTA when available with external safety mechanism defined (a malfunction of a considered component can be controlled or mitigated by an external safety mechanism implemented in another component).
6.10.1.5 Verifying Architectural Metrics at System level: Main principles using our example
Let us take the lighting system to illustrate how the verification of architectural metrics at system level could be achieved based on architectural metrics calculated for each relevant component, here the Top Column Module (TCM) ECU and the Body Control Management (BCM) ECU.
Top Column
Module_ECU
CAN Bus
Switch
Body Control
Management _ECU
Lighting System
Light Module 01
Light Module 02

SAFE – an ITEA2 project D331b
2013 The SAFE Consortium 65 (80)
From the different ECU suppliers data the following intermediate results synthesis is built:
For SG01 [ASIL B] TCM_ECU BCM_ECU
Single-Point Fault Metrics (SPFM)
87.5% 91%
Latent-Fault Metrics (LFM)
85.2% 72%
HWSR
RFSPF
,
9.7 FIT 22.05 FIT
HWSR
LatentMPF
,
, 10 FIT 62.4 FIT
HWSR,
77.65 FIT 245 FIT
SPFM target reached (90%)? No Yes
LFM target reached (60%)? Yes Yes
Table 14 : Example of architectural metrics data synthesis for different components For single-point fault metrics, the TCM ECU does not meet the individual target. That why the verification at system level is very important. For latent-fault metrics, both ECUs are individually meeting the target. So obviously it should be the same at system level, but for the example we performed the verification. Here for verification we could also use the same kind of template that is proposed for quantitative FMEDA. Nevertheless as we have only few components in our system we use the architectural metrics formulae with calculation as follows:
%.
.
..
,
, 15902456577
05227911
HWSR
HWSR
RFSPF
SPFM
OK
%
)..().(
.
,,
,
,
750522792456577
4621011
HWSR
RFSPF
HWSR
HWSR
LatentMPF
LFM
OK
So finally even if the local SPFM target was not reached for the Top Column Module ECU the final verification at system level showed that global SPFM target was met. The global LFM target is met at system level as expected.
If here we have had an external safety mechanism in the BCM_ECU that could detect a portion of the single-point fault and residual point faults generated by the TCM_ECU, then it should be taken into account in the global calculation.
6.10.1.6 Verifying Architectural Metrics at System level: Output
The main output from this verification phase is:
Compliance status for the architectural metrics for each safety goal at system level compared to target.
Adequate measures with action plan if we are not compliant with targets for a considered safety goal.
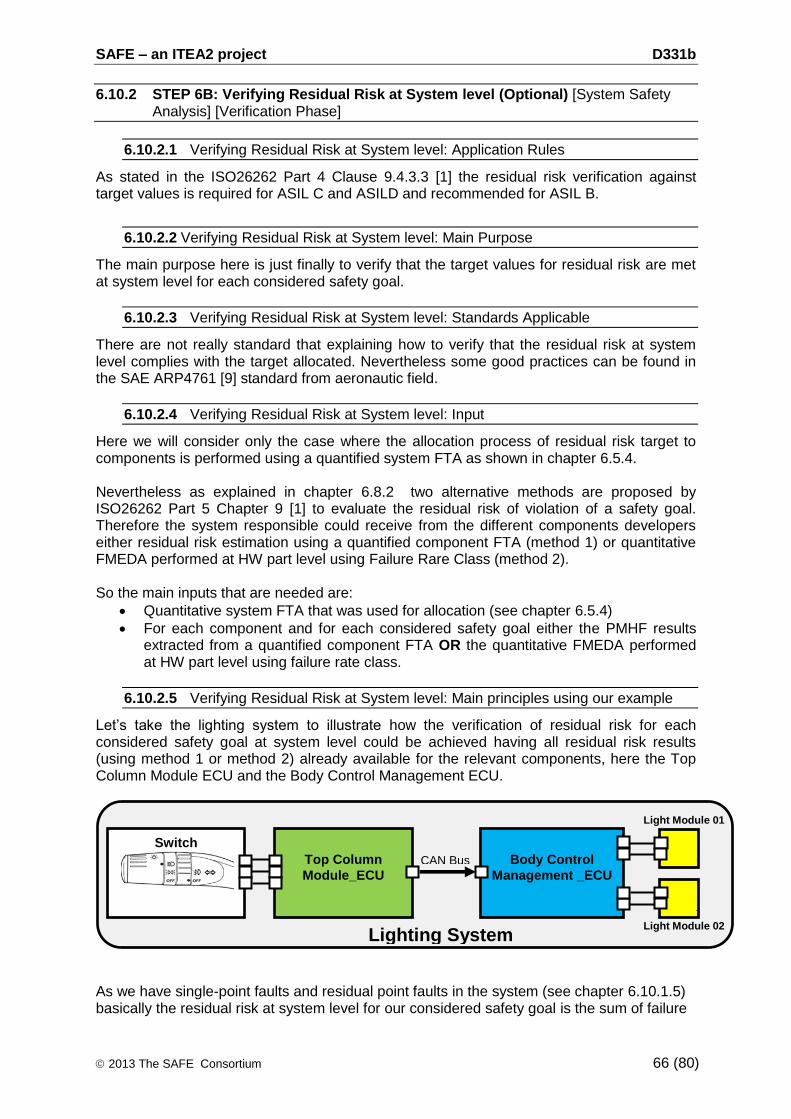
SAFE – an ITEA2 project D331b
2013 The SAFE Consortium 66 (80)
6.10.2 STEP 6B: Verifying Residual Risk at System level (Optional) [System Safety Analysis] [Verification Phase]
6.10.2.1 Verifying Residual Risk at System level: Application Rules
As stated in the ISO26262 Part 4 Clause 9.4.3.3 [1] the residual risk verification against target values is required for ASIL C and ASILD and recommended for ASIL B.
6.10.2.2 Verifying Residual Risk at System level: Main Purpose
The main purpose here is just finally to verify that the target values for residual risk are met at system level for each considered safety goal.
6.10.2.3 Verifying Residual Risk at System level: Standards Applicable
There are not really standard that explaining how to verify that the residual risk at system level complies with the target allocated. Nevertheless some good practices can be found in the SAE ARP4761 [9] standard from aeronautic field.
6.10.2.4 Verifying Residual Risk at System level: Input
Here we will consider only the case where the allocation process of residual risk target to components is performed using a quantified system FTA as shown in chapter 6.5.4. Nevertheless as explained in chapter 6.8.2 two alternative methods are proposed by ISO26262 Part 5 Chapter 9 [1] to evaluate the residual risk of violation of a safety goal. Therefore the system responsible could receive from the different components developers either residual risk estimation using a quantified component FTA (method 1) or quantitative FMEDA performed at HW part level using Failure Rare Class (method 2). So the main inputs that are needed are:
Quantitative system FTA that was used for allocation (see chapter 6.5.4)
For each component and for each considered safety goal either the PMHF results extracted from a quantified component FTA OR the quantitative FMEDA performed at HW part level using failure rate class.
6.10.2.5 Verifying Residual Risk at System level: Main principles using our example
Let’s take the lighting system to illustrate how the verification of residual risk for each considered safety goal at system level could be achieved having all residual risk results (using method 1 or method 2) already available for the relevant components, here the Top Column Module ECU and the Body Control Management ECU.
As we have single-point faults and residual point faults in the system (see chapter 6.10.1.5) basically the residual risk at system level for our considered safety goal is the sum of failure
Top Column
Module_ECU CAN Bus
Switch
Body Control
Management _ECU
Lighting System
Light Module 01
Light Module 02
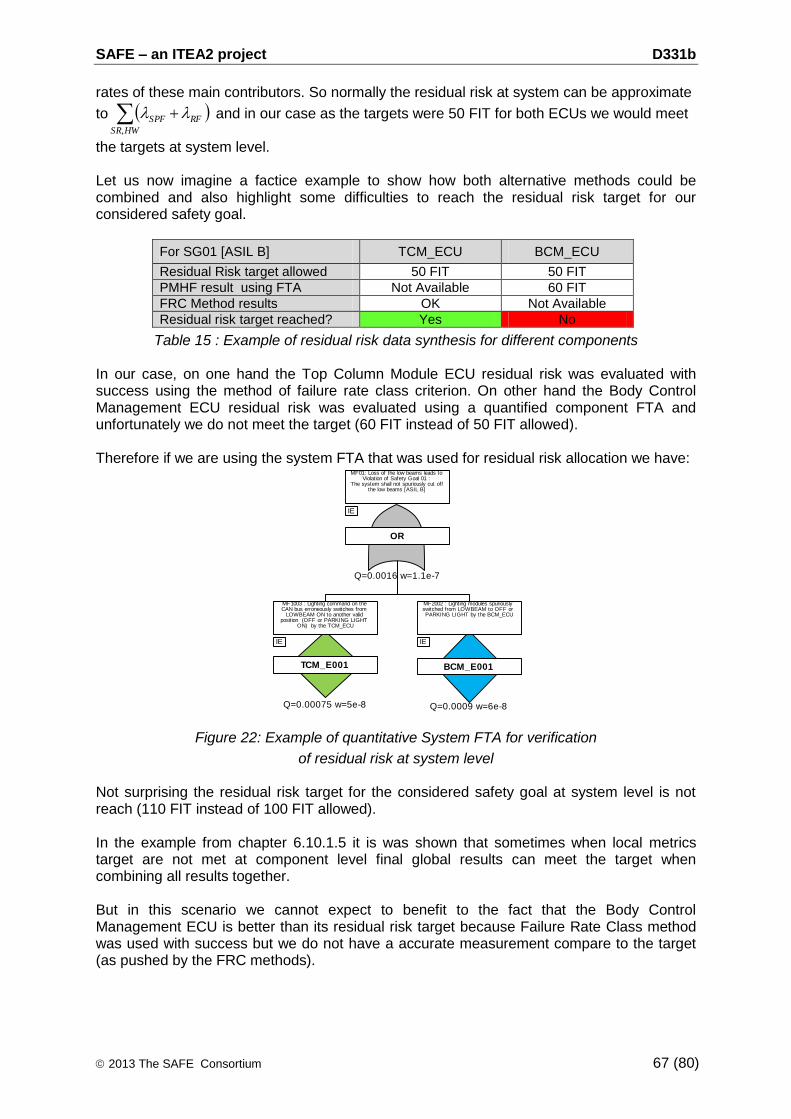
SAFE – an ITEA2 project D331b
2013 The SAFE Consortium 67 (80)
rates of these main contributors. So normally the residual risk at system can be approximate
to HWSR
RFSPF
,
and in our case as the targets were 50 FIT for both ECUs we would meet
the targets at system level. Let us now imagine a factice example to show how both alternative methods could be combined and also highlight some difficulties to reach the residual risk target for our considered safety goal.
For SG01 [ASIL B] TCM_ECU BCM_ECU
Residual Risk target allowed 50 FIT 50 FIT
PMHF result using FTA Not Available 60 FIT
FRC Method results OK Not Available
Residual risk target reached? Yes No
Table 15 : Example of residual risk data synthesis for different components In our case, on one hand the Top Column Module ECU residual risk was evaluated with success using the method of failure rate class criterion. On other hand the Body Control Management ECU residual risk was evaluated using a quantified component FTA and unfortunately we do not meet the target (60 FIT instead of 50 FIT allowed). Therefore if we are using the system FTA that was used for residual risk allocation we have:
Figure 22: Example of quantitative System FTA for verification
of residual risk at system level
Not surprising the residual risk target for the considered safety goal at system level is not reach (110 FIT instead of 100 FIT allowed). In the example from chapter 6.10.1.5 it is was shown that sometimes when local metrics target are not met at component level final global results can meet the target when combining all results together. But in this scenario we cannot expect to benefit to the fact that the Body Control Management ECU is better than its residual risk target because Failure Rate Class method was used with success but we do not have a accurate measurement compare to the target (as pushed by the FRC methods).
IE
Q=0.00075 w=5e-8
TCM_E001
MF1003 : Lighting command on the CAN bus erroneously switches from
LOWBEAM ON to another valid position (OFF or PARKING LIGHT
ON) by the TCM_ECU
Q=0.0009 w=6e-8
BCM_E001
MF2002 : Lighting modules spuriously switched from LOWBEAM to OFF or PARKING LIGHT by the BCM_ECU
IE
Q=0.0016 w=1.1e-7
OR
MF01: Loss of the low beams leads to Violation of Safety Goal 01 :
The system shall not spuriously cut off the low beams [ASIL B]
IE
SAFE – an ITEA2 project D331b
2013 The SAFE Consortium 68 (80)
So in real life we could be in a situation that we have to modify the design of the Body Control Management ECU to reach the residual risk at system level while we had lot of margin with the Top Column Module ECU.
As a short conclusion as shown above it is possible to mix the residual risk coming from different components evaluated with the 2 alternative methods (PMHF or Failure Rate Class) proposed by ISO26262 (refer to chapter 6.8.2). Nevertheless the use of Failure Rate Class method is not recommended because margin between the residual risk achieved versus the target cannot be estimated.
6.10.2.6 Verifying Residual Risk at System level: Output
The main output from this verification phase is:
Compliance status for the residual risk metrics for each safety goal at system level compared to targets.
Adequate measures with action plan if we are not compliant with targets for a considered safety goal.
SAFE – an ITEA2 project D331b
2013 The SAFE Consortium 69 (80)
7 Gaps analysis between proposed safety analyses and state of the art tools
7.1 « Safety» FMEAs versus Classical FMEAs.
The different safety FMEAs (SFMEA, FMEDA, eFMEA) are part of the safety process. They all aim at controlling propagation of internal failures (fault tolerance). Classic Design FMEA (DFMEA) and Process FMEA (PFMEA) are fundamentally different as they aim at fault avoidance (the design faults and process faults). DFMEA and PFMEA are not considered as safety activities. As these activities ensure the robustness of the design and the conformity of the production, they are considered as pre-requisites for safety activities. As these activities are important to reach an acceptable level of safety for a component development, they are part of the safety case. So gaps are clearly identified between our needs for safety FMEAs and what is seen today in most tools of the market that are mainly addressing FMEA for fault avoidance only. Therefore some requirements for such tools will be addressed in chapter 8.3.
7.2 Interface between qualitative and quantitative safety analyses.
In ISO26262 Part 9 Clause 8.2 [1] about safety analyses it is written than “Quantitative safety analyses complement qualitative safety analyses”. It is maybe true for FTA tools, starting from a qualitative FTA and then using quantification tool features to obtain a quantified FTA, via classical probabilistic law occurrence definition on basic event of the FTA. But between a qualitative FMEDA as it is proposed in chapter 6.6.1 and a quantitative FMEDA as it is proposed in chapter 6.9.1, there are clearly no link, in the most tools seen today, that could address both qualitative and quantitative methods for FMEA. Therefore some requirements for such tools will be addressed in chapter 8.3.
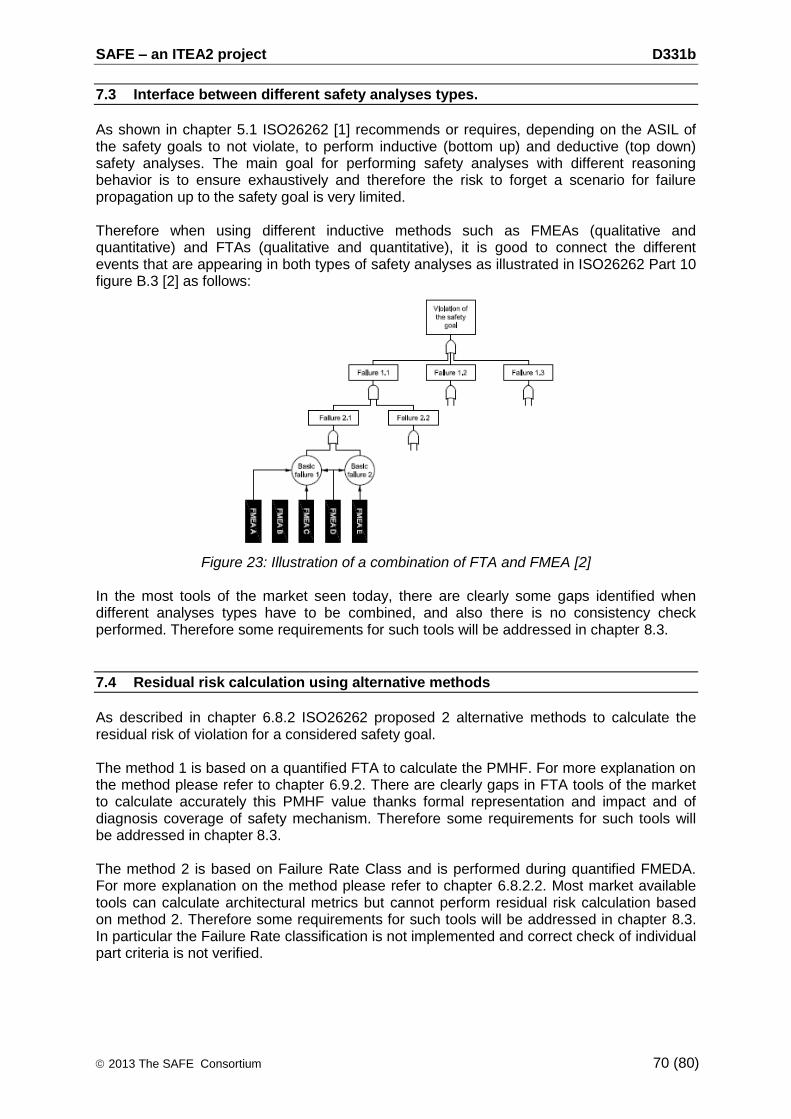
SAFE – an ITEA2 project D331b
2013 The SAFE Consortium 70 (80)
7.3 Interface between different safety analyses types.
As shown in chapter 5.1 ISO26262 [1] recommends or requires, depending on the ASIL of the safety goals to not violate, to perform inductive (bottom up) and deductive (top down) safety analyses. The main goal for performing safety analyses with different reasoning behavior is to ensure exhaustively and therefore the risk to forget a scenario for failure propagation up to the safety goal is very limited. Therefore when using different inductive methods such as FMEAs (qualitative and quantitative) and FTAs (qualitative and quantitative), it is good to connect the different events that are appearing in both types of safety analyses as illustrated in ISO26262 Part 10 figure B.3 [2] as follows:
Figure 23: Illustration of a combination of FTA and FMEA [2] In the most tools of the market seen today, there are clearly some gaps identified when different analyses types have to be combined, and also there is no consistency check performed. Therefore some requirements for such tools will be addressed in chapter 8.3.
7.4 Residual risk calculation using alternative methods
As described in chapter 6.8.2 ISO26262 proposed 2 alternative methods to calculate the residual risk of violation for a considered safety goal. The method 1 is based on a quantified FTA to calculate the PMHF. For more explanation on the method please refer to chapter 6.9.2. There are clearly gaps in FTA tools of the market to calculate accurately this PMHF value thanks formal representation and impact and of diagnosis coverage of safety mechanism. Therefore some requirements for such tools will be addressed in chapter 8.3. The method 2 is based on Failure Rate Class and is performed during quantified FMEDA. For more explanation on the method please refer to chapter 6.8.2.2. Most market available tools can calculate architectural metrics but cannot perform residual risk calculation based on method 2. Therefore some requirements for such tools will be addressed in chapter 8.3. In particular the Failure Rate classification is not implemented and correct check of individual part criteria is not verified.
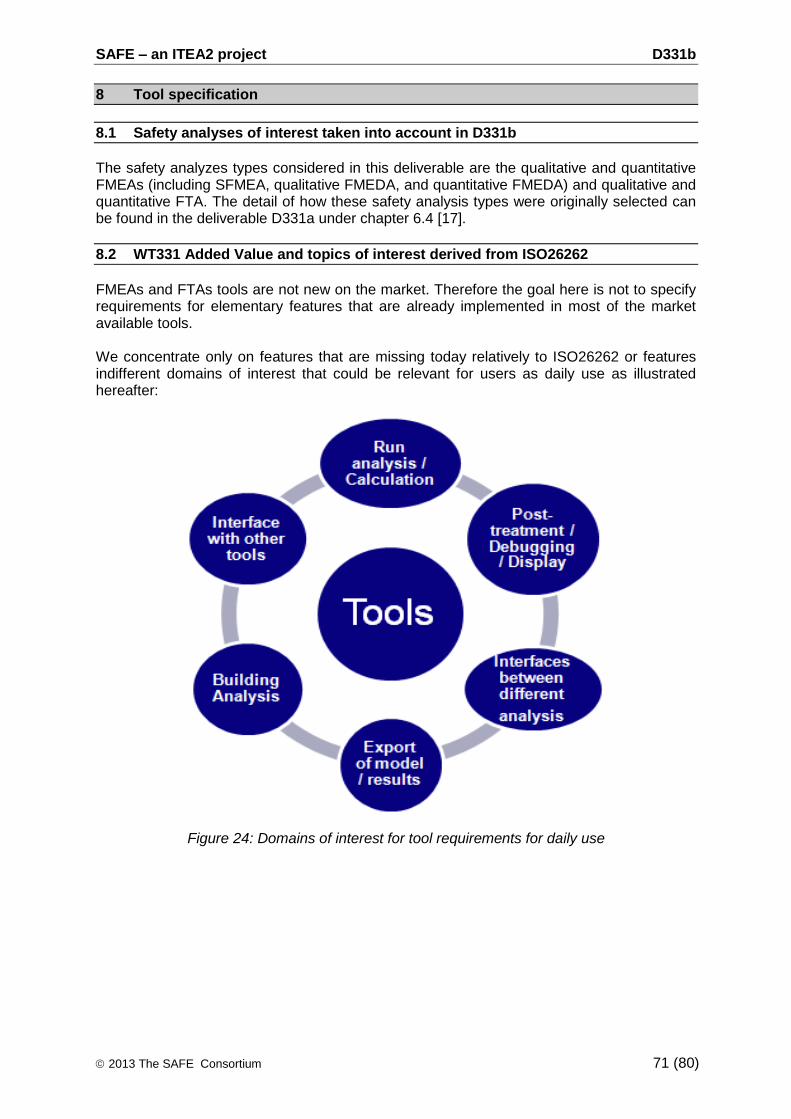
SAFE – an ITEA2 project D331b
2013 The SAFE Consortium 71 (80)
8 Tool specification
8.1 Safety analyses of interest taken into account in D331b
The safety analyzes types considered in this deliverable are the qualitative and quantitative FMEAs (including SFMEA, qualitative FMEDA, and quantitative FMEDA) and qualitative and quantitative FTA. The detail of how these safety analysis types were originally selected can be found in the deliverable D331a under chapter 6.4 [17].
8.2 WT331 Added Value and topics of interest derived from ISO26262
FMEAs and FTAs tools are not new on the market. Therefore the goal here is not to specify requirements for elementary features that are already implemented in most of the market available tools. We concentrate only on features that are missing today relatively to ISO26262 or features indifferent domains of interest that could be relevant for users as daily use as illustrated hereafter:
Figure 24: Domains of interest for tool requirements for daily use
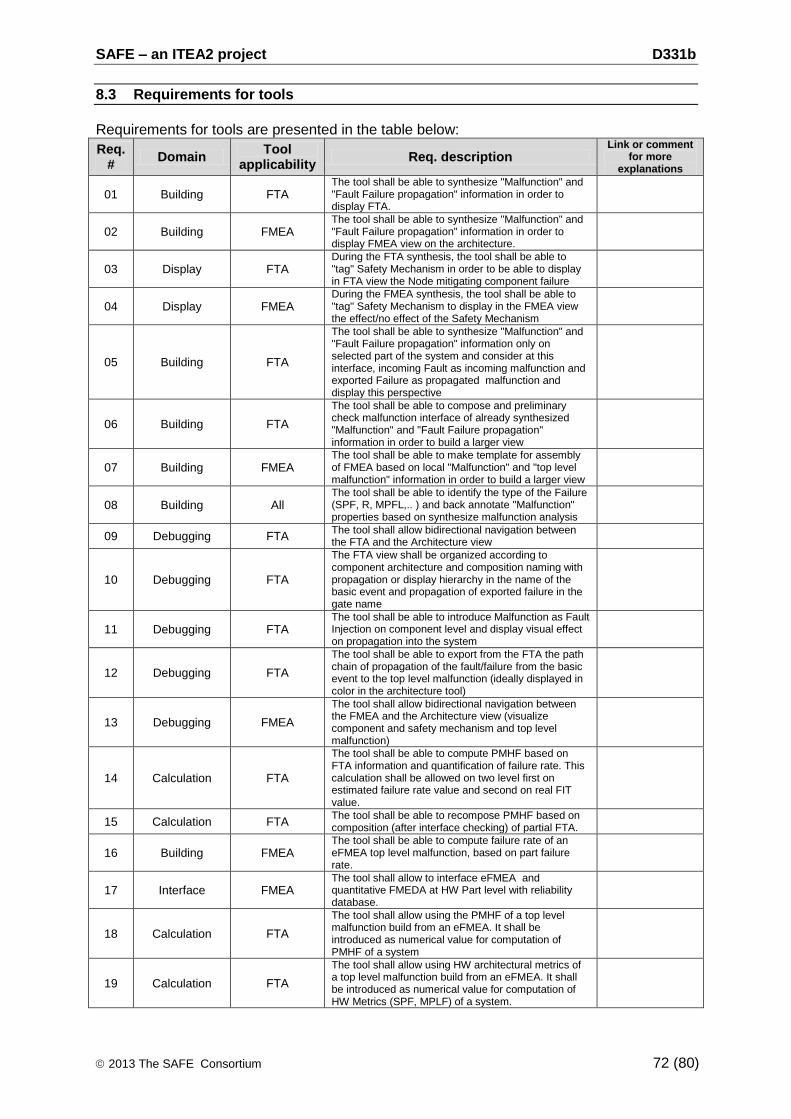
SAFE – an ITEA2 project D331b
2013 The SAFE Consortium 72 (80)
8.3 Requirements for tools
Requirements for tools are presented in the table below:
Req. #
Domain Tool
applicability Req. description
Link or comment for more
explanations
01 Building FTA The tool shall be able to synthesize "Malfunction" and "Fault Failure propagation" information in order to display FTA.
02 Building FMEA The tool shall be able to synthesize "Malfunction" and "Fault Failure propagation" information in order to display FMEA view on the architecture.
03 Display FTA During the FTA synthesis, the tool shall be able to "tag" Safety Mechanism in order to be able to display in FTA view the Node mitigating component failure
04 Display FMEA During the FMEA synthesis, the tool shall be able to "tag" Safety Mechanism to display in the FMEA view the effect/no effect of the Safety Mechanism
05 Building FTA
The tool shall be able to synthesize "Malfunction" and "Fault Failure propagation" information only on selected part of the system and consider at this interface, incoming Fault as incoming malfunction and exported Failure as propagated malfunction and display this perspective
06 Building FTA
The tool shall be able to compose and preliminary check malfunction interface of already synthesized "Malfunction" and "Fault Failure propagation" information in order to build a larger view
07 Building FMEA The tool shall be able to make template for assembly of FMEA based on local "Malfunction" and "top level malfunction" information in order to build a larger view
08 Building All The tool shall be able to identify the type of the Failure (SPF, R, MPFL,.. ) and back annotate "Malfunction" properties based on synthesize malfunction analysis
09 Debugging FTA The tool shall allow bidirectional navigation between the FTA and the Architecture view
10 Debugging FTA
The FTA view shall be organized according to component architecture and composition naming with propagation or display hierarchy in the name of the basic event and propagation of exported failure in the gate name
11 Debugging FTA The tool shall be able to introduce Malfunction as Fault Injection on component level and display visual effect on propagation into the system
12 Debugging FTA
The tool shall be able to export from the FTA the path chain of propagation of the fault/failure from the basic event to the top level malfunction (ideally displayed in color in the architecture tool)
13 Debugging FMEA
The tool shall allow bidirectional navigation between the FMEA and the Architecture view (visualize component and safety mechanism and top level malfunction)
14 Calculation FTA
The tool shall be able to compute PMHF based on FTA information and quantification of failure rate. This calculation shall be allowed on two level first on estimated failure rate value and second on real FIT value.
15 Calculation FTA The tool shall be able to recompose PMHF based on composition (after interface checking) of partial FTA.
16 Building FMEA The tool shall be able to compute failure rate of an eFMEA top level malfunction, based on part failure rate.
17 Interface FMEA The tool shall allow to interface eFMEA and quantitative FMEDA at HW Part level with reliability database.
18 Calculation FTA
The tool shall allow using the PMHF of a top level malfunction build from an eFMEA. It shall be introduced as numerical value for computation of PMHF of a system
19 Calculation FTA
The tool shall allow using HW architectural metrics of a top level malfunction build from an eFMEA. It shall be introduced as numerical value for computation of HW Metrics (SPF, MPLF) of a system.
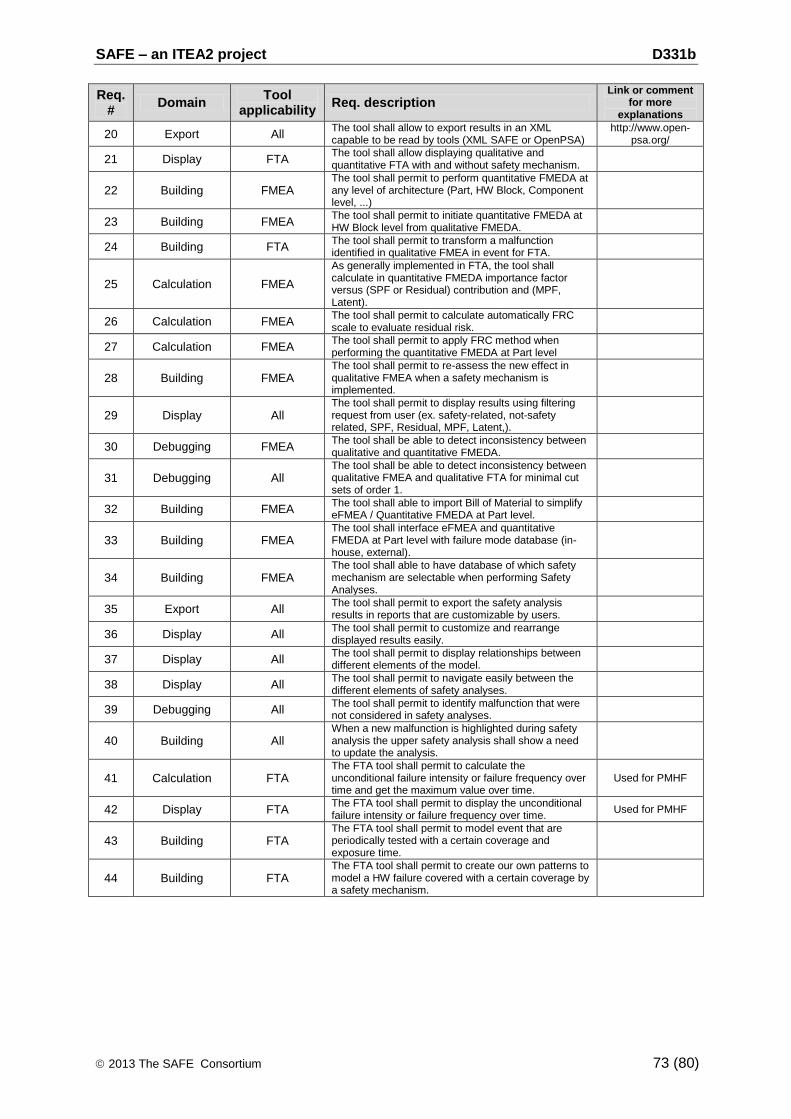
SAFE – an ITEA2 project D331b
2013 The SAFE Consortium 73 (80)
Req. #
Domain Tool
applicability Req. description
Link or comment for more
explanations
20 Export All The tool shall allow to export results in an XML capable to be read by tools (XML SAFE or OpenPSA)
http://www.open-psa.org/
21 Display FTA The tool shall allow displaying qualitative and quantitative FTA with and without safety mechanism.
22 Building FMEA The tool shall permit to perform quantitative FMEDA at any level of architecture (Part, HW Block, Component level, ...)
23 Building FMEA The tool shall permit to initiate quantitative FMEDA at HW Block level from qualitative FMEDA.
24 Building FTA The tool shall permit to transform a malfunction identified in qualitative FMEA in event for FTA.
25 Calculation FMEA
As generally implemented in FTA, the tool shall calculate in quantitative FMEDA importance factor versus (SPF or Residual) contribution and (MPF, Latent).
26 Calculation FMEA The tool shall permit to calculate automatically FRC scale to evaluate residual risk.
27 Calculation FMEA The tool shall permit to apply FRC method when performing the quantitative FMEDA at Part level
28 Building FMEA The tool shall permit to re-assess the new effect in qualitative FMEA when a safety mechanism is implemented.
29 Display All The tool shall permit to display results using filtering request from user (ex. safety-related, not-safety related, SPF, Residual, MPF, Latent,).
30 Debugging FMEA The tool shall be able to detect inconsistency between qualitative and quantitative FMEDA.
31 Debugging All The tool shall be able to detect inconsistency between qualitative FMEA and qualitative FTA for minimal cut sets of order 1.
32 Building FMEA The tool shall able to import Bill of Material to simplify eFMEA / Quantitative FMEDA at Part level.
33 Building FMEA The tool shall interface eFMEA and quantitative FMEDA at Part level with failure mode database (in-house, external).
34 Building FMEA The tool shall able to have database of which safety mechanism are selectable when performing Safety Analyses.
35 Export All The tool shall permit to export the safety analysis results in reports that are customizable by users.
36 Display All The tool shall permit to customize and rearrange displayed results easily.
37 Display All The tool shall permit to display relationships between different elements of the model.
38 Display All The tool shall permit to navigate easily between the different elements of safety analyses.
39 Debugging All The tool shall permit to identify malfunction that were not considered in safety analyses.
40 Building All When a new malfunction is highlighted during safety analysis the upper safety analysis shall show a need to update the analysis.
41 Calculation FTA The FTA tool shall permit to calculate the unconditional failure intensity or failure frequency over time and get the maximum value over time.
Used for PMHF
42 Display FTA The FTA tool shall permit to display the unconditional failure intensity or failure frequency over time.
Used for PMHF
43 Building FTA The FTA tool shall permit to model event that are periodically tested with a certain coverage and exposure time.
44 Building FTA The FTA tool shall permit to create our own patterns to model a HW failure covered with a certain coverage by a safety mechanism.

SAFE – an ITEA2 project D331b
2013 The SAFE Consortium 74 (80)
9 Definition of the ontology of malfunctions at different abstraction levels for SAFE Meta-Model
The aim of this section is to facilitate the use of safety analyses by defining malfunction ontology as library of malfunction types to be used and exchange within supplier chain. This ontology of malfunction can be used according to engineering level or across the abstraction view of the safety analysis, depending of the accuracy required in the safety analysis. So we propose as initial base, an interpretation of malfunction definition according to ISO26262 requirement and safety concept organization, by specializing malfunction in relation to abstraction view. First, the construction of the Functional Safety Concept is considered as ideally functional approach, in practice mostly consideration of preliminary physical architecture as functional block. Then, the Technical Safety Concept analysis includes an accurate definition of the split between software and hardware anomalies oriented for a domain architecture approach and analyzed as a global error model. Finally, the implementation driven analysis with respective physical malfunction types focuses on in hardware interface malfunction types from execution units (AUTOSAR infrastructure). The document clusters the malfunction definition in Structure Malfunction or Behavior Malfunction. The Port Malfunction refers to malfunction visible at the border to element of the error model related to failure propagation from external failure to external fault via the “FaultFailurePropagationLink”. The Behavior Malfunction refers to Internal or Process Fault associated to an element of an error model, including more standardized definition related to hardware element. As introduce earlier depending of the precision of the analysis the malfunction can be reused across abstraction, and organization below is just for indication. Moreover link to the refinement of malfunction, document below with abstraction view, the refinement of the malfunction library and ontology definition case be linked by “FaultFailureLink” to define vertical propagation of malfunction across the abstraction view.
9.1 Malfunction Ontology for Functional Safety Concept
The proposed first part of the ontology of malfunction for the representation of the functional architecture is recommended to be simple. Thanks to above classification the elements defined are: Structure Malfunction
- Error: data Error as generic fault/failure visible at port level.
- Limp Home: Limp Home data visible at port level (see Note below). Behaviour Malfunction
- Sensor Error: Error as internal or process fault of a sensor.
- Actuator Error: Error as internal or process fault of an actuator.
- Function Error: Error as internal or process fault of a function. Depending of precision of the analysis required, the below definition from Software domain can be used as they are related to functional approach from the software perspective. Note: We propose to introduce the LH as a malfunction, to be able to represent the effect of mitigation of fault/failure in order to carry out the Limp Home state propagated similar to a malfunction. This assumption allows assuming that Limp Home lead to safe state of the port representing the occurrence of the hazard event.
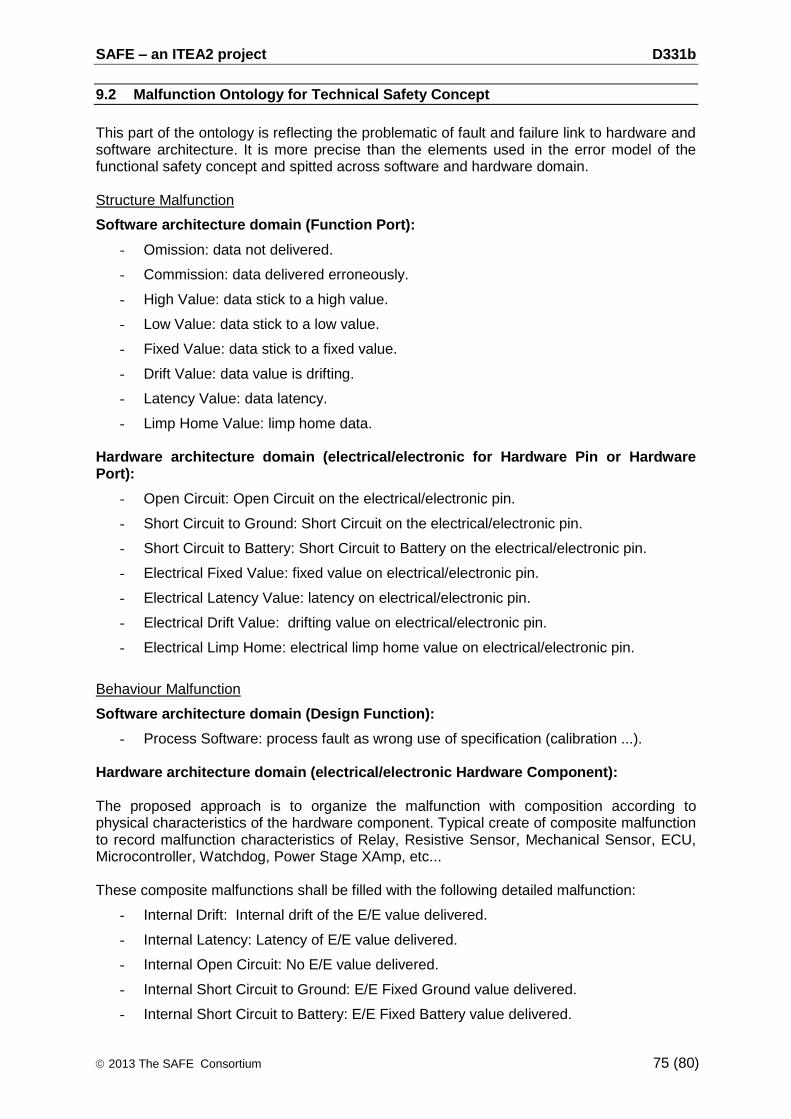
SAFE – an ITEA2 project D331b
2013 The SAFE Consortium 75 (80)
9.2 Malfunction Ontology for Technical Safety Concept
This part of the ontology is reflecting the problematic of fault and failure link to hardware and software architecture. It is more precise than the elements used in the error model of the functional safety concept and spitted across software and hardware domain. Structure Malfunction
Software architecture domain (Function Port):
- Omission: data not delivered.
- Commission: data delivered erroneously.
- High Value: data stick to a high value.
- Low Value: data stick to a low value.
- Fixed Value: data stick to a fixed value.
- Drift Value: data value is drifting.
- Latency Value: data latency.
- Limp Home Value: limp home data.
Hardware architecture domain (electrical/electronic for Hardware Pin or Hardware Port):
- Open Circuit: Open Circuit on the electrical/electronic pin.
- Short Circuit to Ground: Short Circuit on the electrical/electronic pin.
- Short Circuit to Battery: Short Circuit to Battery on the electrical/electronic pin.
- Electrical Fixed Value: fixed value on electrical/electronic pin.
- Electrical Latency Value: latency on electrical/electronic pin.
- Electrical Drift Value: drifting value on electrical/electronic pin.
- Electrical Limp Home: electrical limp home value on electrical/electronic pin.
Behaviour Malfunction
Software architecture domain (Design Function):
- Process Software: process fault as wrong use of specification (calibration ...).
Hardware architecture domain (electrical/electronic Hardware Component): The proposed approach is to organize the malfunction with composition according to physical characteristics of the hardware component. Typical create of composite malfunction to record malfunction characteristics of Relay, Resistive Sensor, Mechanical Sensor, ECU, Microcontroller, Watchdog, Power Stage XAmp, etc... These composite malfunctions shall be filled with the following detailed malfunction:
- Internal Drift: Internal drift of the E/E value delivered.
- Internal Latency: Latency of E/E value delivered.
- Internal Open Circuit: No E/E value delivered.
- Internal Short Circuit to Ground: E/E Fixed Ground value delivered.
- Internal Short Circuit to Battery: E/E Fixed Battery value delivered.
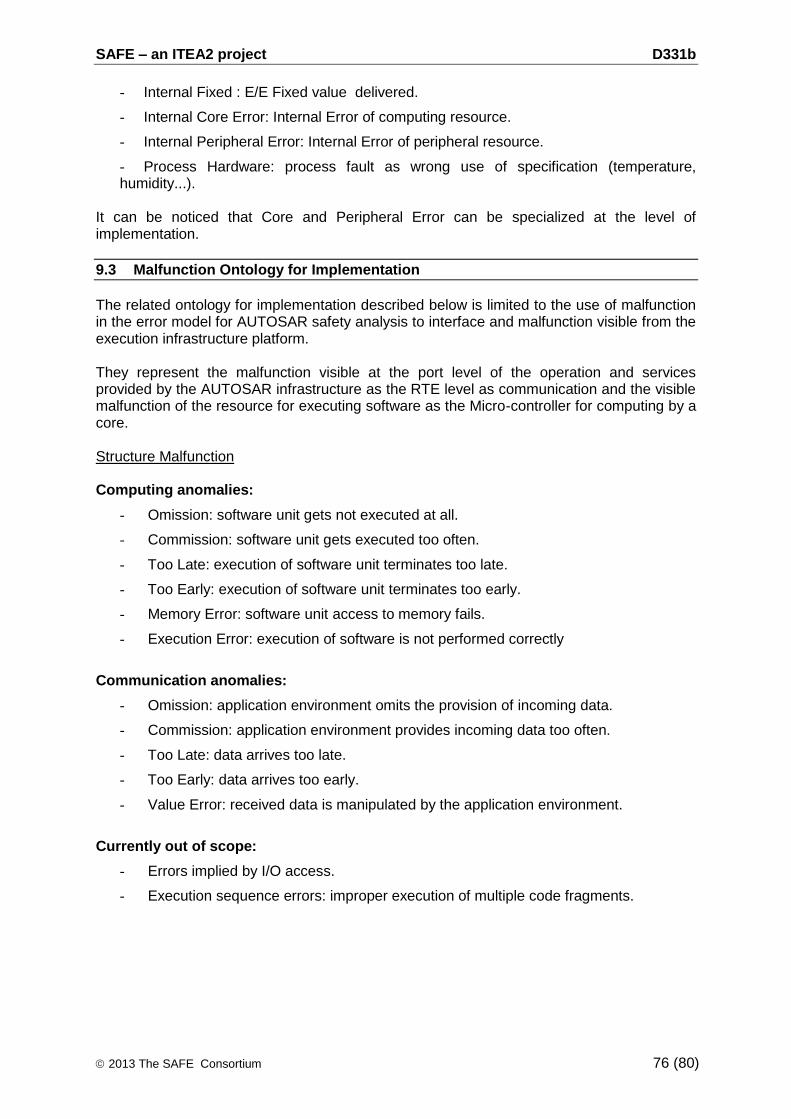
SAFE – an ITEA2 project D331b
2013 The SAFE Consortium 76 (80)
- Internal Fixed : E/E Fixed value delivered.
- Internal Core Error: Internal Error of computing resource.
- Internal Peripheral Error: Internal Error of peripheral resource.
- Process Hardware: process fault as wrong use of specification (temperature, humidity...).
It can be noticed that Core and Peripheral Error can be specialized at the level of implementation.
9.3 Malfunction Ontology for Implementation
The related ontology for implementation described below is limited to the use of malfunction in the error model for AUTOSAR safety analysis to interface and malfunction visible from the execution infrastructure platform. They represent the malfunction visible at the port level of the operation and services provided by the AUTOSAR infrastructure as the RTE level as communication and the visible malfunction of the resource for executing software as the Micro-controller for computing by a core. Structure Malfunction Computing anomalies:
- Omission: software unit gets not executed at all.
- Commission: software unit gets executed too often.
- Too Late: execution of software unit terminates too late.
- Too Early: execution of software unit terminates too early.
- Memory Error: software unit access to memory fails.
- Execution Error: execution of software is not performed correctly
Communication anomalies:
- Omission: application environment omits the provision of incoming data.
- Commission: application environment provides incoming data too often.
- Too Late: data arrives too late.
- Too Early: data arrives too early.
- Value Error: received data is manipulated by the application environment.
Currently out of scope:
- Errors implied by I/O access.
- Execution sequence errors: improper execution of multiple code fragments.

SAFE – an ITEA2 project D331b
2013 The SAFE Consortium 77 (80)
10 Conclusions
Here in this deliverable, we had not the pretention to answer to all interrogations that could arise from the exchange between partners and that are not clearly explained in the ISO26262. Nevertheless we try to propose a complete safety development cycle from system design to detailed design with some possible ways to perform safety analyses. A new way of performing and demonstrate effectiveness of safety mechanism using qualitative SFMEA or qualitative FMEDA was here introduced. It can permit to quickly evaluate and consolidate the safety concept. Also it was shown that it is possible to calculate the architectural metrics at different architectural levels which is not so obvious for people because not highlighted clearly in the ISO26262. Moreover we have illustrated via a example that it was possible for the system responsible to mix results for residual risk evaluation coming from the different methods (PMHF, FRC) as proposed by the ISO26262. Then we provide a first list of requirements that can be addressed to tools vendors from the SAFE project. With these requirements implemented we can expect to be able to cover all safety analyses proposed in the global safety analysis process and also improve the usability of such tools in daily use. Next step is to generate the FMEAs and FTAs views from the error model automatic execution from the SAFE tool with possible quantification for random HW failures.
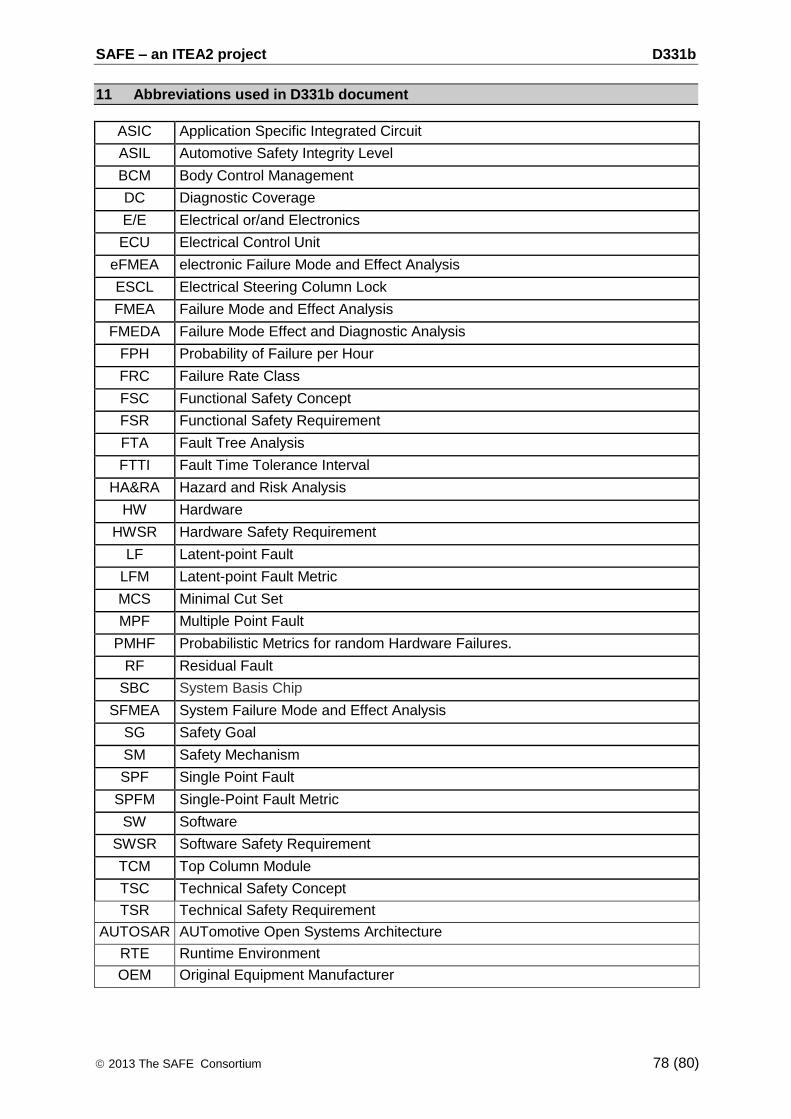
SAFE – an ITEA2 project D331b
2013 The SAFE Consortium 78 (80)
11 Abbreviations used in D331b document
ASIC Application Specific Integrated Circuit
ASIL Automotive Safety Integrity Level
BCM Body Control Management
DC Diagnostic Coverage
E/E Electrical or/and Electronics
ECU Electrical Control Unit
eFMEA electronic Failure Mode and Effect Analysis
ESCL Electrical Steering Column Lock
FMEA Failure Mode and Effect Analysis
FMEDA Failure Mode Effect and Diagnostic Analysis
FPH Probability of Failure per Hour
FRC Failure Rate Class
FSC Functional Safety Concept
FSR Functional Safety Requirement
FTA Fault Tree Analysis
FTTI Fault Time Tolerance Interval
HA&RA Hazard and Risk Analysis
HW Hardware
HWSR Hardware Safety Requirement
LF Latent-point Fault
LFM Latent-point Fault Metric
MCS Minimal Cut Set
MPF Multiple Point Fault
PMHF Probabilistic Metrics for random Hardware Failures.
RF Residual Fault
SBC System Basis Chip
SFMEA System Failure Mode and Effect Analysis
SG Safety Goal
SM Safety Mechanism
SPF Single Point Fault
SPFM Single-Point Fault Metric
SW Software
SWSR Software Safety Requirement
TCM Top Column Module
TSC Technical Safety Concept
TSR Technical Safety Requirement
AUTOSAR AUTomotive Open Systems Architecture
RTE Runtime Environment
OEM Original Equipment Manufacturer
SAFE – an ITEA2 project D331b
2013 The SAFE Consortium 79 (80)
12 References
[1] International Organization for Standardization: ISO 26262 Road vehicles - Functional safety. Part 1 to 9 (2011)
[2] International Organization for Standardization: ISO 26262 Road vehicles – Functional safety. Guideline Part 10 (2012)
[3] SAFE Deliverable D311b: Final proposal for extension of meta-model for hazard and environment modeling ; http://www.safe-project.eu/SAFE-Publications/SAFE_D3.1.1.b.pdf
[4] VDA Volume 4 Chapter: Product-and Process-FMEA
[5] IEC 60812 ed.2.0, Analysis techniques for system reliability – Procedure for failure mode and effects analysis (FMEA). (2006)
[6] SAE J1739, Potential Failure Mode and Effects Analysis in Design (Design FMEA), Potential Failure Mode and Effects Analysis in Manufacturing and Assembly Processes (Process FMEA). (2009)
[7] IEC61025 ed.2.0, Fault Tree Analysis. (2006)
[8] NUREG-0492: Fault Tree Handbook from US Nuclear Regulatory Commission. (1981)
[9] SAE ARP4761: Guideline and Methods for conducting the safety assessment process on civil airborne systems and equipments. (1996)
[10] MIL-STD1629A: Military Standard, Procedure for Performing a Failure Mode, Effect and Criticality Analysis. (1980)
[11] Experience with the second method for EPS hardware analysis: Evaluation of each cause of safety goal violation due to random hardware failures; K.Svancara & W.Forbes & J.Priddy & M.Kudanowski & T. Lovric & J. Miller; VDA Automotive Sys conference May 2012.
[12] Advantages of the alternative method for random hardware failures quantitative evaluation – A practical survey for EPS, K.Svancara & W.Forbes & J.Priddy & M.Kudanowski & T. Lovric & J. Miller, SAE conference April 2013.
[13] Adler, N., Otten, S., Cuenot, P., and Müller-Glaser, K., "Performing Safety Evaluation on Detailed Hardware Level according to ISO 26262," SAE Int. J. Passeng. Cars – Electron. Electr. Syst. 6(1):102-113, 2013, doi:10.4271/2013-01-0182.
[14] IEC 61508 standard: Functional safety of electrical/electronic/programmable electronic safety-related systems, Parts 6, 2010 (International Electrotechnical Commission, Geneva, Switzerland).
[15] New insight into the average probability of failure on demand and the probability of dangerous failure per hour of safety instrumented systems, F Innal & Y Dutuit & A Rauzy & J-P Signoret, Proc. IMechE Vol. 224 Part O: J. Risk and Reliability.
[16] SAFE Deliverable D322a : Proposal for extension of Meta model for hardware modeling ; http://www.safe-project.eu/SAFE-Publications/SAFE_D3.2.2.pdf
[17] SAFE Deliverable D331a : Proposal for extension of metamodel for error failure and propagation analysis ; http://www.safe-project.eu/SAFE-Publications/SAFE_D3.3.1.a.pdf
SAFE – an ITEA2 project D331b
2013 The SAFE Consortium 80 (80)
13 Acknowledgments
This document is based on the SAFE project in the framework of the ITEA2, EUREKA cluster program Σ! 3674. The work has been funded by the German Ministry for Education and Research (BMBF) under the funding ID 01IS11019, and by the French Ministry of the Economy and Finance (DGCIS). The responsibility for the content rests with the authors.