sadi: stata tools for sequence analysis · 2017-06-03 · what is sequence analysis?about...
TRANSCRIPT

What is Sequence Analysis? About SADI Worked example Why plugins? Further information
SADI: Stata tools for Sequence Analysis
Brendan Halpin, University of Limerick
Stata User Group, London, 11/12 September 2014
http://teaching.sociology.ul.ie/seqanal/sadilondon.pdf

What is Sequence Analysis? About SADI Worked example Why plugins? Further information
Outline
1 What is Sequence Analysis?
2 About SADI
3 Worked example
4 Why plugins?
5 Further information

What is Sequence Analysis? About SADI Worked example Why plugins? Further information
What is sequence analysis?
A way of looking at time series as units
Alternative to stochastic approaches that model the datageneration process
Origin in pattern recognition/machine learning; extensiveapplication in molecular biology
Advantage:
may capture structure that conventional approaches don'tprovides a descriptive overview of complex data

What is Sequence Analysis? About SADI Worked example Why plugins? Further information
How do we do sequence analysis?
Calculate distance between pairs of sequences
Use all pairwise distances to create empirical typologies
Compare all sequences with a few ideal-typical sequences
Compare pairs of sequences, e.g. spouses' time use; mothers'and daughters' fertility histories
Address variability within groups (e.g., destandardisation of lifecourse across cohorts)

What is Sequence Analysis? About SADI Worked example Why plugins? Further information
How do we de�ne distance?
Count matching elements; identity at the same time
Hamming distance: allow state space; full or partial similarityat the same time
Aligning methods: full or partial similarity at the same orsimilar time
Optimal Matching Algorithm uses token editing (substitution,insertion, deletion) to do such alignment
OM evangelised extensively in sociology by Andrew Abbott

What is Sequence Analysis? About SADI Worked example Why plugins? Further information
Controversy and alternatives
How to determine substitution costs
Do token sequences represent life course data well? (Hollister,2009; Halpin, 2010; but see Halpin, 2014b)
Some alternatives:
Dynamic Hamming (Lesnard)Elzinga's combinatorial approachesTime-Warp Edit DistanceFor more detail see Halpin (2014b)

What is Sequence Analysis? About SADI Worked example Why plugins? Further information
SADI: Sequence Analysis DIstance measures
For a long time, little software for SA
Abbott's custom programmeBioinformatics software for molecular sequence analysis
Since then, a lot of options
Rohwer's TDA incorporated OM in mid/late 1990sKohler/Brzinsky-Fay/Luniak SQ for Stata since 2006R Library Traminer since 2008
SADI (�rst distributed 2007) takes a di�erent approach to SQ

What is Sequence Analysis? About SADI Worked example Why plugins? Further information
SADI compared to SQ
Uses C plugins
Good: c 50X fasterBad: problems of platform dependency, crashes
Deals with duplicate sequences di�erently: consequences forcluster analysis
More distance measures as well as OM
HammingDynamic HammingTime Warp Edit DistanceSome of Elzinga's combinatorial measures

What is Sequence Analysis? About SADI Worked example Why plugins? Further information
Key SADI components
Distance measures
oma: Optimal matching distancehamming: Hamming distancedynham: Dynamic Hamming distancecombinadd: Elzinga's duration-weighted spell measuretwed: Time-warp edit distance
Representing sequences
stripe: string representations of sequenceschronogram: state distribution over timetrprgr: time-series of transition rates
Comparing solutions
corrsqm: correlation between pairwise distance matricespermtab: tabulate cluster solutionsari: Adjusted Rand Index, assess agreement of clustersolutions

What is Sequence Analysis? About SADI Worked example Why plugins? Further information
A worked example: mothers' labour market histories
Data derived from BHPS work-life histories
6 years, mothers who have a birth at end of year 2
Full and part-time employed, unemployed, non-employed
Unusual in that time keyed by event in middle, not start

What is Sequence Analysis? About SADI Worked example Why plugins? Further information
Data structure
Wide, one variable per month
. stripe state1-state72, gen(stripe) symbols("FPun")
. list stripe in 1/10, clean
stripe
1. nnnnnnnnnnnFFuuuunnnnnnnnnnnnnnnnnnnnnnnnnnnnnnnnnnnnnnnnnnnnnnnnnnnnnnn
2. FFFFFFFFFFFFFFFFFFFFFFFFFFFFFFFFFFFFFFFFFFFFFFFFFFFFFFFFFFFFFFFFFFFFFnnn
3. FFFFFFFFFFFFFFFFFFFFFFnnnnuuunnnnnnnnnnnnnnnnnnnnnnnnnnnnnnnnnnnnnnnnnnn
4. FFFFFFFFFFFFFFFFFFFFFFFFFFFFFFFPPPPPPPPPPPPPPPPPPPPPPPPPPPnnnnnnnnnnnnnn
5. FFFFFFFFFFFFFFFFFFFFFFnnnnnnnnnnFFFFFFFFFFFFFFFFFFFFFFFFFFFFFFFFFFFFnnnn
6. FFFFFFFFFFFFFFFFFFFFFFFFFFFFFFFFFFFFFFFFFFFFFFFnnnnnnnnnnnnnFFFFFFFFFFFF
7. FFFFFFFFFFFFFFFFFFFFFFFnnnnnnnnnnnnnnnnnnnnnnnnnnnnnnnPPPPPPPPPPPPPPPPPP
8. FFFFFFFFFFFFFFFFFnnnnnnnnnnnFFFFFFFFFFFFFFFFFFFFFFFFFFFFFFFFFFFFFFFFFFFF
9. nnnnnnnnnnnnnnnnnnnnnnPPPPPPPPPPPPPFFFFFFFFFFFFnnnnnnnnnnnnnnnnnnnnuuuun
10. FFFFFFFFFFFFFFFFFFFFFFFFFFFFFFFFFFFFFFFFnnnFFFFFFFFFFFFFFFFFFnnnnnnnnnnn

What is Sequence Analysis? About SADI Worked example Why plugins? Further information
Chronogram: state distribution summary
. chronogram state*, id(pid)
20
04
00
60
08
00
10
00
0 20 40 60 80Time
Full time employed Part time employed
Unemployed Non−employed

What is Sequence Analysis? About SADI Worked example Why plugins? Further information
trprgr: transition rate time-series
. trprgr state*, id(pid) gmax(575) floor(0.85) ceiling(0.15)
02
00
40
06
00
Fu
ll tim
e e
mp
loye
d
0 20 40 60 80Time
.85
.87
5.9
.92
5.9
5.9
75
1F
ull
tim
e e
mp
loye
d
0 20 40 60 80Full time employed
0.0
25
.05
.07
5.1
.12
5.1
5F
ull
tim
e e
mp
loye
d
0 20 40 60 80Part time employed
0.0
25
.05
.07
5.1
.12
5.1
5F
ull
tim
e e
mp
loye
d
0 20 40 60 80Unemployed
0.0
25
.05
.07
5.1
.12
5.1
5F
ull
tim
e e
mp
loye
d
0 20 40 60 80Non−employed
02
00
40
06
00
Pa
rt t
ime
em
plo
ye
d
0 20 40 60 80Time
0.0
25
.05
.07
5.1
.12
5.1
5P
art
tim
e e
mp
loye
d
0 20 40 60 80Full time employed
.85
.87
5.9
.92
5.9
5.9
75
1P
art
tim
e e
mp
loye
d
0 20 40 60 80Part time employed
0.0
25
.05
.07
5.1
.12
5.1
5P
art
tim
e e
mp
loye
d
0 20 40 60 80Unemployed
0.0
25
.05
.07
5.1
.12
5.1
5P
art
tim
e e
mp
loye
d
0 20 40 60 80Non−employed
02
00
40
06
00
Un
em
plo
ye
d
0 20 40 60 80Time
0.0
25
.05
.07
5.1
.12
5.1
5U
ne
mp
loye
d
0 20 40 60 80Full time employed
0.0
25
.05
.07
5.1
.12
5.1
5U
ne
mp
loye
d
0 20 40 60 80Part time employed
.85
.87
5.9
.92
5.9
5.9
75
1U
ne
mp
loye
d
0 20 40 60 80Unemployed
0.0
25
.05
.07
5.1
.12
5.1
5U
ne
mp
loye
d
0 20 40 60 80Non−employed
02
00
40
06
00
No
n−
em
plo
ye
d
0 20 40 60 80Time
0.0
25
.05
.07
5.1
.12
5.1
5N
on
−e
mp
loye
d
0 20 40 60 80Full time employed
0.0
25
.05
.07
5.1
.12
5.1
5N
on
−e
mp
loye
d
0 20 40 60 80Part time employed
0.0
25
.05
.07
5.1
.12
5.1
5N
on
−e
mp
loye
d
0 20 40 60 80Unemployed
.85
.87
5.9
.92
5.9
5.9
75
1N
on
−e
mp
loye
d
0 20 40 60 80Non−employed

What is Sequence Analysis? About SADI Worked example Why plugins? Further information
Indexplot, (SQ)
. reshape long state, i(pid) j(t)
. sqset state pid t
. sqindexplot, legend(off) overplot(100)
This will generate a plot in "lexical" order
Next graph is in random order, for a comparison

What is Sequence Analysis? About SADI Worked example Why plugins? Further information
Indexplot, without order
0
200
400
600
800
1000
0 20 40 60 80

What is Sequence Analysis? About SADI Worked example Why plugins? Further information
Indexplot, lexically ordered
0
200
400
600
800
1000
0 20 40 60 80

What is Sequence Analysis? About SADI Worked example Why plugins? Further information
Optimal matching
Let's de�ne a simple state space: F---P---u---n
This is represented as a substitution matrix:
. matrix sm = (0,1,2,3 \ ///
1,0,1,2 \ ///
2,1,0,1 \ ///
3,2,1,0)
. oma state1-state72, subs(sm) indel(1.5) pwd(oml) len(72)
Normalising distances with respect to length
(0 observations deleted)
415 unique observations
indel cost 1.5 is half max substitution cost, as low as possible

What is Sequence Analysis? About SADI Worked example Why plugins? Further information
Clustering the pairwise distances
. clustermat wards oml, add
. cluster generate ol = groups(8 999), ties(fewer)
. tab ol8
ol8 | Freq. Percent Cum.
------------+-----------------------------------
1 | 320 34.08 34.08
2 | 74 7.88 41.96
3 | 83 8.84 50.80
4 | 61 6.50 57.29
5 | 189 20.13 77.42
6 | 102 10.86 88.29
7 | 39 4.15 92.44
8 | 71 7.56 100.00
------------+-----------------------------------
Total | 939 100.00

What is Sequence Analysis? About SADI Worked example Why plugins? Further information
Indexplot, dendrogram order
0
200
400
600
800
1000
0 20 40 60 80

What is Sequence Analysis? About SADI Worked example Why plugins? Further information
Chronogram by cluster0
100
200
300
0100
200
300
0100
200
300
0 20 40 60 80
0 20 40 60 80 0 20 40 60 80
1 2 3
4 5 6
7 8
TimeGraphs by ol8
What is Sequence Analysis? About SADI Worked example Why plugins? Further information
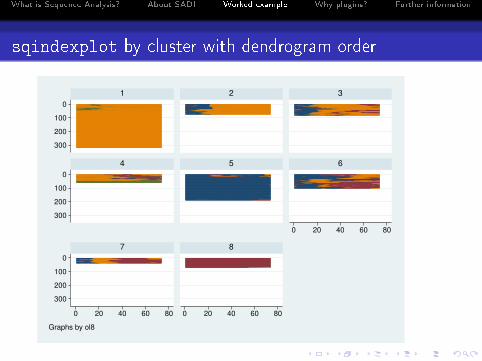
sqindexplot by cluster with dendrogram order
0
100
200
300
0
100
200
300
0
100
200
300
0 20 40 60 80
0 20 40 60 80 0 20 40 60 80
1 2 3
4 5 6
7 8
Graphs by ol8

What is Sequence Analysis? About SADI Worked example Why plugins? Further information
Parameterisation
Setting substitution and indel costs is di�cult
No theory, somewhat controversial
I like to understand it as mapping a perspective on state-spaceonto trajectory-space
However, changing the parameters changes the results

What is Sequence Analysis? About SADI Worked example Why plugins? Further information
Two contrasting cost setups
. matrix sm = (0,1,2,3 \ ///
1,0,1,2 \ ///
2,1,0,1 \ ///
3,2,1,0)
. matrix fl = (0,1,1,1 \ ///
1,0,1,1 \ ///
1,1,0,1 \ ///
1,1,1,0)
. oma state1-state72, subs(sm) indel(1.5) pwd(oml) len(72)
. oma state1-state72, subs(fl) indel(0.5) pwd(omf) len(72)

What is Sequence Analysis? About SADI Worked example Why plugins? Further information
Permuting linear and �at solutions
Command: permtab ol8 of8
Kappa max: 0.7742
Permutation
vector Permuted table:
1 1 2 3 4 5 6 7 8
+-----+ +-------------------------------------------------+
1 | 1 | 1 | 293 26 1 0 0 0 0 0 |
2 | 2 | 2 | 1 72 1 0 0 0 0 0 |
3 | 3 | 3 | 0 3 76 0 0 2 2 0 |
4 | 7 | 4 | 5 0 0 16 0 14 24 2 |
5 | 4 | 5 | 0 0 0 0 180 9 0 0 |
6 | 5 | 6 | 0 0 10 0 39 21 32 0 |
7 | 6 | 7 | 0 0 0 0 0 1 38 0 |
8 | 8 | 8 | 0 0 0 0 0 0 0 71 |
+-----+ +-------------------------------------------------+

What is Sequence Analysis? About SADI Worked example Why plugins? Further information
Correlations of distances
Summary based on corrsqm mat1 mat2, nodiag
Hamming linear 1.000 0.855 0.995 0.850 0.860 0.855 0.045
Hamming flat 0.855 1.000 0.850 0.987 0.998 1.000 0.094
OM linear 0.995 0.850 1.000 0.859 0.852 0.850 0.031
OM flat 0.850 0.987 0.859 1.000 0.980 0.987 0.066
TWED linear 0.860 0.998 0.852 0.980 1.000 0.998 0.127
TWED flat 0.855 1.000 0.850 0.987 0.998 1.000 0.093
X/t 0.045 0.094 0.031 0.066 0.127 0.093 1.000

What is Sequence Analysis? About SADI Worked example Why plugins? Further information
Is clustering robust? Check with MDS−
1−
.50
.51
−2 −1 0 1 2
dim1
1 2 3 4 5 6 7 8

What is Sequence Analysis? About SADI Worked example Why plugins? Further information
Discrepancy
Studer et al's "discrepancy" measure gives us an alternative tocluster analysis
Analogy to ANOVA and R-squared
TSS is the distance to the centre of gravity of the whole matrixRSS is the distance to the centre of gravity of the partition
Simple way to test for association between distance and acategorical variable

What is Sequence Analysis? About SADI Worked example Why plugins? Further information
By Date of Birth, OM and X/t
. discrepancy dob, distmat(oml) id(pid) niter(5000)
Discrepancy based R2 and F, 5000 permutations for p-value
| pseudo R2 pseudo F p-value
-------------+---------------------------------
dob | .1439802 52.42148 .0002
. discrepancy dob, distmat(xts) id(pid) niter(5000)
Discrepancy based R2 and F, 5000 permutations for p-value
| pseudo R2 pseudo F p-value
-------------+---------------------------------
dob | .0693522 23.22551 .0658

What is Sequence Analysis? About SADI Worked example Why plugins? Further information
Good and bad of plugins
Statacorp encourages use of Mata over plugins
But sometimes plugins are preferable
faster when doing loop-intensive calculations (x50)access existing external code and librariesimplement algorithms and data structures not available (orslow) in Mata
e.g. recursive enumeration of subsequenceshashtable data structure
Downsides
need to compile separately for numerous platformscan crash StataC can be a nightmare!

What is Sequence Analysis? About SADI Worked example Why plugins? Further information
Compiling for multiple platforms
The main platforms for Stata seem to be:
Windows 64-bitWindows 32-bitMacOS (Intel CPU)Linux 64-bitLinux 32-bit
From Linux64 it is possible to cross compile for Windows andLinux, 32 and 64 bit
Cross compilation for Mac is di�cult, but may be possible
Compiling on Mac and on other Unix is straightforward

What is Sequence Analysis? About SADI Worked example Why plugins? Further information
Cross-compilation on 64-bit Debian
Load these packages (other distributions are analogous)
apt-get install mingw32
apt-get install mingw-w64
apt-get install libc6-dev-i386
Then compile:
# Linux 32
gcc -m32 -fPIC -shared -DSYSTEM=OPUNIX stplugin.c example.c -o example.plugin
# Linux 64
gcc -m64 -fPIC -shared -DSYSTEM=OPUNIX stplugin.c example.c -o example.plugin
# Windows 32
i586-mingw32msvc-cc -shared -DSYSTEM=STWIN stplugin.c example.c -o example.plugin
# Windows 64
x86_64-w64-mingw32-gcc -shared -DSYSTEM=STWIN stplugin.c example.c -o example.plugin

What is Sequence Analysis? About SADI Worked example Why plugins? Further information
MacOS
On Mac, using gcc
gcc -bundle -DSYSTEM=APPLEMAC stplugin.c example.c -o example.plugin
(thanks to Glenn Hoetker, Arizona, for help compiling for Mac)

What is Sequence Analysis? About SADI Worked example Why plugins? Further information
Installation
For SADI
net from http://teaching.sociology.ul.ie/sadi
net install sadi
SADI requires moremata
ssc install moremata
For SQ, for indexplots
ssc install sq

What is Sequence Analysis? About SADI Worked example Why plugins? Further information
Further reading
Halpin, 2014a, SADI: Sequence Analysis Tools for Stata, WP2014-03,Dept of Sociology, University of Limerick,http://www.ul.ie/sociology/pubs/wp2014-03.pdf
Halpin, 2014b, Three narratives of sequence analysis, in Bühlmann et al(eds), Advances in Sequence Analysis, Springer
Halpin, 2012, Sequence analysis of life-course data: a comparison ofdistance measures, WP2012-02, Dept of Sociology, University of Limerickhttp://www.ul.ie/sociology/pubs/wp2012-02.pdf
Studer et al., 2011, Discrepancy Analysis of State Sequences, SociologicalMethods and Research, 40(3)
Studer, 2012, Étude des inégalités de genre en début de carrièreacadémique, Ch 2 "Comparaison des mesures de distance",http://archive-ouverte.unige.ch/unige:22054

What is Sequence Analysis? About SADI Worked example Why plugins? Further information
This document
This document is available athttp://teaching.sociology.ul.ie/seqanal/sadilondon.pdf