saddleback valley unified school istrict
TRANSCRIPT
SADDLEBACK VALLEY UNIFIED SCHOOL DISTRICT
AUDIT REPORT JUNE 30, 2019
SADDLEBACK VALLEY UNIFIED SCHOOL DISTRICT TABLE OF CONTENTS JUNE 30, 2019
FINANCIAL SECTION
Independent Auditors’ Report ............................................................................................................................................... 1 Management’s Discussion and Analysis .............................................................................................................................. 3 Basic Financial Statements
Government-wide Financial Statements Statement of Net Position ........................................................................................................................................... 10 Statement of Activities ................................................................................................................................................ 11
Fund Financial Statements Governmental Funds – Balance Sheet ..................................................................................................................... 12 Reconciliation of the Governmental Funds Balance Sheet to the Statement of Net Position ........................... 13 Governmental Funds – Statement of Revenues, Expenditures, and Changes in Fund Balances .................... 14 Reconciliation of the Governmental Funds Statement of Revenues, Expenditures, and Changes in Fund
Balances to the Statement of Activities ................................................................................................................. 15 Proprietary Funds – Statement of Net Position ....................................................................................................... 17 Proprietary Funds – Statement of Revenues, Expenses, and Changes in Net Position .................................... 18 Proprietary Funds – Statement of Cash Flows ........................................................................................................ 19 Fiduciary Funds – Statement of Net Position .......................................................................................................... 20
Notes to Financial Statements ............................................................................................................................................ 21
REQUIRED SUPPLEMENTARY INFORMATION
General Fund – Budgetary Comparison Schedule .......................................................................................................... 56 Schedule of Changes in Total OPEB Liability and Related Ratios – District Plan ........................................................ 57 Schedule of Changes in Net OPEB Liability and Related Ratios – MPP Program ....................................................... 58 Schedule of the District’s Proportionate Share of the Net Pension Liability - CalSTRS ............................................. 59 Schedule of the District’s Proportionate Share of the Net Pension Liability - CalPERS ............................................. 60 Schedule of District Contributions - CalSTRS .................................................................................................................. 61 Schedule of District Contributions - CalPERS .................................................................................................................. 62 Notes to Required Supplementary Information ................................................................................................................ 63
SUPPLEMENTARY INFORMATION
Schedule of Expenditures of Federal Awards ................................................................................................................... 65 Schedule of Average Daily Attendance (ADA) ................................................................................................................. 66 Schedule of Instructional Time ........................................................................................................................................... 67 Schedule of Financial Trends and Analysis ...................................................................................................................... 68 Reconciliation of Annual Financial and Budget Report with Audited Financial Statements ....................................... 69 Schedule of Charter Schools .............................................................................................................................................. 70 Combining Statements – Non-Major Governmental Funds
Combining Balance Sheet ................................................................................................................................................ 71 Combining Statement of Revenues, Expenditures, and Changes in Fund Balances ............................................... 72
Local Education Agency Organization Structure ............................................................................................................. 73 Notes to Supplementary Information ................................................................................................................................. 74
SADDLEBACK VALLEY UNIFIED SCHOOL DISTRICT TABLE OF CONTENTS JUNE 30, 2019
OTHER INDEPENDENT AUDITORS’ REPORTS
Report on Internal Control Over Financial Reporting and on Compliance and Other Matters Based on an Audit of Financial Statements Performed in Accordance with Government Auditing Standards ......................................... 76
Report on Compliance For Each Major Federal Program; and Report on Internal Control Over Compliance Required by the Uniform Guidance .................................................................................................................................................. 78
Report on State Compliance ............................................................................................................................................... 80
SCHEDULE OF FINDINGS AND QUESTIONED COSTS
Summary of Auditors’ Results ............................................................................................................................................. 82 Financial Statement Findings .............................................................................................................................................. 83 Federal Award Findings and Questioned Costs ............................................................................................................... 85 State Award Findings and Questioned Costs ................................................................................................................... 86 Summary Schedule of Prior Audit Findings ...................................................................................................................... 87 Management Letter .............................................................................................................................................................. 88

FINANCIAL SECTION
O: 619-270-8222 F: 619-260-9085christywhite.com
348 Olive StreetSan Diego, CA 92103
Certified Public Accountants serving K-12 School Districts and Charter Schools throughout California
1
INDEPENDENT AUDITORS’ REPORT Governing Board Saddleback Valley Unified School District Mission Viejo, California Report on the Financial Statements We have audited the accompanying financial statements of the governmental activities, the business-type activities, each major fund, and the aggregate remaining fund information of the Saddleback Valley Unified School District, as of and for the year ended June 30, 2019, and the related notes to the financial statements, which collectively comprise the Saddleback Valley Unified School District’s basic financial statements as listed in the table of contents. Management’s Responsibility for the Financial Statements Management is responsible for the preparation and fair presentation of these financial statements in accordance with accounting principles generally accepted in the United States of America; this includes the design, implementation, and maintenance of internal control relevant to the preparation and fair presentation of financial statements that are free from material misstatement, whether due to fraud or error. Auditor’s Responsibility Our responsibility is to express opinions on these financial statements based on our audit. We conducted our audit in accordance with auditing standards generally accepted in the United States of America and the standards applicable to financial audits contained in Government Auditing Standards, issued by the Comptroller General of the United States. Those standards require that we plan and perform the audit to obtain reasonable assurance about whether the financial statements are free from material misstatement. An audit involves performing procedures to obtain audit evidence about the amounts and disclosures in the financial statements. The procedures selected depend on the auditor's judgment, including the assessment of the risks of material misstatement of the financial statements, whether due to fraud or error. In making those risk assessments, the auditor considers internal control relevant to the entity's preparation and fair presentation of the financial statements in order to design audit procedures that are appropriate in the circumstances, but not for the purpose of expressing an opinion on the effectiveness of the entity's internal control. Accordingly, we express no such opinion. An audit also includes evaluating the appropriateness of accounting policies used and the reasonableness of significant accounting estimates made by management, as well as evaluating the overall presentation of the financial statements. We believe that the audit evidence we have obtained is sufficient and appropriate to provide a basis for our audit opinions. Opinions In our opinion, the financial statements referred to above present fairly, in all material respects, the respective financial position of the governmental activities, each major fund, and the aggregate remaining fund information of Saddleback Valley Unified School District, as of June 30, 2019, and the respective changes in financial position and, where applicable, cash flows thereof for the year then ended in accordance with accounting principles generally accepted in the United States of America.
2
Other Matters Required Supplementary Information Accounting principles generally accepted in the United States of America require that the required supplementary information, such as management’s discussion and analysis, budgetary comparison information, schedules of changes in OPEB liability and related ratios, schedules of proportionate share of net pension liability, and schedules of District contributions for pensions be presented to supplement the basic financial statements. Such information, although not part of the basic financial statements, is required by the Governmental Accounting Standards Board who considers it to be an essential part of financial reporting for placing the basic financial statements in appropriate operational, economic, or historical context. We have applied certain limited procedures to the required supplementary information in accordance with auditing standards generally accepted in the United States of America, which consisted of inquiries of management about the methods of preparing the information and comparing the information for consistency with management’s responses to our inquiries, the basic financial statements, and other knowledge we obtained during our audit of the basic financial statements. We do not express an opinion or provide any assurance on the information because the limited procedures do not provide us with sufficient evidence to express an opinion or provide any assurance. Supplementary Information Our audit was conducted for the purpose of forming opinions on the financial statements that collectively comprise the Saddleback Valley Unified School District’s basic financial statements. The supplementary information listed in the table of contents, including the schedule of expenditures of Federal awards, as required by Title 2 U.S. Code of Federal Regulations (CFR) Part 200, Uniform Administrative Requirements, Cost Principles, and Audit Requirements for Federal Awards, is presented for purposes of additional analysis and is not a required part of the basic financial statements. The supplementary information listed in the table of contents is the responsibility of management and was derived from and relates directly to the underlying accounting and other records used to prepare the basic financial statements. Such information has been subjected to the auditing procedures applied in the audit of the basic financial statements and certain additional procedures, including comparing and reconciling such information directly to the underlying accounting and other records used to prepare the basic financial statements or to the basic financial statements themselves, and other additional procedures in accordance with auditing standards generally accepted in the United States of America. In our opinion, the supplementary information is fairly stated, in all material respects, in relation to the basic financial statements as a whole. Other Reporting Required by Government Auditing Standards In accordance with Government Auditing Standards, we have also issued our report dated December 20, 2019 on our consideration of Saddleback Valley Unified School District's internal control over financial reporting and on our tests of its compliance with certain provisions of laws, regulations, contracts, and grant agreements and other matters. The purpose of that report is solely to describe the scope of our testing of internal control over financial reporting and compliance and the results of that testing, and not to provide an opinion on the effectiveness of Saddleback Valley Unified School District’s internal control over financial reporting or on compliance. That report is an integral part of an audit performed in accordance with Government Auditing Standards in considering Saddleback Valley Unified School District’s internal control over financial reporting and compliance. San Diego, California December 20, 2019
3
SADDLEBACK VALLEY UNIFIED SCHOOL DISTRICT MANAGEMENT’S DISCUSSION AND ANALYSIS
INTRODUCTION Our discussion and analysis of Saddleback Valley Unified School District’s (District) financial performance provides an overview of the District’s financial activities for the fiscal year ended June 30, 2019. It should be read in conjunction with the District’s financial statements, which follow this section. FINANCIAL HIGHLIGHTS
The District’s combined net position was $56,390,998 at June 30, 2019. This was an aggregate decrease of $11,135,504 from the prior year after restatement. The District’s combined net position is comprised of $57,648,182 related to governmental activities and $(1,257,184) related to business-type activities.
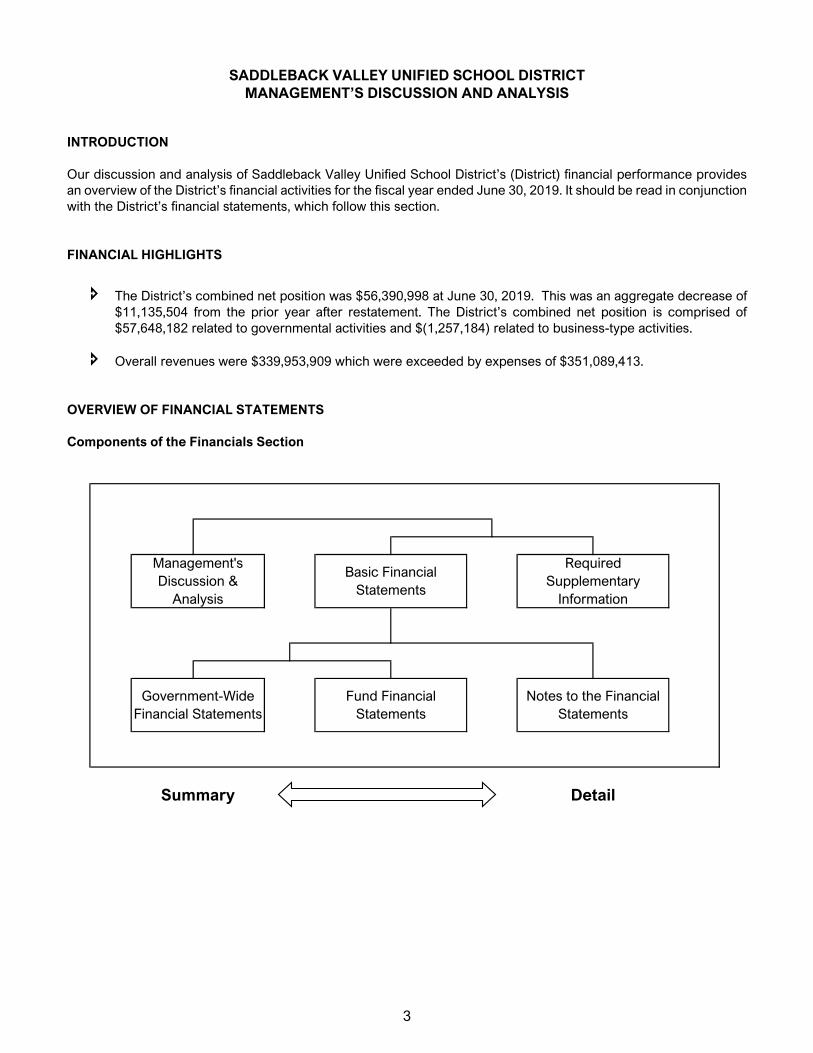
Overall revenues were $339,953,909 which were exceeded by expenses of $351,089,413. OVERVIEW OF FINANCIAL STATEMENTS Components of the Financials Section
Summary Detail
Management's Discussion &
Analysis
Basic Financial Statements
Required Supplementary
Information
Government-Wide Financial Statements
Fund Financial Statements
Notes to the Financial Statements
4
SADDLEBACK VALLEY UNIFIED SCHOOL DISTRICT MANAGEMENT’S DISCUSSION AND ANALYSIS, continued FOR THE YEAR ENDED JUNE 30, 2019 OVERVIEW OF FINANCIAL STATEMENTS (continued) Components of the Financials Section (continued) This annual report consists of three parts – Management’s Discussion and Analysis (this section), the basic financial statements, and required supplementary information. The three sections together provide a comprehensive overview of the District. The basic financial statements are comprised of two kinds of statements that present financial information from different perspectives:
Government-wide financial statements, which comprise the first two statements, provide both short-term and long-term information about the entity’s overall financial position.
Fund financial statements focus on reporting the individual parts of District operations in more detail. The fund financial statements comprise the remaining statements.
Governmental Funds provide a detailed short-term view that helps you determine whether there are more or fewer financial resources that can be spent in the near future to finance the District’s programs.
Proprietary Funds report services for which the District charges customers a fee. Like the government-wide statements, they provide both long- and short-term financial information.
Fiduciary Funds report balances for which the District is a custodian or trustee of the funds, such
as Associated Student Bodies and pension funds.
The financial statements also include notes that explain some of the information in the statements and provide more detailed data. The basic financial statements are followed by a section of required and other supplementary information that further explain and support the financial statements. Government-Wide Statements The government-wide statements report information about the District as a whole using accounting methods similar to those used by private-sector companies. The statement of net position includes all of the government’s assets and liabilities. All of the current year’s revenues and expenses are accounted for in the statement of activities, regardless of when cash is received or paid. The two government-wide statements report the District’s net position and how it has changed. Net position is one way to measure the District’s financial health. Over time, increases or decreases in the District’s net position are an indicator of whether its financial health is improving or deteriorating, respectively. The government-wide financial statements of the District include governmental activities. All of the District’s basic services are included here, such as regular education, food service, maintenance and general administration. Local control formula funding and federal and state grants finance most of these activities.

5
SADDLEBACK VALLEY UNIFIED SCHOOL DISTRICT MANAGEMENT’S DISCUSSION AND ANALYSIS, continued FOR THE YEAR ENDED JUNE 30, 2019 FINANCIAL ANALYSIS OF THE ENTITY AS A WHOLE Net Position The District’s combined net position was $56,390,998 at June 30, 2019, as reflected in the table below. Of this amount, $(226,763,426) was unrestricted. Restricted net position is reported separately to show legal constraints from debt covenants and enabling legislation that limit the Governing Board’s ability to use that net position for day-to-day operations.
2019 2018 Net Change 2019 2018 Net ChangeASSETS
Current and other assets 181,972,550$ 188,085,318$ (6,112,768)$ 1,077,954$ 1,143,039$ (65,085)$ Capital assets 352,198,412 350,706,854 1,491,558 29,320 28,115 1,205
Total Assets 534,170,962 538,792,172 (4,621,210) 1,107,274 1,171,154 (63,880)
DEFERRED OUTFLOWS OF RESOURCES 89,953,514 95,073,078 (5,119,564) 454,142 505,439 (51,297)
LIABILITIESCurrent liabilities 39,086,381 17,960,910 21,125,471 1,089,792 754,498 335,294 Long-term liabilities 499,290,095 525,104,777 (25,814,682) 1,641,924 1,586,566 55,358
Total Liabilities 538,376,476 543,065,687 (4,689,211) 2,731,716 2,341,064 390,652
DEFERRED INFLOWS OF RESOURCES 28,099,818 25,427,690 2,672,128 86,884 74,192 12,692
NET POSITIONNet investment in capital assets 233,602,559 222,965,444 10,637,115 29,320 28,115 1,205 Restricted 49,522,545 65,897,792 (16,375,247) - - - Unrestricted (225,476,922) (223,491,363) (1,985,559) (1,286,504) (766,778) (519,726)
Total Net Position 57,648,182$ 65,371,873$ (7,723,691)$ (1,257,184)$ (738,663)$ (518,521)$
Governmental Activities Business-Type Activities

6
SADDLEBACK VALLEY UNIFIED SCHOOL DISTRICT MANAGEMENT’S DISCUSSION AND ANALYSIS, continued FOR THE YEAR ENDED JUNE 30, 2019 FINANCIAL ANALYSIS OF THE ENTITY AS A WHOLE (continued) Changes in Net Position The results of this year’s operations for the District as a whole are reported in the Statement of Activities. The table below takes the information from the Statement and rearranges it, so you can see our total revenues, expenses, and special items for the year.
The cost of all our governmental activities this year was $346,770,574 (refer to the table above). The amount that our taxpayers ultimately financed for these activities through taxes was only $207,120,124 because a portion of the cost was paid by other governments and organizations who subsidized certain programs with grants and contributions. The District’s business-type activities experienced a decrease in net position of $518,521 during the year ended June 30, 2019.
2019 2018 Net Change 2019 2018 Net ChangeREVENUES
Program revenuesCharges for services 5,988,763$ 3,351,474$ 2,637,289$ 2,555,154$ 3,750,720$ (1,195,566)$ Operating grants and contributions 47,463,584 53,923,142 (6,459,558) 45,978 26,572 19,406 Capital grants and contributions 522,404 1,841 520,563 - - -
General revenuesProperty taxes 207,120,124 193,364,697 13,755,427 - - - Unrestricted federal and state aid 56,434,889 58,311,834 (1,876,945) - - - Other 18,659,490 16,313,102 2,346,388 1,163,523 2,089 1,161,434
Total Revenues 336,189,254 325,266,090 10,923,164 3,764,655 3,779,381 (14,726) EXPENSES
Instruction 203,962,762 196,524,905 7,437,857 - - - Instruction-related services 30,957,789 29,404,371 1,553,418 - - - Pupil services 26,628,558 26,405,532 223,026 - - - General administration 13,525,005 13,830,127 (305,122) - - - Plant services 27,706,631 24,273,883 3,432,748 - - - Ancillary and community services 12,931,185 10,926,211 2,004,974 - - - Debt service 4,112,800 4,092,572 20,228 - - - Other outgo 8,875,963 9,898,015 (1,022,052) - - - Depreciation 18,014,156 17,352,243 661,913 - - - Other 55,725 8,668 47,057 4,318,839 4,354,072 (35,233)
Total Expenses 346,770,574 332,716,527 14,054,047 4,318,839 4,354,072 (35,233) Transfers & special items (35,663) - (35,663) 35,663 - 35,663 Change in net position (10,616,983) (7,450,437) (3,166,546) (518,521) (574,691) 56,170 Net Position - Beginning, as Restated 68,265,165 72,822,310 (4,557,145) (738,663) (163,972) (574,691) Net Position - Ending 57,648,182$ 65,371,873$ (7,723,691)$ (1,257,184)$ (738,663)$ (518,521)$
Governmental Activities Business-Type Activities

7
SADDLEBACK VALLEY UNIFIED SCHOOL DISTRICT MANAGEMENT’S DISCUSSION AND ANALYSIS, continued FOR THE YEAR ENDED JUNE 30, 2019 FINANCIAL ANALYSIS OF THE ENTITY AS A WHOLE (continued) Changes in Net Position (continued) In the table below, we have presented the net cost of each of the District’s functions. Net cost shows the financial burden that was placed on the District’s taxpayers by each of these functions. Providing this information allows our citizens to consider the cost of each function in comparison to the benefits they believe are provided by that function.
2019 2018Instruction 171,382,720$ 158,864,834$ Instruction-related services 27,838,936 26,216,512 Pupil services 18,489,446 18,123,094 General administration 11,139,366 12,153,427 Plant services 24,150,607 24,258,239 Ancillary and community services 12,423,333 10,553,929 Debt service 4,112,800 4,092,572 Transfers to other agencies 5,231,632 3,816,552 Depreciation 18,014,156 17,352,243 Other 12,827 8,668
Total Expenses 292,795,823$ 275,440,070$
Net Cost of Services
FINANCIAL ANALYSIS OF THE DISTRICT’S MAJOR FUNDS The financial performance of the District as a whole is reflected in its governmental funds as well. As the District completed this year, its governmental funds reported a combined fund balance of $124,091,785 which is less than last year’s restated ending fund balance of $134,483,273. The District’s General Fund had $1,947,689 less in operating revenues than expenditures for the year ended June 30, 2019. In addition, the Capital Facilities Fund had $5,148,772 less in operating revenues than expenditures for the year ended June 30, 2019 due to ongoing capital projects. CURRENT YEAR BUDGET 2018-2019 The Board of Education approves financial projections included with the Adopted Budget, First Interim, and Second Interim financial reports. The Unaudited Actuals reflect the District’s financial projections and current budget based on State and local financial information.
8
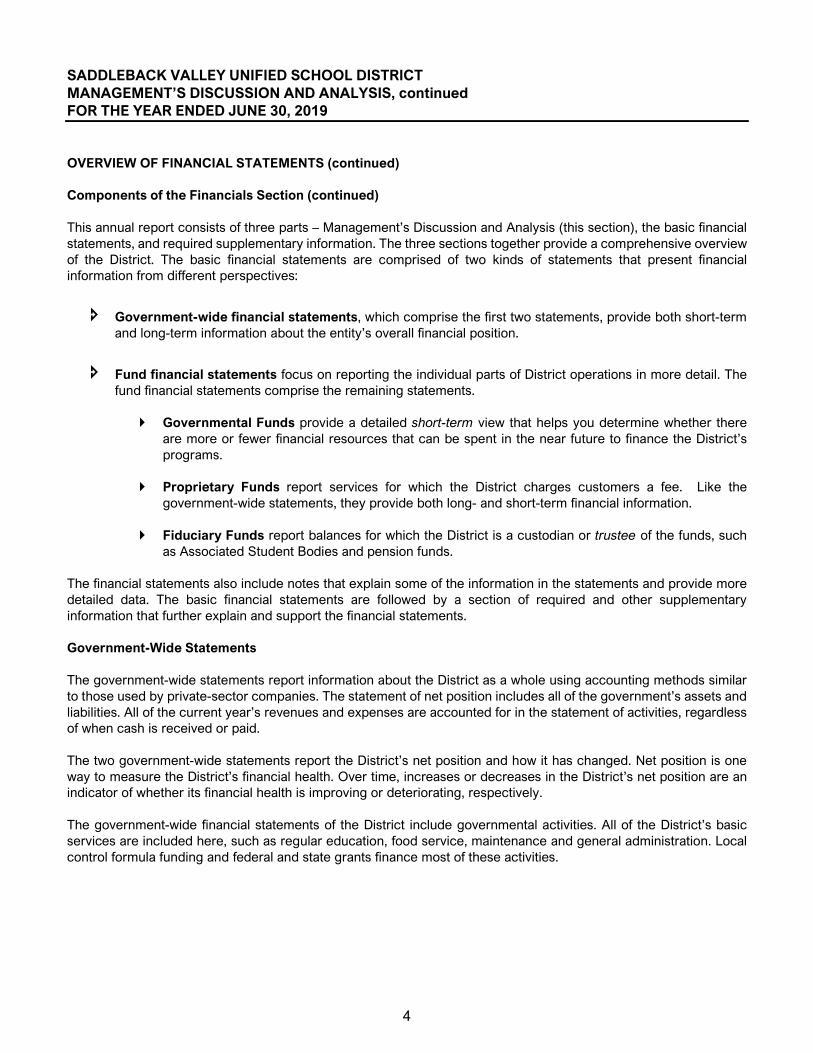
SADDLEBACK VALLEY UNIFIED SCHOOL DISTRICT MANAGEMENT’S DISCUSSION AND ANALYSIS, continued FOR THE YEAR ENDED JUNE 30, 2019 CAPITAL ASSETS AND LONG-TERM LIABILITIES Capital Assets By the end of 2018-2019 the District had invested a total of $352,227,732 in capital assets, net of accumulated depreciation.
2019 2018 Net Change 2019 2018 Net ChangeCAPITAL ASSETS
Land 39,487,653$ 39,487,653$ -$ -$ -$ -$ Construction in progress 36,801,983 20,017,441 16,784,542 - - - Land improvements 60,556,071 60,520,984 35,087 500,000 500,000 - Buildings & improvements 458,489,614 456,730,687 1,758,927 8,620 - 8,620 Furniture & equipment 30,650,629 30,013,344 637,285 74,625 74,625 - Accumulated depreciation (273,787,538) (256,063,255) (17,724,283) (553,925) (546,510) (7,415)
Total Capital Assets 352,198,412$ 350,706,854$ 1,491,558$ 29,320$ 28,115$ 1,205$
Governmental Activities Business-Type Activities
Long-Term Liabilities At year-end, the District had a total of $500,932,019 in long-term liabilities, a decrease of 4.85% from last year – as shown in the table below. (More detailed information about the District’s long-term liabilities is presented in footnotes to the financial statements.)
2019 2018 Net Change 2019 2018 Net ChangeLONG-TERM LIABILITIES
Total general obligation bonds 121,750,209$ 128,353,015$ (6,602,806)$ -$ -$ -$ Compensated absences 1,177,131 1,534,501 (357,370) - - - Total OPEB liability 83,927,290 81,304,225 2,623,065 - - - Net pension liability 288,429,458 289,144,328 (714,870) 1,641,924 1,586,566 55,358 Claims liability 11,102,531 13,631,775 (2,529,244) - - - Less: current portion of long-term liabilities (7,096,524) 10,931,662 (18,028,186) - - -
Total Long-term Liabilities 499,290,095$ 524,899,506$ (25,609,411)$ 1,641,924$ 1,586,566$ 55,358$
Business-Type ActivitiesGovernmental Activities
9
SADDLEBACK VALLEY UNIFIED SCHOOL DISTRICT MANAGEMENT’S DISCUSSION AND ANALYSIS, continued FOR THE YEAR ENDED JUNE 30, 2019 ECONOMIC FACTORS AND NEXT YEAR’S BUDGET At the time these financial statements were prepared and audited, the District was aware of several circumstances that could affect its future financial health. The US economy continues to grow slowly, but the State economic growth is slowing down due to low levels of available employees. However, the State is still experiencing overall economic prosperity. The State Budget for Education contained an increase of 3.26% in fiscal year 2019-20, plus $3.15 billion in non-Proposition 98 funding for school employer pension relief. The fiscal policy for the funding of public education changes annually, based on fluctuations in State revenues. The UCLA Anderson Forecast (June 2019) noted that the risk of recession is about 50% within the next 5-8 quarters depending on the model, the biggest economic threat being from the escalating trade war with China and Mexico. If a recession were to happen, State revenues for public education would be negatively impacted. Landmark legislation passed in Year 2013 reformed California school district finance by creating the Local Control Funding Formula (LCFF). The LCFF is designed to provide a flexible funding mechanism that links student achievement to state funding levels. The LCFF provides a per pupil base grant amount, by grade span, that is augmented by supplemental funding for targeted student groups in low income brackets, those that are English language learners and foster youth. Factors related to LCFF that the District is monitoring include: (1) estimates of funding in the next budget year and beyond; (2) the Local Control and Accountability Plan (LCAP) that aims to link student accountability measurements to funding allocations; (3) ensuring the integrity of reporting student data through the California Longitudinal Pupil Achievement Data System (CALPADs); and, (4) meeting annual compliance and audit requirements. The District participates in state employee pensions plans, PERS and STRS, and both are underfunded. The District’s proportionate share of the liability is reported in the Statement of Net Position as of June 30, 2019. The amount of the liability is material to the financial position of the District. To address the underfunding issues, the pension plans received a one-time funding allocation from the 2019-20 State Budget and continue to raise employer rates in future years. The projected increased pension costs to school employers remain a significant fiscal factor. Enrollment can fluctuate due to factors such as population growth, competition from private, parochial, inter-district transfers in or out, economic conditions and housing values. Losses in enrollment will cause a school district to lose operating revenues without necessarily permitting the district to make adjustments in fixed operating costs. All of these factors were considered in preparing the District’s budget for the 2019-20 fiscal year. CONTACTING THE DISTRICT’S FINANCIAL MANAGEMENT This financial report is designed to provide our citizens, taxpayers, students, and investors and creditors with a general overview of the District’s finances and to show the District’s accountability for the money it receives. If you have questions about this report or need any additional financial information, contact the Assistant Superintendent of Human Resources & Fiscal Services at the District’s Office, 25631 Peter A. Hartman Way, Mission Viejo, CA 92691 or (949) 586-1234.

The accompanying notes are an integral part of these financial statements.
10
SADDLEBACK VALLEY UNIFIED SCHOOL DISTRICT STATEMENT OF NET POSITION JUNE 30, 2019
Governmental Business-TypeActivities Activities Total
ASSETSCash and investments 158,033,285$ 149,829$ 158,183,114$ Accounts receivable 23,121,260 1,012,699 24,133,959 Internal balances 84,574 (84,574) - Inventory 345,765 - 345,765 Prepaid expenses 387,666 - 387,666 Capital assets, not depreciated 76,289,636 - 76,289,636 Capital assets, net of accumulated depreciation 275,908,776 29,320 275,938,096
Total Assets 534,170,962 1,107,274 535,278,236
DEFERRED OUTFLOWS OF RESOURCES Deferred outflows related to pensions 80,107,349 454,142 80,561,491 Deferred outflows related to OPEB 6,691,809 - 6,691,809 Deferred amount on refunding 3,154,356 - 3,154,356
Total Deferred Outflows of Resources 89,953,514 454,142 90,407,656
LIABILITIESAccrued liabilities 31,002,963 637,599 31,640,562 Unearned revenue 986,894 452,193 1,439,087 Long-term liabilities, current portion 7,096,524 - 7,096,524 Long-term liabilities, non-current portion 499,290,095 1,641,924 500,932,019
Total Liabilities 538,376,476 2,731,716 541,108,192
DEFERRED INFLOWS OF RESOURCES Deferred inflows related to pensions 27,862,496 86,884 27,949,380 Deferred inflows related to OPEB 237,322 - 237,322
Total Deferred Inflows of Resources 28,099,818 86,884 28,186,702
NET POSITIONNet investment in capital assets 233,602,559 29,320 233,631,879 Restricted:
Capital projects 36,331,063 - 36,331,063 Debt service 6,585,989 - 6,585,989 Educational programs 6,428,798 - 6,428,798 Food services 176,695 - 176,695
Unrestricted (225,476,922) (1,286,504) (226,763,426) Total Net Position 57,648,182$ (1,257,184)$ 56,390,998$

The accompanying notes are an integral part of these financial statements.
11
SADDLEBACK VALLEY UNIFIED SCHOOL DISTRICT STATEMENT OF ACTIVITIES FOR THE YEAR ENDED JUNE 30, 2019
Operating CapitalCharges for Grants and Grants and Governmental Business-Type
Expenses Services Contributions Contributions Activities Activities TotalGOVERNMENTAL ACTIVITIES
Instruction 203,962,762$ 416,620$ 31,641,018$ 522,404$ (171,382,720)$ Instruction-related services
Instructional supervision and administration 8,238,847 11,737 2,192,942 - (6,034,168) Instructional library, media, and technology 3,833,830 4,472 133,869 - (3,695,489) School site administration 18,885,112 5,455 770,378 - (18,109,279)
Pupil servicesHome-to-school transportation 3,805,040 - 37,239 - (3,767,801) Food services 6,450,926 2,079,368 3,943,951 - (427,607) All other pupil services 16,372,592 42,775 2,035,779 - (14,294,038)
General administrationCentralized data processing 4,013,626 - 73,060 - (3,940,566) All other general administration 9,511,379 149,244 2,163,335 - (7,198,800)
Plant services 27,706,631 1,874,198 1,681,826 - (24,150,607) Ancillary services 2,236,291 22 57,934 - (2,178,335) Community services 10,694,894 84,019 365,877 - (10,244,998) Enterprise activities 55,725 - 42,898 - (12,827) Interest on long-term debt 4,112,800 - - - (4,112,800) Other outgo 8,875,963 1,320,853 2,323,478 - (5,231,632) Depreciation (unallocated) 18,014,156 - - - (18,014,156)
Total Governmental Activities 346,770,574$ 5,988,763$ 47,463,584$ 522,404$ (292,795,823) BUSINESS-TYPE ACTIVITIES
Enterprise activities 4,318,839 2,555,154 45,978 - (1,717,707)$ Total Business-Type Activities 4,318,839 2,555,154 45,978 - (1,717,707) Total School District 351,089,413$ 8,543,917$ 47,509,562$ 522,404$ (294,513,530)$
General revenuesTaxes and subventions
Property taxes, levied for general purposes 193,952,264 - 193,952,264 Property taxes, levied for debt service 10,635,201 - 10,635,201 Property taxes, levied for other specific purposes 2,532,659 - 2,532,659 Federal and state aid not restricted for specific purposes 56,434,889 - 56,434,889
Interest and investment earnings 2,263,461 10,065 2,273,526 Miscellaneous 16,396,029 1,153,458 17,549,487
Subtotal, General Revenue 282,214,503 1,163,523 283,378,026 Change in net position before transfers & special items (10,581,320) (554,184) (11,135,504)
Internal transfers (35,663) 35,663 - Total Transfers & Special Items (35,663) 35,663 - CHANGE IN NET POSITION (10,616,983) (518,521) (11,135,504) Net Position - Beginning, as Restated 68,265,165 (738,663) 67,526,502 Net Position - Ending 57,648,182$ (1,257,184)$ 56,390,998$
Function/Programs
Net (Expenses)Revenues and
Changes inProgram Revenues Net Position
The accompanying notes are an integral part of these financial statements.
12
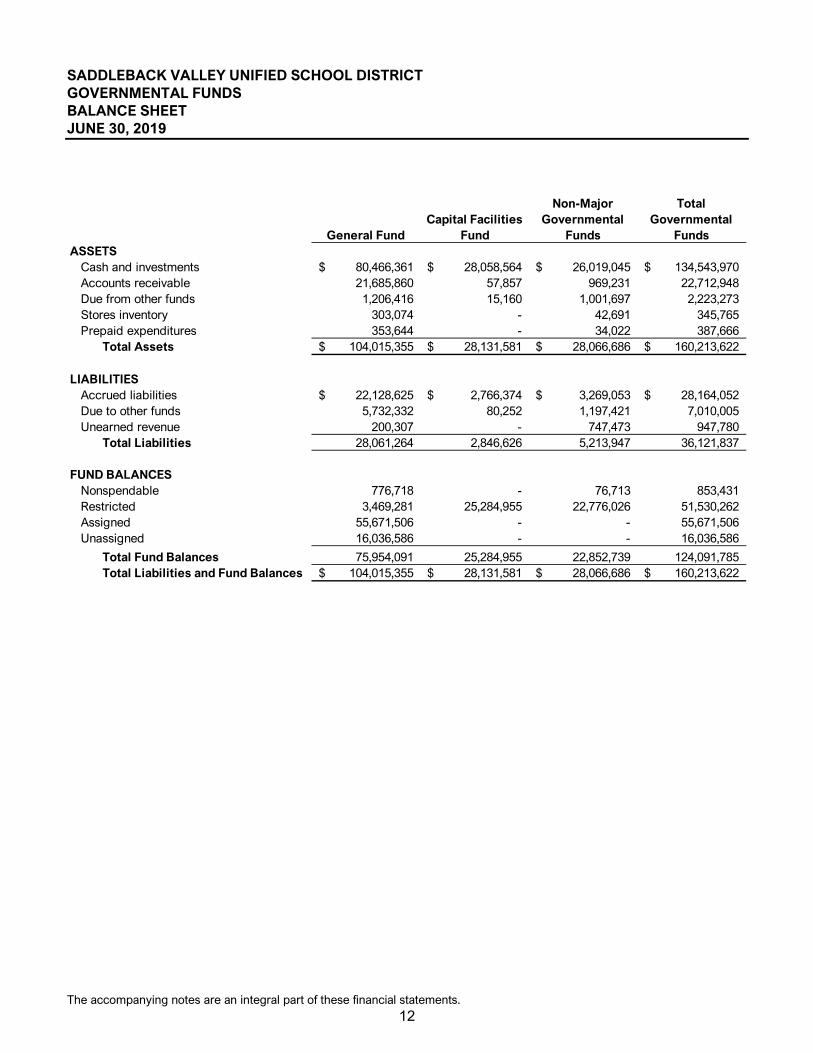
SADDLEBACK VALLEY UNIFIED SCHOOL DISTRICT GOVERNMENTAL FUNDS BALANCE SHEET JUNE 30, 2019
General FundCapital Facilities
Fund
Non-Major Governmental
Funds
Total Governmental
FundsASSETS
Cash and investments 80,466,361$ 28,058,564$ 26,019,045$ 134,543,970$ Accounts receivable 21,685,860 57,857 969,231 22,712,948 Due from other funds 1,206,416 15,160 1,001,697 2,223,273 Stores inventory 303,074 - 42,691 345,765 Prepaid expenditures 353,644 - 34,022 387,666
Total Assets 104,015,355$ 28,131,581$ 28,066,686$ 160,213,622$
LIABILITIESAccrued liabilities 22,128,625$ 2,766,374$ 3,269,053$ 28,164,052$ Due to other funds 5,732,332 80,252 1,197,421 7,010,005 Unearned revenue 200,307 - 747,473 947,780
Total Liabilities 28,061,264 2,846,626 5,213,947 36,121,837
FUND BALANCESNonspendable 776,718 - 76,713 853,431 Restricted 3,469,281 25,284,955 22,776,026 51,530,262 Assigned 55,671,506 - - 55,671,506 Unassigned 16,036,586 - - 16,036,586
Total Fund Balances 75,954,091 25,284,955 22,852,739 124,091,785 Total Liabilities and Fund Balances 104,015,355$ 28,131,581$ 28,066,686$ 160,213,622$

The accompanying notes are an integral part of these financial statements.
13
SADDLEBACK VALLEY UNIFIED SCHOOL DISTRICT RECONCILIATION OF THE GOVERNMENTAL FUNDS BALANCE SHEET TO THE STATEMENT OF NET POSITION JUNE 30, 2019
Total Fund Balance - Governmental Funds 124,091,785$
Capital assets:
Capital assets 625,985,950$ Accumulated depreciation (273,787,538) 352,198,412
Deferred amount on refunding:
3,154,356
Unmatured interest on long-term debt:
(2,007,717)
Long-term liabilities:
Total general obligation bonds 121,750,209$ Compensated absences 1,177,131 Total OPEB liability 83,927,290 Net pension liability 288,429,458 (495,284,088)
Deferred outflows and inflows of resources relating to pensions:
Deferred outflows of resources related to pensions 80,107,349$ Deferred inflows of resources related to pensions (27,862,496) 52,244,853
Deferred outflows and inflows of resources relating to OPEB:
Deferred outflows of resources related to OPEB 6,691,809$ Deferred inflows of resources related to OPEB (237,322) 6,454,487
Internal service funds:
16,796,094
Total Net Position - Governmental Activities 57,648,182$
Amounts reported for assets and liabilities for governmental activities in the statement of net position are different from amounts reported in governmental funds because:
Internal service funds are used to conduct certain activities for which costs arecharged to other funds on a full cost-recovery basis. Because internal service fundsare presumed to operate for the benefit of governmental activities, assets, deferredoutflows of resources, liabilities, and deferred inflows of resources of internal servicefunds are reported with governmental activities in the statement of net position. Netposition for internal service funds is:
In governmental funds, only current assets are reported. In the statement of netposition, all assets are reported, including capital assets and accumulateddepreciation:
In governmental funds, the net effect of refunding bonds is recognized when debt isissued, whereas this amount is deferred and amortized in the government-widefinancial statements:
In governmental funds, interest on long-term debt is not recognized until the period in which it matures and is paid. In the government-wide statement of activities, it isrecognized in the period that it is incurred. The additional liability for unmaturedinterest owing at the end of the period was:
In governmental funds, only current liabilities are reported. In the statement of netposition, all liabilities, including long-term liabilities, are reported. Long-termliabilities relating to governmental activities consist of:
In governmental funds, deferred outflows and inflows of resources relating topensions are not reported because they are applicable to future periods. In thestatement of net position, deferred outflows and inflows of resources relating topensions are reported.
In governmental funds, deferred outflows and inflows of resources relating to OPEBare not reported because they are applicable to future periods. In the statement ofnet position, deferred outflows and inflows of resources relating to OPEB arereported.
The accompanying notes are an integral part of these financial statements.
14
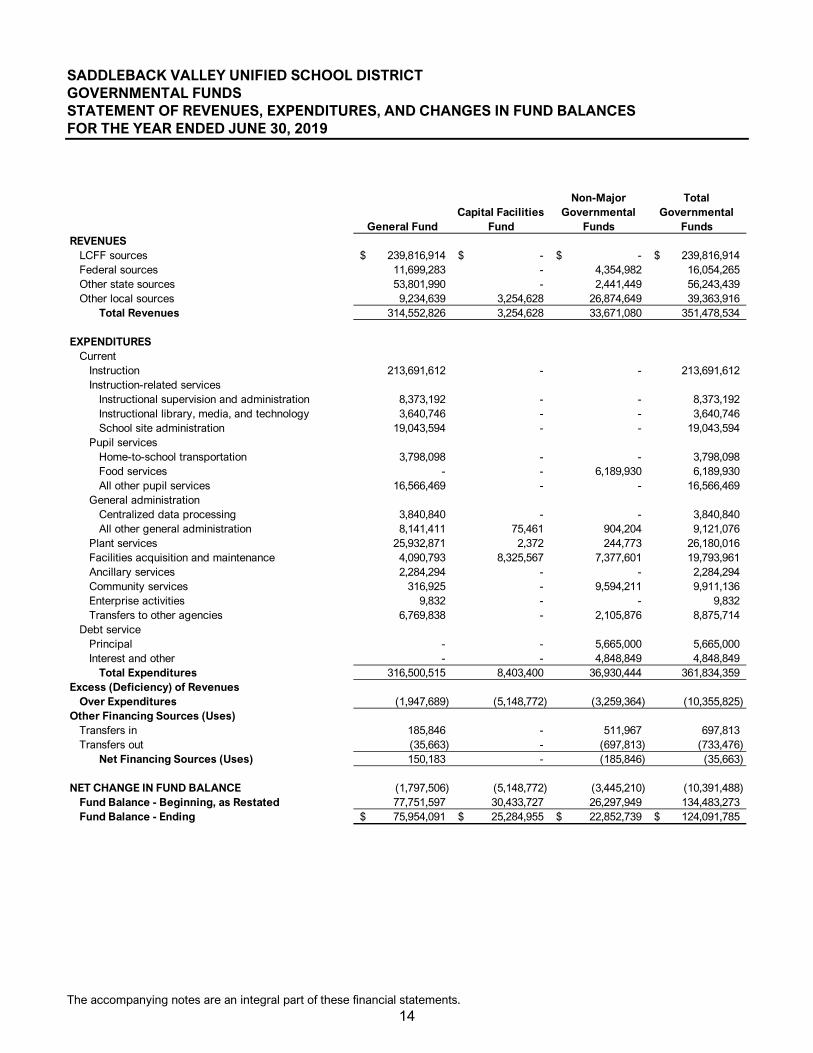
SADDLEBACK VALLEY UNIFIED SCHOOL DISTRICT GOVERNMENTAL FUNDS STATEMENT OF REVENUES, EXPENDITURES, AND CHANGES IN FUND BALANCES FOR THE YEAR ENDED JUNE 30, 2019
General FundCapital Facilities
Fund
Non-Major Governmental
Funds
Total Governmental
FundsREVENUES
LCFF sources 239,816,914$ -$ -$ 239,816,914$ Federal sources 11,699,283 - 4,354,982 16,054,265 Other state sources 53,801,990 - 2,441,449 56,243,439 Other local sources 9,234,639 3,254,628 26,874,649 39,363,916
Total Revenues 314,552,826 3,254,628 33,671,080 351,478,534
EXPENDITURESCurrent
Instruction 213,691,612 - - 213,691,612 Instruction-related services
Instructional supervision and administration 8,373,192 - - 8,373,192 Instructional library, media, and technology 3,640,746 - - 3,640,746 School site administration 19,043,594 - - 19,043,594
Pupil servicesHome-to-school transportation 3,798,098 - - 3,798,098 Food services - - 6,189,930 6,189,930 All other pupil services 16,566,469 - - 16,566,469
General administrationCentralized data processing 3,840,840 - - 3,840,840 All other general administration 8,141,411 75,461 904,204 9,121,076
Plant services 25,932,871 2,372 244,773 26,180,016 Facilities acquisition and maintenance 4,090,793 8,325,567 7,377,601 19,793,961 Ancillary services 2,284,294 - - 2,284,294 Community services 316,925 - 9,594,211 9,911,136 Enterprise activities 9,832 - - 9,832 Transfers to other agencies 6,769,838 - 2,105,876 8,875,714
Debt servicePrincipal - - 5,665,000 5,665,000 Interest and other - - 4,848,849 4,848,849
Total Expenditures 316,500,515 8,403,400 36,930,444 361,834,359 Excess (Deficiency) of Revenues
Over Expenditures (1,947,689) (5,148,772) (3,259,364) (10,355,825) Other Financing Sources (Uses)
Transfers in 185,846 - 511,967 697,813 Transfers out (35,663) - (697,813) (733,476)
Net Financing Sources (Uses) 150,183 - (185,846) (35,663)
NET CHANGE IN FUND BALANCE (1,797,506) (5,148,772) (3,445,210) (10,391,488) Fund Balance - Beginning, as Restated 77,751,597 30,433,727 26,297,949 134,483,273 Fund Balance - Ending 75,954,091$ 25,284,955$ 22,852,739$ 124,091,785$

The accompanying notes are an integral part of these financial statements.
15
SADDLEBACK VALLEY UNIFIED SCHOOL DISTRICT RECONCILIATION OF THE GOVERNMENTAL FUNDS STATEMENT OF REVENUES, EXPENDITURES, AND CHANGES IN FUND BALANCES TO THE STATEMENT OF ACTIVITIES FOR THE YEAR ENDED JUNE 30, 2019
(continued on the following page)
Net Change in Fund Balances - Governmental Funds (10,391,488)$
Capital outlay:
Expenditures for capital outlay: 19,508,984$ Depreciation expense: (18,014,156) 1,494,828
Debt service:
5,665,000
Deferred amounts on refunding:
(315,436)
Gain or loss from the disposal of capital assets:
(3,270)
Unmatured interest on long-term debt:
113,430
Amounts reported for governmental activities in the statement of activities are differentfrom amounts reported in governmental funds because:
In governmental funds, the costs of capital assets are reported as expenditures inthe period when the assets are acquired. In the statement of activities, costs ofcapital assets are allocated over their estimated useful lives as depreciationexpense. The difference between capital outlay expenditures and depreciationexpense for the period is:
In governmental funds, repayments of long-term debt are reported as expenditures. In the government-wide statements, repayments of long-term debt are reported asreductions of liabilities. Expenditures for repayment of the principal portion of long-term debt were:
In governmental funds, deferred amounts on refunding are recognized in the periodthey are incurred. In the government-wide statements, the deferred amounts onrefunding are amortized over the life of the debt. The net effect of the deferredamounts on refunding during the period was:
In governmental funds, the entire proceeds from disposal of capital assets arereported as revenue. In the statement of activities, only the resulting gain or loss isreported. The difference between the proceeds from disposal of capital assets and the resulting gain or loss is:
In governmental funds, interest on long-term debt is recognized in the period that itbecomes due. In the government-wide statement of activities, it is recognized inthe period it is incurred. Unmatured interest owing at the end of the period, lessmatured interest paid during the period but owing from the prior period, was:
The accompanying notes are an integral part of these financial statements.
16
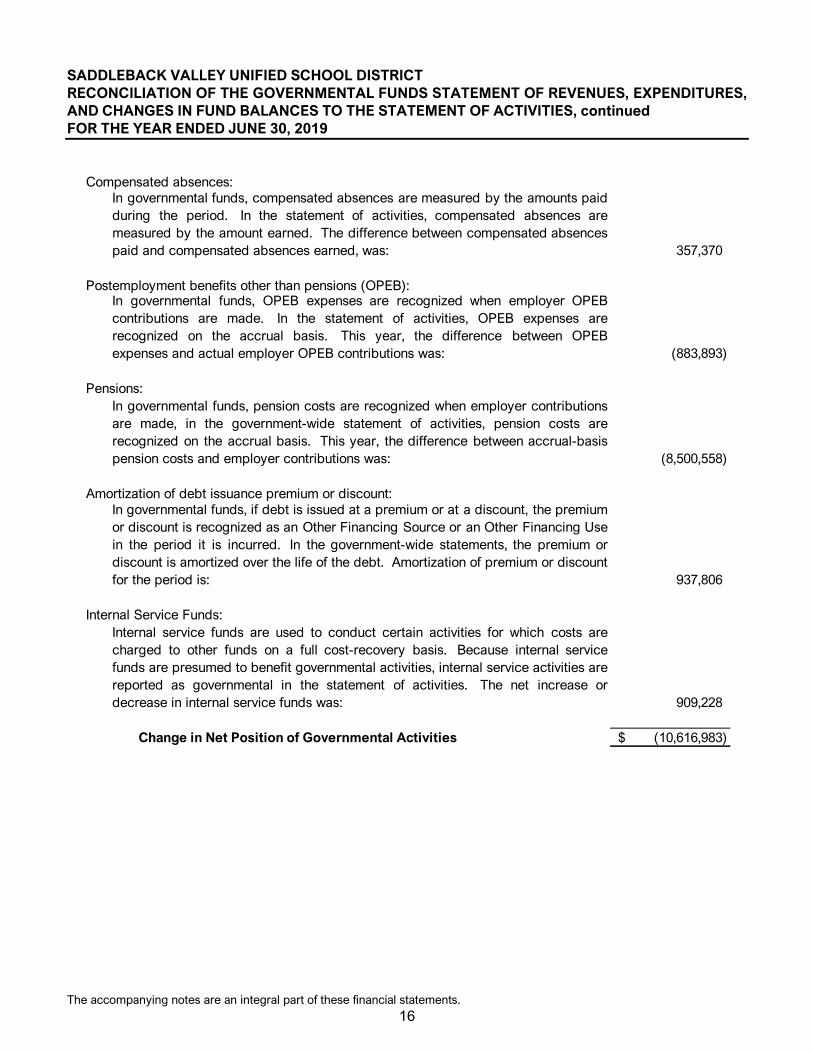
SADDLEBACK VALLEY UNIFIED SCHOOL DISTRICT RECONCILIATION OF THE GOVERNMENTAL FUNDS STATEMENT OF REVENUES, EXPENDITURES, AND CHANGES IN FUND BALANCES TO THE STATEMENT OF ACTIVITIES, continued FOR THE YEAR ENDED JUNE 30, 2019
Compensated absences:
357,370
Postemployment benefits other than pensions (OPEB):
(883,893)
Pensions:
(8,500,558)
Amortization of debt issuance premium or discount:
937,806
Internal Service Funds:
909,228
Change in Net Position of Governmental Activities (10,616,983)$
In governmental funds, if debt is issued at a premium or at a discount, the premiumor discount is recognized as an Other Financing Source or an Other Financing Usein the period it is incurred. In the government-wide statements, the premium ordiscount is amortized over the life of the debt. Amortization of premium or discount for the period is:
Internal service funds are used to conduct certain activities for which costs arecharged to other funds on a full cost-recovery basis. Because internal servicefunds are presumed to benefit governmental activities, internal service activities are reported as governmental in the statement of activities. The net increase ordecrease in internal service funds was:
In governmental funds, compensated absences are measured by the amounts paidduring the period. In the statement of activities, compensated absences aremeasured by the amount earned. The difference between compensated absencespaid and compensated absences earned, was:
In governmental funds, OPEB expenses are recognized when employer OPEBcontributions are made. In the statement of activities, OPEB expenses arerecognized on the accrual basis. This year, the difference between OPEBexpenses and actual employer OPEB contributions was:
In governmental funds, pension costs are recognized when employer contributionsare made, in the government-wide statement of activities, pension costs arerecognized on the accrual basis. This year, the difference between accrual-basispension costs and employer contributions was:
The accompanying notes are an integral part of these financial statements.
17
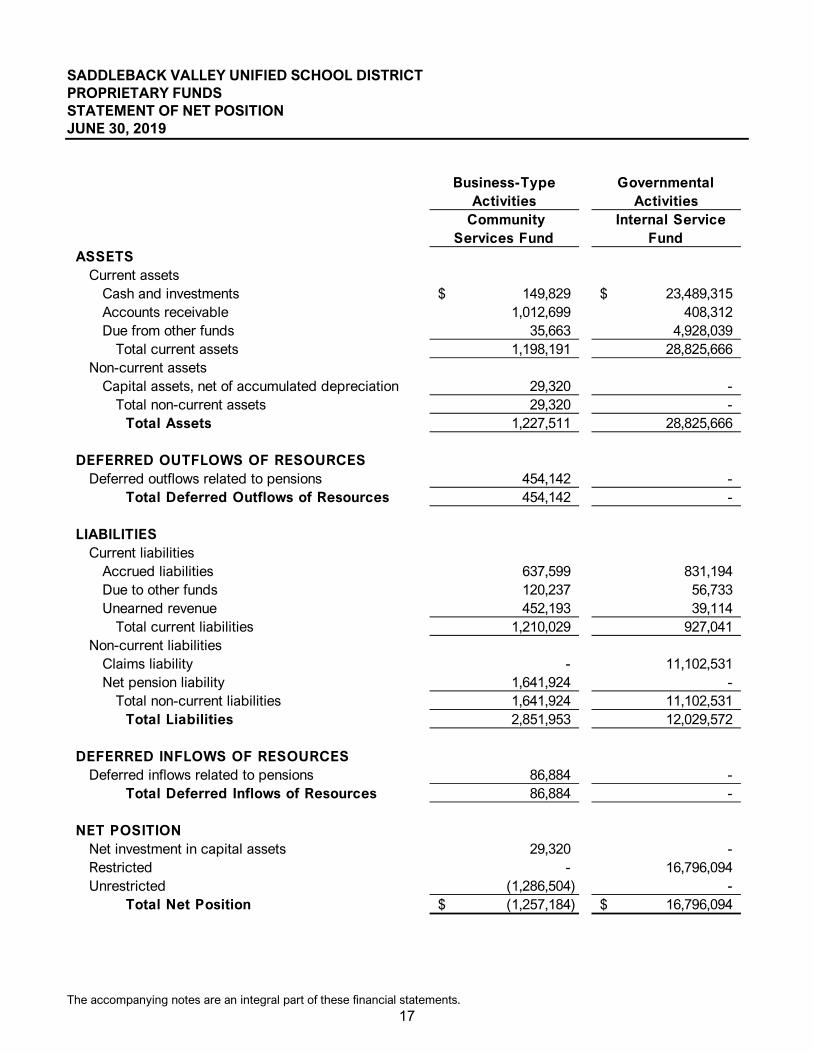
SADDLEBACK VALLEY UNIFIED SCHOOL DISTRICT PROPRIETARY FUNDS STATEMENT OF NET POSITION JUNE 30, 2019
Community Services Fund
Internal Service Fund
ASSETSCurrent assets
Cash and investments 149,829$ 23,489,315$ Accounts receivable 1,012,699 408,312 Due from other funds 35,663 4,928,039
Total current assets 1,198,191 28,825,666 Non-current assets
Capital assets, net of accumulated depreciation 29,320 - Total non-current assets 29,320 -
Total Assets 1,227,511 28,825,666
DEFERRED OUTFLOWS OF RESOURCESDeferred outflows related to pensions 454,142 -
Total Deferred Outflows of Resources 454,142 -
LIABILITIESCurrent liabilities
Accrued liabilities 637,599 831,194 Due to other funds 120,237 56,733 Unearned revenue 452,193 39,114
Total current liabilities 1,210,029 927,041 Non-current liabilities
Claims liability - 11,102,531 Net pension liability 1,641,924 -
Total non-current liabilities 1,641,924 11,102,531 Total Liabilities 2,851,953 12,029,572
DEFERRED INFLOWS OF RESOURCESDeferred inflows related to pensions 86,884 -
Total Deferred Inflows of Resources 86,884 -
NET POSITIONNet investment in capital assets 29,320 - Restricted - 16,796,094 Unrestricted (1,286,504) -
Total Net Position (1,257,184)$ 16,796,094$
Governmental Activities
Business-Type Activities
The accompanying notes are an integral part of these financial statements.
18
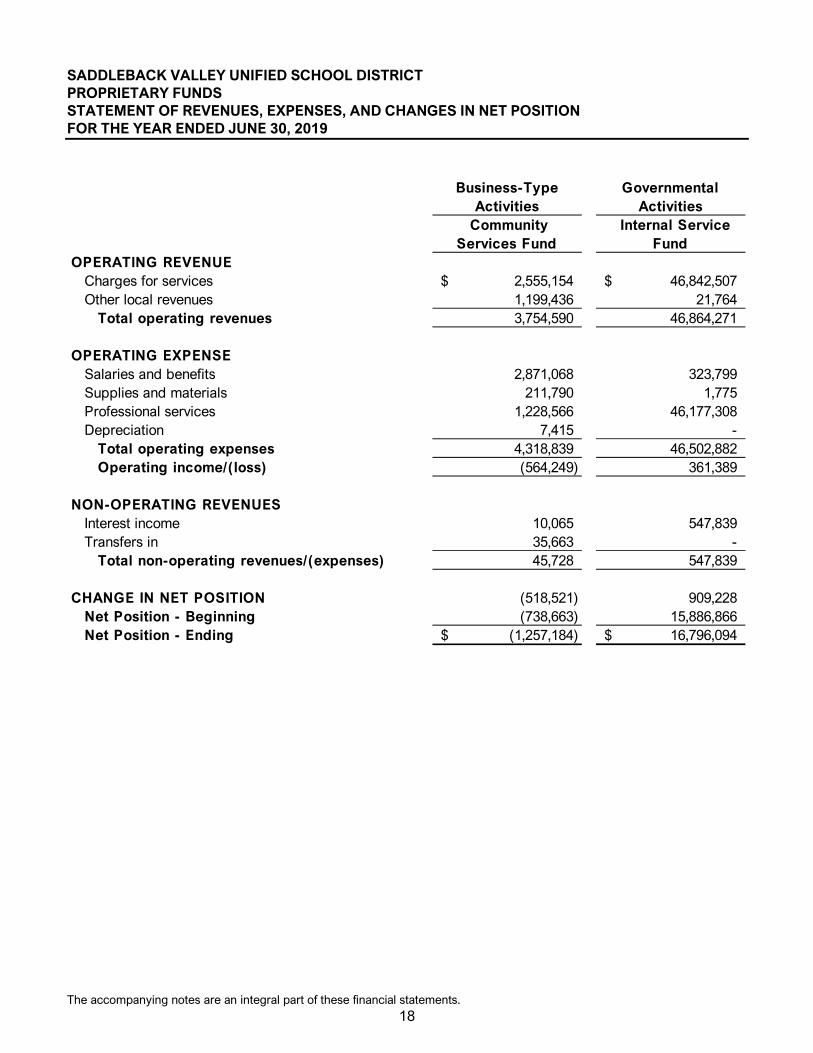
SADDLEBACK VALLEY UNIFIED SCHOOL DISTRICT PROPRIETARY FUNDS STATEMENT OF REVENUES, EXPENSES, AND CHANGES IN NET POSITION FOR THE YEAR ENDED JUNE 30, 2019
Community Services Fund
Internal Service Fund
OPERATING REVENUECharges for services 2,555,154$ 46,842,507$ Other local revenues 1,199,436 21,764
Total operating revenues 3,754,590 46,864,271
OPERATING EXPENSESalaries and benefits 2,871,068 323,799 Supplies and materials 211,790 1,775 Professional services 1,228,566 46,177,308 Depreciation 7,415 -
Total operating expenses 4,318,839 46,502,882 Operating income/(loss) (564,249) 361,389
NON-OPERATING REVENUESInterest income 10,065 547,839 Transfers in 35,663 -
Total non-operating revenues/(expenses) 45,728 547,839
CHANGE IN NET POSITION (518,521) 909,228 Net Position - Beginning (738,663) 15,886,866 Net Position - Ending (1,257,184)$ 16,796,094$
Governmental Activities
Business-Type Activities
The accompanying notes are an integral part of these financial statements.
19
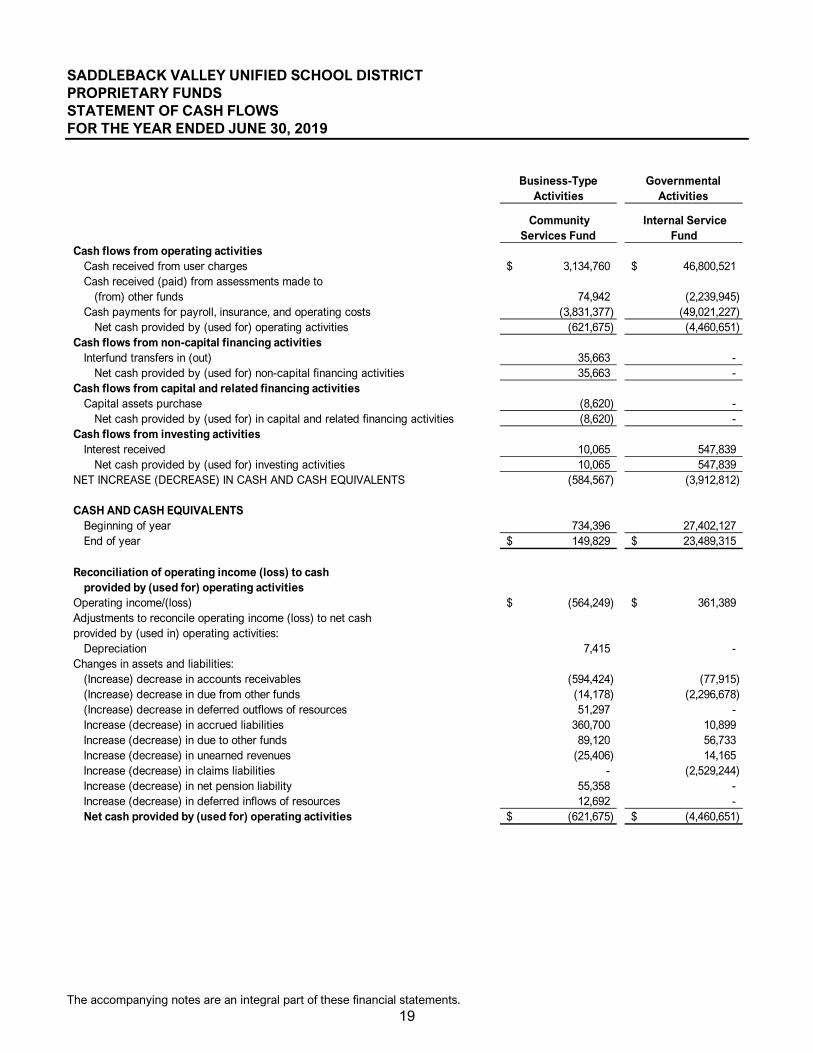
SADDLEBACK VALLEY UNIFIED SCHOOL DISTRICT PROPRIETARY FUNDS STATEMENT OF CASH FLOWS FOR THE YEAR ENDED JUNE 30, 2019
Community Services Fund
Internal Service Fund
Cash flows from operating activitiesCash received from user charges 3,134,760$ 46,800,521$ Cash received (paid) from assessments made to
(from) other funds 74,942 (2,239,945) Cash payments for payroll, insurance, and operating costs (3,831,377) (49,021,227)
Net cash provided by (used for) operating activities (621,675) (4,460,651) Cash flows from non-capital financing activities
Interfund transfers in (out) 35,663 - Net cash provided by (used for) non-capital financing activities 35,663 -
Cash flows from capital and related financing activitiesCapital assets purchase (8,620) -
Net cash provided by (used for) in capital and related financing activities (8,620) - Cash flows from investing activities
Interest received 10,065 547,839 Net cash provided by (used for) investing activities 10,065 547,839
NET INCREASE (DECREASE) IN CASH AND CASH EQUIVALENTS (584,567) (3,912,812)
CASH AND CASH EQUIVALENTSBeginning of year 734,396 27,402,127 End of year 149,829$ 23,489,315$
Reconciliation of operating income (loss) to cash provided by (used for) operating activities
Operating income/(loss) (564,249)$ 361,389$ Adjustments to reconcile operating income (loss) to net cash provided by (used in) operating activities:
Depreciation 7,415 - Changes in assets and liabilities:
(Increase) decrease in accounts receivables (594,424) (77,915) (Increase) decrease in due from other funds (14,178) (2,296,678) (Increase) decrease in deferred outflows of resources 51,297 - Increase (decrease) in accrued liabilities 360,700 10,899 Increase (decrease) in due to other funds 89,120 56,733 Increase (decrease) in unearned revenues (25,406) 14,165 Increase (decrease) in claims liabilities - (2,529,244) Increase (decrease) in net pension liability 55,358 - Increase (decrease) in deferred inflows of resources 12,692 - Net cash provided by (used for) operating activities (621,675)$ (4,460,651)$
Governmental Activities
Business-Type Activities
The accompanying notes are an integral part of these financial statements.
20
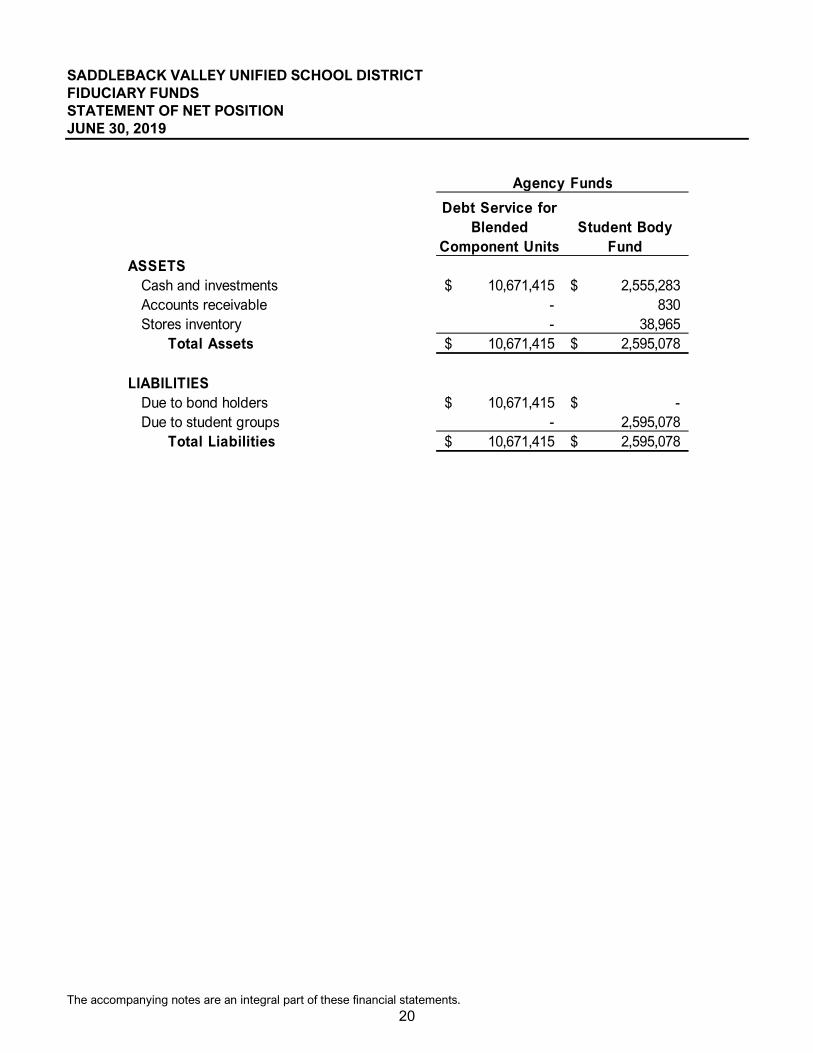
SADDLEBACK VALLEY UNIFIED SCHOOL DISTRICT FIDUCIARY FUNDS STATEMENT OF NET POSITION JUNE 30, 2019
Debt Service for Blended
Component UnitsStudent Body
FundASSETS
Cash and investments 10,671,415$ 2,555,283$ Accounts receivable - 830 Stores inventory - 38,965
Total Assets 10,671,415$ 2,595,078$
LIABILITIESDue to bond holders 10,671,415$ -$ Due to student groups - 2,595,078
Total Liabilities 10,671,415$ 2,595,078$
Agency Funds

21
SADDLEBACK VALLEY UNIFIED SCHOOL DISTRICT NOTES TO FINANCIAL STATEMENTS JUNE 30, 2019 NOTE 1 – SUMMARY OF SIGNIFICANT ACCOUNTING POLICIES A. Financial Reporting Entity
The Saddleback Valley Unified School District (the “District”) accounts for its financial transactions in accordance with the policies and procedures of the Department of Education's California School Accounting Manual. The accounting policies of the District conform to generally accepted accounting principles as prescribed by the Governmental Accounting Standards Board (GASB) and the American Institute of Certified Public Accountants (AICPA). The District operates under a locally elected Board form of government and provides educational services to grades K-12 as mandated by the state. A reporting entity is comprised of the primary government, component units, and other organizations that are included to ensure the financial statements are not misleading. The primary government of the District consists of all funds, departments and agencies that are not legally separate from the District. For the District, this includes general operations, food service, and student-related activities.
B. Component Units Component units are legally separate organizations for which the District is financially accountable. Component units may also include organizations that are fiscally dependent on the District, in that the District approves their budget, the issuance of their debt or the levying of their taxes. In addition, component units are other legally separate organizations for which the District is not financially accountable but the nature and significance of the organization's relationship with the District is such that exclusion would cause the District's financial statements to be misleading or incomplete. For financial reporting purposes, the component unit discussed below has a financial and operational relationship which meets the reporting entity definition criteria of the Governmental Accounting Standards Board (GASB) Statement No. 14, The Financial Reporting Entity, and thus is included in the financial statements of the District. The component unit, although a legally separate entity, is reported in the financial statements using the blended presentation method as if it were part of the District's operations because the governing board of the component unit is essentially the same as the governing board of the District and because its purpose is to finance the construction of facilities to be used for the direct benefit of the District. The Saddleback Valley Unified School District Public Financing Authority (the Authority) is a nonprofit, public benefit corporation incorporated under the laws of the State of California and recorded by the Secretary of State. The Authority was formed for the sole purpose of providing financial assistance to the District by acquiring, constructing, financing, selling, and leasing public facilities, land, personal property, and equipment for the use and benefit of the District. The District leases certain school facilities from the corporation under various lease-purchase agreements recorded in long-term obligations. The Authority's financial activity is presented in the financial statements as the Capital Project Fund for Blended Component Units and the Debt Service Fund for Blended Component Units. Bonds issued by the Corporation do not represent liabilities of the District and are not included in the District-wide financial statements. Individually-prepared financial statements are not prepared for the Authority. The District established Community Facilities Districts (CFD) No. 88-1, 88-2, 89-1, 89-2, 89-3, and 89-4 to authorize the levy of special taxes. The purpose of the agreement is to provide for the issuance of certain debt obligations to provide and finance the design, acquisition, and construction of certain public facilities, pursuant to the Mello-Roos Community Facilities Act of 1982, as amended. The CFD is authorized to levy special taxes on parcels of taxable property within the CFD to pay the principal and interest on the bonds. The CFD financial activity is presented in the Agency Fund. Debt instruments issued by the CFD do not represent liabilities of the District or component unit and are not included in the District-wide financial statements.
22
SADDLEBACK VALLEY UNIFIED SCHOOL DISTRICT NOTES TO FINANCIAL STATEMENTS, continued JUNE 30, 2019 NOTE 1 – SUMMARY OF SIGNIFICANT ACCOUNTING POLICIES (continued) C. Basis of Presentation
Government-Wide Statements. The statement of net position and the statement of activities display information about the primary government (the District). These statements include the financial activities of the overall government, except for fiduciary activities. Eliminations have been made to minimize the double-counting of internal activities. Governmental activities generally are financed through taxes, intergovernmental revenue, and other non-exchange transactions. The statement of activities presents a comparison between direct expenses and program revenue for each function of the District’s governmental activities. Direct expenses are those that are specifically associated with a program or function and, therefore, are clearly identifiable to a particular function. Indirect expense allocations that have been made in the funds have been reserved for the statement of activities. Program revenues include charges paid by the recipients of the goods or services offered by the programs and grants and contributions that are restricted to meeting of operational or capital requirements of a particular program. Revenues that are not classified as program revenues are presented as general revenues. The comparison of program revenues and expenses identifies the extent to which each program or business segment is self-financing or draws from the general revenues of the District. Fund Financial Statements. The fund financial statements provide information about the District’s funds, including its proprietary and fiduciary funds. Separate statements for each fund category – governmental, proprietary and fiduciary – are presented. The emphasis of fund financial statements is on major governmental funds, each displayed in a separate column. All remaining governmental funds are aggregated and reported as non-major funds. Governmental funds are used to account for activities that are governmental in nature. Governmental activities are typically tax-supported and include education of pupils, operation of food service and child development programs, construction and maintenance of school facilities, and repayment of long-term debt. Proprietary funds are used to account for activities that are more business-like than government-like in nature. Business-type activities include those for which a fee is charged to external users or to other organizational units of the District, normally on a full cost-recovery basis. Proprietary funds are generally intended to be self-supporting. Fiduciary funds are used to account for assets held by the District in a trustee or agency capacity for others that cannot be used to support the District's own programs.
23
SADDLEBACK VALLEY UNIFIED SCHOOL DISTRICT NOTES TO FINANCIAL STATEMENTS, continued JUNE 30, 2019 NOTE 1 – SUMMARY OF SIGNIFICANT ACCOUNTING POLICIES (continued)
C. Basis of Presentation (continued)
Major Governmental Funds General Fund: The General Fund is the main operating fund of the District. It is used to account for all activities except those that are required to be accounted for in another fund. In keeping with the minimum number of funds principle, all of the District's activities are reported in the General Fund unless there is a compelling reason to account for an activity in another fund. A District may have only one General Fund. Capital Facilities Fund: This fund is used primarily to account separately for moneys received from fees levied on developers or other agencies as a condition of approving a development (Education Code Sections 17620–17626). The authority for these levies may be county/city ordinances (Government Code Sections 65970–65981) or private agreements between the District and the developer. Interest earned in the Capital Facilities Fund is restricted to that fund (Government Code Section 66006). Non-Major Governmental Funds Special Revenue Funds: Special revenue funds are used to account for and report the proceeds of specific revenue sources that are restricted or committed to expenditures for specified purposes other than debt service or capital projects. The District maintains the following special revenue funds:
Special Education Pass-Through Fund: This fund is used by the Administrative Unit (AU) of a multi-Local Education Agency (LEA) Special Education Local Plan Area (SELPA) to account for Special Education revenue passed through to other member LEAs. Adult Education Fund: This fund is used to account separately for federal, state, and local revenues for adult education programs. Money in this fund shall be expended for adult education purposes only. Moneys received for programs other than adult education shall not be expended for adult education (Education Code Sections 52616[b] and 52501.5[a]). Child Development Fund: This fund is used to account separately for federal, state, and local revenues to operate child development programs. All moneys received by the District for, or from the operation of, child development services covered under the Child Care and Development Services Act (Education Code Section 8200 et seq.) shall be deposited into this fund. The moneys may be used only for expenditures for the operation of child development programs. The costs incurred in the maintenance and operation of child development services shall be paid from this fund, with accounting to reflect specific funding sources (Education Code Section 8328). Cafeteria Fund: This fund is used to account separately for federal, state, and local resources to operate the food service program (Education Code Sections 38090–38093). The Cafeteria Fund shall be used only for those expenditures authorized by the governing board as necessary for the operation of the District's food service program (Education Code Sections 38091 and 38100).

24
SADDLEBACK VALLEY UNIFIED SCHOOL DISTRICT NOTES TO FINANCIAL STATEMENTS, continued JUNE 30, 2019 NOTE 1 – SUMMARY OF SIGNIFICANT ACCOUNTING POLICIES (continued) C. Basis of Presentation (continued)
Non-Major Governmental Funds (continued)
Capital Project Funds: Capital project funds are established to account for financial resources to be used for the acquisition or construction of major capital facilities (other than those financed by proprietary funds and trust funds).
Building Fund: This fund exists primarily to account separately for proceeds from the sale of bonds (Education Code Section 15146) and may not be used for any purposes other than those for which the bonds were issued. Other authorized revenues to the Building Fund are proceeds from the sale or lease-with-option-to-purchase of real property (Education Code Section 17462) and revenue from rentals and leases of real property specifically authorized for deposit into the fund by the governing board (Education Code Section 41003). County School Facilities Fund: This fund is established pursuant to Education Code Section 17070.43 to receive apportionments from the 1998 State School Facilities Fund (Proposition 1A), the 2002 State School Facilities Fund (Proposition 47), or the 2004 State School Facilities Fund (Proposition 55) authorized by the State Allocation Board for new school facility construction, modernization projects, and facility hardship grants, as provided in the Leroy F. Greene School Facilities Act of 1998 (Education Code Section 17070 et seq.). Special Reserve Fund for Capital Outlay Projects: This fund exists primarily to provide for the accumulation of General Fund moneys for capital outlay purposes (Education Code Section 42840). Capital Projects Fund for Blended Component Units: This fund is used to account for capital projects financed by Mello-Roos Community Facilities Districts and similar entities that are considered blended component units of the District under generally accepted accounting principles (GAAP).
Debt Service Funds: Debt service funds are established to account for the accumulation of resources for and the payment of principal and interest on general long-term debt.
Bond Interest and Redemption Fund: This fund is used for the repayment of bonds issued for the District (Education Code Sections 15125–15262). The board of supervisors of the county issues the bonds. The proceeds from the sale of the bonds are deposited in the county treasury to the Building Fund of the District. Any premiums or accrued interest received from the sale of the bonds must be deposited in the Bond Interest and Redemption Fund of the District. The county auditor maintains control over the District's Bond Interest and Redemption Fund. The principal and interest on the bonds must be paid by the county treasurer from taxes levied by the county auditor-controller.
25
SADDLEBACK VALLEY UNIFIED SCHOOL DISTRICT NOTES TO FINANCIAL STATEMENTS, continued JUNE 30, 2019 NOTE 1 – SUMMARY OF SIGNIFICANT ACCOUNTING POLICIES (continued)
C. Basis of Presentation (continued)
Proprietary Funds Enterprise Funds: Enterprise funds may be used to account for any activity for which a fee is charged to external users for goods or services.
Community Services Fund: The only enterprise fund of the District accounts for the financial transactions related to the community services program of the District.
Internal Service Funds: Internal service funds are created principally to render services to other organizational units of the District on a cost-reimbursement basis. These funds are designed to be self-supporting with the intent of full recovery of costs, including some measure of the cost of capital assets, through user fees and charges.
Self-Insurance Fund: Self-insurance funds are used to separate moneys received for self-insurance activities from other operating funds of the District. Separate funds may be established for each type of self-insurance activity, such as workers' compensation, health and welfare, and deductible property loss (Education Code Section 17566).
Fiduciary Funds Trust and Agency Funds: Trust and agency funds are used to account for assets held in a trustee or agent capacity for others that cannot be used to support the District's own programs. The key distinction between trust and agency funds is that trust funds are subject to a trust agreement that affects the degree of management involvement and the length of time that the resources are held.
Debt Service Fund for Blended Component Units: This fund is used to account for the accumulation of resources for the payment of principal and interest on bonds issued by Mello-Roos Community Facilities Districts and similar entities that are considered on non-obligatory debt of the financial reporting entity. Student Body Fund: The Student Body Fund is an agency fund and, therefore, consists only of accounts such as cash and balancing liability accounts, such as due to student groups. The student body itself maintains its own general fund, which accounts for the transactions of that entity in raising and expending money to promote the general welfare, morale, and educational experiences of the student body (Education Code Sections 48930–48938).

26
SADDLEBACK VALLEY UNIFIED SCHOOL DISTRICT NOTES TO FINANCIAL STATEMENTS, continued JUNE 30, 2019 NOTE 1 – SUMMARY OF SIGNIFICANT ACCOUNTING POLICIES (continued)
D. Basis of Accounting – Measurement Focus
Government-Wide, Proprietary, and Fiduciary Financial Statements The government-wide, proprietary, and fiduciary fund financial statements are reported using the economic resources measurement focus. The government-wide, proprietary, and fiduciary fund financial statements are reported using the accrual basis of accounting. Revenues are recorded when earned and expenses are recorded at the time liabilities are incurred, regardless of when the related cash flows take place. Net Position equals assets and deferred outflows of resources minus liabilities and deferred inflows of resources. Net investment in capital assets consists of capital assets, net of accumulated depreciation, reduced by the outstanding balances of any borrowings used for the acquisition, construction or improvement of those assets. The net position should be reported as restricted when constraints placed on its use are either externally imposed by creditors (such as through debt covenants), grantors, contributors, or laws or regulations of other governments or imposed by law through constitutional provisions or enabling legislation. The net position restricted for other activities results from special revenue funds and the restrictions on their use. Proprietary funds distinguish operating revenues and expenses from non-operating items. Operating revenues and expenses generally result from providing services and producing and delivering goods in connection with a proprietary fund’s principal ongoing operations. The principal operating revenues of the internal service fund are charges to other funds for self-insurance costs. Operating expenses for internal service funds include the costs of insurance premiums and claims related to self-insurance. Governmental Funds Basis of accounting refers to when revenues and expenditures are recognized in the accounts and reported in the financial statements. Governmental funds use the modified accrual basis of accounting. Revenues – Exchange and Non-Exchange Transactions Revenue resulting from exchange transactions, in which each party gives and receives essentially equal value, is recorded under the accrual basis when the exchange takes place. On a modified accrual basis, revenue is recorded in the fiscal year in which the resources are measurable and become available. “Available” means the resources will be collected within the current fiscal year or are expected to be collected soon enough thereafter to be used to pay liabilities of the current fiscal year. Generally, “available” means collectible within the current period or within 60 days after year-end. However, to achieve comparability of reporting among California school districts and so as not to distort normal revenue patterns, with specific respect to reimbursement grants and corrections to State-aid apportionments, the California Department of Education has defined available for school districts as collectible within one year.
Non-exchange transactions, in which the District receives value without directly giving equal value in return, include property taxes, grants, and entitlements. Under the accrual basis, revenue from property taxes is recognized in the fiscal year for which the taxes are levied. Revenue from the grants and entitlements is recognized in the fiscal year in which all eligibility requirements have been satisfied.
Eligibility requirements include timing requirements, which specify the year when the resources are to be used or the fiscal year when use is first permitted; matching requirements, in which the District must provide local resources to be used for a specific purpose; and expenditure requirements, in which the resources are provided to the District on a reimbursement basis. Under the modified accrual basis, revenue from non-exchange transactions must also be available before it can be recognized.
27
SADDLEBACK VALLEY UNIFIED SCHOOL DISTRICT NOTES TO FINANCIAL STATEMENTS, continued JUNE 30, 2019 NOTE 1 – SUMMARY OF SIGNIFICANT ACCOUNTING POLICIES (continued)
D. Basis of Accounting – Measurement Focus (continued)
Unearned Revenue Unearned revenue arises when potential revenue does not meet both the "measurable" and "available" criteria for recognition in the current period or when resources are received by the District prior to the incurrence of qualifying expenditures. In subsequent periods, when both revenue recognition criteria are met, or when the District has a legal claim to the resources, the liability for unearned revenue is removed from the balance sheet and revenue is recognized. Certain grants received that have not met eligibility requirements are recorded as unearned revenue. On the governmental fund financial statements, receivables that will not be collected within the available period are also recorded as unearned revenue. Expenses/Expenditures On the accrual basis of accounting, expenses are recognized at the time a liability is incurred. On the modified accrual basis of accounting, expenditures are generally recognized in the accounting period in which the related fund liability is incurred, as under the accrual basis of accounting. However, under the modified accrual basis of accounting, debt service expenditures, as well as expenditures related to compensated absences and claims and judgments, are recorded only when payment is due. Allocations of cost, such as depreciation and amortization, are not recognized in the governmental funds. When both restricted and unrestricted resources are available for use, it is the District’s policy to use restricted resources first, then unrestricted resources as they are needed. Cash and Cash Equivalents The District’s cash and cash equivalents consist of cash on hand, demand deposits and short-term investments with original maturities of three months or less from the date of acquisition. Cash equivalents also include cash with county treasury balances for purposes of the statement of cash flows. Investments Investments with original maturities greater than one year are stated at fair value. Fair value is estimated based on quoted market prices at year-end. All investments not required to be reported at fair value are stated at cost or amortized cost. Fair values of investments in county and State investment pools are determined by the program sponsor. Inventories Inventories are recorded using the purchases method in that the cost is recorded as an expenditure at the time the individual inventory items are requisitioned. Inventories are valued at historical cost and consist of expendable supplies held for consumption.
E. Assets, Deferred Outflows of Resources, Liabilities, Deferred Inflows of Resources, Fund Balance and Net
Position
Capital Assets The accounting and reporting treatment applied to the capital assets associated with a fund is determined by its measurement focus. Capital assets are reported in the governmental activities column of the government-wide statement of net position but are not reported in the fund financial statements.
28
SADDLEBACK VALLEY UNIFIED SCHOOL DISTRICT NOTES TO FINANCIAL STATEMENTS, continued JUNE 30, 2019 NOTE 1 – SUMMARY OF SIGNIFICANT ACCOUNTING POLICIES (continued) E. Assets, Deferred Outflows of Resources, Liabilities, Deferred Inflows of Resources, Fund Balance and Net
Position (continued)
Capital Assets (continued) Capital assets are capitalized at cost (or estimated historical cost) and updated for additions and retirements during the year. Donated fixed assets are recorded at their acquisition value as of the date received. The District maintains a capitalization threshold of $5,000. The District does not own any infrastructure as defined in GASB Statement No. 34. Improvements are capitalized; the costs of normal maintenance and repairs that do not add to the value of the asset or materially extend an asset’s life are not capitalized. All reported capital assets, except for land and construction in progress, are depreciated. Improvements are depreciated over the remaining useful lives of the related capital assets. Depreciation is computed using the straight-line method over the following estimated useful lives:
Asset Class Estimated Useful Life
Buildings and Improvements 20 - 50 years Furniture, Equipment, and Vehicles 5 - 20 years
Interfund Balances On fund financial statements, receivables and payables resulting from short-term interfund loans are classified as "Due from other funds/Due to other funds.” These amounts are eliminated in the governmental activities columns of the statement of net position.
Compensated Absences Accumulated unpaid employee vacation benefits are accrued as a liability as the benefits are earned. The entire compensated absence liability is reported on the government-wide financial statements. For governmental funds, the current portion of unpaid compensated absences is recognized upon the occurrence of relevant events such as employee resignations and retirements that occur prior to year-end that have not yet been paid with expendable available financial resource. These amounts are recorded in the fund from which the employees who have accumulated leave are paid. Accumulated sick leave benefits are not recognized as liabilities of the District. The District's policy is to record sick leave as an operating expense in the period taken because such benefits do not vest, nor is payment probable; however, unused sick leave is added to the creditable service period for calculation of retirement benefits when the employee retires. Accrued Liabilities and Long-Term Obligations All payables, accrued liabilities, and long-term obligations are reported in the government-wide and proprietary fund financial statements. In general, governmental fund payables and accrued liabilities that, once incurred, are paid in a timely manner and in full from current financial resources are reported as obligations of the funds.
Postemployment Benefits Other Than Pensions (OPEB) – MPP Program For purposes of measuring the net OPEB liability, deferred outflows of resources related to OPEB, and OPEB expense, information about the fiduciary net position of the CalSTRS Medicare Premium Payment (MPP) Program and additions to/deductions from MPP's fiduciary net position have been determined on the same basis as they are reported by the MPP. For this purpose, the MPP recognizes benefit payments when due and payable in accordance with the benefit terms. Investments are reported at fair value, except for money market investments and participating interest-earning investment contracts that have a maturity at the time of purchase of one year or less, which are reported at cost.
29
SADDLEBACK VALLEY UNIFIED SCHOOL DISTRICT NOTES TO FINANCIAL STATEMENTS, continued JUNE 30, 2019 NOTE 1 – SUMMARY OF SIGNIFICANT ACCOUNTING POLICIES (continued)
E. Assets, Deferred Outflows of Resources, Liabilities, Deferred Inflows of Resources, Fund Balance and Net
Position (continued)
Postemployment Benefits Other Than Pensions (OPEB) – District Plan For purposes of measuring the total OPEB liability, deferred outflows of resources related to OPEB and deferred inflows of resources related to OPEB, and OPEB expense have been determined by an independent actuary. For this purpose, benefit payments are recognized when currently due and payable in accordance with the benefit terms. Generally accepted accounting principles require the reported results must pertain to liability and asset information within certain defined timeframes. For this report, the following timeframes are used: Valuation Date June 30, 2017 Measurement Date June 30, 2018 Measurement Period July 1, 2017 - June 30, 2018 Gains and losses related to changes in total OPEB liability are recognized in OPEB expense systematically over time. The first amortized amounts are recognized in OPEB expense for the year the gain or loss occurs. The remaining amounts are categorized as deferred outflows and deferred inflows of resources related to OPEB and are to be recognized in future OPEB expense. The amortization period differs depending on the source of gain or loss. The difference between projected and actual earnings is amortized on a straight-line basis over five years. All other amounts are amortized on a straight-line basis over the average expected remaining service lives of all members that are provided with benefits (active, inactive, and retired) at the beginning of the measurement period. Premiums and Discounts In the government-wide and proprietary fund financial statements, long-term obligations are reported as liabilities in the applicable governmental activities or proprietary fund statement of net position. Bond premiums and discounts are deferred and amortized over the life of the bonds using the straight-line method. Deferred Outflows/Deferred Inflows of Resources In addition to assets, the District will sometimes report a separate section for deferred outflows of resources. This separate financial statement element, deferred outflows of resources, represents a consumption of net position that applies to a future period and so will not be recognized as an outflow of resources (expense/expenditure) until then. In addition to liabilities, the District will sometimes report a separate section for deferred inflows of resources. This separate financial statement element, deferred inflows of resources, represents an acquisition of net position that applies to a future period and so will not be recognized as an inflow of resources (revenue) until that time. Pensions For purposes of measuring the net pension liability, deferred outflows of resources and deferred inflows of resources related to pensions, and pension expense, information about the fiduciary net position of the defined benefit pension plans (the Plans) of the California State Teachers’ Retirement System (CalSTRS) and the California Public Employees’ Retirement System (CalPERS) and additions to/deductions from the Plans’ fiduciary net position have been determined on the same basis as they are reported by the Plans. For this purpose, benefit payments (including refunds of employee contributions) are recognized when due and payable in accordance with the benefit terms. Investments are reported at fair value.
30
SADDLEBACK VALLEY UNIFIED SCHOOL DISTRICT NOTES TO FINANCIAL STATEMENTS, continued JUNE 30, 2019 NOTE 1 – SUMMARY OF SIGNIFICANT ACCOUNTING POLICIES (continued)
E. Assets, Deferred Outflows of Resources, Liabilities, Deferred Inflows of Resources, Fund Balance and Net
Position (continued) Fund Balance Fund balance is divided into five classifications based primarily on the extent to which the District is bound to observe constraints imposed upon the use of the resources in the governmental funds. The classifications are as follows: Nonspendable - The nonspendable fund balance classification reflects amounts that are not in spendable form. Examples include inventory, prepaid items, the long-term portion of loans receivable, and nonfinancial assets held for resale. This classification also reflects amounts that are in spendable form but that are legally or contractually required to remain intact, such as the principal of a permanent endowment. Restricted - The restricted fund balance classification reflects amounts subject to externally imposed and legally enforceable constraints. Such constraints may be imposed by creditors, grantors, contributors, or laws or regulations of other governments, or may be imposed by law through constitutional provisions or enabling legislation. Committed - The committed fund balance classification reflects amounts subject to internal constraints self-imposed by formal action of the Governing Board. The constraints giving rise to committed fund balance must be imposed no later than the end of the reporting period. The actual amounts may be determined subsequent to that date but prior to the issuance of the financial statements. In contrast to restricted fund balance, committed fund balance may be redirected by the government to other purposes as long as the original constraints are removed or modified in the same manner in which they were imposed, that is, by the same formal action of the Governing Board.
Assigned - The assigned fund balance classification reflects amounts that the government intends to be used for specific purposes. Assignments may be established either by the Governing Board or by a designee of the governing body and are subject to neither the restricted nor committed levels of constraint. In contrast to the constraints giving rise to committed fund balance, constraints giving rise to assigned fund balance are not required to be imposed, modified, or removed by formal action of the Governing Board. The action does not require the same level of formality and may be delegated to another body or official. Additionally, the assignment need not be made before the end of the reporting period, but rather may be made any time prior to the issuance of the financial statements.
Unassigned - In the General Fund only, the unassigned fund balance classification reflects the residual balance that has not been assigned to other funds and that is not restricted, committed, or assigned to specific purposes. However, deficits in any fund, including the General Fund that cannot be eliminated by reducing or eliminating amounts assigned to other purposes are reported as negative unassigned fund balance. The District applies restricted resources first when expenditures are incurred for purposes for which either restricted or unrestricted (committed, assigned and unassigned) amounts are available. Similarly, within unrestricted fund balance, committed amounts are reduced first followed by assigned, and then unassigned amounts when expenditures are incurred for purposes for which amounts in any of the unrestricted fund balance classifications could be used.
31
SADDLEBACK VALLEY UNIFIED SCHOOL DISTRICT NOTES TO FINANCIAL STATEMENTS, continued JUNE 30, 2019 NOTE 1 – SUMMARY OF SIGNIFICANT ACCOUNTING POLICIES (continued)
F. Interfund Activity
Exchange transactions between funds are reported as revenues in the seller funds and as expenditures/expenses in the purchaser funds. Flows of cash or goods from one fund to another without a requirement for repayment are reported as interfund transfers. Interfund transfers are reported as other financing sources/uses in governmental funds and after non-operating revenues/expenses in proprietary funds. Repayments from funds responsible for particular expenditures/expenses to the funds that initially paid for them are not presented in the financial statements. Interfund transfers are eliminated in the governmental activities columns of the statement of activities.
G. Estimates
The preparation of the financial statements in conformity with accounting principles generally accepted in the United States of America requires management to make estimates and assumptions that affect the amounts reported in the financial statements and accompanying notes. Actual results may differ from those estimates.
H. Budgetary Data
The budgetary process is prescribed by provisions of the California Education Code and requires the governing board to hold a public hearing and adopt an operating budget no later than July 1 of each year. The District governing board satisfied these requirements. The adopted budget is subject to amendment throughout the year to give consideration to unanticipated revenue and expenditures primarily resulting from events unknown at the time of budget adoption with the legal restriction that expenditures cannot exceed appropriations by major object account. The amounts reported as the original budgeted amounts in the budgetary statements reflect the amounts when the original appropriations were adopted. The amounts reported as the final budgeted amounts in the budgetary statements reflect the amounts after all budget amendments have been accounted for. For purposes of the budget, on-behalf payments have not been included as revenue and expenditures as required under generally accepted accounting principles.
I. Property Tax
Secured property taxes attach as an enforceable lien on property as of January 1. Taxes are payable in two installments on November 1 and February 1 and become delinquent on December 10 and April 10, respectively. Unsecured property taxes are payable in one installment on or before August 31. The County Auditor-Controller bills and collects the taxes on behalf of the District. Local property tax revenues are recorded when received.
J. New Accounting Pronouncements
GASB Statement No. 84 – In January 2017, GASB issued Statement No. 84, Fiduciary Activities. This standard’s primary objective is to improve guidance regarding the identification of fiduciary activities for accounting and financial reporting purposes and how those activities should be reported. The statement is effective for periods beginning after December 15, 2018. The District has not yet determined the impact on the financial statements. GASB Statement No. 87 – In June 2017, GASB issued Statement No. 87, Leases. This standard’s primary objective is to better meet the information needs of financial statement users by improving accounting and financial reporting for leases by governments. The statement is effective for periods beginning after December 15, 2019. The District has not determined the impact on the financial statements.
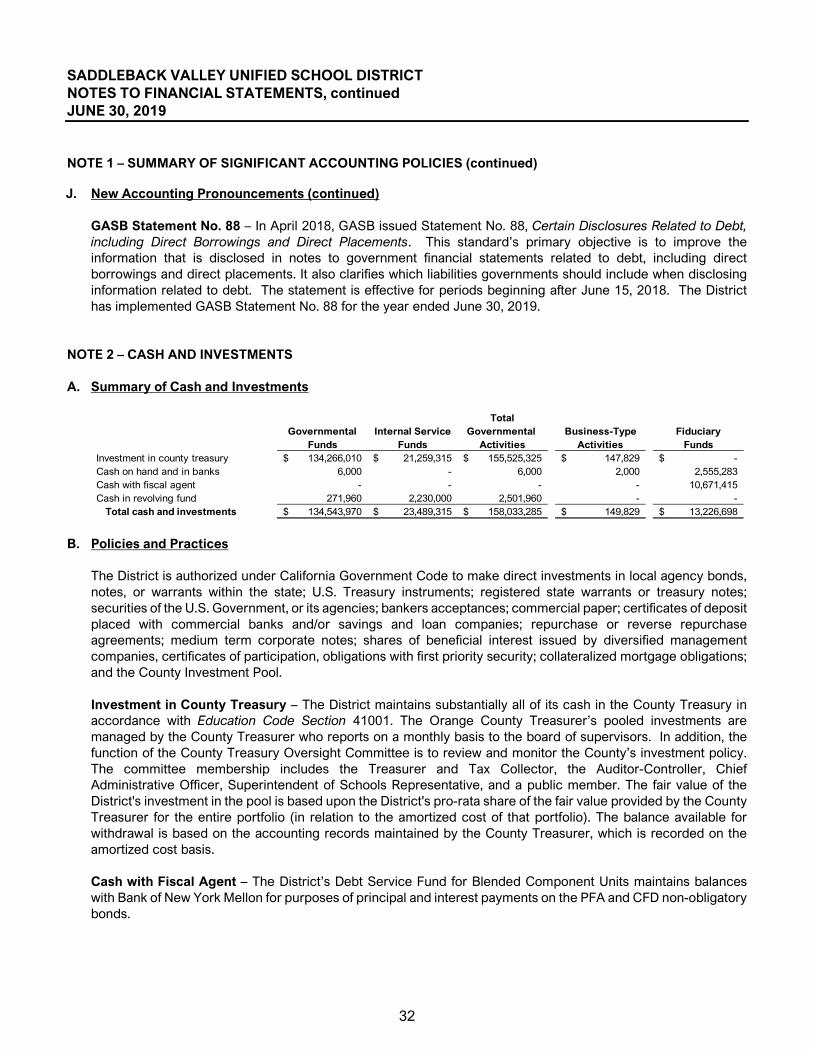
32
SADDLEBACK VALLEY UNIFIED SCHOOL DISTRICT NOTES TO FINANCIAL STATEMENTS, continued JUNE 30, 2019 NOTE 1 – SUMMARY OF SIGNIFICANT ACCOUNTING POLICIES (continued) J. New Accounting Pronouncements (continued)
GASB Statement No. 88 – In April 2018, GASB issued Statement No. 88, Certain Disclosures Related to Debt, including Direct Borrowings and Direct Placements. This standard’s primary objective is to improve the information that is disclosed in notes to government financial statements related to debt, including direct borrowings and direct placements. It also clarifies which liabilities governments should include when disclosing information related to debt. The statement is effective for periods beginning after June 15, 2018. The District has implemented GASB Statement No. 88 for the year ended June 30, 2019.
NOTE 2 – CASH AND INVESTMENTS A. Summary of Cash and Investments
Total
Governmental Internal Service Governmental Business-Type FiduciaryFunds Funds Activities Activities Funds
Investment in county treasury 134,266,010$ 21,259,315$ 155,525,325$ 147,829$ -$ Cash on hand and in banks 6,000 - 6,000 2,000 2,555,283 Cash with fiscal agent - - - - 10,671,415 Cash in revolving fund 271,960 2,230,000 2,501,960 - -
Total cash and investments 134,543,970$ 23,489,315$ 158,033,285$ 149,829$ 13,226,698$
B. Policies and Practices The District is authorized under California Government Code to make direct investments in local agency bonds, notes, or warrants within the state; U.S. Treasury instruments; registered state warrants or treasury notes; securities of the U.S. Government, or its agencies; bankers acceptances; commercial paper; certificates of deposit placed with commercial banks and/or savings and loan companies; repurchase or reverse repurchase agreements; medium term corporate notes; shares of beneficial interest issued by diversified management companies, certificates of participation, obligations with first priority security; collateralized mortgage obligations; and the County Investment Pool. Investment in County Treasury – The District maintains substantially all of its cash in the County Treasury in accordance with Education Code Section 41001. The Orange County Treasurer’s pooled investments are managed by the County Treasurer who reports on a monthly basis to the board of supervisors. In addition, the function of the County Treasury Oversight Committee is to review and monitor the County’s investment policy. The committee membership includes the Treasurer and Tax Collector, the Auditor-Controller, Chief Administrative Officer, Superintendent of Schools Representative, and a public member. The fair value of the District's investment in the pool is based upon the District's pro-rata share of the fair value provided by the County Treasurer for the entire portfolio (in relation to the amortized cost of that portfolio). The balance available for withdrawal is based on the accounting records maintained by the County Treasurer, which is recorded on the amortized cost basis. Cash with Fiscal Agent – The District’s Debt Service Fund for Blended Component Units maintains balances with Bank of New York Mellon for purposes of principal and interest payments on the PFA and CFD non-obligatory bonds.
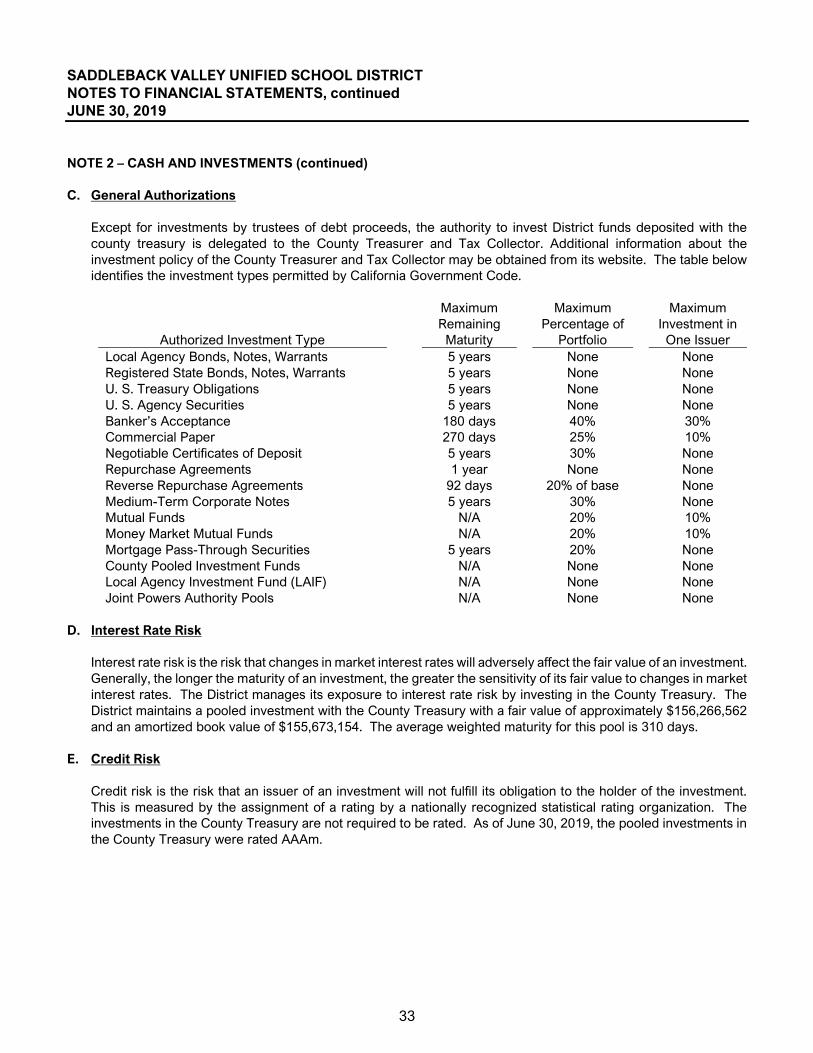
33
SADDLEBACK VALLEY UNIFIED SCHOOL DISTRICT NOTES TO FINANCIAL STATEMENTS, continued JUNE 30, 2019 NOTE 2 – CASH AND INVESTMENTS (continued) C. General Authorizations
Except for investments by trustees of debt proceeds, the authority to invest District funds deposited with the county treasury is delegated to the County Treasurer and Tax Collector. Additional information about the investment policy of the County Treasurer and Tax Collector may be obtained from its website. The table below identifies the investment types permitted by California Government Code.
Authorized Investment Type
Maximum Remaining Maturity
Maximum Percentage of
Portfolio
Maximum Investment in One Issuer
Local Agency Bonds, Notes, Warrants 5 years None None Registered State Bonds, Notes, Warrants 5 years None None U. S. Treasury Obligations 5 years None None U. S. Agency Securities 5 years None None Banker’s Acceptance 180 days 40% 30% Commercial Paper 270 days 25% 10% Negotiable Certificates of Deposit 5 years 30% None Repurchase Agreements 1 year None None Reverse Repurchase Agreements 92 days 20% of base None Medium-Term Corporate Notes 5 years 30% None Mutual Funds N/A 20% 10% Money Market Mutual Funds N/A 20% 10% Mortgage Pass-Through Securities 5 years 20% None County Pooled Investment Funds N/A None None Local Agency Investment Fund (LAIF) N/A None None Joint Powers Authority Pools N/A None None
D. Interest Rate Risk
Interest rate risk is the risk that changes in market interest rates will adversely affect the fair value of an investment. Generally, the longer the maturity of an investment, the greater the sensitivity of its fair value to changes in market interest rates. The District manages its exposure to interest rate risk by investing in the County Treasury. The District maintains a pooled investment with the County Treasury with a fair value of approximately $156,266,562 and an amortized book value of $155,673,154. The average weighted maturity for this pool is 310 days.
E. Credit Risk
Credit risk is the risk that an issuer of an investment will not fulfill its obligation to the holder of the investment. This is measured by the assignment of a rating by a nationally recognized statistical rating organization. The investments in the County Treasury are not required to be rated. As of June 30, 2019, the pooled investments in the County Treasury were rated AAAm.

34
SADDLEBACK VALLEY UNIFIED SCHOOL DISTRICT NOTES TO FINANCIAL STATEMENTS, continued JUNE 30, 2019 NOTE 2 – CASH AND INVESTMENTS (continued) F. Custodial Credit Risk – Deposits
This is the risk that in the event of a bank failure, the District's deposits may not be returned to it. The District does not have a policy for custodial credit risk for deposits. However, the California Government Code requires that a financial institution secure deposits made by state or local governmental units by pledging securities in an undivided collateral pool held by a depository regulated under state law. The market value of the pledged securities in the collateral pool must equal at least 110 percent of the total amount deposited by the public agencies. California law also allows financial institutions to secure public deposits by pledging first trust deed mortgage notes having a value of 150 percent of the secured public deposits and letters of credit issued by the Federal Home Loan Bank of San Francisco having a value of 105 percent of the secured deposits. As of June 30, 2019, the District's bank balance was exposed to custodial credit risk because it was uninsured and collateralized with securities held by the pledging financial institution's trust department or agent, but not in the name of the District.
G. Fair Value
The District categorizes the fair value measurements of its investments based on the hierarchy established by generally accepted accounting principles. The fair value hierarchy is based on the valuation inputs used to measure an asset's fair value. The following provides a summary of the hierarchy used to measure fair value: Level 1 - Quoted prices (unadjusted) in active markets for identical assets. Level 2 - Observable inputs other than Level 1 prices such as quoted prices for similar assets in active markets, quoted prices for identical or similar assets in markets that are not active, or other inputs that are observable, either directly or indirectly.
Level 3 - Unobservable inputs should be developed using the best information available under the circumstances, which might include the District's own data. The District should adjust that data if reasonable available information indicates that other market participants would use different data or certain circumstances specific to the District are not available to other market participants.
Uncategorized - Investments in the Orange County Treasury Investment Pool are not measured using the input levels above because the District's transactions are based on a stable net asset value per share. All contributions and redemptions are transacted at $1.00 net asset value per share. The District's fair value measurements at June 30, 2019 were as follows:
Uncategorized Investment in county treasury 156,266,562$
Total fair market value of investments 156,266,562$
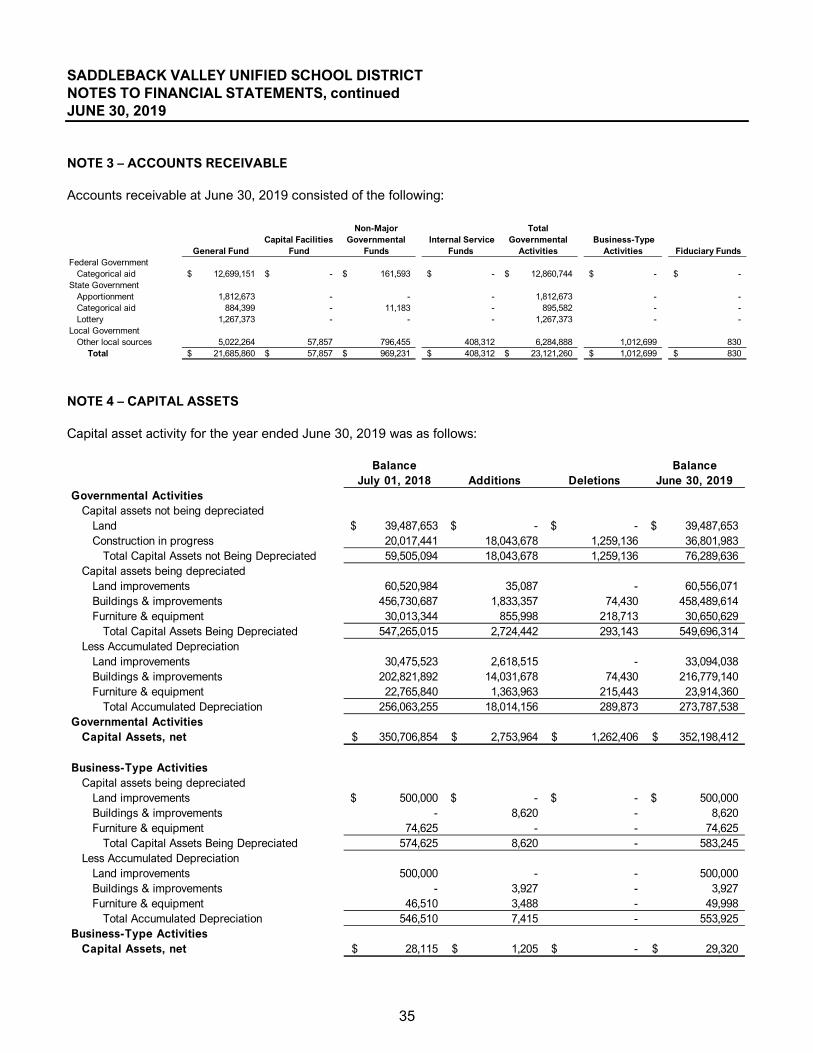
35
SADDLEBACK VALLEY UNIFIED SCHOOL DISTRICT NOTES TO FINANCIAL STATEMENTS, continued JUNE 30, 2019 NOTE 3 – ACCOUNTS RECEIVABLE Accounts receivable at June 30, 2019 consisted of the following:
NOTE 4 – CAPITAL ASSETS Capital asset activity for the year ended June 30, 2019 was as follows:
Balance BalanceJuly 01, 2018 Additions Deletions June 30, 2019
Governmental ActivitiesCapital assets not being depreciated
Land 39,487,653$ -$ -$ 39,487,653$ Construction in progress 20,017,441 18,043,678 1,259,136 36,801,983
Total Capital Assets not Being Depreciated 59,505,094 18,043,678 1,259,136 76,289,636 Capital assets being depreciated
Land improvements 60,520,984 35,087 - 60,556,071 Buildings & improvements 456,730,687 1,833,357 74,430 458,489,614 Furniture & equipment 30,013,344 855,998 218,713 30,650,629
Total Capital Assets Being Depreciated 547,265,015 2,724,442 293,143 549,696,314 Less Accumulated Depreciation
Land improvements 30,475,523 2,618,515 - 33,094,038 Buildings & improvements 202,821,892 14,031,678 74,430 216,779,140 Furniture & equipment 22,765,840 1,363,963 215,443 23,914,360
Total Accumulated Depreciation 256,063,255 18,014,156 289,873 273,787,538 Governmental Activities
Capital Assets, net 350,706,854$ 2,753,964$ 1,262,406$ 352,198,412$
Business-Type ActivitiesCapital assets being depreciated
Land improvements 500,000$ -$ -$ 500,000$ Buildings & improvements - 8,620 - 8,620 Furniture & equipment 74,625 - - 74,625
Total Capital Assets Being Depreciated 574,625 8,620 - 583,245 Less Accumulated Depreciation
Land improvements 500,000 - - 500,000 Buildings & improvements - 3,927 - 3,927 Furniture & equipment 46,510 3,488 - 49,998
Total Accumulated Depreciation 546,510 7,415 - 553,925 Business-Type Activities
Capital Assets, net 28,115$ 1,205$ -$ 29,320$
General FundCapital Facilities
Fund
Non-Major Governmental
Funds Internal Service
Funds
Total Governmental
Activities Business-Type
Activities Fiduciary Funds Federal Government
Categorical aid 12,699,151$ -$ 161,593$ -$ 12,860,744$ -$ -$ State Government
Apportionment 1,812,673 - - - 1,812,673 - - Categorical aid 884,399 - 11,183 - 895,582 - - Lottery 1,267,373 - - - 1,267,373 - -
Local GovernmentOther local sources 5,022,264 57,857 796,455 408,312 6,284,888 1,012,699 830
Total 21,685,860$ 57,857$ 969,231$ 408,312$ 23,121,260$ 1,012,699$ 830$
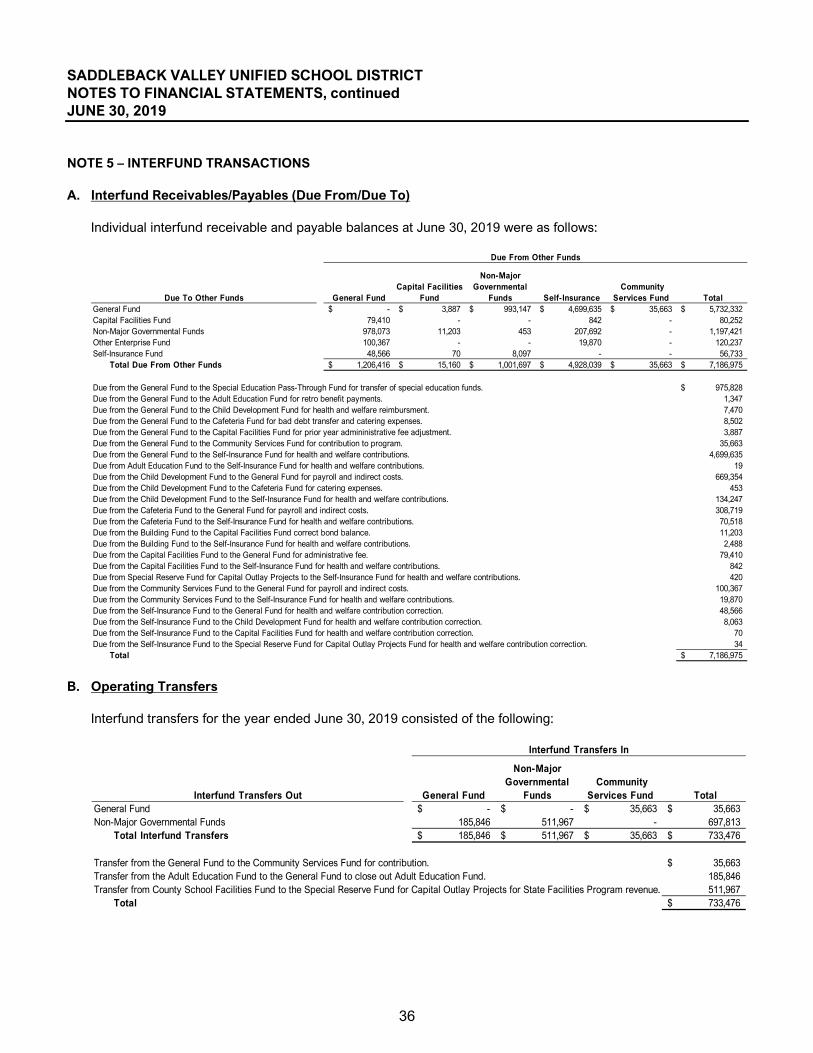
36
SADDLEBACK VALLEY UNIFIED SCHOOL DISTRICT NOTES TO FINANCIAL STATEMENTS, continued JUNE 30, 2019 NOTE 5 – INTERFUND TRANSACTIONS A. Interfund Receivables/Payables (Due From/Due To)
Individual interfund receivable and payable balances at June 30, 2019 were as follows:
Due To Other Funds General FundCapital Facilities
Fund
Non-Major Governmental
Funds Self-Insurance Community
Services Fund Total General Fund -$ 3,887$ 993,147$ 4,699,635$ 35,663$ 5,732,332$ Capital Facilities Fund 79,410 - - 842 - 80,252 Non-Major Governmental Funds 978,073 11,203 453 207,692 - 1,197,421 Other Enterprise Fund 100,367 - - 19,870 - 120,237 Self-Insurance Fund 48,566 70 8,097 - - 56,733
Total Due From Other Funds 1,206,416$ 15,160$ 1,001,697$ 4,928,039$ 35,663$ 7,186,975$
Due from the General Fund to the Special Education Pass-Through Fund for transfer of special education funds. 975,828$ Due from the General Fund to the Adult Education Fund for retro benefit payments. 1,347 Due from the General Fund to the Child Development Fund for health and welfare reimbursment. 7,470 Due from the General Fund to the Cafeteria Fund for bad debt transfer and catering expenses. 8,502 Due from the General Fund to the Capital Facilities Fund for prior year admininistrative fee adjustment. 3,887 Due from the General Fund to the Community Services Fund for contribution to program. 35,663 Due from the General Fund to the Self-Insurance Fund for health and welfare contributions. 4,699,635 Due from Adult Education Fund to the Self-Insurance Fund for health and welfare contributions. 19 Due from the Child Development Fund to the General Fund for payroll and indirect costs. 669,354 Due from the Child Development Fund to the Cafeteria Fund for catering expenses. 453 Due from the Child Development Fund to the Self-Insurance Fund for health and welfare contributions. 134,247 Due from the Cafeteria Fund to the General Fund for payroll and indirect costs. 308,719 Due from the Cafeteria Fund to the Self-Insurance Fund for health and welfare contributions. 70,518 Due from the Building Fund to the Capital Facilities Fund correct bond balance. 11,203 Due from the Building Fund to the Self-Insurance Fund for health and welfare contributions. 2,488 Due from the Capital Facilities Fund to the General Fund for administrative fee. 79,410 Due from the Capital Facilities Fund to the Self-Insurance Fund for health and welfare contributions. 842 Due from Special Reserve Fund for Capital Outlay Projects to the Self-Insurance Fund for health and welfare contributions. 420 Due from the Community Services Fund to the General Fund for payroll and indirect costs. 100,367 Due from the Community Services Fund to the Self-Insurance Fund for health and welfare contributions. 19,870 Due from the Self-Insurance Fund to the General Fund for health and welfare contribution correction. 48,566 Due from the Self-Insurance Fund to the Child Development Fund for health and welfare contribution correction. 8,063 Due from the Self-Insurance Fund to the Capital Facilities Fund for health and welfare contribution correction. 70 Due from the Self-Insurance Fund to the Special Reserve Fund for Capital Outlay Projects Fund for health and welfare contribution correction. 34
Total 7,186,975$
Due From Other Funds
B. Operating Transfers
Interfund transfers for the year ended June 30, 2019 consisted of the following:
Interfund Transfers Out General Fund
Non-Major Governmental
Funds Community
Services Fund Total General Fund -$ -$ 35,663$ 35,663$ Non-Major Governmental Funds 185,846 511,967 - 697,813
Total Interfund Transfers 185,846$ 511,967$ 35,663$ 733,476$
Transfer from the General Fund to the Community Services Fund for contribution. 35,663$ Transfer from the Adult Education Fund to the General Fund to close out Adult Education Fund. 185,846 Transfer from County School Facilities Fund to the Special Reserve Fund for Capital Outlay Projects for State Facilities Program revenue. 511,967
Total 733,476$
Interfund Transfers In
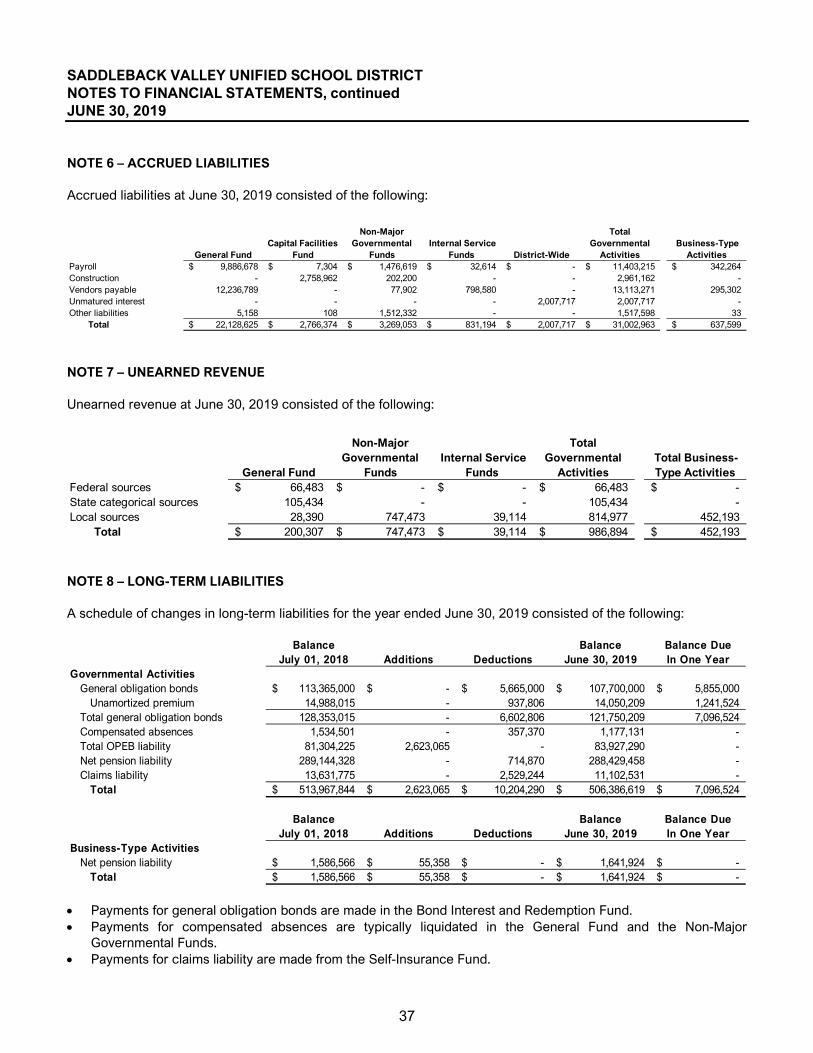
37
SADDLEBACK VALLEY UNIFIED SCHOOL DISTRICT NOTES TO FINANCIAL STATEMENTS, continued JUNE 30, 2019 NOTE 6 – ACCRUED LIABILITIES Accrued liabilities at June 30, 2019 consisted of the following:
NOTE 7 – UNEARNED REVENUE Unearned revenue at June 30, 2019 consisted of the following:
NOTE 8 – LONG-TERM LIABILITIES A schedule of changes in long-term liabilities for the year ended June 30, 2019 consisted of the following:
Balance Balance Balance DueJuly 01, 2018 Additions Deductions June 30, 2019 In One Year
Governmental ActivitiesGeneral obligation bonds 113,365,000$ -$ 5,665,000$ 107,700,000$ 5,855,000$
Unamortized premium 14,988,015 - 937,806 14,050,209 1,241,524 Total general obligation bonds 128,353,015 - 6,602,806 121,750,209 7,096,524 Compensated absences 1,534,501 - 357,370 1,177,131 - Total OPEB liability 81,304,225 2,623,065 - 83,927,290 - Net pension liability 289,144,328 - 714,870 288,429,458 - Claims liability 13,631,775 - 2,529,244 11,102,531 -
Total 513,967,844$ 2,623,065$ 10,204,290$ 506,386,619$ 7,096,524$
Balance Balance Balance DueJuly 01, 2018 Additions Deductions June 30, 2019 In One Year
Business-Type ActivitiesNet pension liability 1,586,566$ 55,358$ -$ 1,641,924$ -$
Total 1,586,566$ 55,358$ -$ 1,641,924$ -$ • Payments for general obligation bonds are made in the Bond Interest and Redemption Fund. • Payments for compensated absences are typically liquidated in the General Fund and the Non-Major
Governmental Funds. • Payments for claims liability are made from the Self-Insurance Fund.
General FundCapital Facilities
Fund
Non-Major Governmental
Funds Internal Service
Funds District-Wide
Total Governmental
Activities Business-Type
Activities Payroll 9,886,678$ 7,304$ 1,476,619$ 32,614$ -$ 11,403,215$ 342,264$ Construction - 2,758,962 202,200 - - 2,961,162 - Vendors payable 12,236,789 - 77,902 798,580 - 13,113,271 295,302 Unmatured interest - - - - 2,007,717 2,007,717 - Other liabilities 5,158 108 1,512,332 - - 1,517,598 33
Total 22,128,625$ 2,766,374$ 3,269,053$ 831,194$ 2,007,717$ 31,002,963$ 637,599$
General Fund
Non-Major Governmental
Funds Internal Service
Funds
Total Governmental
Activities Total Business-Type Activities
Federal sources 66,483$ -$ -$ 66,483$ -$ State categorical sources 105,434 - - 105,434 - Local sources 28,390 747,473 39,114 814,977 452,193
Total 200,307$ 747,473$ 39,114$ 986,894$ 452,193$
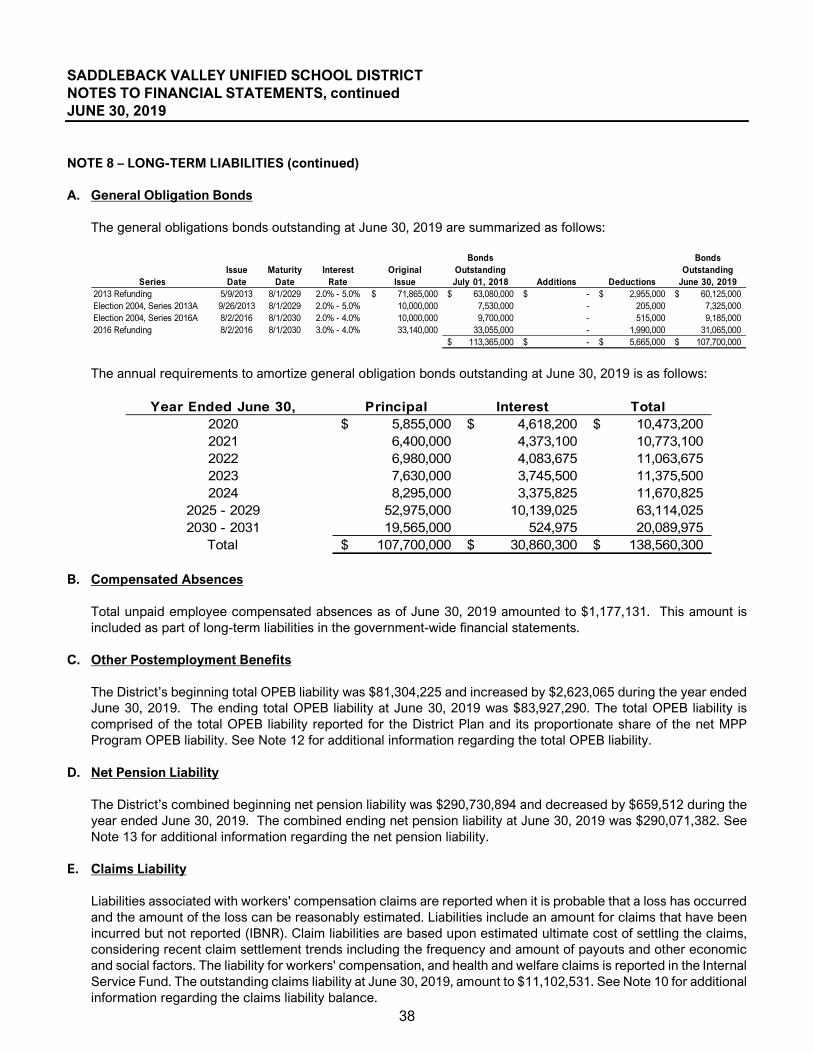
38
SADDLEBACK VALLEY UNIFIED SCHOOL DISTRICT NOTES TO FINANCIAL STATEMENTS, continued JUNE 30, 2019 NOTE 8 – LONG-TERM LIABILITIES (continued) A. General Obligation Bonds
The general obligations bonds outstanding at June 30, 2019 are summarized as follows:
Bonds BondsIssue Maturity Interest Original Outstanding Outstanding
Series Date Date Rate Issue July 01, 2018 Additions Deductions June 30, 20192013 Refunding 5/9/2013 8/1/2029 2.0% - 5.0% 71,865,000$ 63,080,000$ -$ 2,955,000$ 60,125,000$ Election 2004, Series 2013A 9/26/2013 8/1/2029 2.0% - 5.0% 10,000,000 7,530,000 - 205,000 7,325,000 Election 2004, Series 2016A 8/2/2016 8/1/2030 2.0% - 4.0% 10,000,000 9,700,000 - 515,000 9,185,000 2016 Refunding 8/2/2016 8/1/2030 3.0% - 4.0% 33,140,000 33,055,000 - 1,990,000 31,065,000
113,365,000$ -$ 5,665,000$ 107,700,000$ The annual requirements to amortize general obligation bonds outstanding at June 30, 2019 is as follows:
Year Ended June 30, Principal Interest Total2020 5,855,000$ 4,618,200$ 10,473,200$ 2021 6,400,000 4,373,100 10,773,100 2022 6,980,000 4,083,675 11,063,675 2023 7,630,000 3,745,500 11,375,500 2024 8,295,000 3,375,825 11,670,825
2025 - 2029 52,975,000 10,139,025 63,114,025 2030 - 2031 19,565,000 524,975 20,089,975
Total 107,700,000$ 30,860,300$ 138,560,300$ B. Compensated Absences
Total unpaid employee compensated absences as of June 30, 2019 amounted to $1,177,131. This amount is included as part of long-term liabilities in the government-wide financial statements.
C. Other Postemployment Benefits
The District’s beginning total OPEB liability was $81,304,225 and increased by $2,623,065 during the year ended June 30, 2019. The ending total OPEB liability at June 30, 2019 was $83,927,290. The total OPEB liability is comprised of the total OPEB liability reported for the District Plan and its proportionate share of the net MPP Program OPEB liability. See Note 12 for additional information regarding the total OPEB liability.
D. Net Pension Liability
The District’s combined beginning net pension liability was $290,730,894 and decreased by $659,512 during the year ended June 30, 2019. The combined ending net pension liability at June 30, 2019 was $290,071,382. See Note 13 for additional information regarding the net pension liability.
E. Claims Liability
Liabilities associated with workers' compensation claims are reported when it is probable that a loss has occurred and the amount of the loss can be reasonably estimated. Liabilities include an amount for claims that have been incurred but not reported (IBNR). Claim liabilities are based upon estimated ultimate cost of settling the claims, considering recent claim settlement trends including the frequency and amount of payouts and other economic and social factors. The liability for workers' compensation, and health and welfare claims is reported in the Internal Service Fund. The outstanding claims liability at June 30, 2019, amount to $11,102,531. See Note 10 for additional information regarding the claims liability balance.
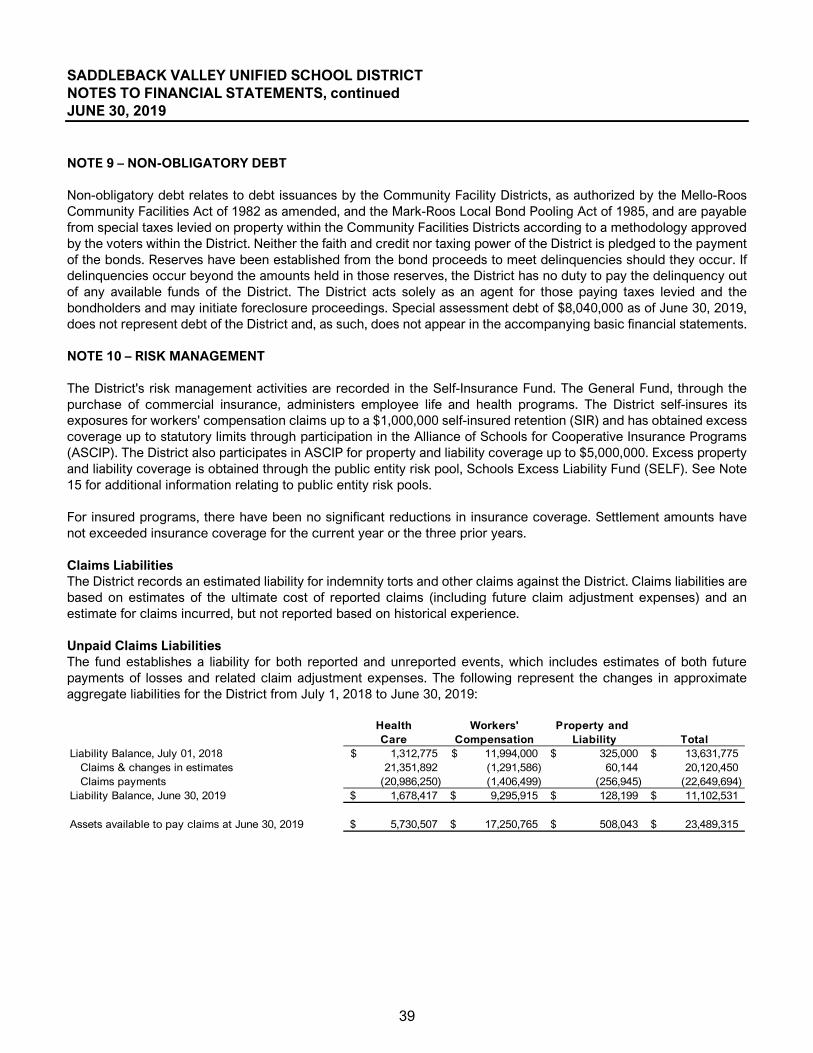
39
SADDLEBACK VALLEY UNIFIED SCHOOL DISTRICT NOTES TO FINANCIAL STATEMENTS, continued JUNE 30, 2019 NOTE 9 – NON-OBLIGATORY DEBT Non-obligatory debt relates to debt issuances by the Community Facility Districts, as authorized by the Mello-Roos Community Facilities Act of 1982 as amended, and the Mark-Roos Local Bond Pooling Act of 1985, and are payable from special taxes levied on property within the Community Facilities Districts according to a methodology approved by the voters within the District. Neither the faith and credit nor taxing power of the District is pledged to the payment of the bonds. Reserves have been established from the bond proceeds to meet delinquencies should they occur. If delinquencies occur beyond the amounts held in those reserves, the District has no duty to pay the delinquency out of any available funds of the District. The District acts solely as an agent for those paying taxes levied and the bondholders and may initiate foreclosure proceedings. Special assessment debt of $8,040,000 as of June 30, 2019, does not represent debt of the District and, as such, does not appear in the accompanying basic financial statements. NOTE 10 – RISK MANAGEMENT The District's risk management activities are recorded in the Self-Insurance Fund. The General Fund, through the purchase of commercial insurance, administers employee life and health programs. The District self-insures its exposures for workers' compensation claims up to a $1,000,000 self-insured retention (SIR) and has obtained excess coverage up to statutory limits through participation in the Alliance of Schools for Cooperative Insurance Programs (ASCIP). The District also participates in ASCIP for property and liability coverage up to $5,000,000. Excess property and liability coverage is obtained through the public entity risk pool, Schools Excess Liability Fund (SELF). See Note 15 for additional information relating to public entity risk pools. For insured programs, there have been no significant reductions in insurance coverage. Settlement amounts have not exceeded insurance coverage for the current year or the three prior years. Claims Liabilities The District records an estimated liability for indemnity torts and other claims against the District. Claims liabilities are based on estimates of the ultimate cost of reported claims (including future claim adjustment expenses) and an estimate for claims incurred, but not reported based on historical experience. Unpaid Claims Liabilities The fund establishes a liability for both reported and unreported events, which includes estimates of both future payments of losses and related claim adjustment expenses. The following represent the changes in approximate aggregate liabilities for the District from July 1, 2018 to June 30, 2019:
Health Workers' Property and Care Compensation Liability Total
Liability Balance, July 01, 2018 1,312,775$ 11,994,000$ 325,000$ 13,631,775$ Claims & changes in estimates 21,351,892 (1,291,586) 60,144 20,120,450 Claims payments (20,986,250) (1,406,499) (256,945) (22,649,694)
Liability Balance, June 30, 2019 1,678,417$ 9,295,915$ 128,199$ 11,102,531$
Assets available to pay claims at June 30, 2019 5,730,507$ 17,250,765$ 508,043$ 23,489,315$
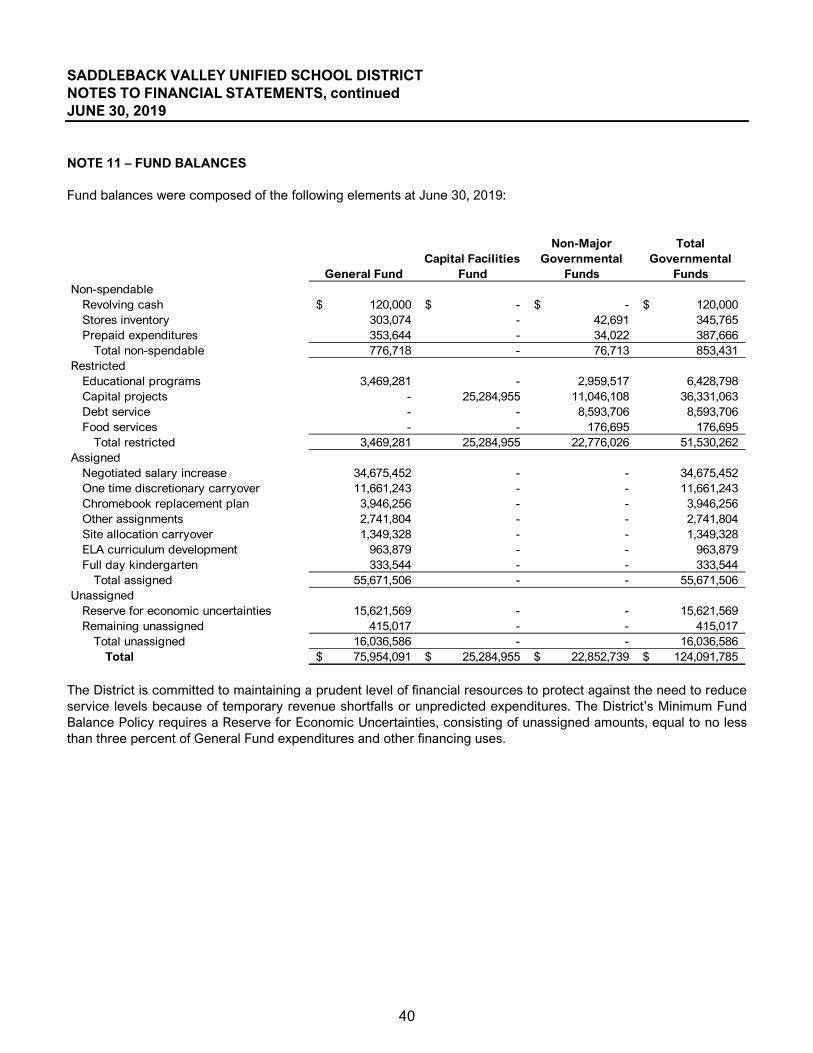
40
SADDLEBACK VALLEY UNIFIED SCHOOL DISTRICT NOTES TO FINANCIAL STATEMENTS, continued JUNE 30, 2019 NOTE 11 – FUND BALANCES Fund balances were composed of the following elements at June 30, 2019:
General FundCapital Facilities
Fund
Non-Major Governmental
Funds
Total Governmental
FundsNon-spendable
Revolving cash 120,000$ -$ -$ 120,000$ Stores inventory 303,074 - 42,691 345,765 Prepaid expenditures 353,644 - 34,022 387,666
Total non-spendable 776,718 - 76,713 853,431 Restricted
Educational programs 3,469,281 - 2,959,517 6,428,798 Capital projects - 25,284,955 11,046,108 36,331,063 Debt service - - 8,593,706 8,593,706 Food services - - 176,695 176,695
Total restricted 3,469,281 25,284,955 22,776,026 51,530,262 Assigned
Negotiated salary increase 34,675,452 - - 34,675,452 One time discretionary carryover 11,661,243 - - 11,661,243 Chromebook replacement plan 3,946,256 - - 3,946,256 Other assignments 2,741,804 - - 2,741,804 Site allocation carryover 1,349,328 - - 1,349,328 ELA curriculum development 963,879 - - 963,879 Full day kindergarten 333,544 - - 333,544
Total assigned 55,671,506 - - 55,671,506 Unassigned
Reserve for economic uncertainties 15,621,569 - - 15,621,569 Remaining unassigned 415,017 - - 415,017
Total unassigned 16,036,586 - - 16,036,586 Total 75,954,091$ 25,284,955$ 22,852,739$ 124,091,785$
The District is committed to maintaining a prudent level of financial resources to protect against the need to reduce service levels because of temporary revenue shortfalls or unpredicted expenditures. The District’s Minimum Fund Balance Policy requires a Reserve for Economic Uncertainties, consisting of unassigned amounts, equal to no less than three percent of General Fund expenditures and other financing uses.
41
SADDLEBACK VALLEY UNIFIED SCHOOL DISTRICT NOTES TO FINANCIAL STATEMENTS, continued JUNE 30, 2019 NOTE 12 – POSTEMPLOYMENT BENEFITS OTHER THAN PENSIONS (OPEB)
A. Plan Description
The Saddleback Valley Unified School District’s defined benefit OPEB plan, Saddleback Valley Unified School District Retiree Benefit Plan (the Plan) is described below. The Plan is a single-employer defined benefit plan administered by the District. No assets are accumulated in a trust that meets the criteria in paragraph 4 of GASB Statement 75. Medicare Premium Payment (MPP) Program The Medicare Premium Payment Program is a cost‐sharing multiple‐employer other postemployment benefit plan established pursuant to Chapter 1032, Statutes of 2000 (SB 1435). CalSTRS administers the MPP Program, through the Teachers’ Health Benefit Fund. The MPP Program pays Medicare Part A premiums and Medicare Parts A and B late enrollment surcharges for eligible members of the Defined Benefit Program who were retired or began receiving a disability allowance prior to July 1, 2012, and were not eligible for premium free Medicare Part A. The payments are made directly to the Centers for Medicare and Medicaid Services on a monthly basis.
B. OPEB Plan Fiduciary Net Position – MPP Program
Detailed information about the Plan’s fiduciary net position is available in the separately-issued Plan Annual Financial Report that includes financial statements and required supplementary information. That report may be obtained by contacting the District.
C. Benefits Provided The Plan provides medical, dental, and vision insurance benefits to eligible retirees and their spouses. Benefits are provided through a third-party insurer, and the full cost of benefits is covered by the Plan. The District's governing board has the authority to establish and amend the benefit terms as contained within the negotiated labor agreements.
D. Contributions
The benefit payment requirements of the Plan members and the District are established and may be amended by the District, the Saddleback Valley Educators Association (SVEA), the local California Service Employees Association (CSEA), and unrepresented groups. The benefit payment is based on projected pay-as-you-go financing requirements as determined annually through the agreements with the District, SVEA, CSEA, and the unrepresented groups. For the measurement period presented, the District contributed $4,978,653 to the Plan, all of which was used for current premiums.
E. Plan Membership Membership of the Plan consisted of the following:
Number of participants
Inactive employees receiving benefits 240 Inactive employees entitled to but not receiving benefits* - Participating active employees 1,917
Total number of participants** 2,157
*Information not provided**As of the June 30, 2017 valuation date
42
SADDLEBACK VALLEY UNIFIED SCHOOL DISTRICT NOTES TO FINANCIAL STATEMENTS, continued JUNE 30, 2019 NOTE 12 – POSTEMPLOYMENT BENEFITS OTHER THAN PENSIONS (OPEB) (continued) F. Net OPEB Liability
The components of the net OPEB liability of the District at June 30, 2019, were as follows:
Total OPEB liability - District Plan 82,523,028$ District's Proportionate Share of the Net MPP OPEB Liability 1,404,262 District's total recorded net OPEB liability 83,927,290$
G. Actuarial Assumptions and Other Inputs
The District’s proportionate share of the net MPP Program OPEB liability was measured as of June 30, 2018 and was determined by an actuarial valuation as of June 30, 2017. The total OPEB liability as of June 30, 2019 was determined by an actuarial valuation as of June 30, 2017 using the following actuarial assumptions and other inputs, applied to all periods included in the measurement and rolled forward to the measurement date of June 30, 2018:
District Plan Economic assumptions:
Inflation 2.75% Salary increases 2.75% Discount rate 3.80% Healthcare cost trend rates 4.00%
Non-economic assumptions: Mortality Rates Mortality rates were based on the 2009 CalSTRS Mortality Table for certificated employees and the 2014 CalPERS Active Mortality for Miscellaneous Employees Table for classified employees. Mortality rates vary by age and sex. (Unisex mortality rates are not often used as individual OPEB benefits do not depend on the mortality table used.) If employees die prior to retirement, past contributions are available to fund benefits for employees who live to retirement. After retirement, death results in benefit termination or reduction.
MPP Program Economic assumptions:
Inflation 2.75% Investment yield 7.00% Discount rate 3.58%
Non-economic assumptions: Mortality Rates CalSTRS changed the mortality assumptions based on the July 1, 2010, through June 30, 2015, experience study adopted by the board in February 2017. CalSTRS uses a generational mortality assumption, which involves the use of a base mortality table and projection scales to reflect expected annual reductions in mortality rates at each age, resulting in increases in life expectancies each year into the future. The base mortality tables are CalSTRS custom tables derived to best fit the patterns of mortality among our members. The projection scale was set equal to 110 percent of the ultimate improvement factor from the Mortality Improvement Scale (MP‐2016) table, issued by the Society of Actuaries.
43
SADDLEBACK VALLEY UNIFIED SCHOOL DISTRICT NOTES TO FINANCIAL STATEMENTS, continued JUNE 30, 2019 NOTE 12 – POSTEMPLOYMENT BENEFITS OTHER THAN PENSIONS (OPEB) (continued)
H. Changes in Net OPEB Liability
June 30, 2019Total OPEB LiabilityService Cost 6,606,055$ Interest on total OPEB liability 3,051,308 Changes of assumptions (1,639,550) Benefits payments (4,978,653) Net change in total OPEB liability 3,039,160 Total OPEB liability - beginning 79,483,868 Total OPEB liability - ending (a) 82,523,028$
District's Proportionate Share of the Net MPP OPEB Liability (b) 1,404,262$
District's total recorded net OPEB liability - ending (a) + (b) 83,927,290$
Covered-employee payroll N/A*
*Note: The District's OPEB Plan is not administered through a trust and contributions are not made based on a measure of pay. Therefore, no measure of payroll is presented.
I. Sensitivity of the OPEB Liability to Changes in the Discount Rate
The following presents the OPEB liability of the Saddleback Valley Unified School District, as well as what the District’s OPEB liability would be if it were calculated using a discount rate that is one percentage point lower or one percentage point higher than the current discount rate:
1% DecreaseValuation
Discount Rate 1% Increase(2.8%) (3.8%) (4.8%)
Total OPEB liability - District Plan 87,468,408$ 82,523,028$ 77,828,441$
1% Decrease Discount Rate 1% Increase(2.87%) (3.87%) (4.87%)
Net OPEB liability - MPP Program 1,553,739$ 1,404,262$ 1,270,249$
44
SADDLEBACK VALLEY UNIFIED SCHOOL DISTRICT NOTES TO FINANCIAL STATEMENTS, continued JUNE 30, 2019 NOTE 12 – POSTEMPLOYMENT BENEFITS OTHER THAN PENSIONS (OPEB) (continued) J. Sensitivity of the OPEB Liability to Changes in the Healthcare Cost Trend Rate
The following presents the OPEB liability of the Saddleback Valley Unified School District, as well as what the District’s OPEB liability would be if it were calculated using a healthcare cost trend rate that is one percentage point lower or one percentage point higher than the current healthcare cost trend rate:
1% DecreaseHealth Care Cost
Trend Rate 1% Increase(3.0%) (4.0%) (5.0%)
Total OPEB liability - District Plan 77,900,537$ 82,523,028$ 87,426,104$
1% DecreaseMedicare Costs
Trend Rate 1% Increase
(2.7% Part A and3.1% Part B)
(3.7% Part A and4.1% Part B)
(4.7% Part A and5.1% Part B)
Net OPEB liability - MPP Program 1,281,002$ 1,404,262$ 1,537,866$ K. OPEB Expense and Deferred Outflows and Deferred Inflows of Resources Related to OPEB
For the year ended June 30, 2019, the Saddleback Valley Unified School District recognized OPEB expense of $9,505,552. At June 30, 2019, the Saddleback Valley Unified School District reported deferred outflows of resources related to OPEB and deferred inflows of resources related to OPEB from the following sources:
District Plan MPP ProgramDeferred Outflows Deferred Inflows
of Resources of Resources
Changes in assumptions 1,487,739$ -$ Changes in proportion and differences
between District contributions andproportionate share of contributions - 237,322
District contributions subsequentto the measurement date 5,204,070 -
6,691,809$ 237,322$

45
SADDLEBACK VALLEY UNIFIED SCHOOL DISTRICT NOTES TO FINANCIAL STATEMENTS, continued JUNE 30, 2019 NOTE 12 – POSTEMPLOYMENT BENEFITS OTHER THAN PENSIONS (OPEB) (continued) K. OPEB Expense and Deferred Outflows and Deferred Inflows of Resources Related to OPEB (continued)
The $5,204,070 reported as deferred outflows of resources related to OPEB resulting from District contributions subsequent to the measurement date will be recognized as a reduction of the total OPEB liability in the year ended June 30, 2019. Other amounts reported as deferred outflows of resources and deferred inflows of resources related to OPEB will be recognized in OPEB expense as follows:
NOTE 13 – PENSION PLANS Qualified employees are covered under multiple-employer contributory retirement plans maintained by agencies of the State of California. Certificated employees are members of the California State Teachers' Retirement System (CalSTRS), and classified employees are members of the California Public Employees' Retirement System (CalPERS). The District reported its proportionate share of the net pension liabilities, pension expense, deferred outflow of resources, and deferred inflow of resources for each of the above plans as follows:
Net pension liability
Deferred outflows related
to pensions
Deferred inflows related
to pensionsPension expense
STRS Pension 214,415,551$ 60,012,700$ 26,563,064$ 23,348,194$ PERS Pension 75,655,831 20,548,791 1,386,316 13,856,296
Total 290,071,382$ 80,561,491$ 27,949,380$ 37,204,490$ A. California State Teachers’ Retirement System (CalSTRS)
Plan Description The District contributes to the California State Teachers' Retirement System (CalSTRS); a cost-sharing multiple employer public employee retirement system defined benefit pension plan administered by CalSTRS. The plan provides retirement and disability benefits and survivor benefits to beneficiaries. Benefit provisions are established by state statutes, as legislatively amended, within the State Teachers' Retirement Law. CalSTRS issues a separate comprehensive annual financial report that includes financial statements and required supplementary information. Copies of the CalSTRS annual financial report may be obtained from CalSTRS, 7919 Folsom Blvd., Sacramento, CA 95826.
District Plan MPP ProgramDeferred Outflows Deferred Inflows
Year Ended June 30, of Resources of Resources2020 151,811$ 39,554$ 2021 151,811 39,554 2022 151,811 39,554 2023 151,811 39,554 2024 151,811 39,554
Thereafter 728,684 39,552 1,487,739$ 237,322$
46
SADDLEBACK VALLEY UNIFIED SCHOOL DISTRICT NOTES TO FINANCIAL STATEMENTS, continued JUNE 30, 2019 NOTE 13 – PENSION PLANS (continued) A. California State Teachers’ Retirement System (CalSTRS) (continued)
Benefits Provided The CalSTRS defined benefit plan has two benefit formulas:
1. CalSTRS 2% at 60: Members first hired on or before December 31, 2012, to perform service that could be
creditable to CalSTRS. CalSTRS 2% at 60 members are eligible for normal retirement at age 60, with a minimum of five years of credited service. The normal retirement benefit is equal to 2.0 percent of final compensation for each year of credited service. Early retirement options are available at age 55 with five years of credited service or as early as age 50 with 30 years of credited service. The age factor for retirements after age 60 increases with each quarter year of age to 2.4 percent at age 63 or older. Members who have 30 years or more of credited service receive an additional increase of up to 0.2 percent to the age factor, known as the career factor. The maximum benefit with the career factor is 2.4 percent of final compensation.
2. CalSTRS 2% at 62: Members first hired on or after January 1, 2013, to perform service that could be
creditable to CalSTRS. CalSTRS 2% at 62 members are eligible for normal retirement at age 62, with a minimum of five years of credited service. The normal retirement benefit is equal to 2.0 percent of final compensation for each year of credited service. An early retirement option is available at age 55. The age factor for retirement after age 62 increases with each quarter year of age to 2.4 percent at age 65 or older.
Contributions Active plan CalSTRS 2% at 60 and 2% at 62 members are required to contribute 10.25% and 10.205% of their salary for fiscal year 2019, respectively, and the District is required to contribute an actuarially determined rate. The actuarial methods and assumptions used for determining the rate are those adopted by CalSTRS Teachers' Retirement Board. The required employer contribution rate for fiscal year 2019 was 16.28% of annual payroll. The contribution requirements of the plan members are established by state statute. Contributions to the plan from the District were $21,259,688 for the year ended June 30, 2019. On-Behalf Payments The District was the recipient of on-behalf payments made by the State of California to CalSTRS for K-12 education. These payments consist of state general fund contributions of approximately $19,571,949 to CalSTRS, which included a supplemental contribution for fiscal year 2019 due to California Senate Bill No. 90. Pension Liabilities, Pension Expense, and Deferred Outflows of Resources and Deferred Inflows of Resources Related to Pensions At June 30, 2019, the District reported a liability for its proportionate share of the net pension liability that reflected a reduction for State pension support provided to the District. The amount recognized by the District as its proportionate share of the net pension liability, the related State support, and the total portion of the net pension liability that was associated with the District were as follows:
District's proportionate share of the
net pension liability 214,415,551$ State's proportionate share of the net
pension liability associated with the District 122,763,533 Total 337,179,084$
47
SADDLEBACK VALLEY UNIFIED SCHOOL DISTRICT NOTES TO FINANCIAL STATEMENTS, continued JUNE 30, 2019 NOTE 13 – PENSION PLANS (continued) A. California State Teachers’ Retirement System (CalSTRS) (continued)
Pension Liabilities, Pension Expense, and Deferred Outflows of Resources and Deferred Inflows of Resources Related to Pensions (continued) The net pension liability was measured as of June 30, 2018, and the total pension liability used to calculate the net pension liability was determined by applying update procedures to an actuarial valuation as of June 30, 2017 and rolling forward the total pension liability to June 30, 2018. The District’s proportion of the net pension liability was based on a projection of the District’s long-term share of contributions to the pension plan relative to the projected contributions of all participating school districts, actuarially determined. At June 30, 2018, the District’s proportion was 0.233 percent, which was a decrease of 0.006 percent from its proportion measured as of June 30, 2017. For the year ended June 30, 2019, the District recognized pension expense of $23,348,194. In addition, the District recognized pension expense and revenue of $4,282,669 for support provided by the State. At June 30, 2019, the District reported deferred outflows of resources and deferred inflows of resources related to pensions from the following sources:
Deferred Outflows Deferred Inflowsof Resources of Resources
Differences between projected andactual earnings on plan investments -$ 8,256,353$
Differences between expected andactual experience 664,894 3,114,504
Changes in assumptions 33,308,867 - Changes in proportion and differences
between District contributions andproportionate share of contributions 4,779,251 15,192,207
District contributions subsequentto the measurement date 21,259,688 -
60,012,700$ 26,563,064$
The $21,259,688 reported as deferred outflows of resources related to pensions resulting from District contributions subsequent to the measurement date will be recognized as a reduction of the net pension liability in the year ended June 30, 2020. Other amounts reported as deferred outflows of resources and deferred inflows of resources related to pensions will be recognized in pension expense as follows:
District Plan MPP Program
Deferred Outflows Deferred InflowsYear Ended June 30, of Resources of Resources
2020 151,811$ 39,554$ 2021 151,811 39,554 2022 151,811 39,554 2023 151,811 39,554 2024 151,811 39,554
Thereafter 728,684 39,552 1,487,739$ 237,322$
48
SADDLEBACK VALLEY UNIFIED SCHOOL DISTRICT NOTES TO FINANCIAL STATEMENTS, continued JUNE 30, 2019 NOTE 13 – PENSION PLANS (continued) A. California State Teachers’ Retirement System (CalSTRS) (continued)
Actuarial Assumptions The total pension liability was determined by applying update procedures to an actuarial valuation as of June 30, 2017, and rolling forward the total pension liability to June 30, 2018 using the following actuarial assumptions, applied to all periods included in the measurement:
Consumer Price Inflation 2.75% Investment Rate of Return* 7.10% Wage Inflation 3.50%
* Net of investment expenses, but gross of administrative expenses. CalSTRS uses custom mortality tables to best fit the patterns of mortality among its members. These custom tables are based on MP-2016 series tables adjusted to fit CalSTRS experience. The actuarial assumptions used in the June 30, 2017 valuation were based on the results of an actuarial experience study for the period of July 1, 2010 to June 30, 2015. The long-term expected rate of return on pension plan investments was determined using a building-block method in which best-estimate ranges of expected future real rates of return (expected returns, net of pension plan investment expense and inflation) are developed for each major asset class. The best-estimate ranges were developed using capital market assumptions from CalSTRS general investment consultant (Pension Consulting Alliance–PCA) as an input to the process. The actuarial investment rate of return assumption was adopted by the board in February 2017 in conjunction with the most recent experience study. For each future valuation, CalSTRS consulting actuary (Milliman) reviews the return assumption for reasonableness based on the most current capital market assumptions. Best estimates of 20-year geometrically-linked real rates of return and the assumed asset allocation for each major asset class for the year ended June 30, 2018, are summarized in the following table:
Asset Class
Assumed Asset Allocation
Long-Term Expected Real Rate of Return*
Global Equity 47% 6.30% Fixed Income 12% 0.30% Real Estate 13% 5.20% Private Equity 13% 9.30% Risk Mitigating Strategies 9% 2.90% Inflation Sensitive 4% 3.80% Cash/Liquidity 2% -1.00% 100% *20-year geometric average
49
SADDLEBACK VALLEY UNIFIED SCHOOL DISTRICT NOTES TO FINANCIAL STATEMENTS, continued JUNE 30, 2019 NOTE 13 – PENSION PLANS (continued) A. California State Teachers’ Retirement System (CalSTRS) (continued)
Discount Rate The discount rate used to measure the total pension liability was 7.10 percent. The projection of cash flows used to determine the discount rate assumed that contributions from plan members and employers will be made at statutory contribution rates in accordance with the rate increases per AB 1469. Projected inflows from investment earnings were calculated using the long-term assumed investment rate of return (7.10 percent) and assuming that contributions, benefit payments, and administrative expense occur midyear. Based on those assumptions, the Plan’s fiduciary net position was projected to be available to make all projected future benefit payments to current plan members. Therefore, the long-term assumed investment rate of return was applied to all periods of projected benefit payments to determine the total pension liability. Sensitivity of the District’s Proportionate Share of the Net Pension Liability to Changes in the Discount Rate The following presents the District’s proportionate share of the net pension liability calculated using the discount rate of 7.10 percent, as well as what the District’s proportionate share of the net pension liability would be if it were calculated using a discount rate that is 1-percentage-point lower (6.10 percent) or 1-percentage-point higher (8.10 percent) than the current rate:
1% Current 1%
Decrease Discount Rate Increase(6.10%) (7.10%) (8.10%)
District's proportionate share ofthe net pension liability 314,093,692$ 214,415,551$ 131,772,700$
Pension Plan Fiduciary Net Position Detailed information about the pension plan’s fiduciary net position is available in the separately issued CalSTRS financial report.
50
SADDLEBACK VALLEY UNIFIED SCHOOL DISTRICT NOTES TO FINANCIAL STATEMENTS, continued JUNE 30, 2019 NOTE 13 – PENSION PLANS (continued) B. California Public Employees’ Retirement System (CalPERS)
Plan Description The District contributes to the School Employer Pool under the California Public Employees' Retirement System (CalPERS); a cost-sharing multiple-employer public employee retirement system defined benefit pension plan administered by CalPERS. The plan provides retirement and disability benefits, annual cost-of-living adjustments, and death benefits to plan members and beneficiaries. Benefit provisions are established by state statutes, as legislatively amended, within the Public Employees' Retirement Laws. CalPERS issues a separate comprehensive annual financial report that includes financial statements and required supplementary information. Copies of the CalPERS annual financial report may be obtained from the CalPERS Executive Office, 400 P Street, Sacramento, CA 95811. Benefits Provided The benefits for the defined benefit plan are based on members’ years of service, age, final compensation, and benefit formula. Benefits are provided for disability, death, and survivors of eligible members or beneficiaries. Members become fully vested in their retirement benefits earned to date after five years of credited service. Contributions Active plan members who entered into the plan prior to January 1, 2013, are required to contribute 7.0% of their salary. The California Public Employees’ Pension Reform Act (PEPRA) specifies that new members entering into the plan on or after January 1, 2013, shall pay the higher of fifty percent of normal costs or 7.0% of their salary. Additionally, for new members entering the plan on or after January 1, 2013, the employer is prohibited from paying any of the employee contribution to CalPERS unless the employer payment of the member’s contribution is specified in an employment agreement or collective bargaining agreement that expires after January 1, 2013. The District is required to contribute an actuarially determined rate. The actuarial methods and assumptions used for determining the rate are those adopted by the CalPERS Board of Administration. The required employer contribution rate for fiscal year 2019 was 18.062% of annual payroll. Contributions to the plan from the District were $7,324,897 for the year ended June 30, 2019. On-Behalf Payments The District was the recipient of on-behalf payments made by the State of California to CalPERS for K-12 education. These payments consisted of state general fund contributions of approximately $2,565,100 to CalPERS for fiscal year 2019 due to California Senate Bill No. 90.
Pension Liabilities, Pension Expense, and Deferred Outflows of Resources and Deferred Inflows of Resources Related to Pensions At June 30, 2019, the District reported a liability of $75,655,831 for its proportionate share of the net pension liability. The net pension liability was measured as of June 30, 2018, and the total pension liability used to calculate the net pension liability was determined by applying update procedures to an actuarial valuation as of June 30, 2017 and rolling forward the total pension liability to June 30, 2018. The District’s proportion of the net pension liability was based on a projection of the District’s long-term share of contributions to the pension plan relative to the projected contributions of all participating school districts, actuarially determined. At June 30, 2018, the District’s proportion was 0.284 percent, which was a decrease of 0.008 percent from its proportion measured as of June 30, 2017.

51
SADDLEBACK VALLEY UNIFIED SCHOOL DISTRICT NOTES TO FINANCIAL STATEMENTS, continued JUNE 30, 2019 NOTE 13 – PENSION PLANS (continued) B. California Public Employees’ Retirement System (CalPERS) (continued)
Pension Liabilities, Pension Expense, and Deferred Outflows of Resources and Deferred Inflows of Resources Related to Pensions (continued) For the year ended June 30, 2019, the District recognized pension expense of $13,856,296. At June 30, 2019, the District reported deferred outflows of resources and deferred inflows of resources related to pensions from the following sources:
Deferred Outflows Deferred Inflowsof Resources of Resources
Differences between projected andactual earnings on plan investments 620,548$ -$
Differences between expected andactual experience 4,959,719 -
Changes in assumptions 7,553,901 - Changes in proportion and differences
between District contributions andproportionate share of contributions 89,726 1,386,316
District contributions subsequentto the measurement date 7,324,897 -
20,548,791$ 1,386,316$
The $7,324,897 reported as deferred outflows of resources related to pensions resulting from District contributions subsequent to the measurement date will be recognized as a reduction of the net pension liability in the year ended June 30, 2020. Other amounts reported as deferred outflows of resources and deferred inflows of resources related to pensions will be recognized in pension expense as follows:
Deferred Outflows Deferred InflowsYear Ended June 30, of Resources of Resources
2020 7,917,774$ 566,442$ 2021 5,848,750 431,513 2022 (96,077) 388,361 2023 (446,553) -
13,223,894$ 1,386,316$
52
SADDLEBACK VALLEY UNIFIED SCHOOL DISTRICT NOTES TO FINANCIAL STATEMENTS, continued JUNE 30, 2019 NOTE 13 – PENSION PLANS (continued) B. California Public Employees’ Retirement System (CalPERS) (continued)
Actuarial Assumptions The total pension liability was determined by applying update procedures to an actuarial valuation as of June 30, 2017, and rolling forward the total pension liability to June 30, 2018 using the following actuarial assumptions, applied to all periods included in the measurement:
Inflation 2.50% Discount Rate 7.15% Salary Increases Varies by Entry Age and Service
CalPERS uses custom mortality tables to best fit the patterns of mortality among its members. These custom tables are derived using CalPERS’ membership data for all funds. The table includes 15 years of mortality improvements using the Society of Actuaries Scale 90% of scale MP 2016. The actuarial assumptions used in the June 30, 2017, valuation were based on the results of an actuarial experience study for the period from 1997 to 2015. The long-term expected rate of return on pension plan investments was determined using a building block method in which best estimate ranges of expected future real rates of return (expected returns, net of pension plan investment expense and inflation) are developed for each major asset class. In determining the long-term expected rate of return, both short-term and long-term market return expectations as well as the expected pension fund cash flows were taken into account. Such cash flows were developed assuming that both members and employers will make their required contributions on time and as scheduled in all future years. Using historical returns of all the funds’ asset classes, expected compound (geometric) returns were calculated over the short-term (first 10 years) and the long-term (11-60 years) using a building block approach. Using the expected nominal returns for both short-term and long-term, the present value of benefits was calculated for each fund. The expected rate of return was set by calculating the single equivalent expected return that arrived at the same present value of benefits for cash flows as the one calculated using both short-term and long-term returns. The expected rate of return was then set equivalent to the single equivalent rate calculated above and adjusted to account for assumed administrative expenses.

53
SADDLEBACK VALLEY UNIFIED SCHOOL DISTRICT NOTES TO FINANCIAL STATEMENTS, continued JUNE 30, 2019 NOTE 13 – PENSION PLANS (continued) B. California Public Employees’ Retirement System (CalPERS) (continued)
Actuarial Assumptions (continued) The table below reflects long-term expected real rate of return by asset class. The rate of return was calculated using the capital market assumptions applied to determine the discount rate and asset allocation. These geometric rates of return are net of administrative expenses.
Asset Class Assumed Asset
Allocation Real Return
Years 1 – 10* Real
Return Years 11+**
Global Equity 50.0% 4.80% 5.98% Fixed Income 28.0% 1.00% 2.62% Inflation Assets 0.0% 0.77% 1.81% Private Equity 8.0% 6.30% 7.23% Real Estate 13.0% 3.75% 4.93% Liquidity 1.0% 0.0% -0.92% 100.0%
*An expected inflation of 2.00% used for this period. **An expected inflation of 2.92% used for this period.
Discount Rate The discount rate used to measure the total pension liability was 7.15 percent. A projection of the expected benefit payments and contributions was performed to determine if assets would run out. The test revealed the assets would not run out. Therefore, the long-term expected rate of return on pension plan investments was applied to all periods of projected benefit payments to determine the total pension liability for the Schools Pool. The results of the crossover testing for the Schools Pool are presented in a detailed report that can be obtained at CalPERS’ website. Sensitivity of the District’s Proportionate Share of the Net Pension Liability to Changes in the Discount Rate The following presents the District’s proportionate share of the net pension liability calculated using the discount rate of 7.15 percent, as well as what the District’s proportionate share of the net pension liability would be if it were calculated using a discount rate that is 1-percentage-point lower (6.15 percent) or 1-percentage-point higher (8.15 percent) than the current rate:
1% Current 1%
Decrease Discount Rate Increase(6.15%) (7.15%) (8.15%)
District's proportionate share ofthe net pension liability 110,151,272$ 75,655,831$ 47,036,925$
Pension Plan Fiduciary Net Position Detailed information about the pension plan’s fiduciary net position is available in the separately issued CalPERS financial report.
54
SADDLEBACK VALLEY UNIFIED SCHOOL DISTRICT NOTES TO FINANCIAL STATEMENTS, continued JUNE 30, 2019 NOTE 14 – COMMITMENTS AND CONTINGENCIES A. Grants
The District received financial assistance from federal and state agencies in the form of grants. The disbursement of funds received under these programs generally requires compliance with terms and conditions specified in the grant agreements and are subject to audit by the grantor agencies. Any disallowed claims resulting from such audits could become a liability of the General Fund or other applicable funds. However, in the opinion of management, any such disallowed claims will not have a material adverse effect on the overall financial position of the District at June 30, 2019.
B. Litigation
The District is involved in various litigation arising from the normal course of business. In the opinion of management and legal counsel, the disposition of all litigation pending is not expected to have a material adverse effect on the overall financial position of the District at June 30, 2019.
C. Construction Commitments
As of June 30, 2019, the District had commitments with respect to unfinished capital projects of $21,260,097. NOTE 15 – PARTICIPATION IN JOINT POWERS AUTHORITIES The District is a member of the Alliance of Schools for Cooperative Insurance Programs (ASCIP) and the Schools Excess Liability Fund (SELF) public entity risk pools. The District pays an annual premium to the applicable entity for its property and liability coverage. The relationships between the District and the pools are such that they are not component units of the District for financial reporting purposes. The JPAs provide property and liability insurance coverage for their member school districts. The JPAs are governed by a board consisting of a representative from each member district. The governing board controls the operations of its JPAs independent of any influence by the member districts beyond their representation on the governing board. Each member district pays a premium commensurate with the level of coverage requested and shares surpluses and deficits proportionately to its participation in the JPAs. Financial information for the most recently audited period is available directly from the JPA. The District also participates in the Coastline Regional Occupational Program (CROP) for the occupational training for high school students and adults residing within the District boundaries. The relationship between the District and the pools are such that they are not component units of the District for financial reporting purposes. Financial information for the most recently audited period is available directly from the entity.

55
SADDLEBACK VALLEY UNIFIED SCHOOL DISTRICT NOTES TO FINANCIAL STATEMENTS, continued JUNE 30, 2019 NOTE 16 – DEFERRED OUTFLOWS/INFLOWS OF RESOURCES A. Refunded Debt
Pursuant to GASB Statement No. 63, Financial Reporting of Deferred Outflows of Resources, Deferred Inflows of Resources, and Net Position and GASB Statement No. 65, Items Previously Reported as Assets and Liabilities, the District recognized deferred outflows or inflows of resources in the District-wide financial statements. The deferred outflow of resources pertains to the difference in the carrying value of the refunded debt and its reacquisition price (deferred amount on refunding). Previous financial reporting standards require this to be presented as part of the District’s long-term debt. This deferred outflow of resources is recognized as a component of interest expense in a systematic and rational manner over the remaining life of the old debt or the new debt, whichever is shorter. At June 30, 2019, the deferred amount on refunding was $3,154,356.
B. Pension Plans
Pursuant to GASB Statement No. 68, Accounting and Financial Reporting for Pensions, the District recognized deferred outflows of resources related to pensions and deferred inflows of resources related to pensions in the District-wide financial statements. Further information regarding the deferred outflows of resources and deferred inflows of resources can be found in Note 13. At June 30, 2019, total deferred outflows related to pensions was $80,561,491 and total deferred inflows related to pensions was $27,949,380.
C. Other Postemployment Benefits
Pursuant to GASB Statement No. 75, Accounting and Financial Reporting for Postemployment Benefits Other Than Pensions, the District recognized deferred outflows of resources related to other postemployment benefits and deferred inflows of resources related to other postemployment benefits in the District-wide financial statements. Further information regarding the deferred outflows of resources and deferred inflows of resources can be found in Note 12. At June 30, 2019, total deferred outflows related to other postemployment benefits was $6,691,809 and total deferred inflows related to other postemployment benefits was $237,322.
NOTE 17 – RESTATEMENT OF NET POSITION AND FUND BALANCE There were certain items that occurred in the prior year net position and fund balances that have been restated to more accurately reflect the substance of the underlying transactions. As a result, the effect on the current fiscal year is as follows:
Governmental Activities
Net Position - Beginning, as Previously Reported 65,371,873$ Restatement 2,893,292 Net Position - Beginning, as Restated 68,265,165$
Bond Interest & Redemption Fund
Fund Balance - Beginning, as Previously Reported 8,386,419$ Restatement 10,588 Fund Balance - Beginning, as Restated 8,397,007$
REQUIRED SUPPLEMENTARY INFORMATION
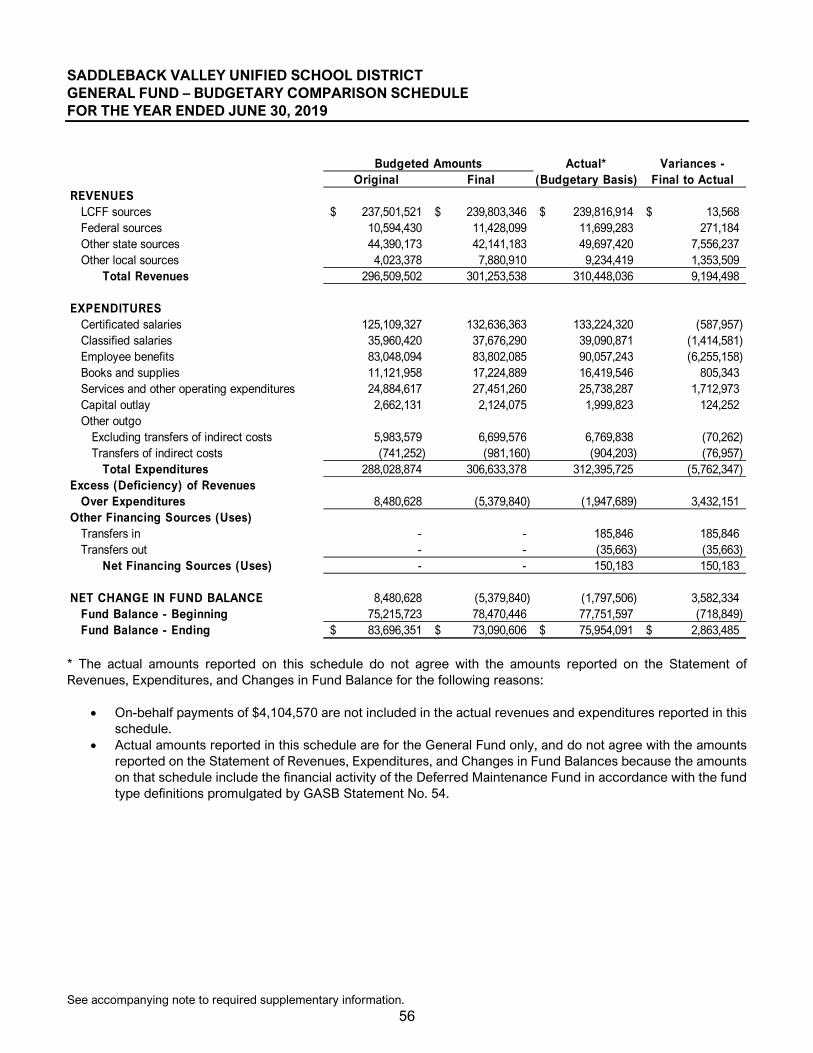
See accompanying note to required supplementary information.
56
SADDLEBACK VALLEY UNIFIED SCHOOL DISTRICT GENERAL FUND – BUDGETARY COMPARISON SCHEDULE FOR THE YEAR ENDED JUNE 30, 2019
Actual* Variances - Original Final (Budgetary Basis) Final to Actual
REVENUESLCFF sources 237,501,521$ 239,803,346$ 239,816,914$ 13,568$ Federal sources 10,594,430 11,428,099 11,699,283 271,184 Other state sources 44,390,173 42,141,183 49,697,420 7,556,237 Other local sources 4,023,378 7,880,910 9,234,419 1,353,509
Total Revenues 296,509,502 301,253,538 310,448,036 9,194,498
EXPENDITURESCertificated salaries 125,109,327 132,636,363 133,224,320 (587,957) Classified salaries 35,960,420 37,676,290 39,090,871 (1,414,581) Employee benefits 83,048,094 83,802,085 90,057,243 (6,255,158) Books and supplies 11,121,958 17,224,889 16,419,546 805,343 Services and other operating expenditures 24,884,617 27,451,260 25,738,287 1,712,973 Capital outlay 2,662,131 2,124,075 1,999,823 124,252 Other outgo
Excluding transfers of indirect costs 5,983,579 6,699,576 6,769,838 (70,262) Transfers of indirect costs (741,252) (981,160) (904,203) (76,957)
Total Expenditures 288,028,874 306,633,378 312,395,725 (5,762,347) Excess (Deficiency) of Revenues
Over Expenditures 8,480,628 (5,379,840) (1,947,689) 3,432,151 Other Financing Sources (Uses)
Transfers in - - 185,846 185,846 Transfers out - - (35,663) (35,663)
Net Financing Sources (Uses) - - 150,183 150,183
NET CHANGE IN FUND BALANCE 8,480,628 (5,379,840) (1,797,506) 3,582,334 Fund Balance - Beginning 75,215,723 78,470,446 77,751,597 (718,849) Fund Balance - Ending 83,696,351$ 73,090,606$ 75,954,091$ 2,863,485$
Budgeted Amounts
* The actual amounts reported on this schedule do not agree with the amounts reported on the Statement of Revenues, Expenditures, and Changes in Fund Balance for the following reasons:
• On-behalf payments of $4,104,570 are not included in the actual revenues and expenditures reported in this schedule.
• Actual amounts reported in this schedule are for the General Fund only, and do not agree with the amounts reported on the Statement of Revenues, Expenditures, and Changes in Fund Balances because the amounts on that schedule include the financial activity of the Deferred Maintenance Fund in accordance with the fund type definitions promulgated by GASB Statement No. 54.
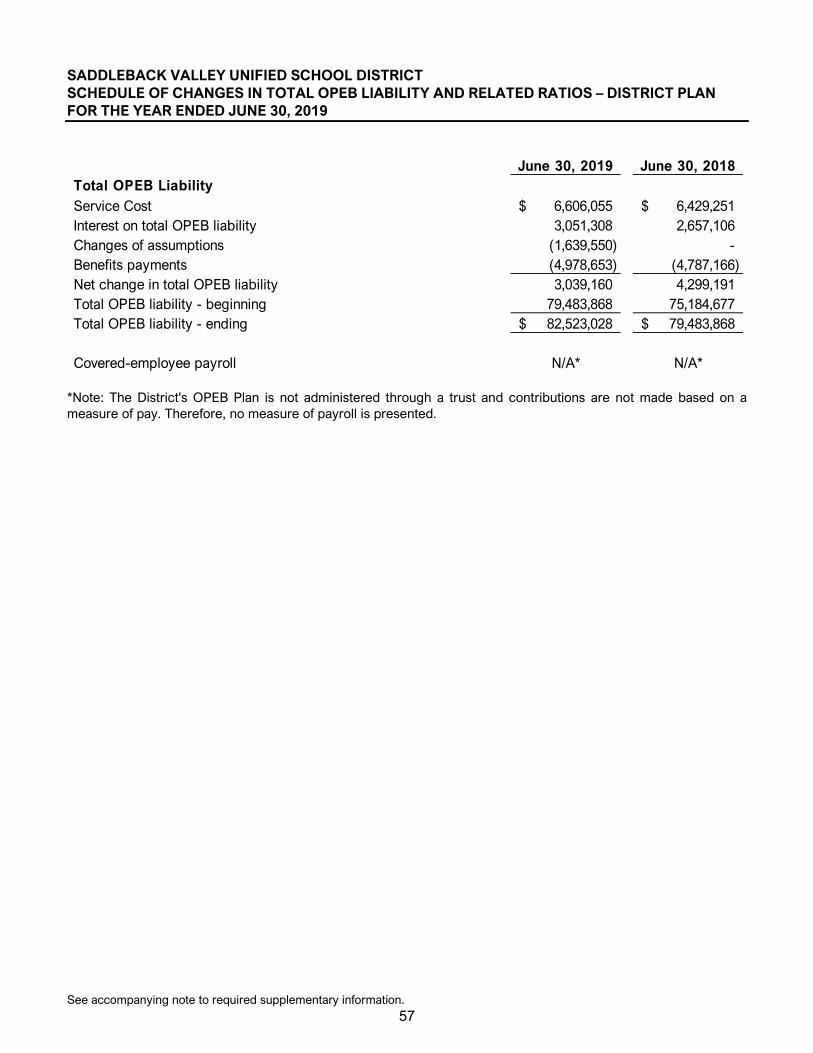
See accompanying note to required supplementary information.
57
SADDLEBACK VALLEY UNIFIED SCHOOL DISTRICT SCHEDULE OF CHANGES IN TOTAL OPEB LIABILITY AND RELATED RATIOS – DISTRICT PLAN FOR THE YEAR ENDED JUNE 30, 2019
June 30, 2019 June 30, 2018Total OPEB LiabilityService Cost 6,606,055$ 6,429,251$ Interest on total OPEB liability 3,051,308 2,657,106 Changes of assumptions (1,639,550) - Benefits payments (4,978,653) (4,787,166) Net change in total OPEB liability 3,039,160 4,299,191 Total OPEB liability - beginning 79,483,868 75,184,677 Total OPEB liability - ending 82,523,028$ 79,483,868$
Covered-employee payroll N/A* N/A* *Note: The District's OPEB Plan is not administered through a trust and contributions are not made based on a measure of pay. Therefore, no measure of payroll is presented.
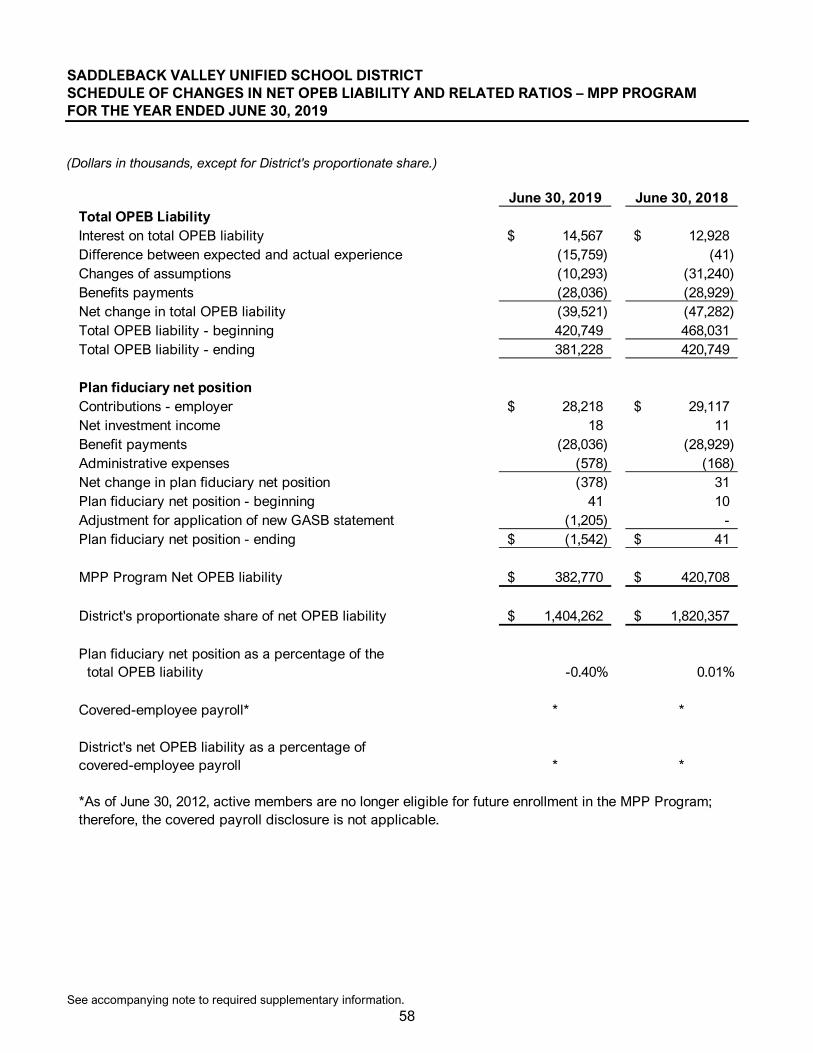
See accompanying note to required supplementary information.
58
SADDLEBACK VALLEY UNIFIED SCHOOL DISTRICT SCHEDULE OF CHANGES IN NET OPEB LIABILITY AND RELATED RATIOS – MPP PROGRAM FOR THE YEAR ENDED JUNE 30, 2019 (Dollars in thousands, except for District's proportionate share.)
June 30, 2019 June 30, 2018Total OPEB LiabilityInterest on total OPEB liability 14,567$ 12,928$ Difference between expected and actual experience (15,759) (41) Changes of assumptions (10,293) (31,240) Benefits payments (28,036) (28,929) Net change in total OPEB liability (39,521) (47,282) Total OPEB liability - beginning 420,749 468,031 Total OPEB liability - ending 381,228 420,749
Plan fiduciary net positionContributions - employer 28,218$ 29,117$ Net investment income 18 11 Benefit payments (28,036) (28,929) Administrative expenses (578) (168) Net change in plan fiduciary net position (378) 31 Plan fiduciary net position - beginning 41 10 Adjustment for application of new GASB statement (1,205) - Plan fiduciary net position - ending (1,542)$ 41$
MPP Program Net OPEB liability 382,770$ 420,708$
District's proportionate share of net OPEB liability 1,404,262$ 1,820,357$
Plan fiduciary net position as a percentage of the total OPEB liability -0.40% 0.01%
Covered-employee payroll* * *
District's net OPEB liability as a percentage of covered-employee payroll * *
*As of June 30, 2012, active members are no longer eligible for future enrollment in the MPP Program; therefore, the covered payroll disclosure is not applicable.
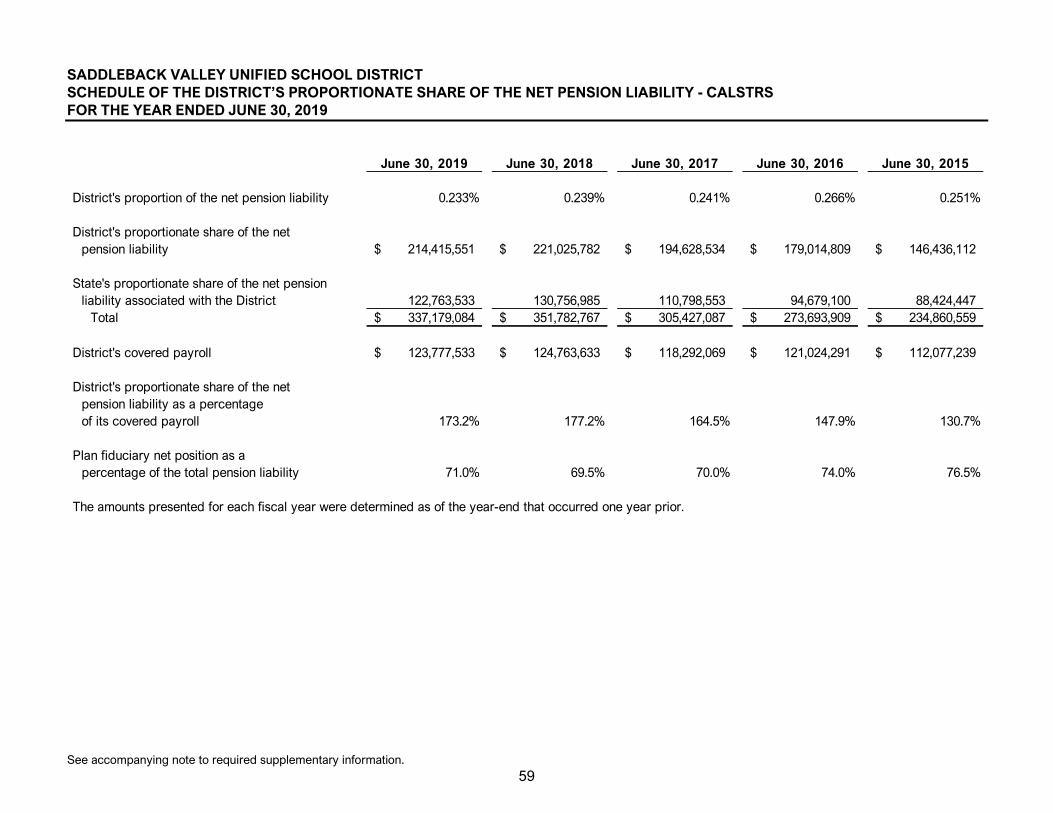
See accompanying note to required supplementary information.
59
SADDLEBACK VALLEY UNIFIED SCHOOL DISTRICT SCHEDULE OF THE DISTRICT’S PROPORTIONATE SHARE OF THE NET PENSION LIABILITY - CALSTRS FOR THE YEAR ENDED JUNE 30, 2019
June 30, 2019 June 30, 2018 June 30, 2017 June 30, 2016 June 30, 2015
District's proportion of the net pension liability 0.233% 0.239% 0.241% 0.266% 0.251%
District's proportionate share of the net pension liability 214,415,551$ 221,025,782$ 194,628,534$ 179,014,809$ 146,436,112$
State's proportionate share of the net pensionliability associated with the District 122,763,533 130,756,985 110,798,553 94,679,100 88,424,447
Total 337,179,084$ 351,782,767$ 305,427,087$ 273,693,909$ 234,860,559$
District's covered payroll 123,777,533$ 124,763,633$ 118,292,069$ 121,024,291$ 112,077,239$
District's proportionate share of the netpension liability as a percentageof its covered payroll 173.2% 177.2% 164.5% 147.9% 130.7%
Plan fiduciary net position as apercentage of the total pension liability 71.0% 69.5% 70.0% 74.0% 76.5%
The amounts presented for each fiscal year were determined as of the year-end that occurred one year prior.
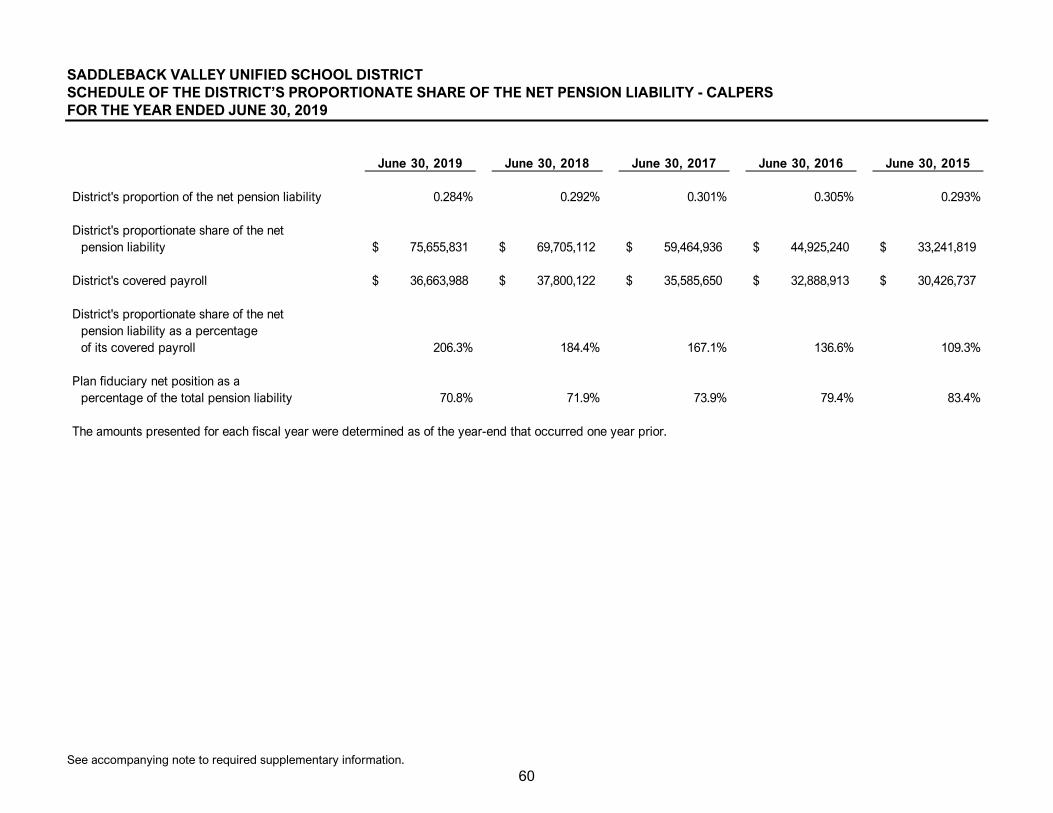
See accompanying note to required supplementary information.
60
SADDLEBACK VALLEY UNIFIED SCHOOL DISTRICT SCHEDULE OF THE DISTRICT’S PROPORTIONATE SHARE OF THE NET PENSION LIABILITY - CALPERS FOR THE YEAR ENDED JUNE 30, 2019
June 30, 2019 June 30, 2018 June 30, 2017 June 30, 2016 June 30, 2015
District's proportion of the net pension liability 0.284% 0.292% 0.301% 0.305% 0.293%
District's proportionate share of the net pension liability 75,655,831$ 69,705,112$ 59,464,936$ 44,925,240$ 33,241,819$
District's covered payroll 36,663,988$ 37,800,122$ 35,585,650$ 32,888,913$ 30,426,737$
District's proportionate share of the netpension liability as a percentageof its covered payroll 206.3% 184.4% 167.1% 136.6% 109.3%
Plan fiduciary net position as apercentage of the total pension liability 70.8% 71.9% 73.9% 79.4% 83.4%
The amounts presented for each fiscal year were determined as of the year-end that occurred one year prior.
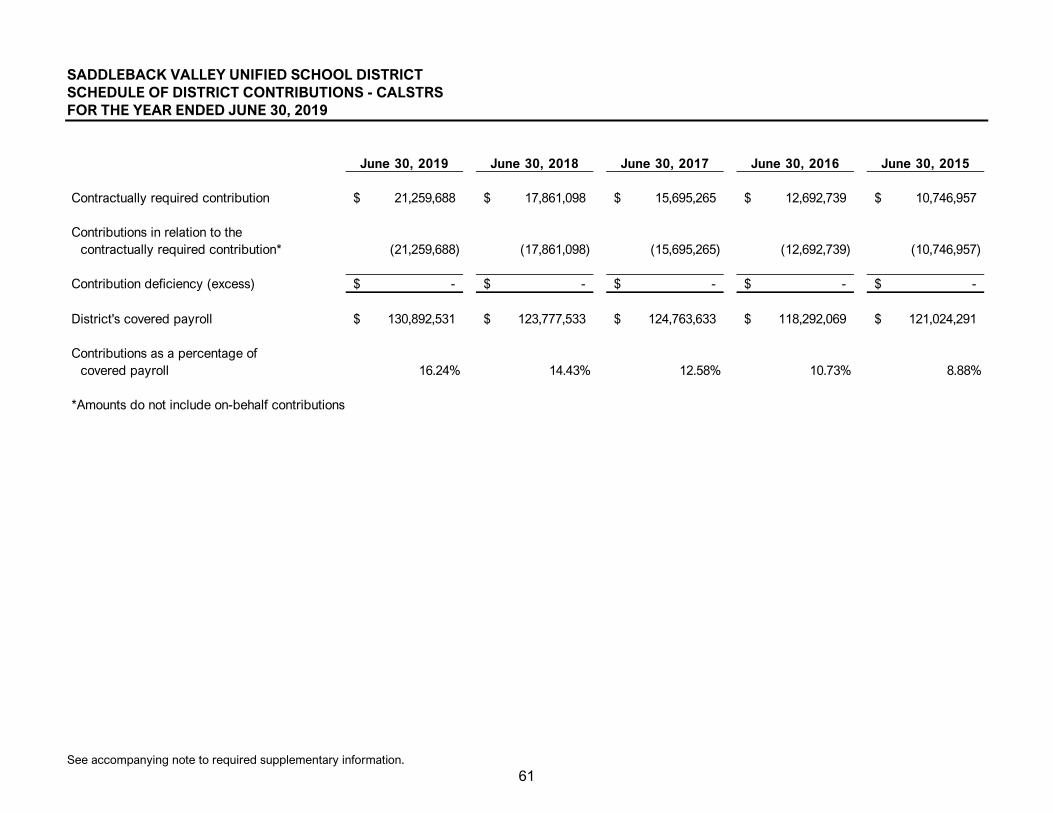
See accompanying note to required supplementary information.
61
SADDLEBACK VALLEY UNIFIED SCHOOL DISTRICT SCHEDULE OF DISTRICT CONTRIBUTIONS - CALSTRS FOR THE YEAR ENDED JUNE 30, 2019
June 30, 2019 June 30, 2018 June 30, 2017 June 30, 2016 June 30, 2015
Contractually required contribution 21,259,688$ 17,861,098$ 15,695,265$ 12,692,739$ 10,746,957$
Contributions in relation to the contractually required contribution* (21,259,688) (17,861,098) (15,695,265) (12,692,739) (10,746,957)
Contribution deficiency (excess) -$ -$ -$ -$ -$
District's covered payroll 130,892,531$ 123,777,533$ 124,763,633$ 118,292,069$ 121,024,291$
Contributions as a percentage of covered payroll 16.24% 14.43% 12.58% 10.73% 8.88%
*Amounts do not include on-behalf contributions
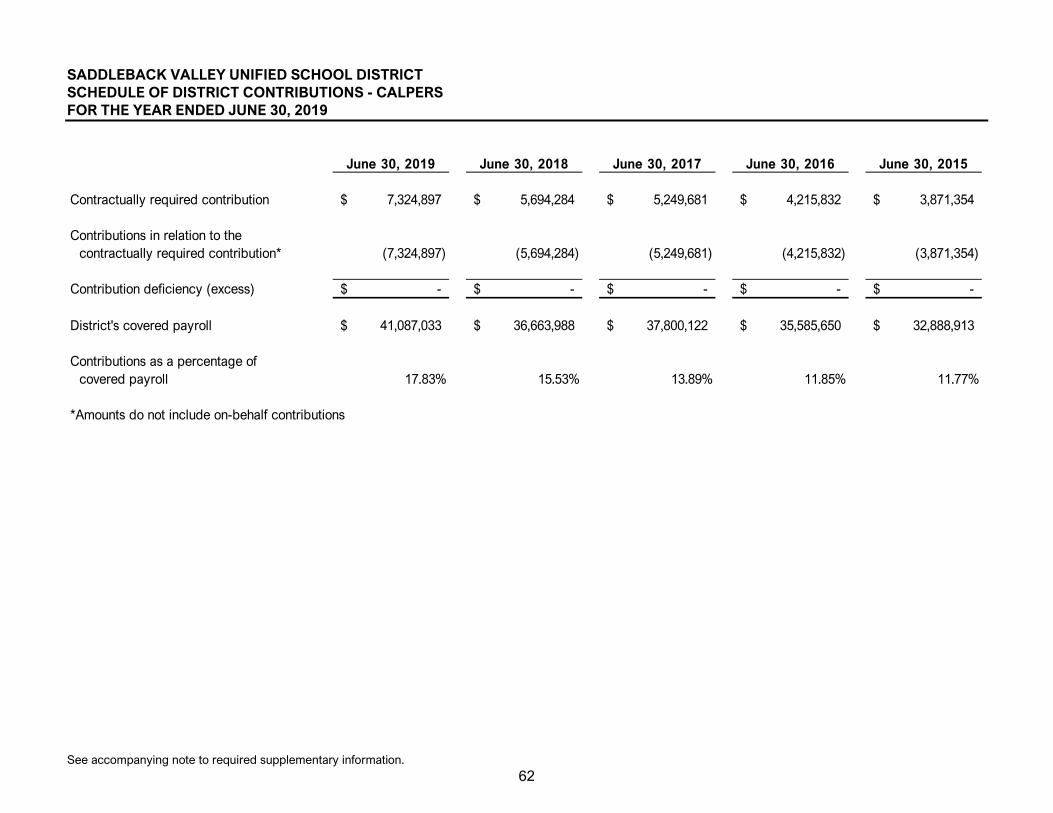
See accompanying note to required supplementary information.
62
SADDLEBACK VALLEY UNIFIED SCHOOL DISTRICT SCHEDULE OF DISTRICT CONTRIBUTIONS - CALPERS FOR THE YEAR ENDED JUNE 30, 2019
June 30, 2019 June 30, 2018 June 30, 2017 June 30, 2016 June 30, 2015
Contractually required contribution 7,324,897$ 5,694,284$ 5,249,681$ 4,215,832$ 3,871,354$
Contributions in relation to the contractually required contribution* (7,324,897) (5,694,284) (5,249,681) (4,215,832) (3,871,354)
Contribution deficiency (excess) -$ -$ -$ -$ -$
District's covered payroll 41,087,033$ 36,663,988$ 37,800,122$ 35,585,650$ 32,888,913$
Contributions as a percentage of covered payroll 17.83% 15.53% 13.89% 11.85% 11.77%
*Amounts do not include on-behalf contributions
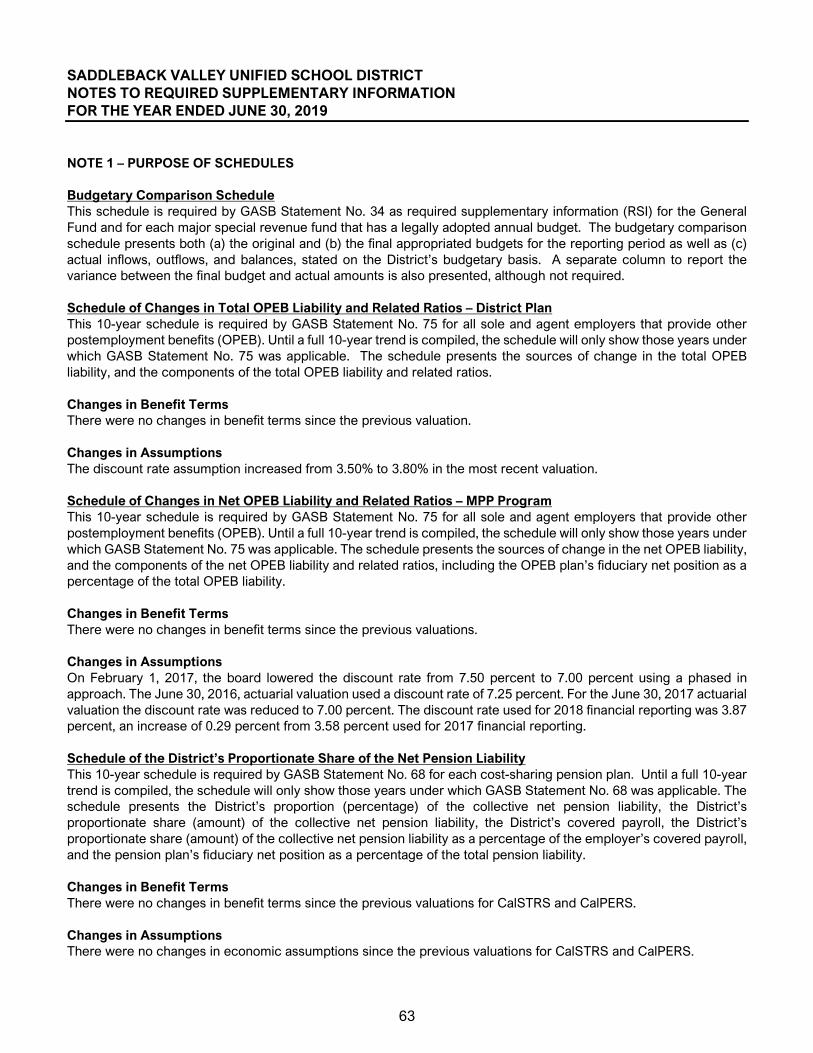
63
SADDLEBACK VALLEY UNIFIED SCHOOL DISTRICT NOTES TO REQUIRED SUPPLEMENTARY INFORMATION FOR THE YEAR ENDED JUNE 30, 2019 NOTE 1 – PURPOSE OF SCHEDULES Budgetary Comparison Schedule This schedule is required by GASB Statement No. 34 as required supplementary information (RSI) for the General Fund and for each major special revenue fund that has a legally adopted annual budget. The budgetary comparison schedule presents both (a) the original and (b) the final appropriated budgets for the reporting period as well as (c) actual inflows, outflows, and balances, stated on the District’s budgetary basis. A separate column to report the variance between the final budget and actual amounts is also presented, although not required. Schedule of Changes in Total OPEB Liability and Related Ratios – District Plan This 10-year schedule is required by GASB Statement No. 75 for all sole and agent employers that provide other postemployment benefits (OPEB). Until a full 10-year trend is compiled, the schedule will only show those years under which GASB Statement No. 75 was applicable. The schedule presents the sources of change in the total OPEB liability, and the components of the total OPEB liability and related ratios. Changes in Benefit Terms There were no changes in benefit terms since the previous valuation. Changes in Assumptions The discount rate assumption increased from 3.50% to 3.80% in the most recent valuation. Schedule of Changes in Net OPEB Liability and Related Ratios – MPP Program This 10-year schedule is required by GASB Statement No. 75 for all sole and agent employers that provide other postemployment benefits (OPEB). Until a full 10-year trend is compiled, the schedule will only show those years under which GASB Statement No. 75 was applicable. The schedule presents the sources of change in the net OPEB liability, and the components of the net OPEB liability and related ratios, including the OPEB plan’s fiduciary net position as a percentage of the total OPEB liability. Changes in Benefit Terms There were no changes in benefit terms since the previous valuations. Changes in Assumptions On February 1, 2017, the board lowered the discount rate from 7.50 percent to 7.00 percent using a phased in approach. The June 30, 2016, actuarial valuation used a discount rate of 7.25 percent. For the June 30, 2017 actuarial valuation the discount rate was reduced to 7.00 percent. The discount rate used for 2018 financial reporting was 3.87 percent, an increase of 0.29 percent from 3.58 percent used for 2017 financial reporting. Schedule of the District’s Proportionate Share of the Net Pension Liability This 10-year schedule is required by GASB Statement No. 68 for each cost-sharing pension plan. Until a full 10-year trend is compiled, the schedule will only show those years under which GASB Statement No. 68 was applicable. The schedule presents the District’s proportion (percentage) of the collective net pension liability, the District’s proportionate share (amount) of the collective net pension liability, the District’s covered payroll, the District’s proportionate share (amount) of the collective net pension liability as a percentage of the employer’s covered payroll, and the pension plan’s fiduciary net position as a percentage of the total pension liability. Changes in Benefit Terms There were no changes in benefit terms since the previous valuations for CalSTRS and CalPERS. Changes in Assumptions There were no changes in economic assumptions since the previous valuations for CalSTRS and CalPERS.

64
SADDLEBACK VALLEY UNIFIED SCHOOL DISTRICT NOTES TO REQUIRED SUPPLEMENTARY INFORMATION, continued FOR THE YEAR ENDED JUNE 30, 2019 NOTE 1 – PURPOSE OF SCHEDULES (continued) Schedule of District Contributions This 10-year schedule is required by GASB Statement No. 68 for each cost-sharing pension plan. Until a full 10-year trend is compiled, the schedule will only show those years under which GASB Statement No. 68 was applicable. The schedule presents the District’s statutorily or contractually required employer contribution, the amount of contributions recognized by the pension plan in relation to the statutorily or contractually required employer contribution, the difference between the statutorily or contractually required employer contribution and the amount of contributions recognized by the pension plan in relation to the statutorily or contractually required employer contribution, the District’s covered payroll, and the amount of contributions recognized by the pension plan in relation to the statutorily or contractually required employer contribution as a percentage of the District’s covered payroll. NOTE 2 – EXCESS OF EXPENDITURES OVER APPROPRIATIONS For the year ended June 30, 2019, the District incurred an excess of expenditures over appropriations in individual major funds presented in the Budgetary Comparison Schedule by major object code as follows:
Budget Actual ExcessGeneral Fund
Certificated salaries 132,636,363$ 133,224,320$ 587,957$ Classified salaries 37,676,290$ 39,090,871$ 1,414,581$ Employee benefits 83,802,085$ 90,057,243$ 6,255,158$ Other outgo
Excluding transfers of indirect costs 6,699,576$ 6,769,838$ 70,262$
Expenditures and Other Uses

SUPPLEMENTARY INFORMATION

See accompanying note to supplementary information.
65
SADDLEBACK VALLEY UNIFIED SCHOOL DISTRICT SCHEDULE OF EXPENDITURES OF FEDERAL AWARDS FOR THE YEAR ENDED JUNE 30, 2019
CFDA Number
Pass-Through Entity Identifying Number
Federal Expenditures
U. S. DEPARTMENT OF EDUCATION:Passed through California Department of Education:
Title I, Part A, Basic Grants Low-Income and Neglected [1] 84.010 14329 2,639,489$ Title II, Part A, Supporting Effective Instruction Local Grants [1] 84.367 14341 768,756 Title III
Title III, English Learner Student Program 84.365 14346 521,964 Title III, Immigrant Education Program 84.365 15146 67,443
Subtotal Title III 589,407 Title IV, Part A, Student Support and Academic Enrichment Grants 84.424 15396 91,584 Special Education Cluster
IDEA Basic Local Assistance Entitlement, Part B, Sec 611 84.027 13379 5,532,646 IDEA Mental Health Average Daily Attendance (ADA) Allocation, Part B, Sec 611 84.027A 15197 336,122 IDEA Preschool Local Entitlement, Part B, Section 611 (AGE 3-4-5) 84.027A 13682 555,372 IDEA Quality Assurance & Focused Monitoring 84.027A 13693 639 IDEA Preschool Grants, Part B, Section 619 (Age 3-4-5) 84.173 13430 155,197 IDEA Preschool Capacity Building, Part B, Sec 619 84.173A 13839 6,296 Alternate Dispute Resolution, Part B, Sec 611 84.173A 13007 8,309 IDEA Preschool Staff Development, Part B, Sec 619 84.173A 13431 152
Subtotal Special Education Cluster 6,594,733 IDEA Early Intervention Grants, Part C 84.181 23761 30,148 Vocational Programs: Voc & Appl Tech Secondary II C, Sec 131 (Carl Perkins Act) 84.048 14893 154,360
Passed through California Department of Rehabilitation: Rehabilitation Services - Vocational Rehabilitation Grants to States:
Department of Rehabilitation: Workability II, Transitions Partnership Program 84.126 10006 471,033 Work Incentive Training 84.126A 10006 24,212
Subtotal Rehabilitation Services - Vocational Rehabilitation Grants to States 495,245 Total U. S. Department of Education 11,363,722
U. S. DEPARTMENT OF AGRICULTURE:Passed through California Department of Education:
Child Nutrition ClusterSchool Breakfast Program - Needy 10.553 13526 675,609 National School Lunch Program 10.555 13391 2,631,491 USDA Commodities [2] 10.555 * 410,706 Summer Food Service Program for Children 10.559 13004 21,461
Subtotal Child Nutrition Cluster 3,739,267 Forest Reserve Funds 10.665 10044 7,219
Total U. S. Department of Agriculture 3,746,486
U. S. DEPARTMENT OF HEALTH AND HUMAN SERVICES:Passed through California Department of Health Services:
MedicaidMedi-Cal Billing Option 93.778 10013 381,298 Medi-Cal Administrative Activities 93.778 10060 466,295
Subtotal Medicaid 847,593 Total U. S. Department of Health & Human Services 847,593
U. S. DEPARTMENT OF HOUSING AND URBAN DEVELOPMENT:Direct Award
Community Development Block Grant - Child Care, City of Lake Forest 14.218 * 2,411 Community Development Block Grant - Child Care, City of Mission Viejo 14.218 * 1,775
Total U. S. Department of Housing and Urban Development 4,186 Total Federal Expenditures 15,961,987$
[1] - Major Program[2] - In-Kind Contribution* - Pass-Through Entity Identifying Number not available or not applicable
Federal Grantor/Pass-Through Grantor/Program or Cluster

See accompanying note to supplementary information.
66
SADDLEBACK VALLEY UNIFIED SCHOOL DISTRICT SCHEDULE OF AVERAGE DAILY ATTENDANCE (ADA) FOR THE YEAR ENDED JUNE 30, 2019
SecondPeriod AnnualReport Report
Certificate No.D02F994B
Certificate No.B1031E3A
SCHOOL DISTRICTTK/K through Third
Regular ADA 7,351.20 7,355.55 Extended Year Special Education 11.84 11.84 Special Education - Nonpublic Schools 3.36 3.68 Extended Year Special Education - Nonpublic Schools 0.22 0.22
Total TK/K through Third 7,366.62 7,371.29 Fourth through Sixth
Regular ADA 5,599.14 5,598.81 Extended Year Special Education 6.33 6.33 Special Education - Nonpublic Schools 7.06 7.23 Extended Year Special Education - Nonpublic Schools 0.95 0.95
Total Fourth through Sixth 5,613.48 5,613.32 Seventh through Eighth
Regular ADA 3,918.84 3,908.71 Extended Year Special Education 3.03 3.03 Special Education - Nonpublic Schools 1.90 2.06 Extended Year Special Education - Nonpublic Schools 0.43 0.43
Total Seventh through Eighth 3,924.20 3,914.23 Ninth through Twelfth
Regular ADA 8,789.19 8,863.01 Extended Year Special Education 9.10 9.10 Special Education - Nonpublic Schools 12.83 12.41 Extended Year Special Education - Nonpublic Schools 2.22 2.22
Total Ninth through Twelfth 8,813.34 8,886.74 TOTAL SCHOOL DISTRICT 25,717.64 25,785.58
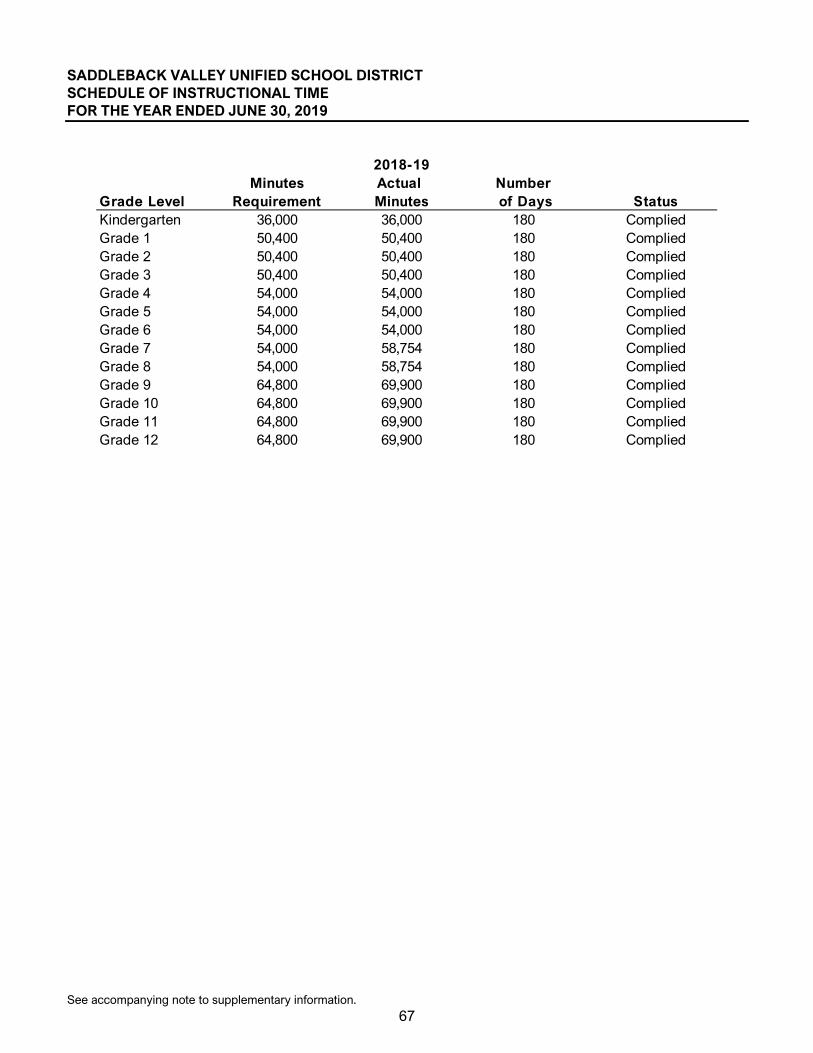
See accompanying note to supplementary information.
67
SADDLEBACK VALLEY UNIFIED SCHOOL DISTRICT SCHEDULE OF INSTRUCTIONAL TIME FOR THE YEAR ENDED JUNE 30, 2019
2018-19Minutes Actual Number
Grade Level Requirement Minutes of Days StatusKindergarten 36,000 36,000 180 CompliedGrade 1 50,400 50,400 180 CompliedGrade 2 50,400 50,400 180 CompliedGrade 3 50,400 50,400 180 CompliedGrade 4 54,000 54,000 180 CompliedGrade 5 54,000 54,000 180 CompliedGrade 6 54,000 54,000 180 CompliedGrade 7 54,000 58,754 180 CompliedGrade 8 54,000 58,754 180 CompliedGrade 9 64,800 69,900 180 CompliedGrade 10 64,800 69,900 180 CompliedGrade 11 64,800 69,900 180 CompliedGrade 12 64,800 69,900 180 Complied
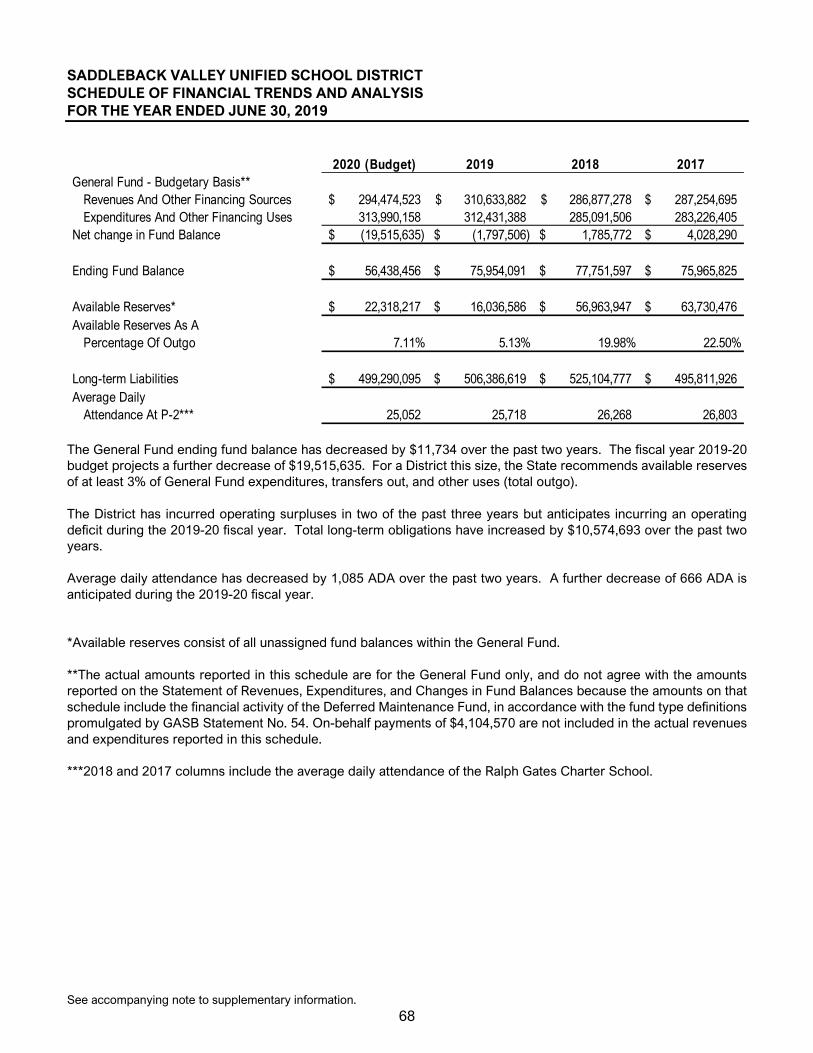
See accompanying note to supplementary information.
68
SADDLEBACK VALLEY UNIFIED SCHOOL DISTRICT SCHEDULE OF FINANCIAL TRENDS AND ANALYSIS FOR THE YEAR ENDED JUNE 30, 2019
2020 (Budget) 2019 2018 2017General Fund - Budgetary Basis**
Revenues And Other Financing Sources 294,474,523$ 310,633,882$ 286,877,278$ 287,254,695$ Expenditures And Other Financing Uses 313,990,158 312,431,388 285,091,506 283,226,405
Net change in Fund Balance (19,515,635)$ (1,797,506)$ 1,785,772$ 4,028,290$
Ending Fund Balance 56,438,456$ 75,954,091$ 77,751,597$ 75,965,825$
Available Reserves* 22,318,217$ 16,036,586$ 56,963,947$ 63,730,476$ Available Reserves As A
Percentage Of Outgo 7.11% 5.13% 19.98% 22.50%
Long-term Liabilities 499,290,095$ 506,386,619$ 525,104,777$ 495,811,926$ Average Daily
Attendance At P-2*** 25,052 25,718 26,268 26,803 The General Fund ending fund balance has decreased by $11,734 over the past two years. The fiscal year 2019-20 budget projects a further decrease of $19,515,635. For a District this size, the State recommends available reserves of at least 3% of General Fund expenditures, transfers out, and other uses (total outgo). The District has incurred operating surpluses in two of the past three years but anticipates incurring an operating deficit during the 2019-20 fiscal year. Total long-term obligations have increased by $10,574,693 over the past two years. Average daily attendance has decreased by 1,085 ADA over the past two years. A further decrease of 666 ADA is anticipated during the 2019-20 fiscal year. *Available reserves consist of all unassigned fund balances within the General Fund. **The actual amounts reported in this schedule are for the General Fund only, and do not agree with the amounts reported on the Statement of Revenues, Expenditures, and Changes in Fund Balances because the amounts on that schedule include the financial activity of the Deferred Maintenance Fund, in accordance with the fund type definitions promulgated by GASB Statement No. 54. On-behalf payments of $4,104,570 are not included in the actual revenues and expenditures reported in this schedule. ***2018 and 2017 columns include the average daily attendance of the Ralph Gates Charter School.

See accompanying note to supplementary information.
69
SADDLEBACK VALLEY UNIFIED SCHOOL DISTRICT RECONCILIATION OF ANNUAL FINANCIAL AND BUDGET REPORT WITH AUDITED FINANCIAL STATEMENTS FOR THE YEAR ENDED JUNE 30, 2019
Self-InsuranceFund15,447,009$
Adjustments and reclassifications:Increase (decrease) in total fund balances:
Adjustment to claims liability for Workers' Compensation 1,349,085 Net adjustments and reclassifications 1,349,085
16,796,094$
June 30, 2019, annual financial and budget report fund balance
June 30, 2019, audited financial statement fund balance
See accompanying note to supplementary information.
70
SADDLEBACK VALLEY UNIFIED SCHOOL DISTRICT SCHEDULE OF CHARTER SCHOOLS FOR THE YEAR ENDED JUNE 30, 2019 The District did not sponsor any charter schools during the year ended June 30, 2019.
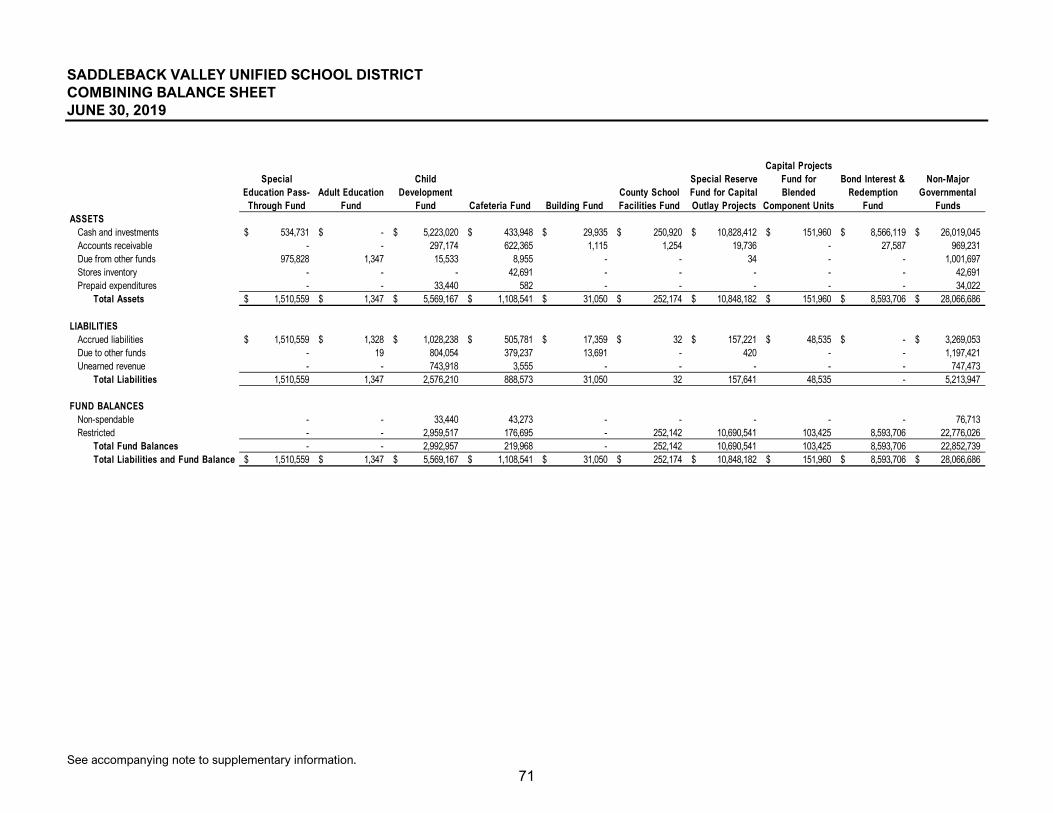
See accompanying note to supplementary information.
71
SADDLEBACK VALLEY UNIFIED SCHOOL DISTRICT COMBINING BALANCE SHEET JUNE 30, 2019
Special Education Pass-
Through FundAdult Education
Fund
Child Development
Fund Cafeteria Fund Building FundCounty School Facilities Fund
Special Reserve Fund for Capital Outlay Projects
Capital Projects Fund for Blended
Component Units
Bond Interest & Redemption
Fund
Non-Major Governmental
FundsASSETS
Cash and investments 534,731$ -$ 5,223,020$ 433,948$ 29,935$ 250,920$ 10,828,412$ 151,960$ 8,566,119$ 26,019,045$ Accounts receivable - - 297,174 622,365 1,115 1,254 19,736 - 27,587 969,231 Due from other funds 975,828 1,347 15,533 8,955 - - 34 - - 1,001,697 Stores inventory - - - 42,691 - - - - - 42,691 Prepaid expenditures - - 33,440 582 - - - - - 34,022
Total Assets 1,510,559$ 1,347$ 5,569,167$ 1,108,541$ 31,050$ 252,174$ 10,848,182$ 151,960$ 8,593,706$ 28,066,686$
LIABILITIESAccrued liabilities 1,510,559$ 1,328$ 1,028,238$ 505,781$ 17,359$ 32$ 157,221$ 48,535$ -$ 3,269,053$ Due to other funds - 19 804,054 379,237 13,691 - 420 - - 1,197,421 Unearned revenue - - 743,918 3,555 - - - - - 747,473
Total Liabilities 1,510,559 1,347 2,576,210 888,573 31,050 32 157,641 48,535 - 5,213,947
FUND BALANCESNon-spendable - - 33,440 43,273 - - - - - 76,713 Restricted - - 2,959,517 176,695 - 252,142 10,690,541 103,425 8,593,706 22,776,026
Total Fund Balances - - 2,992,957 219,968 - 252,142 10,690,541 103,425 8,593,706 22,852,739 Total Liabilities and Fund Balance 1,510,559$ 1,347$ 5,569,167$ 1,108,541$ 31,050$ 252,174$ 10,848,182$ 151,960$ 8,593,706$ 28,066,686$
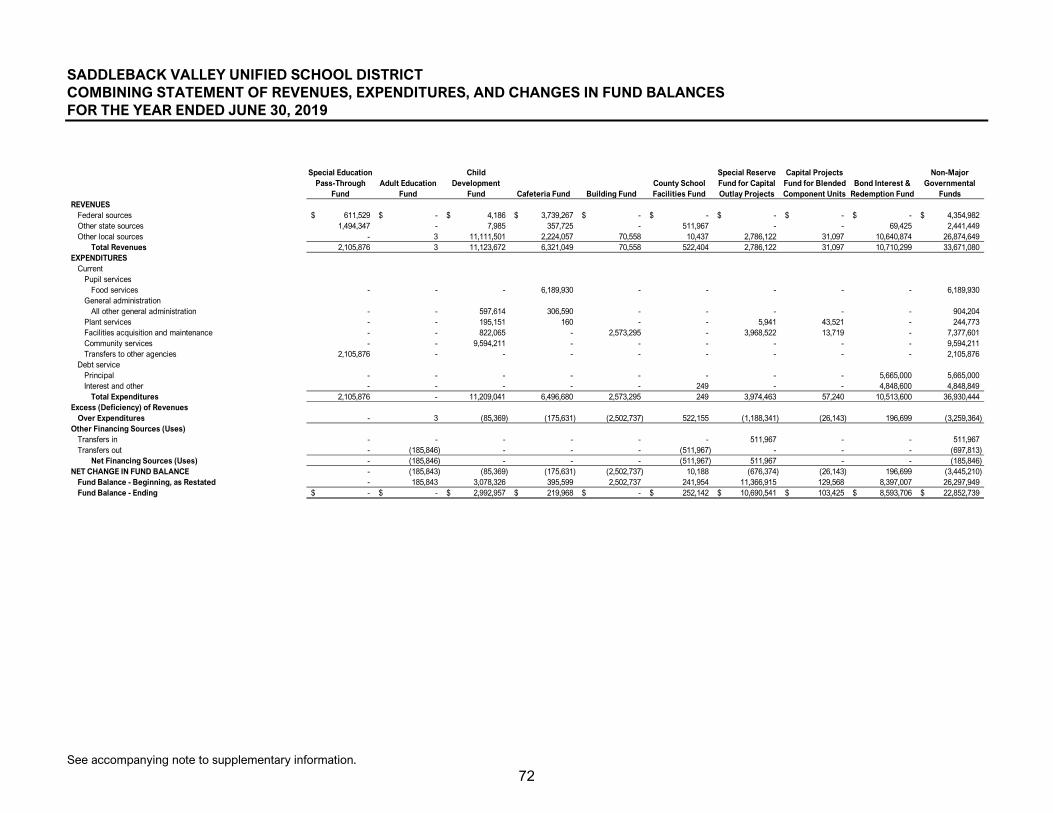
See accompanying note to supplementary information.
72
SADDLEBACK VALLEY UNIFIED SCHOOL DISTRICT COMBINING STATEMENT OF REVENUES, EXPENDITURES, AND CHANGES IN FUND BALANCES FOR THE YEAR ENDED JUNE 30, 2019
Special Education Pass-Through
FundAdult Education
Fund
Child Development
Fund Cafeteria Fund Building FundCounty School Facilities Fund
Special Reserve Fund for Capital Outlay Projects
Capital Projects Fund for Blended Component Units
Bond Interest & Redemption Fund
Non-Major Governmental
FundsREVENUES
Federal sources 611,529$ -$ 4,186$ 3,739,267$ -$ -$ -$ -$ -$ 4,354,982$ Other state sources 1,494,347 - 7,985 357,725 - 511,967 - - 69,425 2,441,449 Other local sources - 3 11,111,501 2,224,057 70,558 10,437 2,786,122 31,097 10,640,874 26,874,649
Total Revenues 2,105,876 3 11,123,672 6,321,049 70,558 522,404 2,786,122 31,097 10,710,299 33,671,080 EXPENDITURES
CurrentPupil services
Food services - - - 6,189,930 - - - - - 6,189,930 General administration
All other general administration - - 597,614 306,590 - - - - - 904,204 Plant services - - 195,151 160 - - 5,941 43,521 - 244,773 Facilities acquisition and maintenance - - 822,065 - 2,573,295 - 3,968,522 13,719 - 7,377,601 Community services - - 9,594,211 - - - - - - 9,594,211 Transfers to other agencies 2,105,876 - - - - - - - - 2,105,876
Debt servicePrincipal - - - - - - - - 5,665,000 5,665,000 Interest and other - - - - - 249 - - 4,848,600 4,848,849
Total Expenditures 2,105,876 - 11,209,041 6,496,680 2,573,295 249 3,974,463 57,240 10,513,600 36,930,444 Excess (Deficiency) of Revenues
Over Expenditures - 3 (85,369) (175,631) (2,502,737) 522,155 (1,188,341) (26,143) 196,699 (3,259,364) Other Financing Sources (Uses)
Transfers in - - - - - - 511,967 - - 511,967 Transfers out - (185,846) - - - (511,967) - - - (697,813)
Net Financing Sources (Uses) - (185,846) - - - (511,967) 511,967 - - (185,846) NET CHANGE IN FUND BALANCE - (185,843) (85,369) (175,631) (2,502,737) 10,188 (676,374) (26,143) 196,699 (3,445,210)
Fund Balance - Beginning, as Restated - 185,843 3,078,326 395,599 2,502,737 241,954 11,366,915 129,568 8,397,007 26,297,949 Fund Balance - Ending -$ -$ 2,992,957$ 219,968$ -$ 252,142$ 10,690,541$ 103,425$ 8,593,706$ 22,852,739$
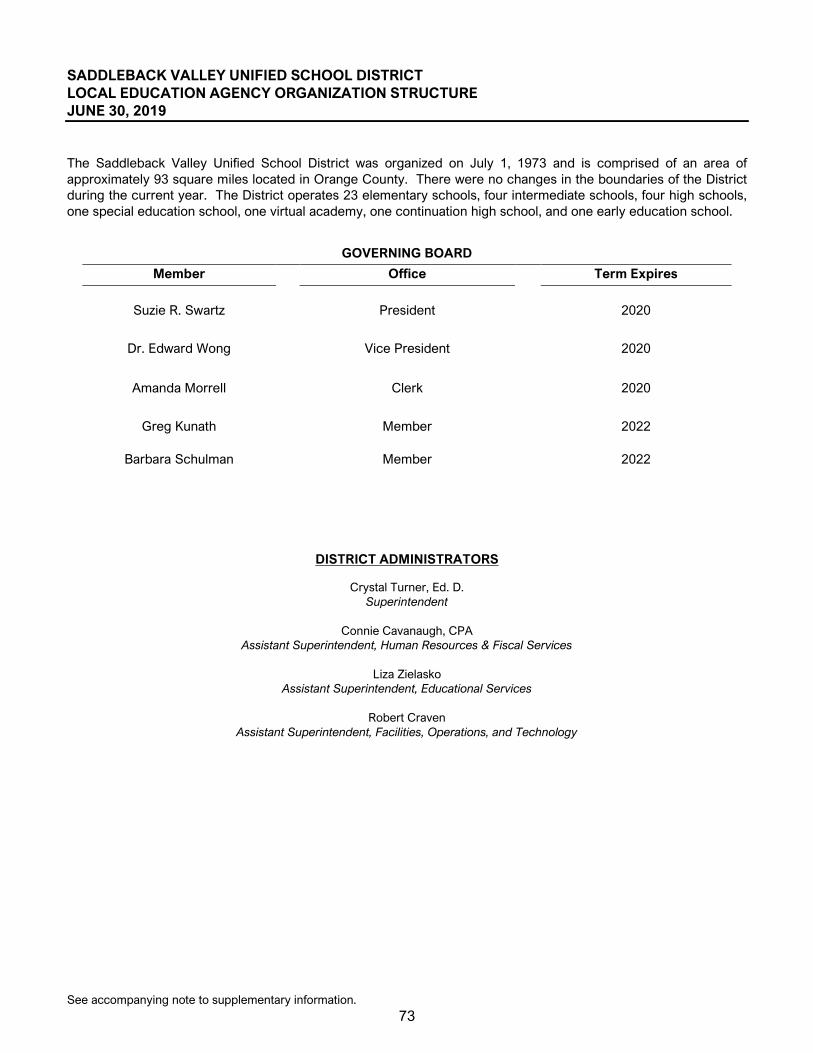
See accompanying note to supplementary information.
73
SADDLEBACK VALLEY UNIFIED SCHOOL DISTRICT LOCAL EDUCATION AGENCY ORGANIZATION STRUCTURE JUNE 30, 2019 The Saddleback Valley Unified School District was organized on July 1, 1973 and is comprised of an area of approximately 93 square miles located in Orange County. There were no changes in the boundaries of the District during the current year. The District operates 23 elementary schools, four intermediate schools, four high schools, one special education school, one virtual academy, one continuation high school, and one early education school.
GOVERNING BOARD
Member Office Term Expires
Suzie R. Swartz President 2020
Dr. Edward Wong Vice President 2020
Amanda Morrell Clerk 2020
Greg Kunath Member 2022
Barbara Schulman Member 2022
DISTRICT ADMINISTRATORS
Crystal Turner, Ed. D. Superintendent
Connie Cavanaugh, CPA
Assistant Superintendent, Human Resources & Fiscal Services
Liza Zielasko Assistant Superintendent, Educational Services
Robert Craven
Assistant Superintendent, Facilities, Operations, and Technology
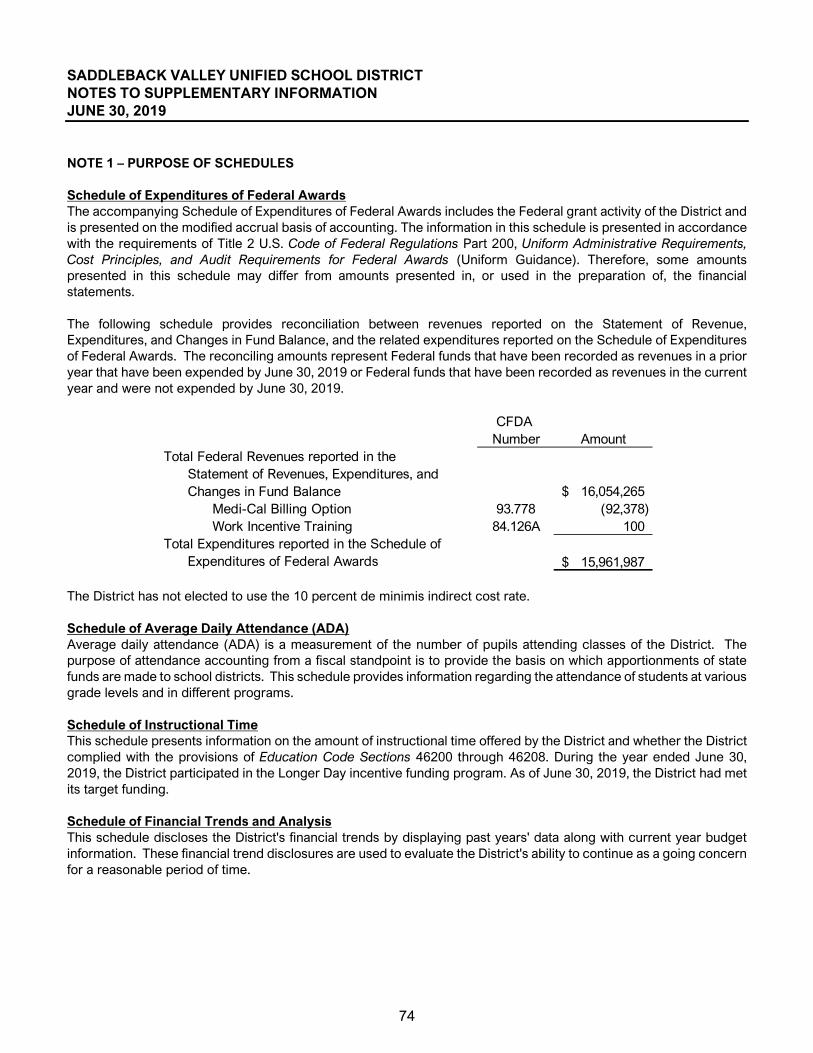
74
SADDLEBACK VALLEY UNIFIED SCHOOL DISTRICT NOTES TO SUPPLEMENTARY INFORMATION JUNE 30, 2019 NOTE 1 – PURPOSE OF SCHEDULES Schedule of Expenditures of Federal Awards The accompanying Schedule of Expenditures of Federal Awards includes the Federal grant activity of the District and is presented on the modified accrual basis of accounting. The information in this schedule is presented in accordance with the requirements of Title 2 U.S. Code of Federal Regulations Part 200, Uniform Administrative Requirements, Cost Principles, and Audit Requirements for Federal Awards (Uniform Guidance). Therefore, some amounts presented in this schedule may differ from amounts presented in, or used in the preparation of, the financial statements. The following schedule provides reconciliation between revenues reported on the Statement of Revenue, Expenditures, and Changes in Fund Balance, and the related expenditures reported on the Schedule of Expenditures of Federal Awards. The reconciling amounts represent Federal funds that have been recorded as revenues in a prior year that have been expended by June 30, 2019 or Federal funds that have been recorded as revenues in the current year and were not expended by June 30, 2019.
The District has not elected to use the 10 percent de minimis indirect cost rate. Schedule of Average Daily Attendance (ADA) Average daily attendance (ADA) is a measurement of the number of pupils attending classes of the District. The purpose of attendance accounting from a fiscal standpoint is to provide the basis on which apportionments of state funds are made to school districts. This schedule provides information regarding the attendance of students at various grade levels and in different programs. Schedule of Instructional Time This schedule presents information on the amount of instructional time offered by the District and whether the District complied with the provisions of Education Code Sections 46200 through 46208. During the year ended June 30, 2019, the District participated in the Longer Day incentive funding program. As of June 30, 2019, the District had met its target funding. Schedule of Financial Trends and Analysis This schedule discloses the District's financial trends by displaying past years' data along with current year budget information. These financial trend disclosures are used to evaluate the District's ability to continue as a going concern for a reasonable period of time.
CFDA Number Amount
Total Federal Revenues reported in theStatement of Revenues, Expenditures, andChanges in Fund Balance 16,054,265$
Medi-Cal Billing Option 93.778 (92,378) Work Incentive Training 84.126A 100
Total Expenditures reported in the Schedule of Expenditures of Federal Awards 15,961,987$
75
SADDLEBACK VALLEY UNIFIED SCHOOL DISTRICT NOTES TO SUPPLEMENTARY INFORMATION, continued JUNE 30, 2019 NOTE 1 – PURPOSE OF SCHEDULES (continued) Reconciliation of Annual Financial and Budget Report with Audited Financial Statements This schedule provides the information necessary to reconcile the fund balance of all funds reported on the Annual Financial and Budget Report Unaudited Actuals to the audited financial statements. Schedule of Charter Schools This schedule lists all charter schools chartered by the District and displays information for each charter school on whether or not the charter school is included in the District audit. Combining Statements – Non-Major Funds These statements provide information on the District’s non‐major funds. Local Education Agency Organization Structure This schedule provides information about the District's boundaries and schools operated, members of the governing board, and members of the administration.

OTHER INDEPENDENT AUDITORS’ REPORTS

O: 619-270-8222 F: 619-260-9085christywhite.com
348 Olive StreetSan Diego, CA 92103
Certified Public Accountants serving K-12 School Districts and Charter Schools throughout California
76
REPORT ON INTERNAL CONTROL OVER FINANCIAL REPORTING AND ON COMPLIANCE AND OTHER MATTERS BASED ON AN AUDIT OF FINANCIAL STATEMENTS PERFORMED IN ACCORDANCE WITH
GOVERNMENT AUDITING STANDARDS
Independent Auditors’ Report Governing Board Saddleback Valley Unified School District Mission Viejo, California We have audited, in accordance with the auditing standards generally accepted in the United States of America and the standards applicable to financial audits contained in Government Auditing Standards issued by the Comptroller General of the United States, the financial statements of the governmental activities, the business-type activities, each major fund, and the aggregate remaining fund information of Saddleback Valley Unified School District, as of and for the year ended June 30, 2019, and the related notes to the financial statements, which collectively comprise the Saddleback Valley Unified School District’s basic financial statements, and have issued our report thereon dated December 20, 2019. Internal Control over Financial Reporting In planning and performing our audit of the financial statements, we considered Saddleback Valley Unified School District’s internal control over financial reporting (internal control) to determine the audit procedures that are appropriate in the circumstances for the purpose of expressing our opinions on the financial statements, but not for the purpose of expressing an opinion on the effectiveness of Saddleback Valley Unified School District’s internal control. Accordingly, we do not express an opinion on the effectiveness of Saddleback Valley Unified School District’s internal control.
A deficiency in internal control exists when the design or operation of a control does not allow management or employees, in the normal course of performing their assigned functions, to prevent, or detect and correct, misstatements on a timely basis. A material weakness is a deficiency, or a combination of deficiencies, in internal control, such that there is a reasonable possibility that a material misstatement of the entity's financial statements will not be prevented, or detected and corrected on a timely basis. A significant deficiency is a deficiency, or a combination of deficiencies, in internal control that is less severe than a material weakness, yet important enough to merit attention by those charged with governance.
Our consideration of internal control was for the limited purpose described in the first paragraph of this section and was not designed to identify all deficiencies in internal control that might be material weaknesses or significant deficiencies. Given these limitations, during our audit we did not identify any deficiencies in internal control that we consider to be material weaknesses. However, material weaknesses may exist that have not been identified. We did identify certain deficiencies in internal control, described in the accompanying Schedule of Audit Findings and Questioned Costs that we consider to be significant deficiencies. (Finding #2019-001)
77
Compliance and Other Matters As part of obtaining reasonable assurance about whether Saddleback Valley Unified School District's financial statements are free from material misstatement, we performed tests of its compliance with certain provisions of laws, regulations, contracts, and grant agreements, noncompliance with which could have a direct and material effect on the determination of financial statement amounts. However, providing an opinion on compliance with those provisions was not an objective of our audit, and accordingly, we do not express such an opinion. The results of our tests disclosed no instances of noncompliance or other matters that are required to be reported under Government Auditing Standards. Saddleback Valley Unified School District’s Response to Findings Saddleback Valley Unified School District’s response to the findings identified in our audit are described in the accompanying schedule of findings and questioned costs. Saddleback Valley Unified School District’s response was not subjected to the auditing procedures applied in the audit of the financial statements and, accordingly, we express no opinion on it. Purpose of this Report The purpose of this report is solely to describe the scope of our testing of internal control and compliance and the results of that testing, and not to provide an opinion on the effectiveness of the entity's internal control or on compliance. This report is an integral part of an audit performed in accordance with Government Auditing Standards in considering the entity's internal control and compliance. Accordingly, this communication is not suitable for any other purpose. San Diego, California December 20, 2019
O: 619-270-8222 F: 619-260-9085christywhite.com
348 Olive StreetSan Diego, CA 92103
Certified Public Accountants serving K-12 School Districts and Charter Schools throughout California
78
REPORT ON COMPLIANCE FOR EACH MAJOR FEDERAL PROGRAM; AND REPORT ON INTERNAL CONTROL OVER COMPLIANCE REQUIRED BY THE UNIFORM GUIDANCE
Independent Auditors’ Report
Governing Board Saddleback Valley Unified School District Mission Viejo, California Report on Compliance for Each Major Federal Program We have audited Saddleback Valley Unified School District’s compliance with the types of compliance requirements described in the OMB Compliance Supplement that could have a direct and material effect on each of Saddleback Valley Unified School District’s major federal programs for the year ended June 30, 2019. Saddleback Valley Unified School District's major federal programs are identified in the summary of auditor's results section of the accompanying schedule of findings and questioned costs. Management’s Responsibility Management is responsible for compliance with federal statutes, regulations, and the terms and conditions of its federal awards applicable to its federal programs. Auditor’s Responsibility Our responsibility is to express an opinion on compliance for each of Saddleback Valley Unified School District's major federal programs based on our audit of the types of compliance requirements referred to above. We conducted our audit of compliance in accordance with auditing standards generally accepted in the United States of America; the standards applicable to financial audits contained in Government Auditing Standards, issued by the Comptroller General of the United States; and the audit requirements of Title 2 U.S. Code of Federal Regulations Part 200, Uniform Administrative Requirements, Cost Principles, and Audit Requirements for Federal Awards (Uniform Guidance). Those standards and the Uniform Guidance require that we plan and perform the audit to obtain reasonable assurance about whether noncompliance with the types of compliance requirements referred to above that could have a direct and material effect on a major federal program occurred. An audit includes examining, on a test basis, evidence about Saddleback Valley Unified School District's compliance with those requirements and performing such other procedures as we considered necessary in the circumstances. We believe that our audit provides a reasonable basis for our opinion on compliance for each major federal program. However, our audit does not provide a legal determination of Saddleback Valley Unified School District's compliance. Opinion on Each Major Federal Program In our opinion, Saddleback Valley Unified School District complied, in all material respects, with the types of compliance requirements referred to above that could have a direct and material effect on each of its major federal programs for the year ended June 30, 2019.
79
Report on Internal Control Over Compliance Management of Saddleback Valley Unified School District is responsible for establishing and maintaining effective internal control over compliance with the types of compliance requirements referred to above. In planning and performing our audit of compliance, we considered Saddleback Valley Unified School District’s internal control over compliance with the types of requirements that could have a direct and material effect on each major federal program to determine the auditing procedures that are appropriate in the circumstances for the purpose of expressing an opinion on compliance for each major federal program and to test and report on internal control over compliance in accordance with the Uniform Guidance, but not for the purpose of expressing an opinion on the effectiveness of internal control over compliance. Accordingly, we do not express an opinion on the effectiveness of Saddleback Valley Unified School District’s internal control over compliance. A deficiency in internal control over compliance exists when the design or operation of a control over compliance does not allow management or employees, in the normal course of performing their assigned functions, to prevent, or detect and correct, noncompliance with a type of compliance requirement of a federal program on a timely basis. A material weakness in internal control over compliance is a deficiency, or combination of deficiencies, in internal control over compliance, such that there is a reasonable possibility that material noncompliance with a type of compliance requirement of a federal program will not be prevented, or detected and corrected, on a timely basis. A significant deficiency in internal control over compliance is a deficiency, or a combination of deficiencies, in internal control over compliance with a type of compliance requirement of a federal program that is less severe than a material weakness in internal control over compliance, yet important enough to merit attention by those charged with governance. Our consideration of internal control over compliance was for the limited purpose described in the first paragraph of this section and was not designed to identify all deficiencies in internal control over compliance that might be material weaknesses or significant deficiencies. We did not identify any deficiencies in internal control over compliance that we consider to be material weaknesses. However, material weaknesses may exist that have not been identified. The purpose of this report on internal control over compliance is solely to describe the scope of our testing of internal control over compliance and the results of that testing based on the requirements of the Uniform Guidance. Accordingly, this report is not suitable for any other purpose. San Diego, California December 20, 2019
O: 619-270-8222 F: 619-260-9085christywhite.com
348 Olive StreetSan Diego, CA 92103
Certified Public Accountants serving K-12 School Districts and Charter Schools throughout California
80
REPORT ON STATE COMPLIANCE
Independent Auditors’ Report
Governing Board Saddleback Valley Unified School District Mission Viejo, California Report on State Compliance We have audited Saddleback Valley Unified School District’s compliance with the types of compliance requirements described in the 2018-2019 Guide for Annual Audits of K-12 Local Education Agencies and State Compliance Reporting, prescribed in Title 5, California Code of Regulations, section 19810, that could have a direct and material effect on each of Saddleback Valley Unified School District’s state programs for the fiscal year ended June 30, 2019, as identified below. Management’s Responsibility Management is responsible for compliance with the requirements of laws, regulations, contracts, and grants applicable to its state programs. Auditor’s Responsibility Our responsibility is to express an opinion on compliance for each of Saddleback Valley Unified School District's state programs based on our audit of the types of compliance requirements referred to above. We conducted our audit of compliance in accordance with auditing standards generally accepted in the United States of America; the standards applicable to financial audits contained in Government Auditing Standards, issued by the Comptroller General of the United States; and the 2018-2019 Guide for Annual Audits of K-12 Local Education Agencies and State Compliance Reporting, prescribed in Title 5, California Code of Regulations, section 19810. Those standards require that we plan and perform the audit to obtain reasonable assurance about whether noncompliance with the types of compliance requirements referred to above that could have a direct and material effect on the state programs noted below occurred. An audit includes examining, on a test basis, evidence about Saddleback Valley Unified School District's compliance with those requirements and performing such other procedures as we considered necessary in the circumstances. We believe that our audit provides a reasonable basis for our opinion on compliance with the requirements referred to above. However, our audit does not provide a legal determination of Saddleback Valley Unified School District's compliance with those requirements. Opinion on State Compliance In our opinion, Saddleback Valley Unified School District complied, in all material respects, with the types of compliance requirements referred to above that are applicable to the state programs noted in the table below for the year ended June 30, 2019.
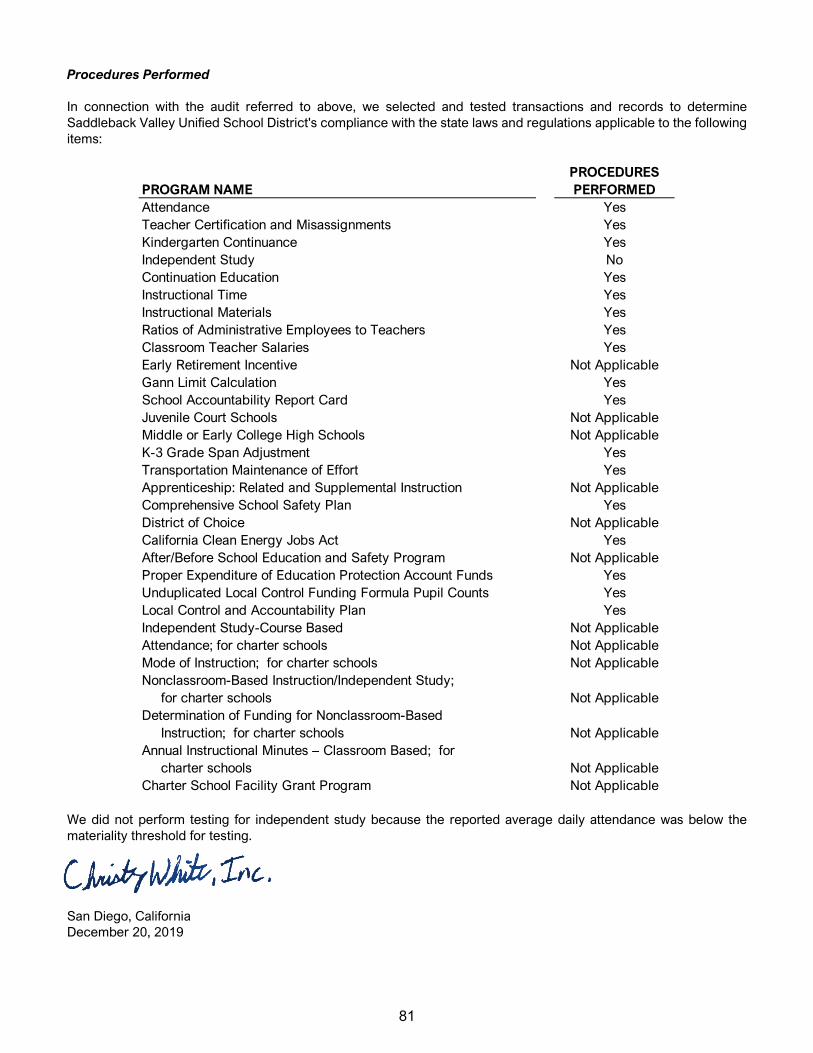
81
Procedures Performed In connection with the audit referred to above, we selected and tested transactions and records to determine Saddleback Valley Unified School District's compliance with the state laws and regulations applicable to the following items:
We did not perform testing for independent study because the reported average daily attendance was below the materiality threshold for testing. San Diego, California December 20, 2019
PROGRAM NAMEPROCEDURES PERFORMED
Attendance YesTeacher Certification and Misassignments YesKindergarten Continuance YesIndependent Study NoContinuation Education YesInstructional Time YesInstructional Materials YesRatios of Administrative Employees to Teachers YesClassroom Teacher Salaries YesEarly Retirement Incentive Not ApplicableGann Limit Calculation YesSchool Accountability Report Card YesJuvenile Court Schools Not ApplicableMiddle or Early College High Schools Not ApplicableK-3 Grade Span Adjustment YesTransportation Maintenance of Effort YesApprenticeship: Related and Supplemental Instruction Not ApplicableComprehensive School Safety Plan YesDistrict of Choice Not ApplicableCalifornia Clean Energy Jobs Act YesAfter/Before School Education and Safety Program Not ApplicableProper Expenditure of Education Protection Account Funds YesUnduplicated Local Control Funding Formula Pupil Counts YesLocal Control and Accountability Plan YesIndependent Study-Course Based Not ApplicableAttendance; for charter schools Not ApplicableMode of Instruction; for charter schools Not ApplicableNonclassroom-Based Instruction/Independent Study;
for charter schools Not ApplicableDetermination of Funding for Nonclassroom-Based
Instruction; for charter schools Not ApplicableAnnual Instructional Minutes – Classroom Based; for
charter schools Not ApplicableCharter School Facility Grant Program Not Applicable
SCHEDULE OF FINDINGS AND QUESTIONED COSTS
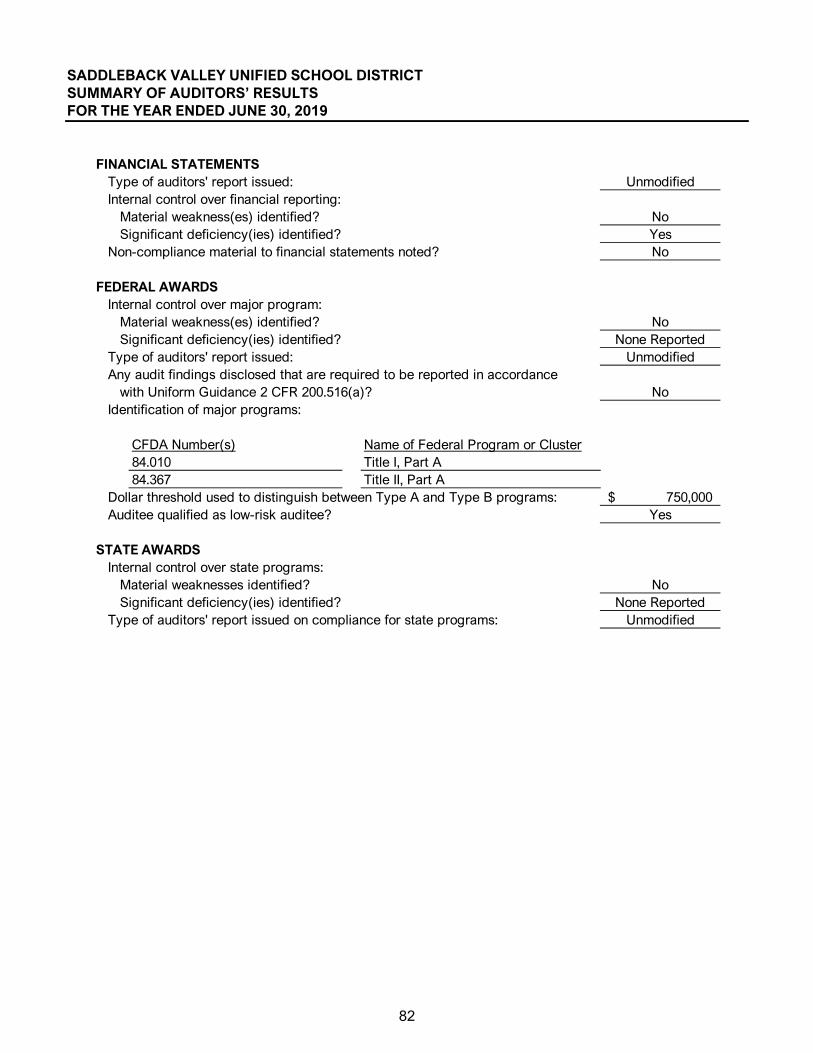
82
SADDLEBACK VALLEY UNIFIED SCHOOL DISTRICT SUMMARY OF AUDITORS’ RESULTS FOR THE YEAR ENDED JUNE 30, 2019
FINANCIAL STATEMENTSType of auditors' report issued: UnmodifiedInternal control over financial reporting:
Material weakness(es) identified? NoSignificant deficiency(ies) identified? Yes
Non-compliance material to financial statements noted? No
FEDERAL AWARDSInternal control over major program:
Material weakness(es) identified? NoSignificant deficiency(ies) identified? None Reported
Type of auditors' report issued: UnmodifiedAny audit findings disclosed that are required to be reported in accordance
with Uniform Guidance 2 CFR 200.516(a)? NoIdentification of major programs:
CFDA Number(s) Name of Federal Program or Cluster84.010 Title I, Part A84.367 Title II, Part A
Dollar threshold used to distinguish between Type A and Type B programs: 750,000$ Auditee qualified as low-risk auditee? Yes
STATE AWARDSInternal control over state programs:
Material weaknesses identified? NoSignificant deficiency(ies) identified? None Reported
Type of auditors' report issued on compliance for state programs: Unmodified
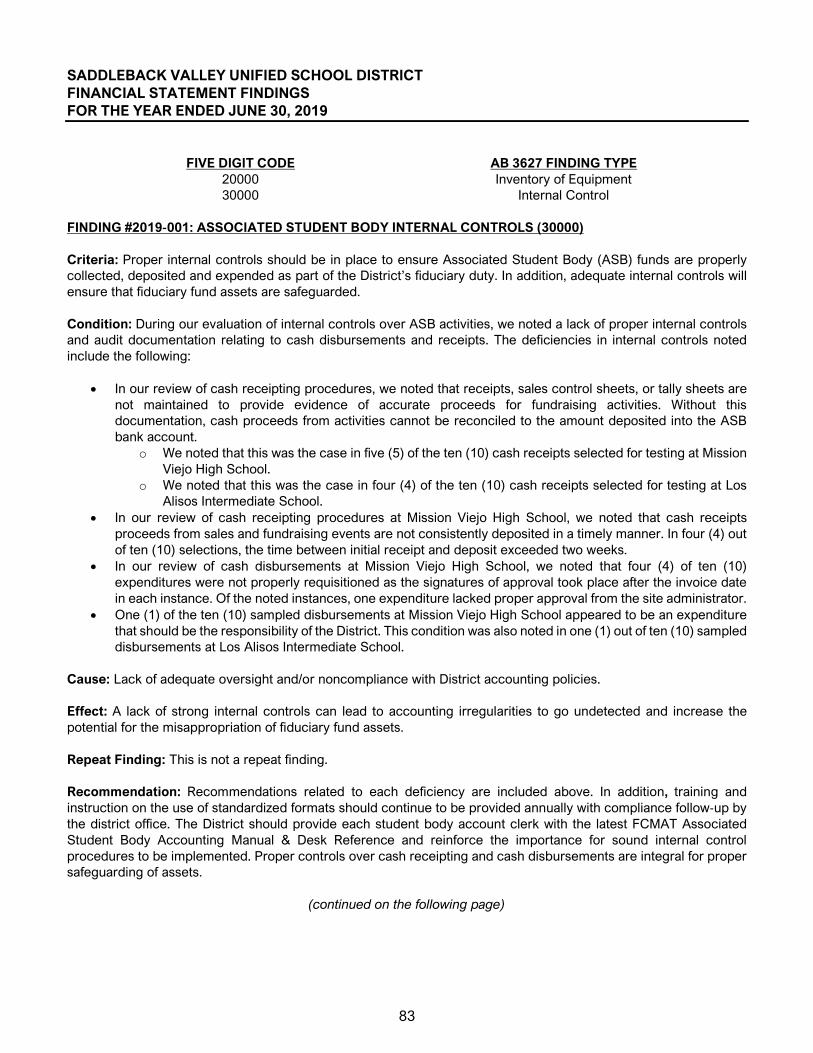
83
SADDLEBACK VALLEY UNIFIED SCHOOL DISTRICT FINANCIAL STATEMENT FINDINGS FOR THE YEAR ENDED JUNE 30, 2019
FIVE DIGIT CODE AB 3627 FINDING TYPE 20000 30000
Inventory of Equipment Internal Control
FINDING #2019‐001: ASSOCIATED STUDENT BODY INTERNAL CONTROLS (30000) Criteria: Proper internal controls should be in place to ensure Associated Student Body (ASB) funds are properly collected, deposited and expended as part of the District’s fiduciary duty. In addition, adequate internal controls will ensure that fiduciary fund assets are safeguarded. Condition: During our evaluation of internal controls over ASB activities, we noted a lack of proper internal controls and audit documentation relating to cash disbursements and receipts. The deficiencies in internal controls noted include the following:
• In our review of cash receipting procedures, we noted that receipts, sales control sheets, or tally sheets are not maintained to provide evidence of accurate proceeds for fundraising activities. Without this documentation, cash proceeds from activities cannot be reconciled to the amount deposited into the ASB bank account.
o We noted that this was the case in five (5) of the ten (10) cash receipts selected for testing at Mission Viejo High School.
o We noted that this was the case in four (4) of the ten (10) cash receipts selected for testing at Los Alisos Intermediate School.
• In our review of cash receipting procedures at Mission Viejo High School, we noted that cash receipts proceeds from sales and fundraising events are not consistently deposited in a timely manner. In four (4) out of ten (10) selections, the time between initial receipt and deposit exceeded two weeks.
• In our review of cash disbursements at Mission Viejo High School, we noted that four (4) of ten (10) expenditures were not properly requisitioned as the signatures of approval took place after the invoice date in each instance. Of the noted instances, one expenditure lacked proper approval from the site administrator.
• One (1) of the ten (10) sampled disbursements at Mission Viejo High School appeared to be an expenditure that should be the responsibility of the District. This condition was also noted in one (1) out of ten (10) sampled disbursements at Los Alisos Intermediate School.
Cause: Lack of adequate oversight and/or noncompliance with District accounting policies. Effect: A lack of strong internal controls can lead to accounting irregularities to go undetected and increase the potential for the misappropriation of fiduciary fund assets. Repeat Finding: This is not a repeat finding. Recommendation: Recommendations related to each deficiency are included above. In addition, training and instruction on the use of standardized formats should continue to be provided annually with compliance follow‐up by the district office. The District should provide each student body account clerk with the latest FCMAT Associated Student Body Accounting Manual & Desk Reference and reinforce the importance for sound internal control procedures to be implemented. Proper controls over cash receipting and cash disbursements are integral for proper safeguarding of assets.
(continued on the following page)
84
SADDLEBACK VALLEY UNIFIED SCHOOL DISTRICT FINANCIAL STATEMENT FINDINGS, continued FOR THE YEAR ENDED JUNE 30, 2019 FINDING #2019‐001: ASSOCIATED STUDENT BODY INTERNAL CONTROLS (30000) (continued) Corrective Action Plan: District Office staff met with Mission Viejo High School and Los Alisos Intermediate School to review proper cash handling procedures emphasizing the need for strong internal controls. All Saddleback Valley Unified School District schools are issued the Fiscal Crisis & Management Assistance Team Associated Student Body Accounting Manual. Both Mission Viejo High School and Los Alisos Intermediate School were reminded to use this manual as a guideline to ensure proper accounting practices. Both sites have implemented additional procedures to ensure proper recording of cash receipts and timely deposits. Mission Viejo High School will utilize the student store online options as their primary method of cash receipts. Los Alisos Intermediate has implemented a log for all deposits and a cash receipt form for reconciliation. Fiscal Services staff has counseled both sites on the importance of pre-approval of expenditures. The sites will be utilizing the purchase requisition/order process in ASBWorks as a mechanism to ensure prior approval is sought. Fiscal Services in conjunction with our external auditor, Christy White Associates will provide an Associated Student Body fiscal training in January 2020.

85
SADDLEBACK VALLEY UNIFIED SCHOOL DISTRICT FEDERAL AWARD FINDINGS AND QUESTIONED COSTS FOR THE YEAR ENDED JUNE 30, 2019
FIVE DIGIT CODE AB 3627 FINDING TYPE 50000
Federal Compliance
There were no findings or questioned costs related to federal awards for the year ended June 30, 2019.

86
SADDLEBACK VALLEY UNIFIED SCHOOL DISTRICT STATE AWARD FINDINGS AND QUESTIONED COSTS FOR THE YEAR ENDED JUNE 30, 2019
FIVE DIGIT CODE AB 3627 FINDING TYPE 10000 Attendance 40000 42000 43000 60000
State Compliance Charter School Facilities Programs
Apprenticeship: Related and Supplemental Instruction Miscellaneous
61000 Classroom Teacher Salaries 62000 Local Control Accountability Plan 70000 Instructional Materials 71000 Teacher Misassignments 72000 School Accountability Report Card
There were no findings or questioned costs related to state awards for the year ended June 30, 2019.
87
SADDLEBACK VALLEY UNIFIED SCHOOL DISTRICT SUMMARY SCHEDULE OF PRIOR AUDIT FINDINGS FOR THE YEAR ENDED JUNE 30, 2019 There were no findings or questioned costs for the year ended June 30, 2018.
O: 619-270-8222 F: 619-260-9085christywhite.com
348 Olive StreetSan Diego, CA 92103
Certified Public Accountants serving K-12 School Districts and Charter Schools throughout California
88
MANAGEMENT LETTER
Governing Board Saddleback Valley Unified School District Mission Viejo, California In planning and performing our audit of the basic financial statements of Saddleback Valley Unified School District for the year ended June 30, 2019, we considered its internal control structure in order to determine our auditing procedures for the purpose of expressing our opinion on the basic financial statements and not to provide assurance on the internal control structure. However, during our audit we noted matters that are an opportunity for strengthening internal controls and operating efficiency. The following items represent conditions noted by our audit that we consider important enough to bring to your attention. This letter does not affect our report dated December 20, 2019, on the financial statements of Saddleback Valley Unified School District.
1. Capital Assets Reporting Observation: Based on procedures performed over capital assets reporting, it does not appear that the District has adequate procedures in place to ensure timely and reliable reporting of capital assets, related accumulated depreciation, and construction in progress in progress balances.
Recommendation: In order ensure that the balances outlined above are reported in a timely and accurate manner, we recommend redesigning and implementing improved procedures to ensure that current year additions, disposals, depreciation, and construction in progress activity are accurately summarized and reported during the year-end closing process. These procedures should include timely supervision and review of reporting documents.
2. Cash Receipts Collections – EduCafe
Observation: Based on inquiries made during our internal control evaluation of the EduCafe, we noted that it is not standard procedure for receipts to be provided to customers for all transactions.
Recommendation: In order ensure that all sales are properly recorded in the point-of-sale system, receipts should be provided to customers for all transactions.
3. Cash Receipts Collections – Food Services
Observation: Based on inquiries made during our internal control evaluation of the food services department, we noted that cash count forms are not typically signed by the preparer or reviewer.
Recommendation: In order to maintain proper controls over food services sales proceeds, cash count forms should be dual counted, signed, and dated by the preparer and reviewer.
(continued on the following page)

89
MANAGEMENT LETTER (continued) 4. Cash Disbursements – Requisition and Purchase Order Approvals
Observation: Based on inquiries made during our internal control evaluation, it was noted that the District’s purchase order policy is not always adhered to. In some instances, the purchase order process is circumvented through requisitioners directly contacting an approved vendor, purchasing items from the vendor, and then obtaining approval after the purchase is made.
Recommendation: While instances typically involve smaller purchases and our testing indicated no exceptions of this nature, we recommend reinforcing the importance of purchase orders in encumbrance accounting to all requisitioners.
5. Controls Over Health Benefit Recipients
Observation: Based on inquiries made during our internal control evaluation with human resources and payroll staff members, terminated employees are not reconciled to health benefits participant listings due to staffing turnover. As a result, there is risk that inactive employees could be receiving health benefits.
Recommendation: In order maintain strong controls over health benefit recipients, the District should implement control procedures to periodically reconcile terminated employee listings to health benefits active participant listings.
We will review the status of the comment above during our next audit engagement. San Diego, California December 20, 2019