sacramento petroleum association - cngparoland j. bain, consulting petroleum geologist highlights of...
TRANSCRIPT
REVIEW AND HIGHLIGHTS
OF NATURAL GAS
DRILLING ACTIVITIES
IN
NORTHERN CALIFORNIA’S
SACRAMENTO VALLEY
DURING
2011
Presented by Roland J. Bain, Consulting Petroleum Geologist
To the
SACRAMENTO PETROLEUM ASSOCIATION
March 21, 2012
Data Compiled and Organized by Mike Cummings, DOGGR, and Roland J. Bain
ROLAND J. BAIN, consulting petroleum geologist
HIGHLIGHTS OF NATURAL GAS DRILLING ACTIVITIES IN NORTHERN CALIFORNIA’S
SACRAMENTO VALLEY
2011
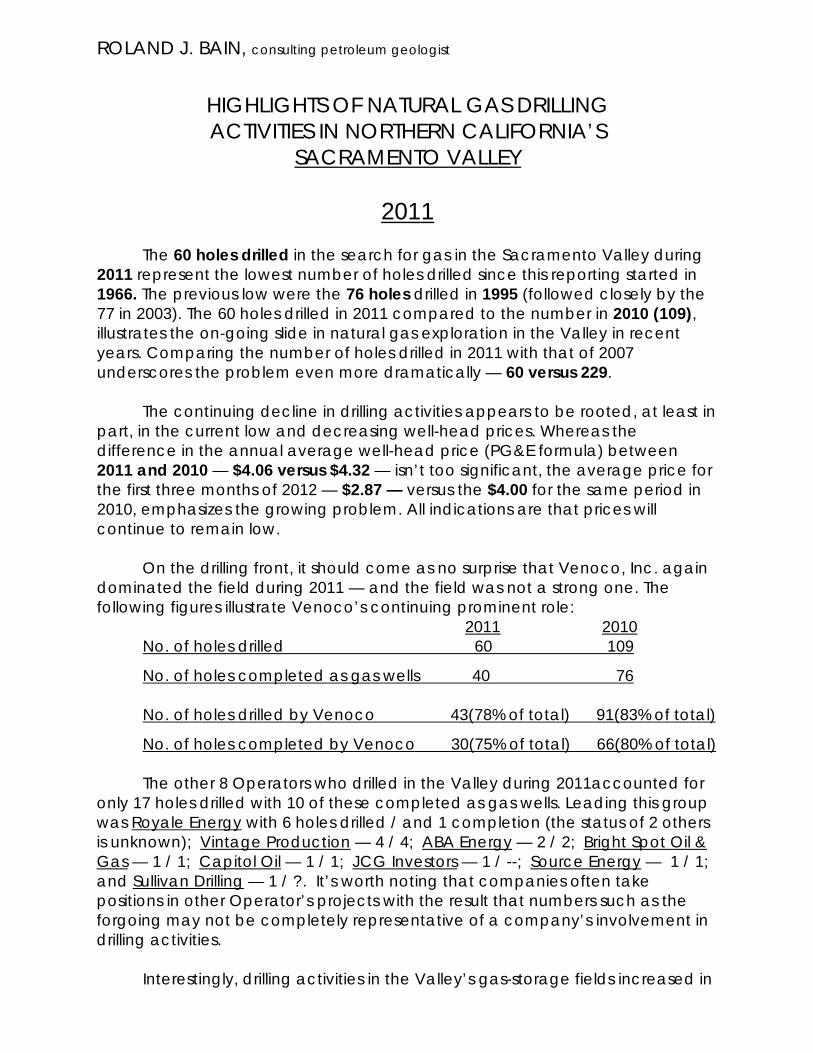
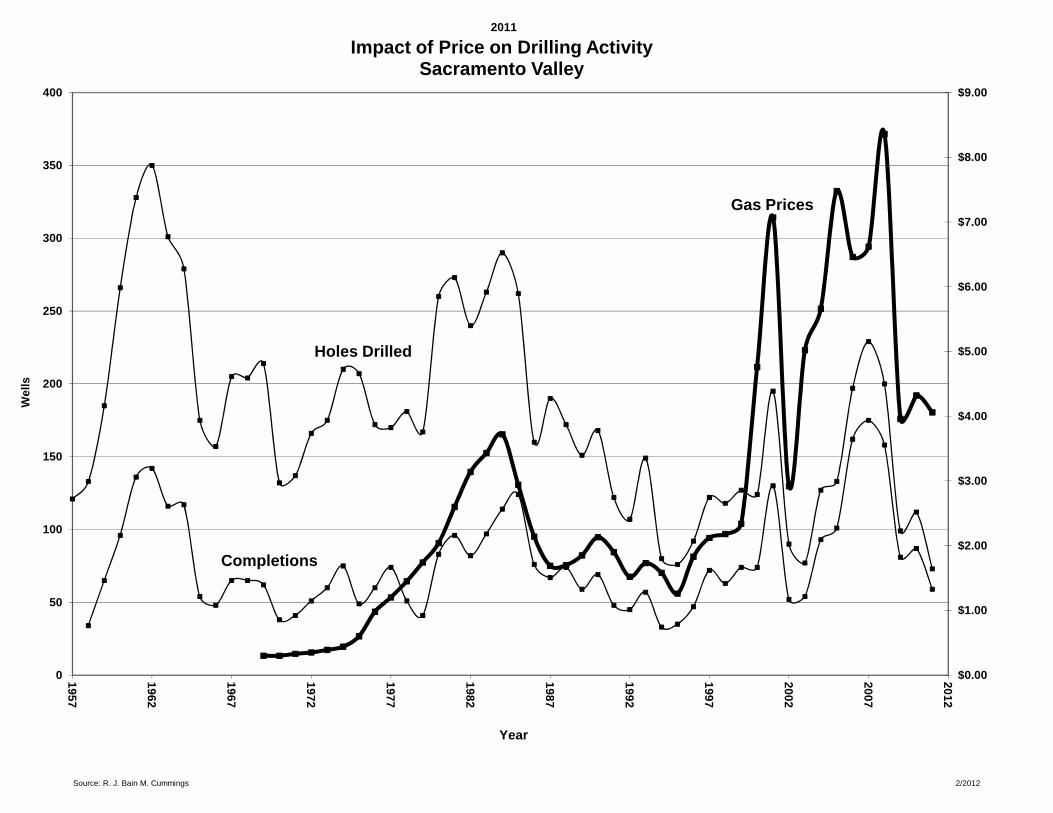
The 60 holes drilled in the search for gas in the Sacramento Valley during 2011 represent the lowest number of holes drilled since this reporting started in 1966. The previous low were the 76 holes drilled in 1995 (followed closely by the 77 in 2003). The 60 holes drilled in 2011 compared to the number in 2010 (109), illustrates the on-going slide in natural gas exploration in the Valley in recent years. Comparing the number of holes drilled in 2011 with that of 2007 underscores the problem even more dramatically — 60 versus 229.
The continuing decline in drilling activities appears to be rooted, at least in
part, in the current low and decreasing well-head prices. Whereas the difference in the annual average well-head price (PG&E formula) between 2011 and 2010 — $4.06 versus $4.32 — isn’t too significant, the average price for the first three months of 2012 — $2.87 — versus the $4.00 for the same period in 2010, emphasizes the growing problem. All indications are that prices will continue to remain low.
On the drilling front, it should come as no surprise that Venoco, Inc. again
dominated the field during 2011 — and the field was not a strong one. The following figures illustrate Venoco’s continuing prominent role:
2011 2010 No. of holes drilled 60 109
No. of holes completed as gas wells 40 76 No. of holes drilled by Venoco 43(78% of total) 91(83% of total)
No. of holes completed by Venoco 30(75% of total) 66(80% of total) The other 8 Operators who drilled in the Valley during 2011accounted for
only 17 holes drilled with 10 of these completed as gas wells. Leading this group was Royale Energy with 6 holes drilled / and 1 completion (the status of 2 others is unknown); Vintage Production — 4 / 4; ABA Energy — 2 / 2; Bright Spot Oil & Gas — 1 / 1; Capitol Oil — 1 / 1; JCG Investors — 1 / --; Source Energy — 1 / 1; and Sullivan Drilling — 1 / ?. It’s worth noting that companies often take positions in other Operator’s projects with the result that numbers such as the forgoing may not be completely representative of a company’s involvement in drilling activities.
Interestingly, drilling activities in the Valley’s gas-storage fields increased in

2 2011. Three (3) Operators drilled 13 holes in 3 of the storage fields: Central Valley Gas Storage — 8 completed wells in the Princeton field; Lodi Gas Storage — 3 completed wells in the Lodi field; and Wild Goose Storage — 2 completed wells in the Wild Goose field. [Note: Holes drilled in gas-storage fields are not carried in number of holes drilled; those drilled for new supplies of gas]
The drilling contractors operating in the Sacramento Valley during 2011,
included Ensign — 4 rigs drilled 44 holes; Paul Graham — 5 rigs drilled 27 holes; Helmerich & Payne — 1 rig drilled 1hole; and WW drilled 1 hole / ? (presumably, WW is a water-well drilling company).
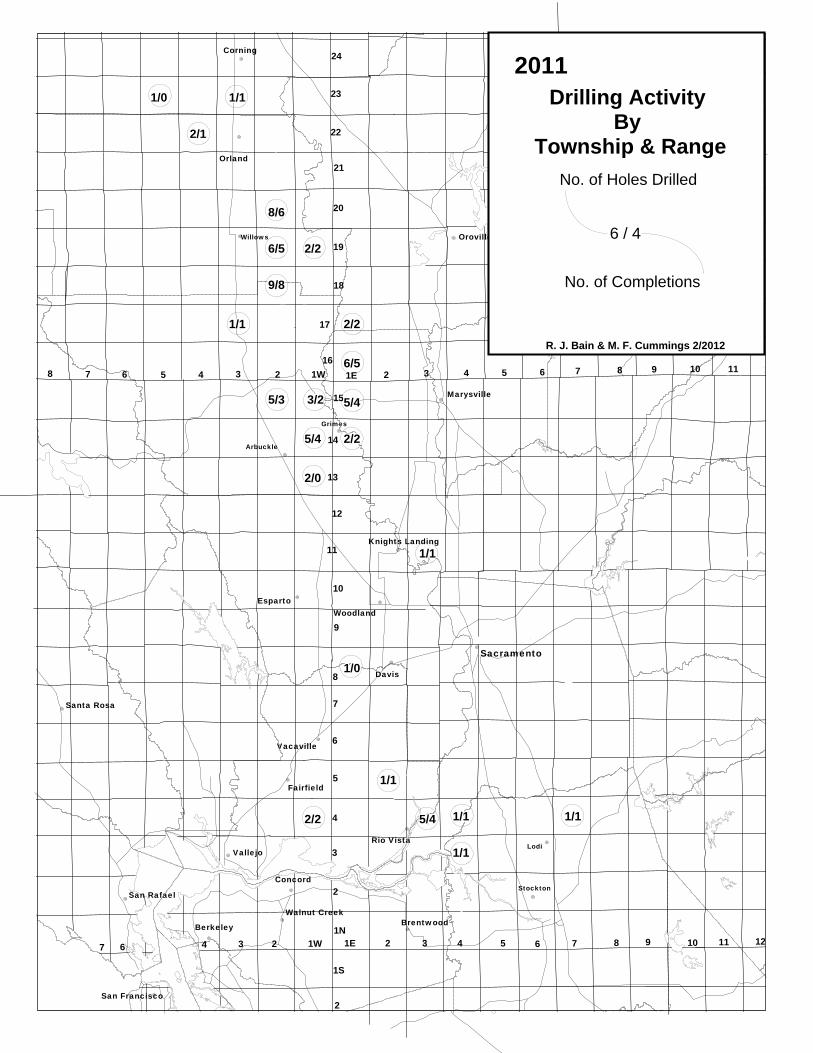
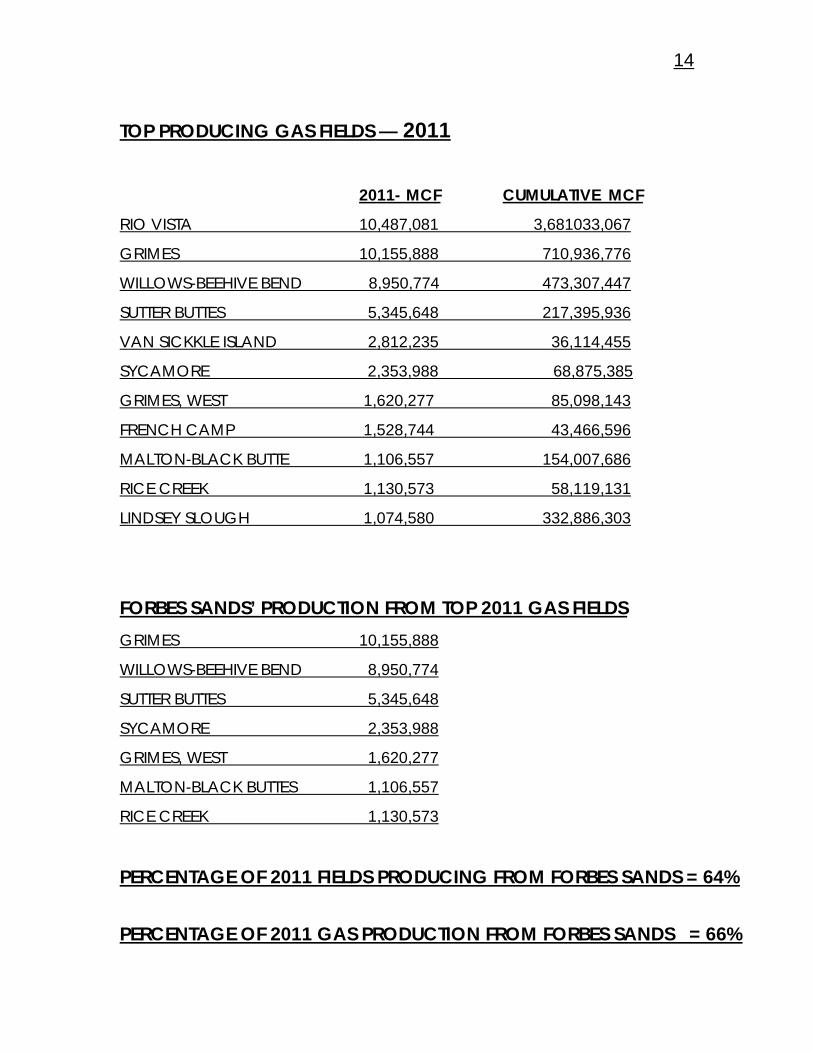
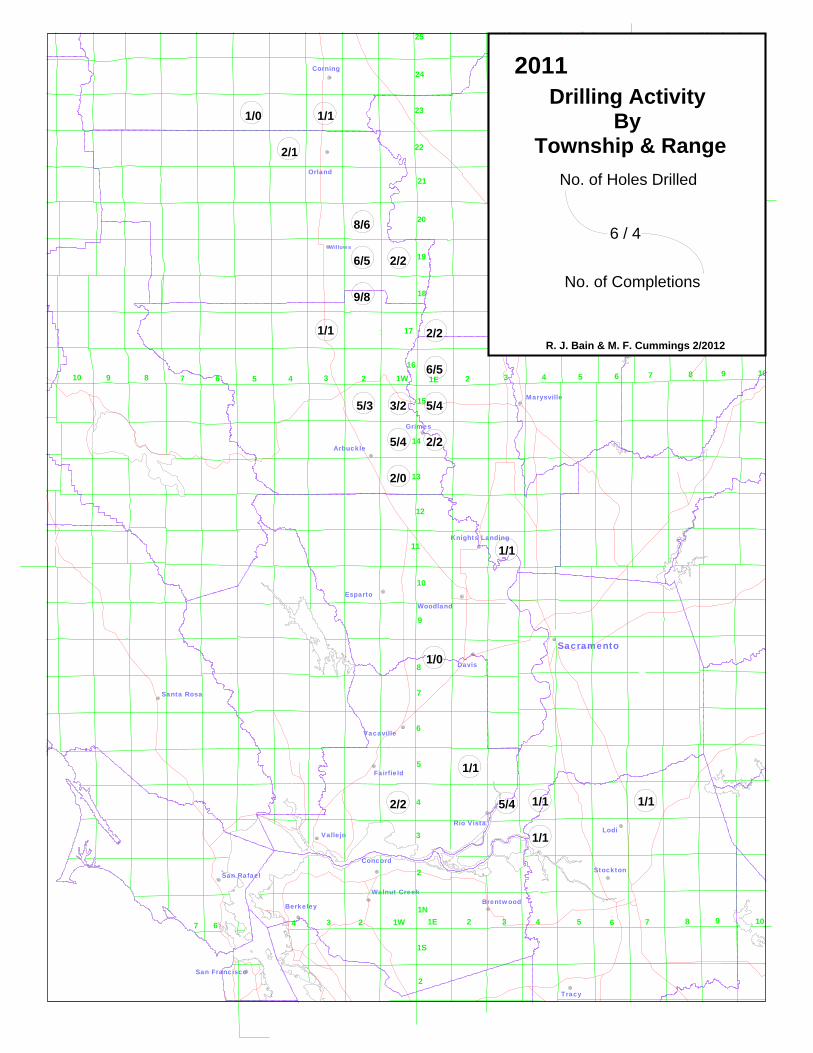
The focus of the drilling projects during 2011 was in the Grimes / Sutter Buttes area as well as at Willow-Beehive Bend. Of related interest is the fact that 66% of the gas production from Valley wells was derived from Forbes sands. Until recent times, the large majority of local gas came from Domengine, Mokelumne River and Winters sands.
The Rio Vista field remained the top producing gas field in the Valley,
although the 10.5 Bcf of produced gas measured very slightly above the 10.2 Bcf output from the Grimes gas field. Wells in the Willows-Beehive Bend field yielded 8.95 Bcf.
Venoco is still the top gas producer in the Valley, its 610 wells having
produced 32 Bcf last year. Vintage’s 252 wells produced 13.8 Bcf and 2.5 Bcf were realized from Royale’s 48 wells. Three (3) of Venoco’s wells in the Van Sickle Island field were among the top ten gas wells in 2011, the number one well — the Roaring River 20-4 well — having produced 1.9 Bcf for a daily average of 5,220 Mcf.
A definite sign of the times is the growing number of filings for permits to
Rework wells. During 2011, there were 462 rework filings in comparison to 386 filings in 2010. Of the 462 filings 309 (67%) were by Venoco.
The decrease in drilling by Venoco during 2011 may signal its intent to de-
emphasize its exploration efforts and its presence in the Sacramento Valley. In view of the portents for on-going low well-head prices, Venoco might not be the only Operator becoming discouraged with the current, negative economics.
2012 should be an interesting year, if not a pivotal one.
Roland J. Bain Sacramento, CA March 21, 2012
3111 Garden Highway – Sacramento, CA 95833 – (916) 922-3223 – [email protected]
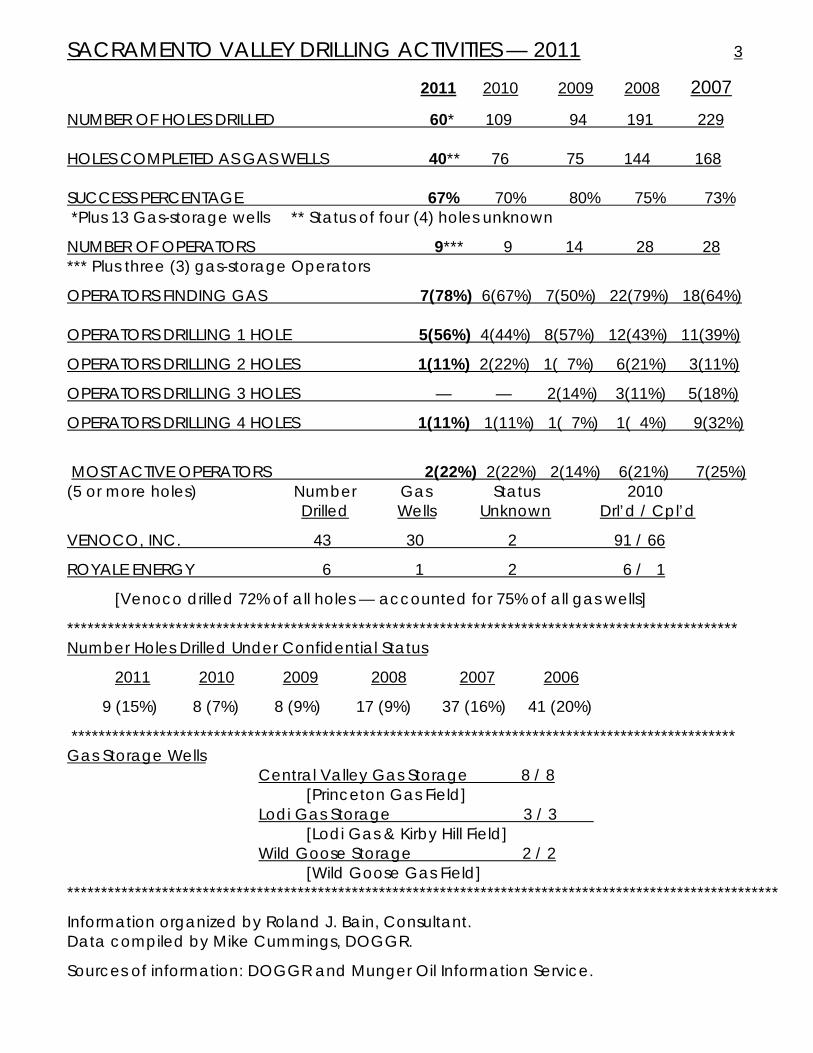
SACRAMENTO VALLEY DRILLING ACTIVITIES — 2011 3
2011 2010 2009 2008 2007 NUMBER OF HOLES DRILLED 60* 109 94 191 229 HOLES COMPLETED AS GAS WELLS 40** 76 75 144 168 SUCCESS PERCENTAGE 67% 70% 80% 75% 73% *Plus 13 Gas-storage wells ** Status of four (4) holes unknown
NUMBER OF OPERATORS 9*** 9 14 28 28 *** Plus three (3) gas-storage Operators
OPERATORS FINDING GAS 7(78%) 6(67%) 7(50%) 22(79%) 18(64%) OPERATORS DRILLING 1 HOLE 5(56%) 4(44%) 8(57%) 12(43%) 11(39%)
OPERATORS DRILLING 2 HOLES 1(11%) 2(22%) 1( 7%) 6(21%) 3(11%)
OPERATORS DRILLING 3 HOLES — — 2(14%) 3(11%) 5(18%)
OPERATORS DRILLING 4 HOLES 1(11%) 1(11%) 1( 7%) 1( 4%) 9(32%)
MOST ACTIVE OPERATORS 2(22%) 2(22%) 2(14%) 6(21%) 7(25%) (5 or more holes) Number Gas Status 2010 Drilled Wells Unknown Drl’d / Cpl’d
VENOCO, INC. 43 30 2 91 / 66
ROYALE ENERGY 6 1 2 6 / 1
[Venoco drilled 72% of all holes — accounted for 75% of all gas wells]
*************************************************************************************************** Number Holes Drilled Under Confidential Status
2011 2010 2009 2008 2007 2006
9 (15%) 8 (7%) 8 (9%) 17 (9%) 37 (16%) 41 (20%)
************************************************************************************************** Gas Storage Wells
Central Valley Gas Storage 8 / 8 [Princeton Gas Field]
Lodi Gas Storage 3 / 3 [Lodi Gas & Kirby Hill Field]
Wild Goose Storage 2 / 2 [Wild Goose Gas Field]
*********************************************************************************************************
Information organized by Roland J. Bain, Consultant. Data compiled by Mike Cummings, DOGGR.
Sources of information: DOGGR and Munger Oil Information Service.
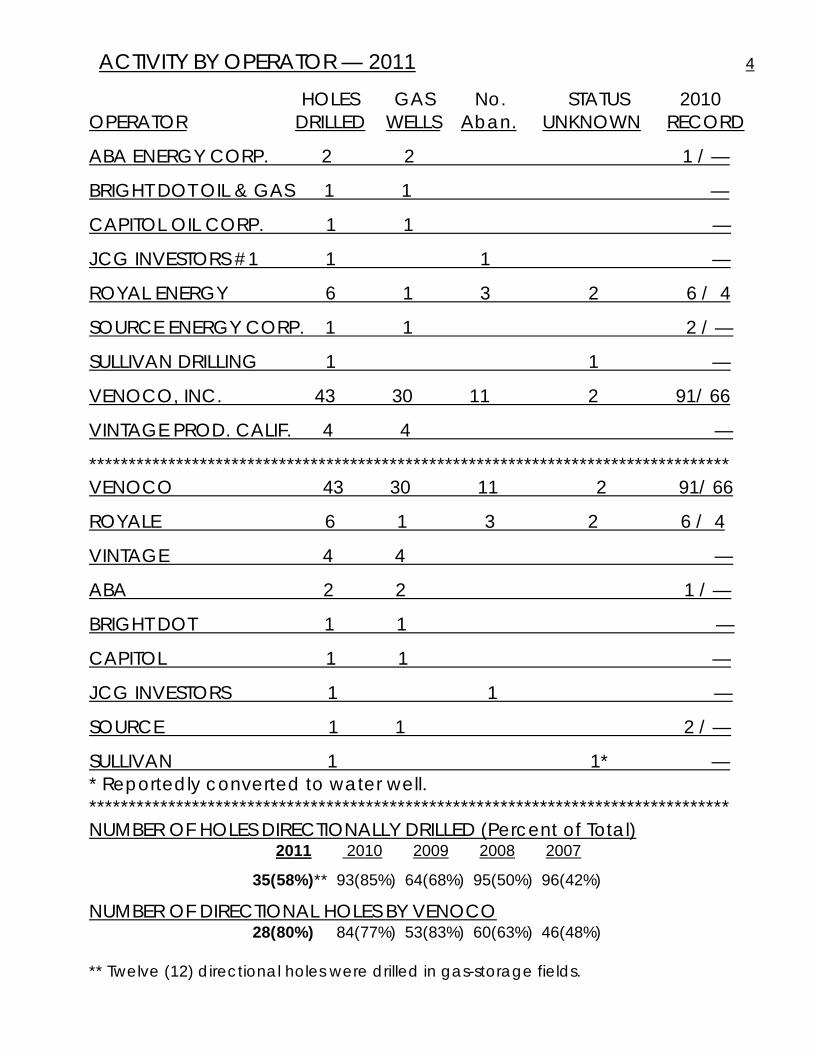
ACTIVITY BY OPERATOR — 2011 4
HOLES GAS No. STATUS 2010 OPERATOR DRILLED WELLS Aban. UNKNOWN RECORD
ABA ENERGY CORP. 2 2 1 / —
BRIGHT DOT OIL & GAS 1 1 —
CAPITOL OIL CORP. 1 1 —
JCG INVESTORS #1 1 1 —
ROYAL ENERGY 6 1 3 2 6 / 4
SOURCE ENERGY CORP. 1 1 2 / —
SULLIVAN DRILLING 1 1 —
VENOCO, INC. 43 30 11 2 91/ 66
VINTAGE PROD. CALIF. 4 4 —
********************************************************************************* VENOCO 43 30 11 2 91/ 66
ROYALE 6 1 3 2 6 / 4
VINTAGE 4 4 —
ABA 2 2 1 / —
BRIGHT DOT 1 1 —
CAPITOL 1 1 —
JCG INVESTORS 1 1 —
SOURCE 1 1 2 / —
SULLIVAN 1 1* — * Reportedly converted to water well. ********************************************************************************* NUMBER OF HOLES DIRECTIONALLY DRILLED (Percent of Total)
2011 2010 2009 2008 2007
35(58%)** 93(85%) 64(68%) 95(50%) 96(42%)
NUMBER OF DIRECTIONAL HOLES BY VENOCO 28(80%) 84(77%) 53(83%) 60(63%) 46(48%) ** Twelve (12) directional holes were drilled in gas-storage fields.
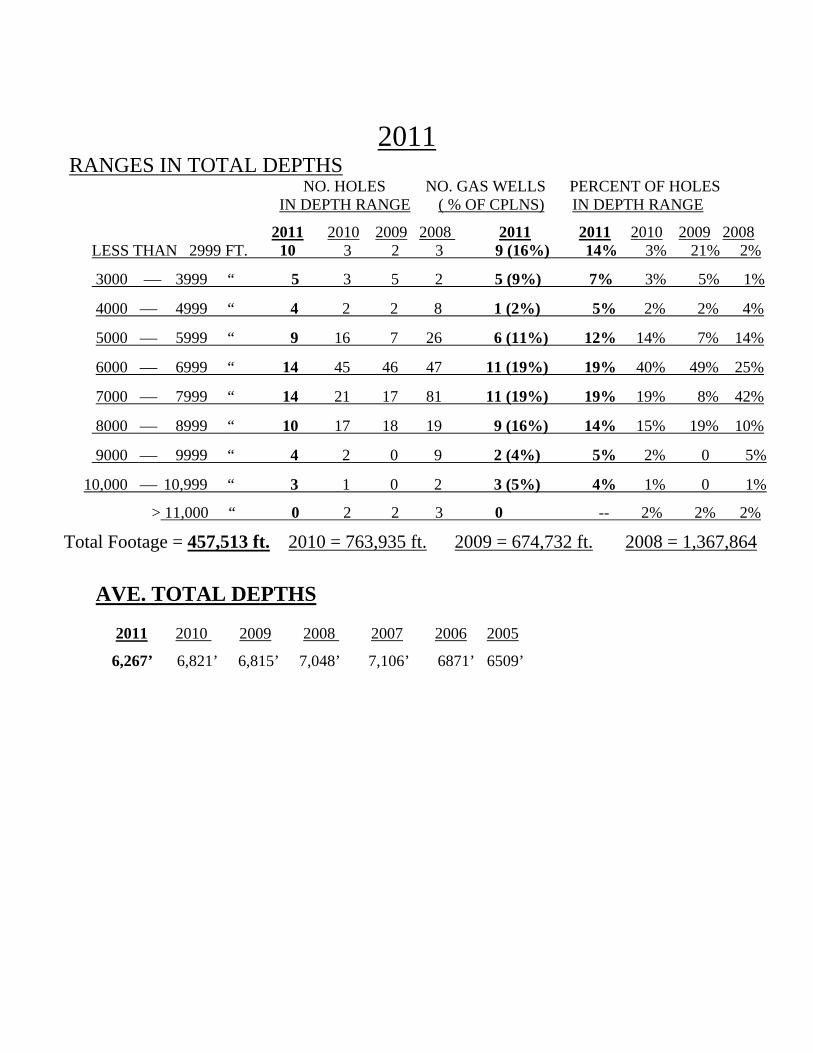
2011 RANGES IN TOTAL DEPTHS NO. HOLES NO. GAS WELLS PERCENT OF HOLES IN DEPTH RANGE ( % OF CPLNS) IN DEPTH RANGE
2011 2010 2009 2008 2011 2011 2010 2009 2008 LESS THAN 2999 FT. 10 3 2 3 9 (16%) 14% 3% 21% 2%
3000 3999 “ 5 3 5 2 5 (9%) 7% 3% 5% 1%
4000 4999 “ 4 2 2 8 1 (2%) 5% 2% 2% 4%
5000 5999 “ 9 16 7 26 6 (11%) 12% 14% 7% 14%
6000 6999 “ 14 45 46 47 11 (19%) 19% 40% 49% 25%
7000 7999 “ 14 21 17 81 11 (19%) 19% 19% 8% 42%
8000 8999 “ 10 17 18 19 9 (16%) 14% 15% 19% 10%
9000 9999 “ 4 2 0 9 2 (4%) 5% 2% 0 5%
10,000 10,999 “ 3 1 0 2 3 (5%) 4% 1% 0 1%
> 11,000 “ 0 2 2 3 0 -- 2% 2% 2%
Total Footage = 457,513 ft. 2010 = 763,935 ft. 2009 = 674,732 ft. 2008 = 1,367,864
AVE. TOTAL DEPTHS
2011 2010 2009 2008 2007 2006 2005
6,267’ 6,821’ 6,815’ 7,048’ 7,106’ 6871’ 6509’
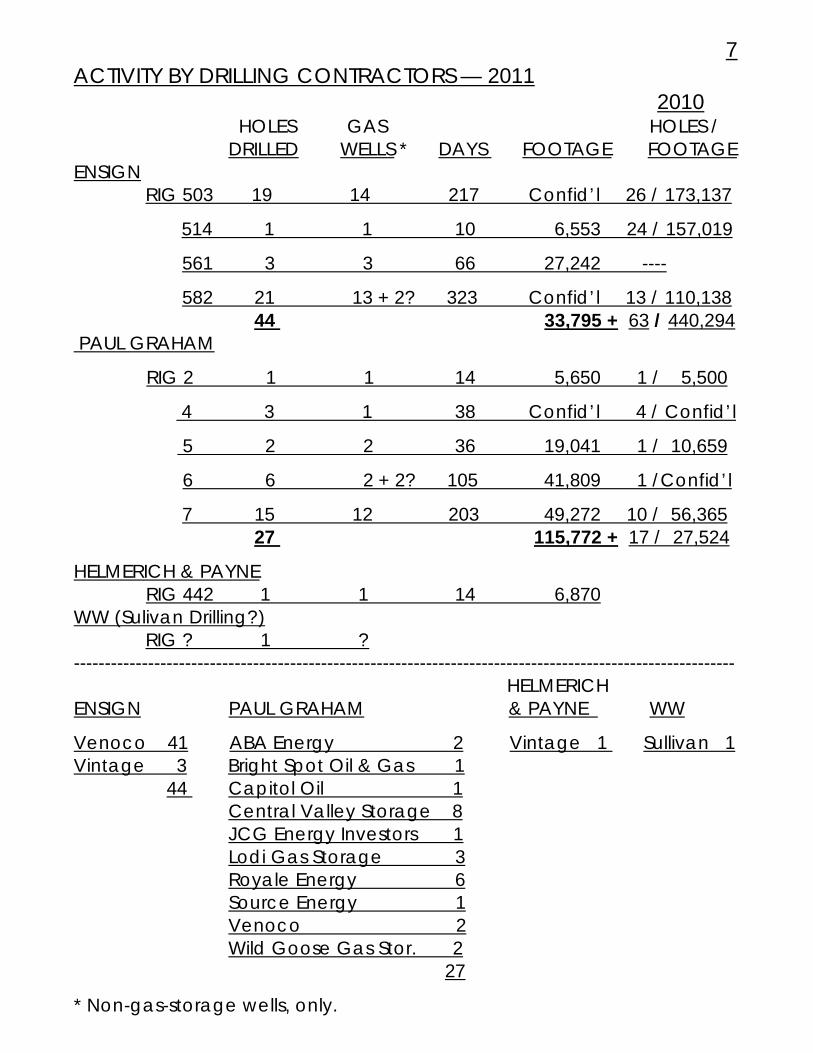
7 ACTIVITY BY DRILLING CONTRACTORS — 2011 2010 HOLES GAS HOLES / DRILLED WELLS * DAYS FOOTAGE FOOTAGE ENSIGN RIG 503 19 14 217 Confid’l 26 / 173,137
514 1 1 10 6,553 24 / 157,019
561 3 3 66 27,242 ----
582 21 13 + 2? 323 Confid’l 13 / 110,138 44 33,795 + 63 / 440,294 PAUL GRAHAM
RIG 2 1 1 14 5,650 1 / 5,500
4 3 1 38 Confid’l 4 / Confid’l
5 2 2 36 19,041 1 / 10,659
6 6 2 + 2? 105 41,809 1 /Confid’l
7 15 12 203 49,272 10 / 56,365 27 115,772 + 17 / 27,524
HELMERICH & PAYNE RIG 442 1 1 14 6,870 WW (Sulivan Drilling?) RIG ? 1 ? ----------------------------------------------------------------------------------------------------------- HELMERICH ENSIGN PAUL GRAHAM & PAYNE WW
Venoco 41 ABA Energy 2 Vintage 1 Sullivan 1 Vintage 3 Bright Spot Oil & Gas 1 44 Capitol Oil 1 Central Valley Storage 8 JCG Energy Investors 1 Lodi Gas Storage 3 Royale Energy 6 Source Energy 1 Venoco 2 Wild Goose Gas Stor. 2 27
* Non-gas-storage wells, only.
Sacramento
Oroville
Marysville
Lodi
Stockton
Rio Vista
Knights Landing
Brentwood
Davis
Woodland
Arbuckle
Grimes
Fairfield
Vacaville
Vallejo
Walnut Creek
Concord
Esparto
Orland
Willows
Corning
San Rafael
San Francisco
Berkeley
Santa Rosa
8 7 56 34 2 1W
18
19
20
21
22
24
23
8
15
12
10
1N
1E 32
9
7
6
5
4
3
2
154 6 7 8 9 10 11
6 32
2
1W 1E23471254 6 7 8 9 10
1S
11
17
16
14
13
11
1/11/11/11/11/11/11/11/11/1
5/45/45/45/45/45/45/45/45/42/22/22/22/22/22/22/22/22/2 1/11/11/11/11/11/11/11/11/11/11/11/11/11/11/11/11/11/1
1/11/11/11/11/11/11/11/11/1
1/01/01/01/01/01/01/01/01/0
1/11/11/11/11/11/11/11/11/1
2/02/02/02/02/02/02/02/02/0
2/22/22/22/22/22/22/22/22/25/45/45/45/45/45/45/45/45/4
5/45/45/45/45/45/45/45/45/43/23/23/23/23/23/23/23/23/25/35/35/35/35/35/35/35/35/3
6/56/56/56/56/56/56/56/56/5
2/22/22/22/22/22/22/22/22/21/11/11/11/11/11/11/11/11/1
9/89/89/89/89/89/89/89/89/8
2/22/22/22/22/22/22/22/22/26/56/56/56/56/56/56/56/56/5
8/68/68/68/68/68/68/68/68/6
2/12/12/12/12/12/12/12/12/1
1/11/11/11/11/11/11/11/11/11/01/01/01/01/01/01/01/01/0 Drilling Activity By
Township & Range
No. of Holes Drilled
6 / 4
No. of Completions
2011
R. J. Bain & M. F. Cummings 2/2012
8
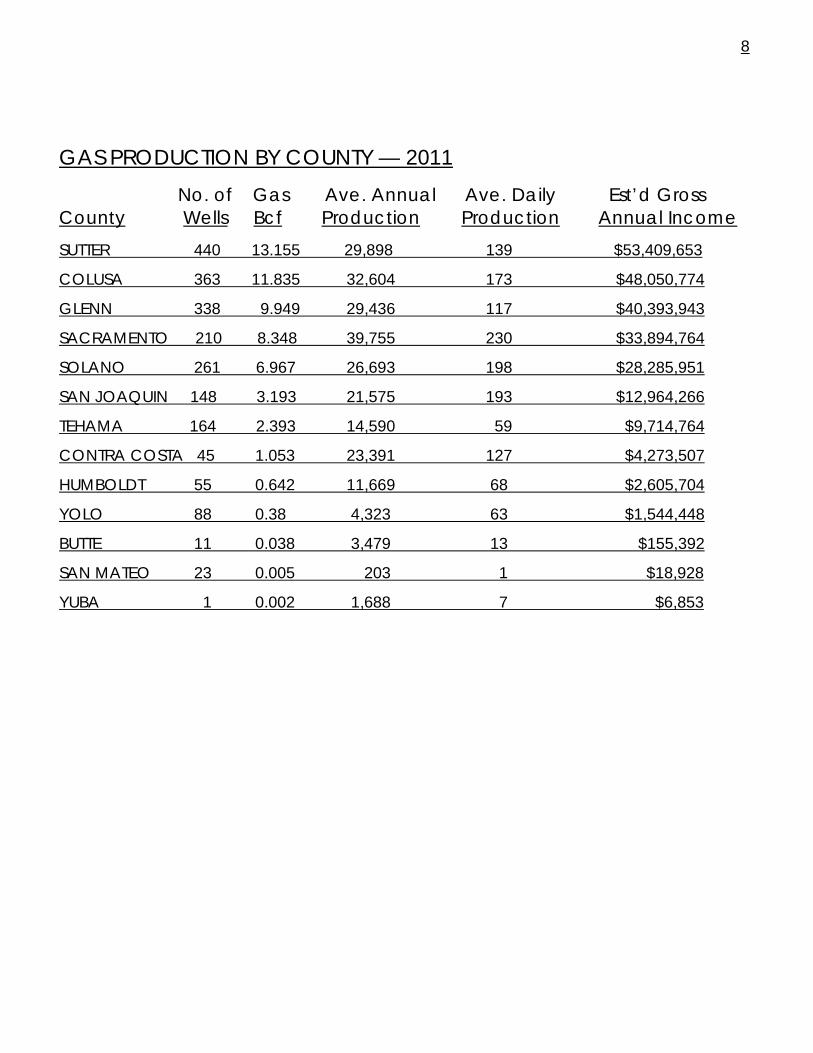
GAS PRODUCTION BY COUNTY — 2011
No. of Gas Ave. Annual Ave. Daily Est’d Gross County Wells Bcf Production Production Annual Income SUTTER 440 13.155 29,898 139 $53,409,653
COLUSA 363 11.835 32,604 173 $48,050,774
GLENN 338 9.949 29,436 117 $40,393,943
SACRAMENTO 210 8.348 39,755 230 $33,894,764
SOLANO 261 6.967 26,693 198 $28,285,951
SAN JOAQUIN 148 3.193 21,575 193 $12,964,266
TEHAMA 164 2.393 14,590 59 $9,714,764
CONTRA COSTA 45 1.053 23,391 127 $4,273,507
HUMBOLDT 55 0.642 11,669 68 $2,605,704
YOLO 88 0.38 4,323 63 $1,544,448
BUTTE 11 0.038 3,479 13 $155,392
SAN MATEO 23 0.005 203 1 $18,928
YUBA 1 0.002 1,688 7 $6,853
40
50
60
70
80
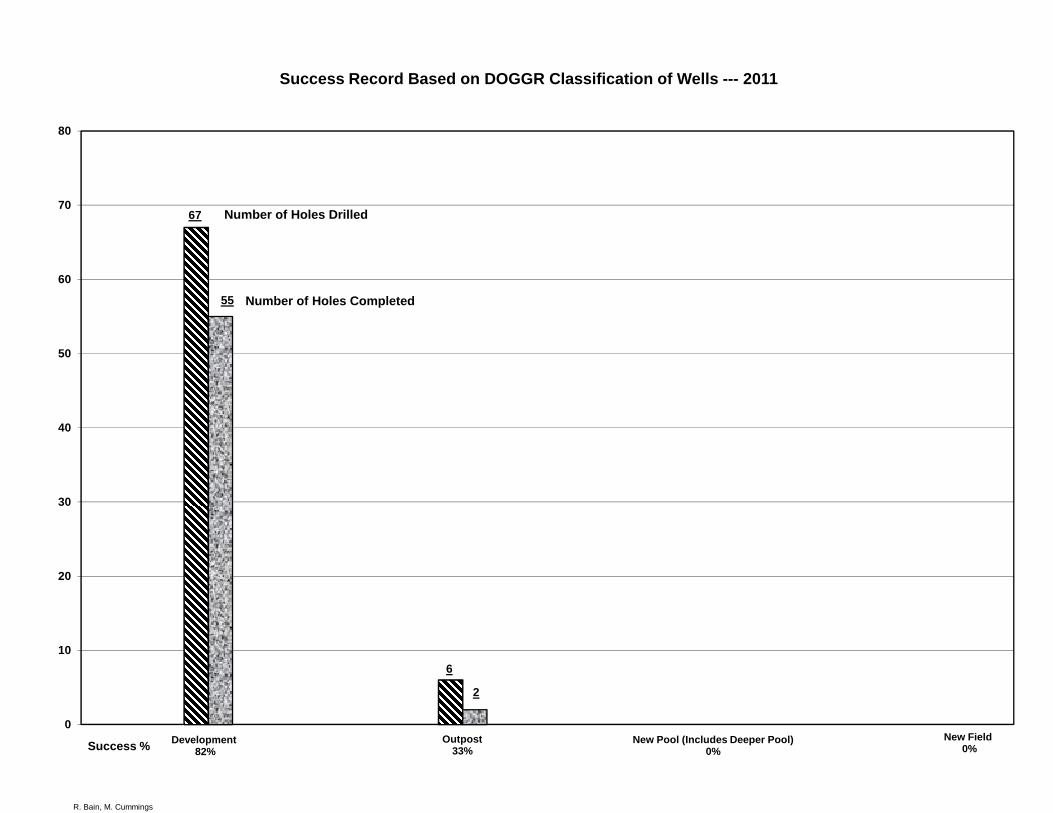
Success Record Based on DOGGR Classification of Wells --- 2011
Number of Holes Drilled
Number of Holes Completed
67
55
R. Bain, M. Cummings
0
10
20
30
40
Development82%
Outpost33%
New Pool (Includes Deeper Pool)0%
New Field0%
6
2
Success %
10
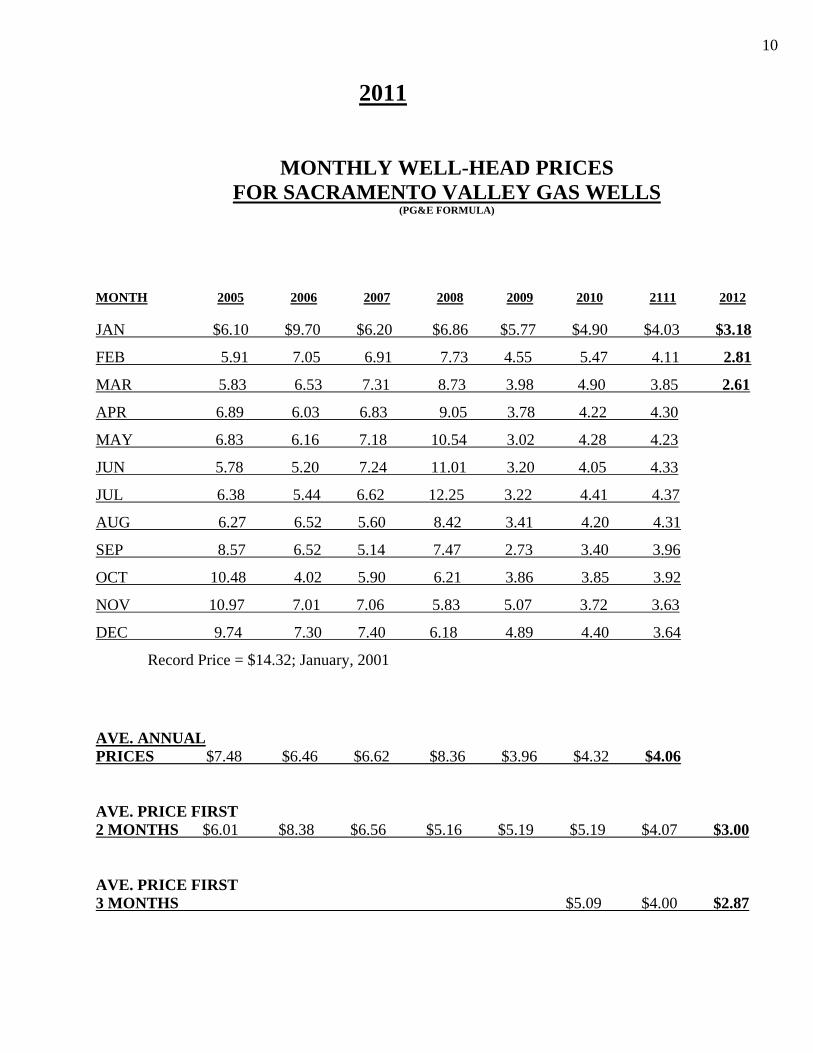
2011
MONTHLY WELL-HEAD PRICES FOR SACRAMENTO VALLEY GAS WELLS
(PG&E FORMULA) MONTH 2005 2006 2007 2008 2009 2010 2111 2012 JAN $6.10 $9.70 $6.20 $6.86 $5.77 $4.90 $4.03 $3.18
FEB 5.91 7.05 6.91 7.73 4.55 5.47 4.11 2.81
MAR 5.83 6.53 7.31 8.73 3.98 4.90 3.85 2.61
APR 6.89 6.03 6.83 9.05 3.78 4.22 4.30
MAY 6.83 6.16 7.18 10.54 3.02 4.28 4.23
JUN 5.78 5.20 7.24 11.01 3.20 4.05 4.33
JUL 6.38 5.44 6.62 12.25 3.22 4.41 4.37
AUG 6.27 6.52 5.60 8.42 3.41 4.20 4.31
SEP 8.57 6.52 5.14 7.47 2.73 3.40 3.96
OCT 10.48 4.02 5.90 6.21 3.86 3.85 3.92
NOV 10.97 7.01 7.06 5.83 5.07 3.72 3.63
DEC 9.74 7.30 7.40 6.18 4.89 4.40 3.64
Record Price = $14.32; January, 2001
AVE. ANNUAL PRICES $7.48 $6.46 $6.62 $8.36 $3.96 $4.32 $4.06 AVE. PRICE FIRST 2 MONTHS $6.01 $8.38 $6.56 $5.16 $5.19 $5.19 $4.07 $3.00 AVE. PRICE FIRST 3 MONTHS $5.09 $4.00 $2.87

$5.00
$6.00
$7.00
$8.00
$9.00
200
250
300
350
400
s
Impact of Price on Drilling ActivitySacramento Valley
Holes Drilled
Gas Prices
2011
$0.00
$1.00
$2.00
$3.00
$4.00
0
50
100
150
200
19
57
19
62
19
67
19
72
19
77
19
82
19
87
19
92
19
97
20
02
20
07
20
12
We
lls
Year
Completions
Source: R. J. Bain M. Cummings 2/2012

13
TOP TEN GAS PRODUCERS — 2011
No. of Gas Operator Wells Production Venoco, Inc 610 31,935,047 Mcf
Vintage Prod, Calif. 252 13,830,171
Royale Energy 48 2,456,026
Towne Exploration Corp. 37 1,319,036
ABA Energy Corp. 38 1,191,188
Lario Oil & Gas Co. 14 Conf.
Donald C. Slawson Expl. 19 707,825
Signal Hill Petroleum 3 383,898
Capitol Oil Corp. 6 363,916
Orchard Petroleum 1 257,991
TOP TEN GAS WELLS Ave. Field Operator Well Days Production Mcf/Day Van Sickle Isl. Venoco, Inc. Roaring River 20-4 365 1,905,263 Mcf 5,220
Rio Vista Vintage Prod’n Wilcox 19 365 1,765,322 4,836
Grimes Venoco, Inc. Strain Ranch 35-1 352 1,102,345 3,132
Confidential
Rio Vista Vintage Prod’n Welch 13 365 834,147 2,285
Grimes Venoco, Inc. Unit 31 – 10 365 824,402 2,259
Van Sickle Isl. Venoco, Inc. Roaring River 20-3 365 781,473 2,141
Royale Energy Goddard 7-1 364 705,520 1,938
Confidential
French Camp Vintage Prod’n Ratto 1-35 365 510,774 1,399
14
TOP PRODUCING GAS FIELDS — 2011
2011- MCF CUMULATIVE MCF
RIO VISTA 10,487,081 3,681033,067
GRIMES 10,155,888 710,936,776
WILLOWS-BEEHIVE BEND 8,950,774 473,307,447
SUTTER BUTTES 5,345,648 217,395,936
VAN SICKKLE ISLAND 2,812,235 36,114,455
SYCAMORE 2,353,988 68,875,385
GRIMES, WEST 1,620,277 85,098,143
FRENCH CAMP 1,528,744 43,466,596
MALTON-BLACK BUTTE 1,106,557 154,007,686
RICE CREEK 1,130,573 58,119,131
LINDSEY SLOUGH 1,074,580 332,886,303
FORBES SANDS’ PRODUCTION FROM TOP 2011 GAS FIELDS GRIMES 10,155,888
WILLOWS-BEEHIVE BEND 8,950,774
SUTTER BUTTES 5,345,648
SYCAMORE 2,353,988
GRIMES, WEST 1,620,277
MALTON-BLACK BUTTES 1,106,557
RICE CREEK 1,130,573
PERCENTAGE OF 2011 FIELDS PRODUCING FROM FORBES SANDS = 64%
PERCENTAGE OF 2011 GAS PRODUCTION FROM FORBES SANDS = 66%
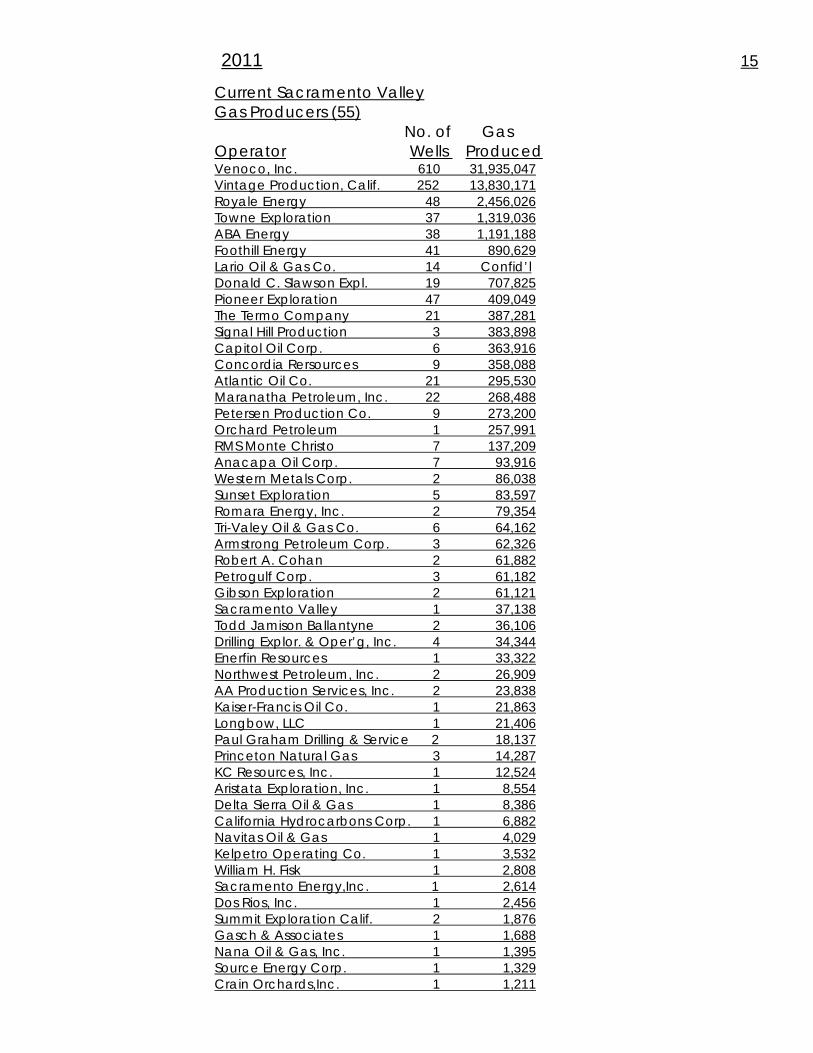
2011 15
Current Sacramento Valley Gas Producers (55) No. of Gas Operator Wells Produced Venoco, Inc. 610 31,935,047 Vintage Production, Calif. 252 13,830,171 Royale Energy 48 2,456,026 Towne Exploration 37 1,319,036 ABA Energy 38 1,191,188 Foothill Energy 41 890,629 Lario Oil & Gas Co. 14 Confid’l Donald C. Slawson Expl. 19 707,825 Pioneer Exploration 47 409,049 The Termo Company 21 387,281 Signal Hill Production 3 383,898 Capitol Oil Corp. 6 363,916 Concordia Rersources 9 358,088 Atlantic Oil Co. 21 295,530 Maranatha Petroleum, Inc. 22 268,488 Petersen Production Co. 9 273,200 Orchard Petroleum 1 257,991 RMS Monte Christo 7 137,209 Anacapa Oil Corp. 7 93,916 Western Metals Corp. 2 86,038 Sunset Exploration 5 83,597 Romara Energy, Inc. 2 79,354 Tri-Valey Oil & Gas Co. 6 64,162 Armstrong Petroleum Corp. 3 62,326 Robert A. Cohan 2 61,882 Petrogulf Corp. 3 61,182 Gibson Exploration 2 61,121 Sacramento Valley 1 37,138 Todd Jamison Ballantyne 2 36,106 Drilling Explor. & Oper’g, Inc. 4 34,344 Enerfin Resources 1 33,322 Northwest Petroleum, Inc. 2 26,909 AA Production Services, Inc. 2 23,838 Kaiser-Francis Oil Co. 1 21,863 Longbow, LLC 1 21,406 Paul Graham Drilling & Service 2 18,137 Princeton Natural Gas 3 14,287 KC Resources, Inc. 1 12,524 Aristata Exploration, Inc. 1 8,554 Delta Sierra Oil & Gas 1 8,386 California Hydrocarbons Corp. 1 6,882 Navitas Oil & Gas 1 4,029 Kelpetro Operating Co. 1 3,532 William H. Fisk 1 2,808 Sacramento Energy,Inc. 1 2,614 Dos Rios, Inc. 1 2,456 Summit Exploration Calif. 2 1,876 Gasch & Associates 1 1,688 Nana Oil & Gas, Inc. 1 1,395 Source Energy Corp. 1 1,329 Crain Orchards,Inc. 1 1,211
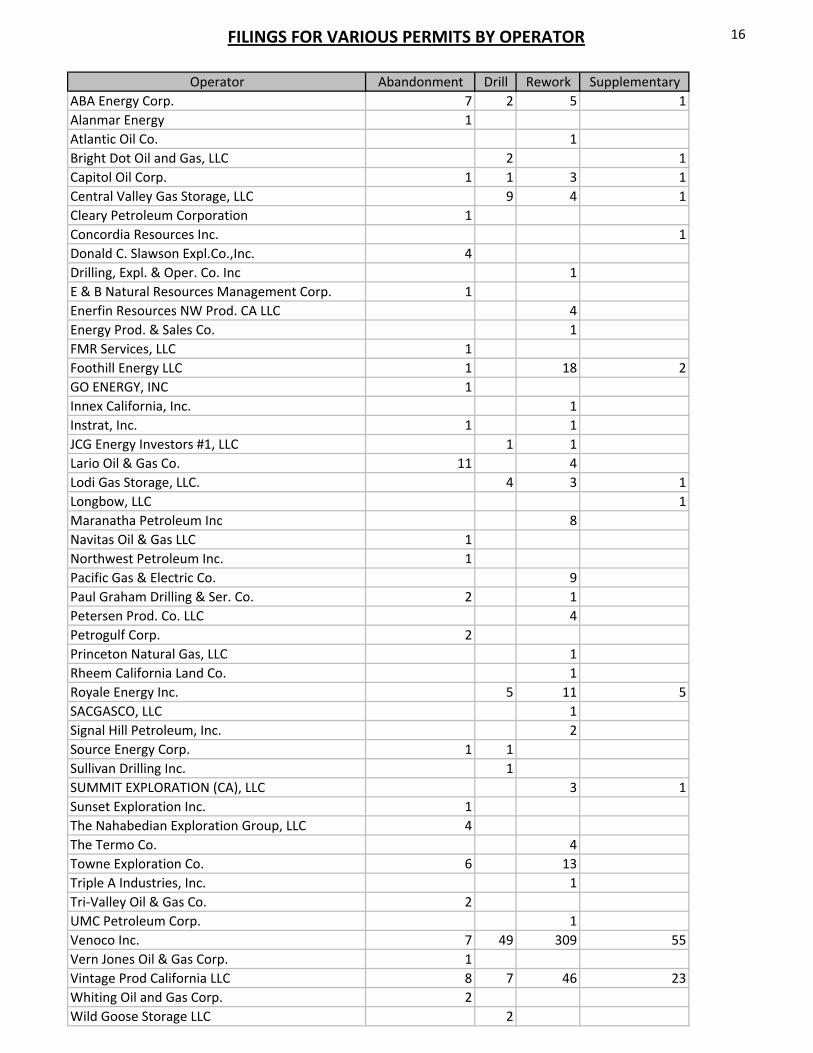
FILINGS FOR VARIOUS PERMITS BY OPERATOR 16
Operator Abandonment Drill Rework Supplementary
ABA Energy Corp. 7 2 5 1
Alanmar Energy 1
Atlantic Oil Co. 1
Bright Dot Oil and Gas, LLC 2 1
Capitol Oil Corp. 1 1 3 1
Central Valley Gas Storage, LLC 9 4 1
Cleary Petroleum Corporation 1
Concordia Resources Inc. 1
Donald C. Slawson Expl.Co.,Inc. 4
Drilling, Expl. & Oper. Co. Inc 1
E & B Natural Resources Management Corp. 1
Enerfin Resources NW Prod. CA LLC 4
Energy Prod. & Sales Co. 1
FMR Services, LLC 1
Foothill Energy LLC 1 18 2
GO ENERGY, INC 1
Innex California, Inc. 1
Instrat, Inc. 1 1
JCG Energy Investors #1, LLC 1 1
Lario Oil & Gas Co. 11 4
Lodi Gas Storage, LLC. 4 3 1
Longbow, LLC 1
Maranatha Petroleum Inc 8
Navitas Oil & Gas LLC 1
Northwest Petroleum Inc. 1
Pacific Gas & Electric Co. 9
Paul Graham Drilling & Ser. Co. 2 1
Petersen Prod. Co. LLC 4
Petrogulf Corp. 2
Princeton Natural Gas, LLC 1
Rheem California Land Co. 1
Royale Energy Inc. 5 11 5
SACGASCO, LLC 1
Signal Hill Petroleum, Inc. 2
Source Energy Corp. 1 1
Sullivan Drilling Inc. 1
SUMMIT EXPLORATION (CA), LLC 3 1
Sunset Exploration Inc. 1
The Nahabedian Exploration Group, LLC 4
The Termo Co. 4
Towne Exploration Co. 6 13
Triple A Industries, Inc. 1
Tri‐Valley Oil & Gas Co. 2
UMC Petroleum Corp. 1
Venoco Inc. 7 49 309 55
Vern Jones Oil & Gas Corp. 1
Vintage Prod California LLC 8 7 46 23
Whiting Oil and Gas Corp. 2
Wild Goose Storage LLC 2

250
300
350
400
450
of Permits
2011
Permits Issued by Type
Rework
Source: R. J. Bain/M. F. Cummings - 2/2012
50
100
150
200
250
2000 2001 2002 2003 2004 2005 2006 2007 2008 2009 2010 2011
Num
ber o
Drill
Abandonment
200
250
300
1100
1300
1500
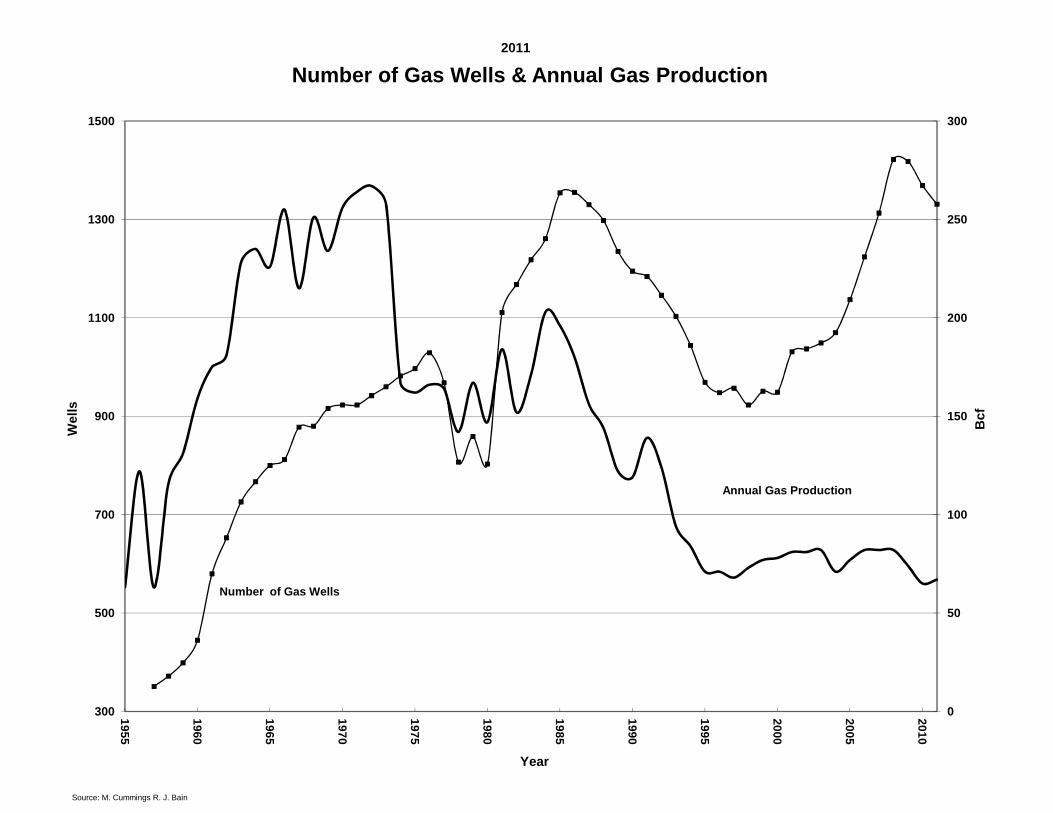
sNumber of Gas Wells & Annual Gas Production
2011
0
50
100
150
300
500
700
900
19
55
19
60
19
65
19
70
19
75
19
80
19
85
19
90
19
95
20
00
20
05
20
10
Bcf
Wel
l s
Year
Number of Gas Wells
Annual Gas Production
Source: M. Cummings R. J. Bain
900
1100
1300
1500
400
500
600
700
ells
r B
cf/Y
ear
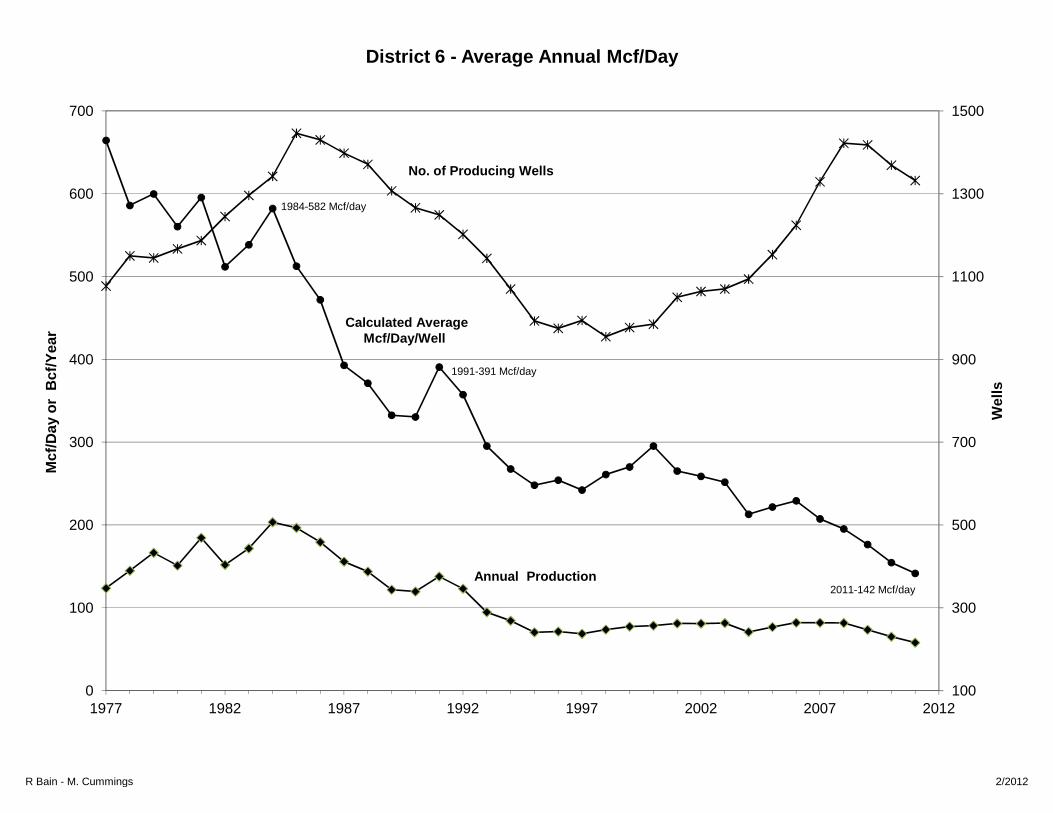
District 6 - Average Annual Mcf/Day
No. of Producing Wells
Calculated Average Mcf/Day/Well
1991-391 Mcf/day
1984-582 Mcf/day
R Bain - M. Cummings 2/2012
100
300
500
700
0
100
200
300
1977 1982 1987 1992 1997 2002 2007 2012
We
Mcf
/Day
o
Annual Production2011-142 Mcf/day
R Bain M. Cummings 2/2012
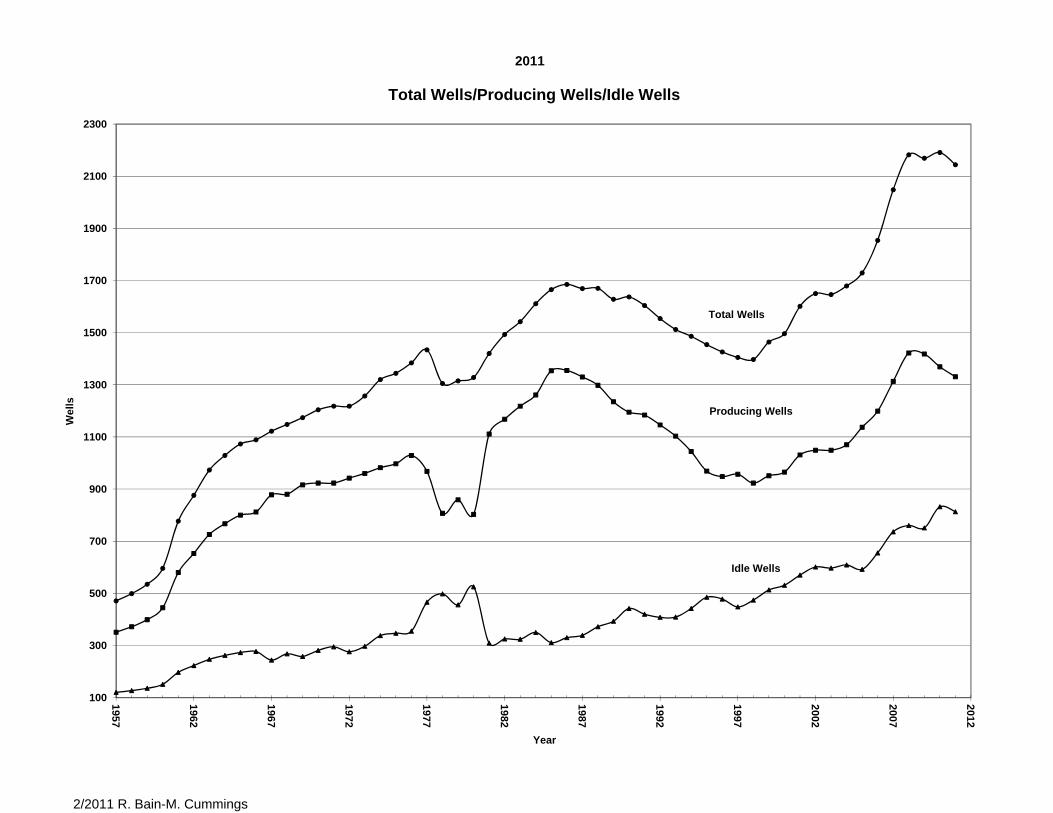
Total Wells/Producing Wells/Idle Wells
2011
2100
2300
1700
1900
1300
1500
ls
Total Wells
900
1100
Wel
l
Producing Wells
500
700
Idle Wells
300
500
100 1957
1962
1967
1972
1977
1982
1987
1992
1997
2002
2007
2012
Year
2/2011 R. Bain-M. Cummings
80
100
120
Fields
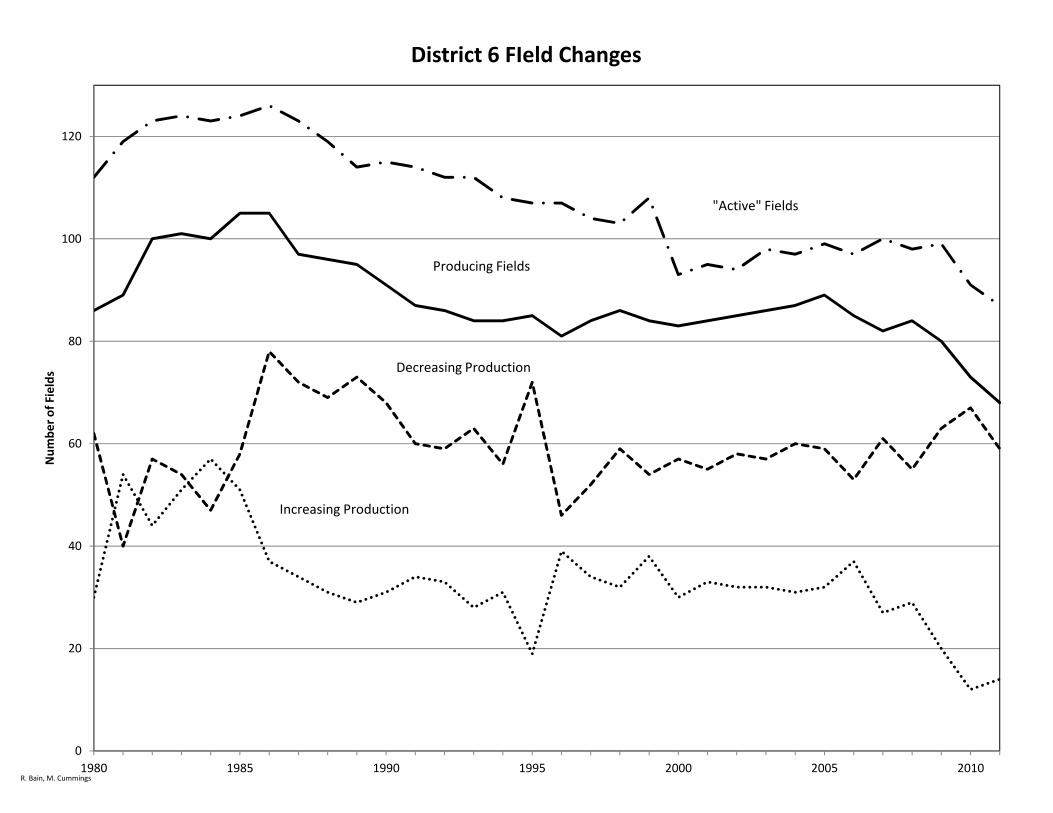
District 6 FIeld Changes
"Active" Fields
Producing Fields
Decreasing Production
R. Bain, M. Cummings
0
20
40
60
1980 1985 1990 1995 2000 2005 2010
Num
ber o
f
Increasing Production
600
900
1200
1800
2000
2200
2400
2600
2800
3000
3200
Cha
nges
Res
erve
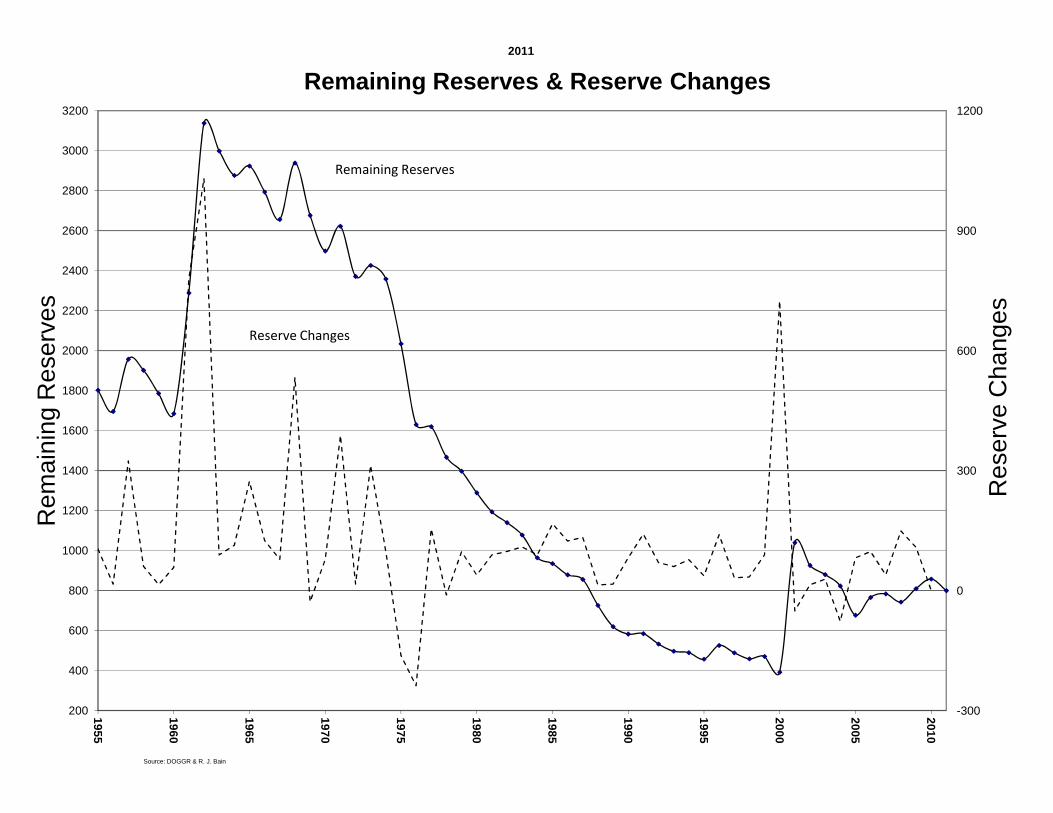
sRemaining Reserves & Reserve Changes
2011
Remaining Reserves
Reserve Changes
-300
0
300
200
400
600
800
1000
1200
1400
1600
19
55
19
60
19
65
19
70
19
75
19
80
19
85
19
90
19
95
20
00
20
05
20
10
Res
erve
Rem
aini
ng
Source: DOGGR & R. J. Bain

23 SUMMARY OF DRILLING ACTIVITIES IN THE SACRAMENTO VALLEY
1966 1967 1968 1969 1970 1971 1972 1973 1974 1975 1976 1977 1978 1979 1980 1981 1982 1983 Number of Holes Drilled
154~
178
192
191
122
126
141
155
180
164
153
155
163
156
228
238
214
234
Number of Redrills
3
27
12
23
10
11
25
20
30
43
19
1~
18
11
32
35
26
29
Total Number of Holes
157
205
204
214~
132
137
166
175
210
207
172
170
181
167
260
273
240
263
Holes Completed as Gas Wells
4-8
65
65
62
38
41
51
60
75
49
60
74
51
41
83
96
82
97
Success Percentage
31%
32%
32%
29%
29%
30%
31%
34%
36%
24%
34%
43%
31%
25%
31%
35%
38%
37%
Number of Operators
59
59
59
57
42
47
48
47
41
44
44
56
56
53
63
56
68
58
Wells drilled below 10K’
5
7
15
12
3
8
13
4
5
19
24
20
23
21
Deepest Hole K’
11.3
16.4~
15.2
18.3
11.3
12.4
11.1
12.0
11.8
12.9
19.7
12.8
14.1
13.2
Number of Gas Wells
812
878
880
916
923
923
942
960
982
997
1029
968
807
859
803
1111
1168
1218
Total Gas Produced District 6 (Million MCF)
255
215
251
234
256
264
267
258
167
162
142
163
142
168
146
184
151
175
Remaining Reserves District 6 (Million MCF)
2793
2656
2938
2676
2498
2622
2371
2426
2358
2358
2034
1630
1467
1397
1289
1194
1140
1078
Wellhead Price (PG&E Ave.)
$0.30
$0.30
$0.33
$0.35
$0.39
$0.44
$0.60
$0.98
$1.20
$1.45
$1.74
$2.04
$2.60
$3.14
$3.43
\
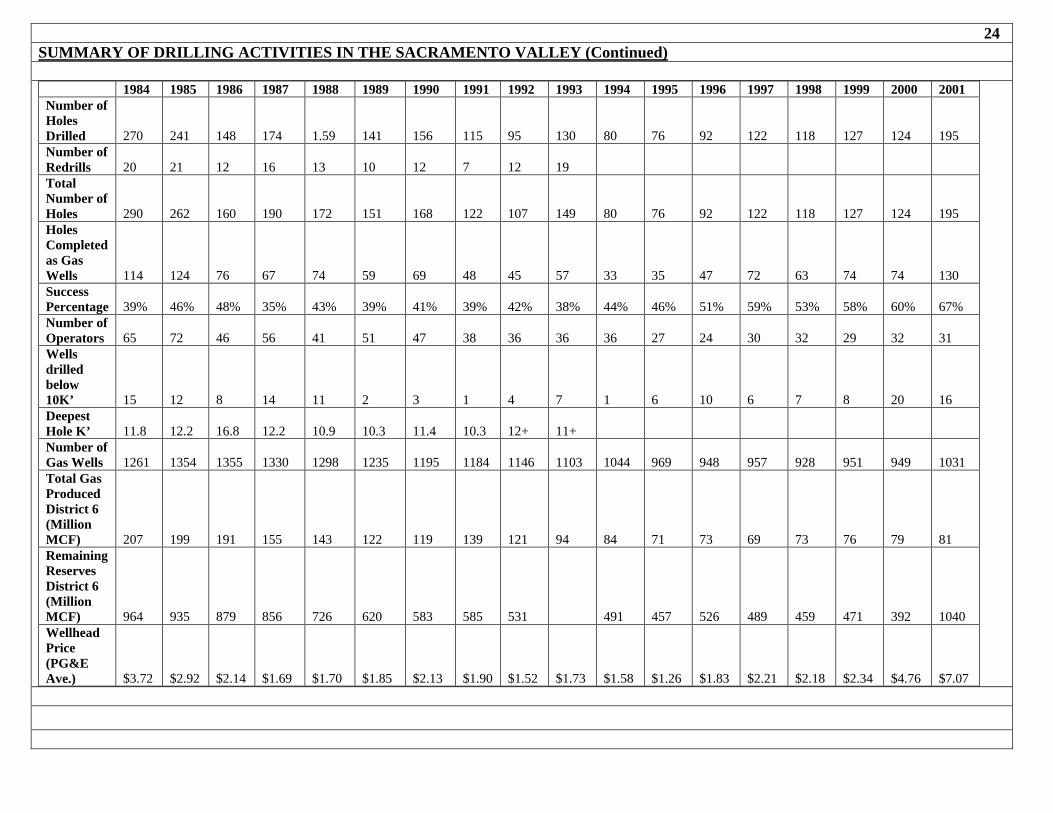
24 SUMMARY OF DRILLING ACTIVITIES IN THE SACRAMENTO VALLEY (Continued)
1984 1985 1986 1987 1988 1989 1990 1991 1992 1993 1994 1995 1996 1997 1998 1999 2000 2001 Number of Holes Drilled
270
241
148
174
1.59
141
156
115
95
130
80
76
92
122
118
127
124
195
Number of Redrills
20
21
12
16
13
10
12
7
12
19
Total Number of Holes
290
262
160
190
172
151
168
122
107
149
80
76
92
122
118
127
124
195
Holes Completed as Gas Wells
114
124
76
67
74
59
69
48
45
57
33
35
47
72
63
74
74
130
Success Percentage
39%
46%
48%
35%
43%
39%
41%
39%
42%
38%
44%
46%
51%
59%
53%
58%
60%
67%
Number of Operators
65
72
46
56
41
51
47
38
36
36
36
27
24
30
32
29
32
31
Wells drilled below 10K’
15
12
8
14
11
2
3
1
4
7
1
6
10
6
7
8
20
16
Deepest Hole K’
11.8
12.2
16.8
12.2
10.9
10.3
11.4
10.3
12+
11+
Number of Gas Wells
1261
1354
1355
1330
1298
1235
1195
1184
1146
1103
1044
969
948
957
928
951
949
1031
Total Gas Produced District 6 (Million MCF)
207
199
191
155
143
122
119
139
121
94
84
71
73
69
73
76
79
81
Remaining Reserves District 6 (Million MCF)
964
935
879
856
726
620
583
585
531
491
457
526
489
459
471
392
1040
Wellhead Price (PG&E Ave.)
$3.72
$2.92
$2.14
$1.69
$1.70
$1.85
$2.13
$1.90
$1.52
$1.73
$1.58
$1.26
$1.83
$2.21
$2.18
$2.34
$4.76
$7.07
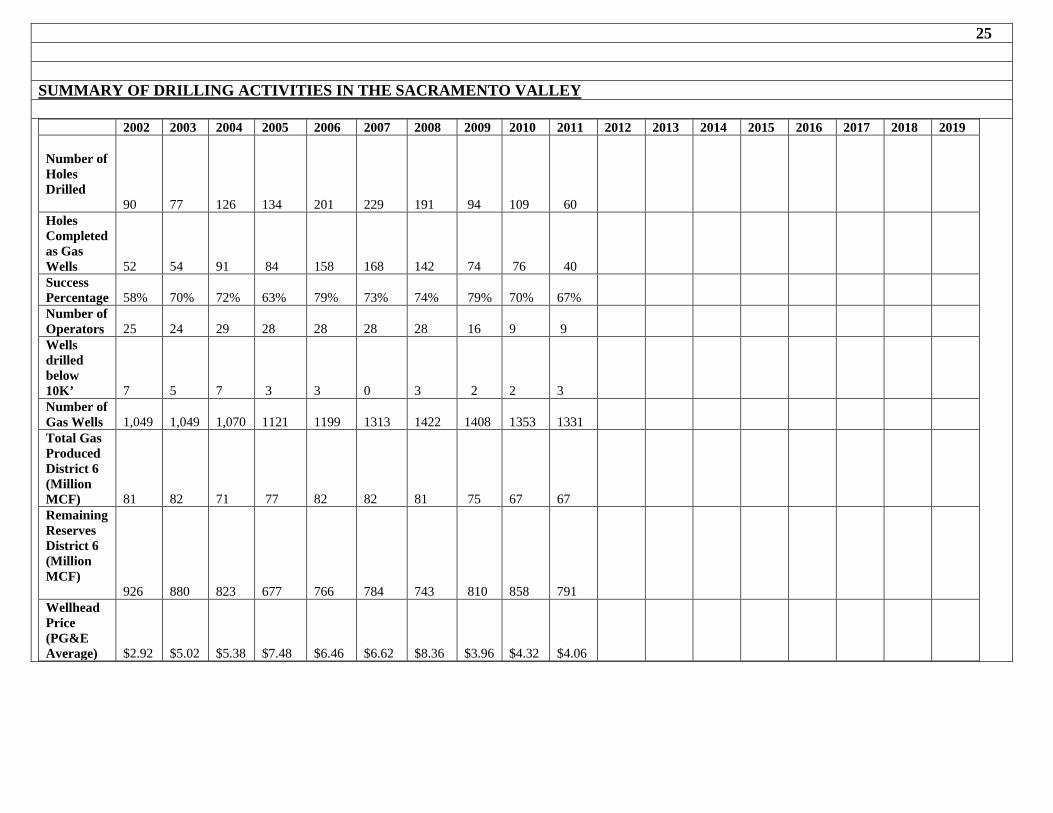
25 SUMMARY OF DRILLING ACTIVITIES IN THE SACRAMENTO VALLEY
2002 2003 2004 2005 2006 2007 2008 2009 2010 2011 2012 2013 2014 2015 2016 2017 2018 2019 Number of Holes Drilled
90
77
126
134
201
229
191
94
109
60
Holes Completed as Gas Wells
52
54
91
84
158
168
142
74
76
40
Success Percentage
58%
70%
72%
63%
79%
73%
74%
79%
70%
67%
Number of Operators
25
24
29
28
28
28
28
16
9
9
Wells drilled below 10K’
7
5
7
3
3
0
3
2
2
3
Number of Gas Wells
1,049
1,049
1,070
1121
1199
1313
1422
1408
1353
1331
Total Gas Produced District 6 (Million MCF)
81
82
71
77
82
82
81
75
67
67
Remaining Reserves District 6 (Million MCF)
926
880
823
677
766
784
743
810
858
791
Wellhead Price (PG&E Average)
$2.92
$5.02
$5.38
$7.48
$6.46
$6.62
$8.36
$3.96
$4.32
$4.06

Wells Drilled 2011API # Conf Operator Well S/T/R Field Spud Date Rrdate ABD date Comp Date TD Rig # Dir Class Map
09521326 ABA Energy Corp. "Lee Anne" 6 27/5N/2E MD Lindsey Slough Gas 8/24/2011 9/8/2011 9/26/2011 8950 PG 6 OG 610
10320408 ABA Energy Corp. "VBC" 3 20/23N/3W MD Malton‐Black Butte Gas 9/29/2011 10/12/2011 10/12/2011 5650 PG 2 * OG 622
10120911 C Bright Dot Oil and Gas, LLC "Richter" 1‐8 8/11N/3E MD Karnak Gas 8/23/2011 9/9/2011 10/10/2011 ‐1 PG 5 * OG 617
07720731 Capitol Oil Corp. "Staten Island" 1 33/4N/4E MD River Island Gas 7/29/2011 8/17/2011 8/29/2011 10200 PG 5 OG 610
01120917 Central Valley Gas Strg "C.V.G.S." 1A‐U 25/18N/2W MD Princeton Gas 6/1/2011 6/12/2011 6/12/2011 2525 PG 7 * GS 618
01120925 Central Valley Gas Strg "C.V.G.S." 1‐L 25/18N/2W MD Princeton Gas 6/15/2011 6/29/2011 6/29/2011 3010 PG 7 * GS 618
01120924 Central Valley Gas Strg "C.V.G.S." 2‐L 25/18N/2W MD Princeton Gas 9/18/2011 10/2/2011 10/20/2011 2850 PG 7 * GS 618
01120918 Central Valley Gas Strg "C.V.G.S." 2‐U 25/18N/2W MD Princeton Gas 8/16/2011 8/26/2011 8/26/2011 2325 PG 7 * GS 618
01120919 Central Valley Gas Strg "C.V.G.S." 3‐U 25/18N/2W MD Princeton Gas 7/3/2011 7/13/2011 7/13/2011 2754 PG 7 * GS 618
01120920 Central Valley Gas Strg "C.V.G.S." 4‐U 25/18N/2W MD Princeton Gas 8/30/2011 9/14/2011 9/14/2011 2700 PG 7 * GS 618
01120921 Central Valley Gas Strg "C.V.G.S." 5‐U 25/18N/2W MD Princeton Gas 7/16/2011 7/27/2011 7/27/2011 2644 PG 7 * GS 618
01120923 Central Valley Gas Strg "C.V.G.S." 7U 25/18N/2W MD Princeton Gas 7/27/2011 8/12/2011 8/12/2011 2869 PG 7 * GS 618
09521327 JCG Energy Investors #1, LLC "HNJ Farms" 24‐1 24/8N/1E MD Dixon Gas (ABD) 10/14/2011 10/30/2011 10/29/2011 7370 PG 4 OG 616
09521324 Lodi Gas Storage, LLC. "Lambie" S‐10A 25/4N/1W MD Kirby Hill Gas 4/5/2011 4/18/2011 6/11/2011 2552 PG 7 * GS 612
09521323 Lodi Gas Storage, LLC. "Lambie" S‐2C 25/4N/1W MD Kirby Hill Gas 3/8/2011 3/22/2011 6/13/2011 2480 PG 7 * GS 612
07720733 Lodi Gas Storage, LLC. "Loma" M‐4B 9/4N/7E MD Lodi Gas 10/24/2011 11/8/2011 1/19/2012 3577 PG 7 * GS 611
01120932 C Royale Energy Inc. "Bristol" 1 33/15N/2W MD 9/17/2011 9/29/2011 ‐1 PG 6 * OG 618
01120911 C Royale Energy Inc. "Goddard" 3 7/15N/2W MD 1/7/2011 2/1/2011 2/17/2011 ‐1 PG 6 * CEOP W6‐2
01120912 C Royale Energy Inc. "Hubbard" 1 6/15N/2W MD 2/13/2011 3/6/2011 3/6/2011 ‐1 PG 6 * CEOP W6‐2
01120934 C Royale Energy Inc. "Jewel" 1 18/15N/2W MD 10/16/2011 11/1/2011 ‐1 PG 6 OG 618
01120935 C Royale Energy Inc. "Maximus" 1 6/15N/2W MD 11/8/2011 11/19/2011 11/19/2011 ‐1 PG 6 OG 618
09521325 C Royale Energy Inc. "Uxbridge" 1 5/4N/3E MD Cache Slough Gas 6/12/2011 6/21/2011 6/21/2011 ‐1 PG 4 * OG 610
07720732 Source Energy Corp. "Pacific" 1‐3 3/3N/4E MD River Island Gas 8/28/2011 9/8/2011 10/10/2011 7150 PG 4 OG 610
10320407 Sullivan Drilling Inc. "Pedro" 1 13/23N/5W MD 6/3/2011 9/4/2011 9/4/2011 1000 WW OG W6‐2
01120910 C Venoco Inc. "Baber" 29‐1 29/17N/3W MD 2/10/2011 3/1/2011 5/6/2011 ‐1 Ensign 582 CEOP W6‐2
01120909 Venoco Inc. "Balsdon" 11‐25 25/14N/1W MD Grimes, West, Gas 1/21/2011 2/5/2011 3/29/2011 8996 Ensign 582 OG 618
01120927 Venoco Inc. "Balsdon" 1‐35 35/14N/1W MD Grimes Gas 7/8/2011 8/4/2011 8/4/2011 9453 Ensign 582 OG 618
01120933 Venoco Inc. "Balsdon" 1‐35A 35/14N/1W MD Grimes Gas 8/24/2011 9/13/2011 9/29/2011 9750 Ensign 582 OG 618
10120908 Venoco Inc. "Buttes Community 1" 21‐1 21/16N/1E MD West Butte Gas 7/3/2011 7/13/2011 7/13/2011 4000 Ensign 503 * OG 618
10120906 Venoco Inc. "Buttes Community 1" 34‐8 34/16N/1E MD Sutter Buttes Gas 6/25/2011 7/2/2011 8/1/2011 3760 Ensign 503 * OG 618
10120907 Venoco Inc. "Buttes Community 1" 34‐9 34/16N/1E MD Sutter Buttes Gas 6/10/2011 6/22/2011 7/20/2011 4525 Ensign 503 * OG 618
10120903 Venoco Inc. "Buttes Community 1" 36‐3 2/15N/1E MD Sutter Buttes Gas 3/12/2011 3/24/2011 3/31/2011 5919 Ensign 503 * OG 618
10120899 Venoco Inc. "Buttes Community 1" 402 9/15N/1E MD Sutter Buttes Gas 1/13/2011 1/25/2011 3/4/2011 6625 Ensign 503 OG 618
10120901 Venoco Inc. "Buttes Community 1" 417 34/16N/1E MD Sutter Buttes Gas 3/3/2011 3/11/2011 3/22/2011 5230 Ensign 503 * OG 618
10120891 Venoco Inc. "Buttes Community 1" 419 20/16N/1E MD Sutter Buttes Gas 12/31/2010 1/12/2011 1/21/2011 6400 Ensign 503 OG 618
10120900 Venoco Inc. "Buttes Community 1" 54‐3 34/16N/1E MD Sutter Buttes Gas 1/27/2011 2/5/2011 2/11/2011 5100 Ensign 503 * OG 618
02121035 Venoco Inc. "Carriere" 18‐4 18/19N/1W MD Willows‐Beehive Bend Gas 12/8/2011 12/23/2011 7589 Ensign 582 * OG 620
2012-R. J. Bain, M. F. Cummings

Wells Drilled 2011API # Conf Operator Well S/T/R Field Spud Date Rrdate ABD date Comp Date TD Rig # Dir Class Map
02121036 Venoco Inc. "Carriere" 18‐5 18/19N/1W MD Willows‐Beehive Bend Gas 4/10/2011 4/23/2011 5/10/2011 7593 Ensign 582 * OG 620
10120898 Venoco Inc. "Grimes Operating Unit 32" 14 32/15N/1E MD Grimes Gas 11/6/2011 11/19/2011 12/8/2011 8190 Ensign 582 * OG 618
01120904 Venoco Inc. "Grimes Operating Unit 7" 23 7/14N/1E MD Grimes Gas 11/22/2011 12/4/2011 12/25/2011 8371 Ensign 582 * OG 618
01120905 Venoco Inc. "Grimes Operating Unit 7" 24 7/14N/1E MD Grimes Gas 12/20/2010 1/3/2011 8015 Ensign 582 * OG 618
02121023 Venoco Inc. "Holzapfel" 12‐1 12/22N/4W MD Malton‐Black Butte Gas 1/26/2011 2/5/2011 3/9/2011 5060 PG 7 * OG 622
02121034 Venoco Inc. "Hunt Unit" 13‐1 13/22N/4W MD Malton‐Black Butte Gas 2/8/2011 2/14/2011 3/9/2011 3/8/2011 4589 Ensign 503 * OG 620
01120914 Venoco Inc. "O. P. Davis" B‐47 25/15N/1W MD Sycamore Gas 5/25/2011 6/6/2011 7/5/2011 7895 Ensign 582 * OG 618
01120915 Venoco Inc. "O. P. Davis" B‐48 25/15N/1W MD Sycamore Gas 6/6/2011 6/21/2011 7/7/2011 7935 Ensign 582 * OG 618
01120916 Venoco Inc. "O. P. Davis" B‐49 26/15N/1W MD Sycamore Gas 5/9/2011 5/22/2011 5/22/2011 7980 Ensign 582 * OG 618
10120882 Venoco Inc. "Sanborn" 30‐20 30/15N/1E MD Grimes Gas 1/5/2011 1/17/2011 1/17/2011 8039 Ensign 582 * OG 618
02121046 Venoco Inc. "Sec 49/Sprague Lewis/Doheny LW" 333/20N/2W MD Willows‐Beehive Bend Gas 7/15/2011 7/26/2011 7/26/2011 6498 Ensign 503 * OG 620
02121044 Venoco Inc. "Section 20 Unit" 22 20/20N/2W MD Willows‐Beehive Bend Gas 5/29/2011 6/9/2011 6/8/2011 6180 Ensign 503 * OG 620
02121043 Venoco Inc. "Section 20 Unit" 23 20/20N/2W MD Willows‐Beehive Bend Gas 5/18/2011 5/29/2011 6/23/2011 6333 Ensign 503 * OG 620
02121045 Venoco Inc. "Section 37" 9 21/20N/2W MD Willows‐Beehive Bend Gas 5/5/2011 5/16/2011 5/25/2011 6300 Ensign 503 OG 620
02121039 Venoco Inc. "Section 58 Unit" 24 2/19N/2W MD Willows‐Beehive Bend Gas 4/26/2011 5/7/2011 5/7/2011 7404 Ensign 582 * OG 620
02121047 Venoco Inc. "Section 58" 23 3/19N/2W MD Willows‐Beehive Bend Gas 10/2/2011 10/15/2011 11/1/2011 7855 Ensign 582 OG 620
02121026 Venoco Inc. "Section 60" 26 33/20N/2W MD Willows‐Beehive Bend Gas 12/23/2010 1/2/2011 2/4/2011 6553 Ensign 514 * OG 620
02121030 Venoco Inc. "Section 70 Unit" 19 11/19N/2W MD Willows‐Beehive Bend Gas 2/16/2011 3/1/2011 3/23/2011 7200 Ensign 503 * OG 620
02121040 Venoco Inc. "Section 70 Unit" 20 11/19N/2W MD Willows‐Beehive Bend Gas 4/21/2011 5/3/2011 5/13/2011 6913 Ensign 503 * OG 620
02121048 Venoco Inc. "Section 70" 21 11/19N/2W MD Willows‐Beehive Bend Gas 7/28/2011 8/10/2011 8/18/2011 7235 Ensign 503 OG 620
02121031 Venoco Inc. "Sprague Lewis" 13 34/20N/2W MD Willows‐Beehive Bend Gas 1/11/2011 1/22/2011 2/4/2011 6784 PG 7 * OG 620
02121037 Venoco Inc. "Sprague Lewis" 14 34/20N/2W MD Willows‐Beehive Bend Gas 3/27/2011 4/8/2011 4/20/2011 7150 Ensign 503 OG 620
02121038 Venoco Inc. "Sprague Lewis" 16 33/20N/2W MD Willows‐Beehive Bend Gas 4/10/2011 4/20/2011 5/3/2011 7100 Ensign 503 OG 620
01120928 Venoco Inc. "Strain" 2‐1 35/14N/1W MD Grimes, West, Gas 9/16/2011 9/29/2011 11/30/2011 8866 Ensign 582 OG 618
01120913 Venoco Inc. "Strain" 3‐1 3/13N/1W MD 3/4/2011 3/16/2011 3/16/2011 5039 Ensign 582 * CEOP 618
01120926 Venoco Inc. "Strain" 3‐1A 3/13N/1W MD 3/21/2011 4/6/2011 4/6/2011 9017 Ensign 582 * CEOP 618
01120930 Venoco Inc. "Strain" 35‐2 35/14N/1W MD Grimes, West, Gas 8/7/2011 8/21/2011 11/15/2011 9000 Ensign 582 OG 618
02121050 C Venoco Inc. "Transamerica" 6‐1 6/18N/2W MD 8/11/2011 8/19/2011 9/7/2011 ‐1 Ensign 503 CEOP 620
10120905 Venoco Inc. "Unit 31" 8 31/15N/1E MD Grimes Gas 6/24/2011 7/6/2011 9/22/2011 8172 Ensign 582 * OG 618
02121053 Venoco Inc. "Whyler Trust" 69‐1 13/19N/2W MD Willows‐Beehive Bend Gas 10/18/2011 11/3/2011 11/30/2011 8000 Ensign 582 OG 620
06720515 Vintage Prod California LLC "RVGU" 304H 29/4N/3E MD Rio Vista Gas 10/17/2011 11/14/2011 12/4/2011 7114 Ensign 561 * OG 610
06720513 Vintage Prod California LLC "Wilcox" 18 32/4N/3E MD Rio Vista Gas 9/1/2011 9/20/2011 10/1/2011 10024 Ensign 561 OG 610
06720514 Vintage Prod California LLC "Wilcox" 20 32/4N/3E MD Rio Vista Gas 9/25/2011 10/12/2011 10/20/2011 10104 Ensign 561 OG 610
06720517 Vintage Prod California LLC "wilcox" 22 32/4N/3E MD Rio Vista Gas 11/19/2011 12/2/2011 12/22/2011 6870 H&P 442 OG 610
00720111 Wild Goose Storage LLC "Wild Goose Gas Unit 2" WG33HZ 17/17N/1E MD Wild Goose Gas 4/28/2011 5/13/2011 5/13/2011 3600 PG 7 GS 620
00720112 Wild Goose Storage LLC "Wild Goose Gas Unit 2" WG34HZ 17/17N/1E MD Wild Goose Gas 5/15/2011 5/28/2011 5/28/2011 3542 PG 7 * GS 620
2012-R. J. Bain, M. F. Cummings
Sacramento
Oroville
Marysville
Lodi
Stockton
Rio Vista
Knights Landing
Tracy
Brentwood
Davis
Woodland
Arbuckle
Grimes
Fairfield
Vacaville
Vallejo
Walnut Creek
Concord
Esparto
Orland
Willows
Corning
San Rafael
San Francisco
Berkeley
Santa Rosa
8910 7 56 34 2 1W
25
18
19
20
21
22
24
23
8
15
12
10
1N
1E 32
9
7
6
5
4
3
2
54 6 7 8 9 10
6 32
2
1W 1E2347 54 6 7 8 9 10
1S
17
16
14
13
11
1/11/11/11/11/11/11/11/11/1
5/45/45/45/45/45/45/45/45/42/22/22/22/22/22/22/22/22/2 1/11/11/11/11/11/11/11/11/11/11/11/11/11/11/11/11/11/1
1/11/11/11/11/11/11/11/11/1
1/01/01/01/01/01/01/01/01/0
1/11/11/11/11/11/11/11/11/1
2/02/02/02/02/02/02/02/02/0
2/22/22/22/22/22/22/22/22/25/45/45/45/45/45/45/45/45/4
5/45/45/45/45/45/45/45/45/43/23/23/23/23/23/23/23/23/25/35/35/35/35/35/35/35/35/3
6/56/56/56/56/56/56/56/56/5
2/22/22/22/22/22/22/22/22/21/11/11/11/11/11/11/11/11/1
9/89/89/89/89/89/89/89/89/8
2/22/22/22/22/22/22/22/22/26/56/56/56/56/56/56/56/56/5
8/68/68/68/68/68/68/68/68/6
2/12/12/12/12/12/12/12/12/1
1/11/11/11/11/11/11/11/11/11/01/01/01/01/01/01/01/01/0Drilling Activity
By Township & Range
No. of Holes Drilled
6 / 4
No. of Completions
2011
R. J. Bain & M. F. Cummings 2/2012