sabmiller plc interims f10 results announcement - 19 november 2009€¦ · · 2018-04-05interim...
TRANSCRIPT

Interim Announcement 19 November 2009
STRONG UNDERLYING OPERATIONAL PERFORMANCE
SABMiller plc, one of the world’s leading brewers with operations and distribution agreements across six continents, today reports its interim (unaudited) results for the six months to 30 September 2009.
Operational Highlights • Lager volumes decrease 1% on an organic basis with growth in Africa and Asia offset by weaker volumes
in other markets • Reported group revenue down 6% and reported EBITA down 2% impacted by weakness of our major
operating currencies against the US dollar compared with the same period last year • Firm pricing and cost efficiency drives organic, constant currency group revenue growth of 3%, EBITA
growth of 11% and margin growth of 110 bps • EBITA on an organic, constant currency basis increases across all regions despite mixed volume
performance: - Pricing benefits and cost efficiencies in Latin America drive excellent EBITA(1) growth of 33% - Solid pricing in Europe supports a 5% increase in EBITA(1) despite volume decline - North America EBITA(1) grows 7% as cost synergies are realised - Africa EBITA(1) up 15%, driven by volume growth and pricing - Asia EBITA(1) up 29% as CR Snow volumes in China grow at more than double the market rate - South Africa Beverages EBITA(1) up 4% despite weaker consumer spending and increased marketing
spend • Free cash flow(2) improves by US$1,124 million compared with the prior year period (1) EBITA growth is shown on an organic, constant currency basis. (2) As defined in the Financial Definitions section. See also note 9b.
Sept 2009
Sept 2008
March 2009
US$m US$m % change US$m
Group revenue (a) 13,355 14,222 (6) 25,302
Revenue (b) (excludes associates’ and joint ventures’ revenue) 8,846 11,166 (21) 18,703
EBITA (c) 2,187 2,225 (2) 4,129
Adjusted profit before tax (d) 1,920 1,860 3 3,405
Profit before tax(e) 1,498 2,020 (26) 2,958
Adjusted earnings (f) 1,236 1,128 10 2,065
Adjusted earnings per share - US cents 80.0 75.2 6 137.5 - UK pence 49.9 38.9 28 79.7 - SA cents 648.9 585.8 10 1,218.6
Basic earnings per share (US cents) 63.0 94.8 (34) 125.2
Interim dividend per share (US cents) 17.0 16.0 6
a) Group revenue includes the attributable share of associates’ and joint ventures’ revenue of US$4,509 million (i.e. including MillerCoors’ revenue) (2008: US$3,056 million).
b) Revenue excludes the attributable share of associates’ and joint ventures’ revenue. 2009 is not comparable with 2008 as MillerCoors’ revenue is not included in 2009, although Miller Brewing Company’s revenue is included in 2008.
c) Note 2 provides a reconciliation of operating profit to EBITA which is defined as operating profit before exceptional items and amortisation of intangible assets (excluding software) but includes the group’s share of associates’ and joint ventures’ operating profit, on a similar basis. EBITA is used throughout the interim announcement.
d) Adjusted profit before tax comprises EBITA less adjusted net finance costs of US$253 million (2008: US$358 million) and share of associates’ and joint ventures’ net finance costs of US$14 million (2008: US$7 million).
e) Profit before tax includes exceptional charges of US$239 million (2008: exceptional credits of US$371 million). f) A reconciliation of adjusted earnings to the statutory measure of profit attributable to equity shareholders is provided in note 5.

2 CHIEF EXECUTIVE’S REVIEW
Graham Mackay, Chief Executive of SABMiller, said:
"In some of the toughest economic conditions seen for decades, we have continued to take share in a number of markets. The weakness of our major operating currencies against the US dollar has affected reported results, but we have continued to generate a strong underlying performance. The actions we have taken to position our business globally, to invest in brands and to develop our operational capabilities will continue to underpin our long term growth.”
September Organic, constant 2009 Reported currency
EBITA growth growth US$m % %
Latin America 566 19 33 Europe 590 (19) 5 North America 379 7 7 Africa 246 3 15 Asia 90 24 29 South Africa: Beverages 333 0 4 South Africa: Hotels and Gaming 53 (12) (16) Corporate (70) - -Group 2,187 (2) 11
Business review
Our underlying performance has been strong although difficult trading conditions persisted across most markets. Lager volumes were down 1% on an organic basis, but our market execution and the strength of our brands enabled us to continue to gain share across many of our key markets. Group revenue increased by 3% organically in constant currency, supported by price increases taken predominantly in the second half of the prior year.
Despite the slight decline in volumes, EBITA performance was strong, growing 11% on an organic, constant currency basis with the group’s EBITA margin improving 110 basis points (bps) to 16.8%. The benefits of falling commodity prices are not yet fully reflected in our costs, due to the long term nature of our raw material supply contracts and the relative strength of the US dollar in which many of these contracts are priced. Greater efficiencies in our marketing spend, combined with cost reductions and restructuring in certain markets, continued to benefit our cost base. On a reported basis, EBITA of US$2,187 million declined 2% reflecting significantly weaker operating currencies against the US dollar compared to the same period in the prior year.
Although reported EBITA was lower, adjusted earnings grew 10% due to lower finance charges and reduced profit attributable to minority interests following the purchase of the 28.1% minority interest in our Polish subsidiary Kompania Piwowarska in May 2009 in exchange for the issue of 60 million ordinary shares. The group’s effective tax rate for the period was 29.4%, compared with 31.0% in the same period in the prior year.
Free cash flow of US$998 million showed an improvement of US$1,124 million compared to the same period last year. Capital expenditure was US$517 million lower than in the prior year period following the completion of several major investments. Improved working capital management delivered cash inflow of US$300 million, US$638 million better than in the prior year period. Normalised EBITDA margin, including both dividends and revenue from MillerCoors, improved 30 bps during the period.
The group’s gearing ratio at 30 September reduced to 47.0% from 54.0% (restated) at the previous year end. An interim dividend of 17 US cents per share, up 1 US cent from the prior year, will be paid to shareholders on 11 December 2009.

3 CHIEF EXECUTIVE’S REVIEW (continued)
� In Latin America, despite local currency devaluation, EBITA grew 19% (33% on an organic, constant currency basis) reflecting strong pricing, principally in the second half of the prior year, and cost reduction. Lager volumes fell 1% as economic pressures, combined with political and social unrest in some countries, impacted beer markets across the region. We continued to focus on expanding the appeal, availability and affordability of the beer category. In Colombia, lager volumes were 2% below the prior year period which benefited from increased sales in September 2008 ahead of a 1 October price increase. Our share of the alcohol market continued to increase aided by strong performance of our premium brands. Against prior year comparative growth of 10%, Peru’s lager volumes declined 2%, but market share increased in a market that declined 7%.
� In Europe, lager volumes declined 6% on an organic basis, with depressed consumer spending leading to a contraction in beer consumption across the region. With key exchange rates much weaker than last year, EBITA declined 19% but grew 5% on an organic, constant currency basis. Strong pricing drove organic, constant currency revenue per hectolitre growth of 6% and further cost efficiencies more than offset higher depreciation and a 2% increase in variable production costs. We gained market share in Poland, Romania and the UK, with strong momentum behind key brands. In the Czech Republic volume share declined marginally, consistent with our value oriented strategy, and in Russia both volumes and market share fell, reflecting down-trading in the market and our focus on the premium segment.
� North America delivered reported EBITA growth of 7% despite lager volumes 5% below those reported last year. On a pro forma1 basis, MillerCoors US domestic volume sales to retailers (STRs) were down 1% for the half year driven by a slight decline in premium light volumes and continued softness in above premium and premium brands. Domestic sales to wholesalers (STWs) were down 1% on a pro forma basis. Strong revenue and cost management, and continued synergy delivery drove a 22% increase in MillerCoors EBITA on a pro forma basis.
� Africa lager volumes grew 3% on an organic basis with Uganda, Zambia and Mozambique all reporting good growth. However, soft economic conditions contributed to reduced volumes in Tanzania, and Botswana continued to be impacted by the 30% social levy on alcoholic beverages imposed in November 2008. Soft drink volumes grew 5% on an organic basis reflecting robust performance across the region. EBITA grew 3%, held back by local currency weakness, but rose 15% on an organic, constant currency basis assisted by firm pricing. We continue to implement our full beverage portfolio strategy, acquiring a water business in Ethiopia and a non-alcoholic beverage business in Zambia. New local premium lager beers were introduced in five markets. Capacity expansion projects in Uganda and Ghana have recently been completed, as has a new brewery in Southern Sudan. New plants in Tanzania, Mozambique and Angola will be commissioned shortly.
� Asia lager volumes grew 9% on an organic basis and organic, constant currency EBITA grew 29%, while reported EBITA was up 24%. This reflected a strong performance from CR Snow, our associate in China, which increased lager volumes by 15% in a market which grew by 6%. Significant share gains were achieved in the key provinces of Anhui and Zhejiang, driven by the success of the Snow brand. In Australia, our joint venture enjoyed strong growth in a flat market, driven by Peroni Nastro Azzurro, Miller Genuine Draft and Bluetongue. India experienced a difficult first half, with volumes declining 21%, largely as a result of regulatory issues in the key states of Andhra Pradesh and Uttar Pradesh.
1 MillerCoors pro forma figures are based on results for Miller’s and Coors’ US and Puerto Rico operations reported under International Financial Reporting Standards (IFRS) and US GAAP respectively for the six months ended 30 September 2008. Adjustments have been made to reflect both companies’ comparative data on a similar basis including amortisation of definite-life intangible assets, depreciation reflecting revisions to property, plant and equipment values and the exclusion of exceptional items.

4 CHIEF EXECUTIVE’S REVIEW (continued)
� Lager volumes in South Africa declined by 3%, impacted by generally weak consumer spending. As expected, our year on year market share fell. EBITA was flat due to adverse exchange rates; however on a constant currency basis grew 4%. Group revenue increased by 6% on a constant currency basis, benefiting from the price increases implemented in the prior year, more than offsetting higher input costs. Fixed cost savings helped fund a substantial increase in sales and marketing investment in the beer business, with the core of the lager brand portfolio strengthened by new advertising campaigns and sponsorship of the Confederations Football Cup and the Lions rugby tour. Soft drinks volumes were down 2%, in line with the market. On 1 July, we announced preliminary details of a proposed broad-based black economic empowerment transaction in South Africa. This will benefit employees, soft drink and liquor retailers and the wider South African community by enabling them to participate in the equity of The South African Breweries Limited.
� The group has begun a major business capability programme that will simplify processes, reduce costs and allow local management teams to enhance focus on their markets. Finance, human resources and procurement activities will be streamlined by deploying global information systems, establishing a global procurement operation and selectively outsourcing certain activities. Sales, distribution and supply chain management processes will also be enhanced and moved onto common, regional systems platforms. The programme is expected to take four years to complete with spend weighted to the start of the programme. Exceptional costs of approximately US$370 million will be recognised in the current year's income statement (US$187 million in the first half) with costs lowering progressively by approximately 40% year on year in each of the financial years 2011 to 2013. In addition to non-financial benefits, we expect cost and efficiency savings rising to approximately US$300 million per annum by the 2014 financial year and working capital inflows of approximately US$350 million which will largely be realised in the financial years 2010 to 2012.
Outlook
Overall, we expect the current trading conditions to continue in the second half, as unemployment, retail spending and other consumer indicators lag the reported stabilisation of GDP in many of our markets.
Our operational performance continues to be driven by the unique strength of our local brand portfolios which have enabled market share gains in spite of the significant price increases taken in the prior year. Price rises will moderate in the coming months compared with last year. The margin trend delivered in the first half will be affected over the remainder of the year as the price increases and cost efficiencies achieved in the prior year are cycled. Input costs continue to be affected by existing contractual obligations but will begin to ease towards the end of this year.
We expect second half reported results to benefit from favourable currency movements, provided our major operating currencies remain at or near current exchange rates to the US dollar. The group’s financial position remains strong and we are well positioned to take advantage of future improvements in the market environment.
Enquiries: SABMiller plc Tel: +44 20 7659 0100
Sue Clark Director of Corporate Affairs Tel: +44 20 7659 0184 Gary Leibowitz Senior Vice President, Investor Relations Tel: +44 20 7659 0119 Nigel Fairbrass Head of Media Relations Mob: +44 7799 894265
A live audiocast of the management presentation to the investment community will begin at 9.30am (GMT) on 19 November 2009. Access details for this audiocast, video interviews with management and copies of this announcement and the slide presentation are
available on the SABMiller plc website at www.sabmiller.com
Images: Our media image library has a large selection of images for use in print and digital media. Visit www.sabmiller.com/imagelibrary
Broadcast footage: Our broadcast footage library has stock footage for media organisations to view and download for use in TV programmes or news websites. Visit www.sabmiller.com/broadcastfootage
Copies of the press release and detailed Interim Announcement are available from the Company Secretary at the Registered Office, or from 2 Jan Smuts Avenue, Johannesburg, South Africa.
5 CHIEF EXECUTIVE’S REVIEW (continued)
Operational review
Latin America
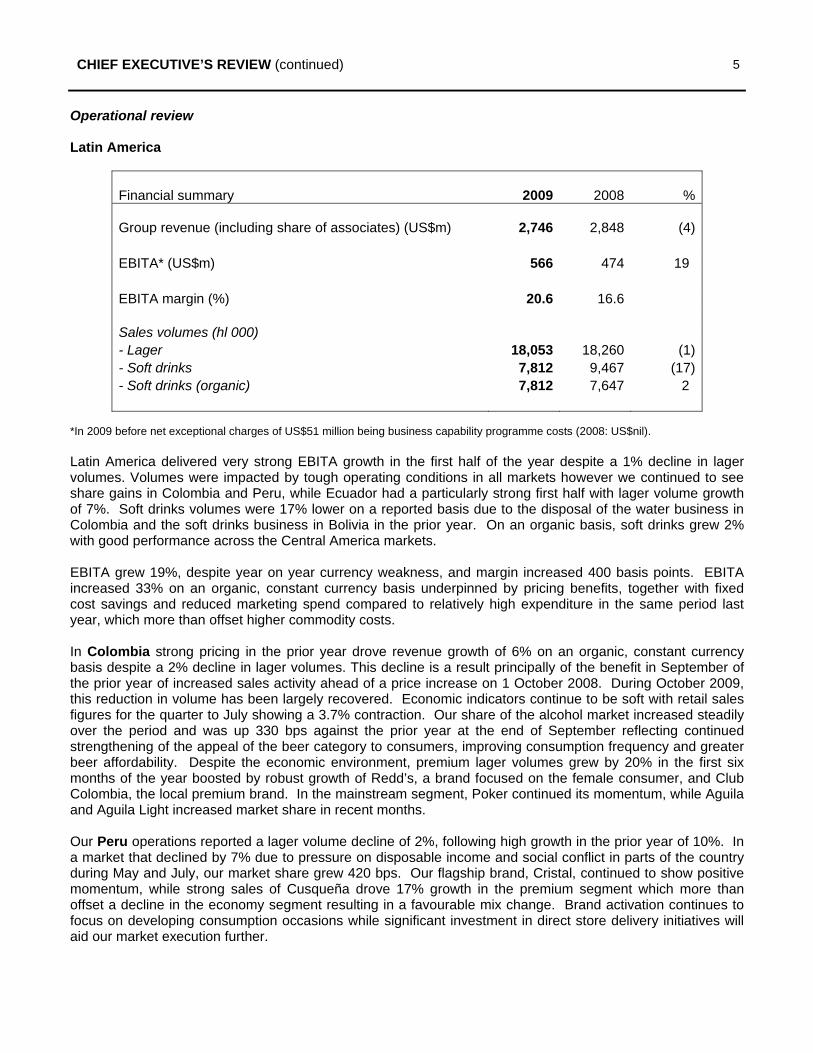
Financial summary 2009 2008 %
Group revenue (including share of associates) (US$m) 2,746 2,848 (4)
EBITA* (US$m) 566 474 19
EBITA margin (%) 20.6 16.6
Sales volumes (hl 000) - Lager 18,053 18,260 (1) - Soft drinks 7,812 9,467 (17) - Soft drinks (organic) 7,812 7,647 2
*In 2009 before net exceptional charges of US$51 million being business capability programme costs (2008: US$nil).
Latin America delivered very strong EBITA growth in the first half of the year despite a 1% decline in lager volumes. Volumes were impacted by tough operating conditions in all markets however we continued to see share gains in Colombia and Peru, while Ecuador had a particularly strong first half with lager volume growth of 7%. Soft drinks volumes were 17% lower on a reported basis due to the disposal of the water business in Colombia and the soft drinks business in Bolivia in the prior year. On an organic basis, soft drinks grew 2% with good performance across the Central America markets.
EBITA grew 19%, despite year on year currency weakness, and margin increased 400 basis points. EBITA increased 33% on an organic, constant currency basis underpinned by pricing benefits, together with fixed cost savings and reduced marketing spend compared to relatively high expenditure in the same period last year, which more than offset higher commodity costs.
In Colombia strong pricing in the prior year drove revenue growth of 6% on an organic, constant currency basis despite a 2% decline in lager volumes. This decline is a result principally of the benefit in September of the prior year of increased sales activity ahead of a price increase on 1 October 2008. During October 2009, this reduction in volume has been largely recovered. Economic indicators continue to be soft with retail sales figures for the quarter to July showing a 3.7% contraction. Our share of the alcohol market increased steadily over the period and was up 330 bps against the prior year at the end of September reflecting continued strengthening of the appeal of the beer category to consumers, improving consumption frequency and greater beer affordability. Despite the economic environment, premium lager volumes grew by 20% in the first six months of the year boosted by robust growth of Redd’s, a brand focused on the female consumer, and Club Colombia, the local premium brand. In the mainstream segment, Poker continued its momentum, while Aguila and Aguila Light increased market share in recent months.
Our Peru operations reported a lager volume decline of 2%, following high growth in the prior year of 10%. In a market that declined by 7% due to pressure on disposable income and social conflict in parts of the country during May and July, our market share grew 420 bps. Our flagship brand, Cristal, continued to show positive momentum, while strong sales of Cusqueña drove 17% growth in the premium segment which more than offset a decline in the economy segment resulting in a favourable mix change. Brand activation continues to focus on developing consumption occasions while significant investment in direct store delivery initiatives will aid our market execution further.
6 CHIEF EXECUTIVE’S REVIEW (continued)
Ecuador delivered robust sales growth with a 7% increase in lager volumes. This performance was supported by growth in consumer disposable income, following an increase in the minimum wage, combined with improved in-market execution and brand activation at the point of purchase. Expanded route to market penetration grew outlet reach by 6% during the period, increasing our customer base by 6,600 new customers. The performance of our premium brand, Club, continues to be strong with growth of over 50%, following the introduction of a new 550ml pack in 2009. Our principal mainstream brand, Pilsener, continued to capitalise on its strong brand equity and increased consumption frequency.
Lager volumes in Panama grew by 2% although market share fell. A decline in our mainstream brand Atlas was partly offset by strong growth in our Balboa brand and the doubling of volume in our premium brands. The soft drinks category delivered strong growth in the period supported by the successful re-launch of Malta Vigor in a new pack.
In Honduras, total volumes for the first half ended level with the prior year. In spite of difficult trading conditions, beer share of alcohol increased substantially during the period. Lager volumes declined by 16% as a result of curfews and dry laws implemented during the political turmoil, offset by increased sparkling soft drinks sales as consumers stocked up for home and family consumption. Our operation continued trading throughout the disruption in the country.
In El Salvador domestic sparkling soft drinks volumes increased by 7% and we maintained market share during the period. Lager volumes were level with the prior year, with a 7% decline in domestic volumes offset by increased export volumes. Pricing gains and improved lager mix benefited revenue.
7 CHIEF EXECUTIVE’S REVIEW (continued)
Europe
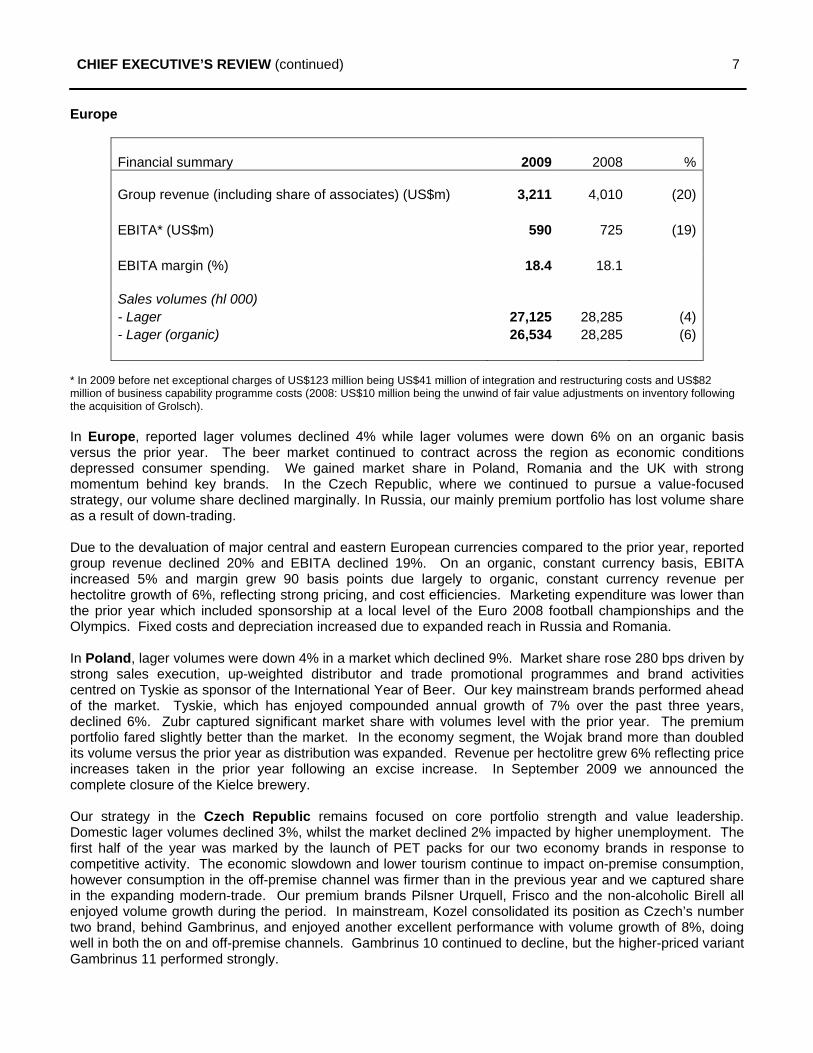
Financial summary 2009 2008 %
Group revenue (including share of associates) (US$m) 3,211 4,010 (20)
EBITA* (US$m) 590 725 (19)
EBITA margin (%) 18.4 18.1
Sales volumes (hl 000) - Lager 27,125 28,285 (4) - Lager (organic) 26,534 28,285 (6)
* In 2009 before net exceptional charges of US$123 million being US$41 million of integration and restructuring costs and US$82 million of business capability programme costs (2008: US$10 million being the unwind of fair value adjustments on inventory following the acquisition of Grolsch).
In Europe, reported lager volumes declined 4% while lager volumes were down 6% on an organic basis versus the prior year. The beer market continued to contract across the region as economic conditions depressed consumer spending. We gained market share in Poland, Romania and the UK with strong momentum behind key brands. In the Czech Republic, where we continued to pursue a value-focused strategy, our volume share declined marginally. In Russia, our mainly premium portfolio has lost volume share as a result of down-trading.
Due to the devaluation of major central and eastern European currencies compared to the prior year, reported group revenue declined 20% and EBITA declined 19%. On an organic, constant currency basis, EBITA increased 5% and margin grew 90 basis points due largely to organic, constant currency revenue per hectolitre growth of 6%, reflecting strong pricing, and cost efficiencies. Marketing expenditure was lower than the prior year which included sponsorship at a local level of the Euro 2008 football championships and the Olympics. Fixed costs and depreciation increased due to expanded reach in Russia and Romania.
In Poland, lager volumes were down 4% in a market which declined 9%. Market share rose 280 bps driven by strong sales execution, up-weighted distributor and trade promotional programmes and brand activities centred on Tyskie as sponsor of the International Year of Beer. Our key mainstream brands performed ahead of the market. Tyskie, which has enjoyed compounded annual growth of 7% over the past three years, declined 6%. Zubr captured significant market share with volumes level with the prior year. The premium portfolio fared slightly better than the market. In the economy segment, the Wojak brand more than doubled its volume versus the prior year as distribution was expanded. Revenue per hectolitre grew 6% reflecting price increases taken in the prior year following an excise increase. In September 2009 we announced the complete closure of the Kielce brewery.
Our strategy in the Czech Republic remains focused on core portfolio strength and value leadership. Domestic lager volumes declined 3%, whilst the market declined 2% impacted by higher unemployment. The first half of the year was marked by the launch of PET packs for our two economy brands in response to competitive activity. The economic slowdown and lower tourism continue to impact on-premise consumption, however consumption in the off-premise channel was firmer than in the previous year and we captured share in the expanding modern-trade. Our premium brands Pilsner Urquell, Frisco and the non-alcoholic Birell all enjoyed volume growth during the period. In mainstream, Kozel consolidated its position as Czech’s number two brand, behind Gambrinus, and enjoyed another excellent performance with volume growth of 8%, doing well in both the on and off-premise channels. Gambrinus 10 continued to decline, but the higher-priced variant Gambrinus 11 performed strongly.
8 CHIEF EXECUTIVE’S REVIEW (continued)
Domestic revenue per hectolitre growth was 3%, despite negative sales mix. Efficiency in marketing investment, together with ongoing overhead cost savings, drove an improvement in constant currency EBITA.
Following strong comparative growth of 24%, lager volumes in Romania fell 12% in a market that declined 16% impacted severely by the economic crisis. The latest IMF forecast shows a downward revision to GDP and the Romanian economy is now expected to contract by 8.5% this year. In this context we continued to grow our market share, which increased by 140bps over the period. Encouragingly our mainstream brand, Timisoreana, continued its strong performance, with volume growth of 1%, notwithstanding comparative growth of 31% in the prior year, and took significant market share. The on-premise channel declined sharply leading to a marked decline in premium volumes with the Ursus brand well down despite gaining share of the segment. The integration of the Azuga business was completed during the period and we closed its brewery, as planned. A new campaign to renovate the Azuga economy brand was launched in August. Revenue per hectolitre is up 10% following above-inflation price increases in the prior year and pricing taken in July of this year.
In Russia, a sharp decline in consumer disposable income led to an 8% drop in industry beer production. STRs were down 7%, approximately in line with the market. Our STW volumes were down 12% reflecting significant trade destocking. Down-trading is a feature of the market and our super premium and premium portfolio has therefore been disproportionately affected. Despite this, our premium value share in Moscow grew 140 bps. On the back of our geographic expansion strategy, we have launched the Tri Bogatyrya economy brand in a new PET format leading to growth of almost 60%. This brand mix partially diluted the strong pricing taken in the prior year but we still achieved revenue per hectolitre growth of 6%. In May 2009, we opened the new brewery in Ulyanovsk. In the Ukraine the Sarmat brand has been re-launched and licensed production of Zolotaya Bochka and Kozel has commenced.
In Italy, economic conditions are still adverse but consumer confidence is starting to improve. Birra Peroni volumes declined 9% during the period as we reduced our reliance on promoted volume and focused on value. On a STR basis we have grown our market share in both volume and value. Profitability improved through efficiencies in both production and marketing.
Domestic lager volumes in the Netherlands declined 8% and market share was marginally down. This intensely competitive beer market has resulted in difficult conditions in the off-premise channel; however recent trends are positive in the on-premise channel which is now cycling the smoking ban introduced in July 2008. Restructuring initiatives taken in the prior year are beginning to show benefits.
In the United Kingdom, lager volumes grew 15% on a like for like basis, underpinned by Peroni Nastro Azzurro growth of 35%. During the period, exports of Miller Genuine Draft to Eire were taken over by our UK business following the termination of the previous licensing arrangement. Our European import business, which serves Western European markets including Germany, Spain and France, continued to exhibit strong growth driven by Grolsch and Pilsner Urquell. In Hungary, Slovakia and the Canaries, economic conditions remain severe and the beer markets depressed.
9 CHIEF EXECUTIVE’S REVIEW (continued)
North America
Financial summary 2009 2008 %
Group revenue (including share of joint ventures) (US$m)
EBITA* (US$m)
EBITA margin (%)
Sales volumes (hl 000) - Lager – excluding contract brewing - Soft drinks
MillerCoors’ volumes - Lager – excluding contract brewing - Sales to retailers (STRs) - Contract brewing
2,870
379
13.2
24,116 22
23,370 23,179
2,456
2,9161
3551
12.21
25,2821
391
23,5912
23,4192
2,6032
(2)
7
(5) (42)
(1) (1) (6)
* In 2009 before net exceptional charges of US$11 million being the group’s share of MillerCoors’ integration and restructuring costs of US$7 million and the group’s share of the unwind of the fair value inventory adjustment of US$4 million (2008: net exceptional credit of US$390 million being US$437 million profit on the deemed disposal of the Miller business and exceptional costs of US$23 million in relation to the exceptional credit of integration and restructuring costs for MillerCoors, together with the group’s share of MillerCoors’ integration and restructuring costs of US$17 million and the group’s share of the unwind of the fair value inventory adjustment of US$7 million).1 Volumes, group revenue and EBITA represent 100% of Miller Brewing Company performance in the first quarter of the half year ended 30 September 2008 and the group’s 58% share of MillerCoors’ performance and the retained wholly owned Miller Brewing Company business (principally Miller Brewing International) for the balance of the period.2 MillerCoors pro forma figures are based on results for Miller’s and Coors’ US and Puerto Rico operations reported under International Financial Reporting Standards (IFRS) and US GAAP respectively for the six months ended 30 September 2008. Adjustments have been made to reflect both companies’ comparative data on a similar basis including amortisation of definite-life intangible assets, depreciation reflecting revisions to property, plant and equipment values and the exclusion of exceptional items.
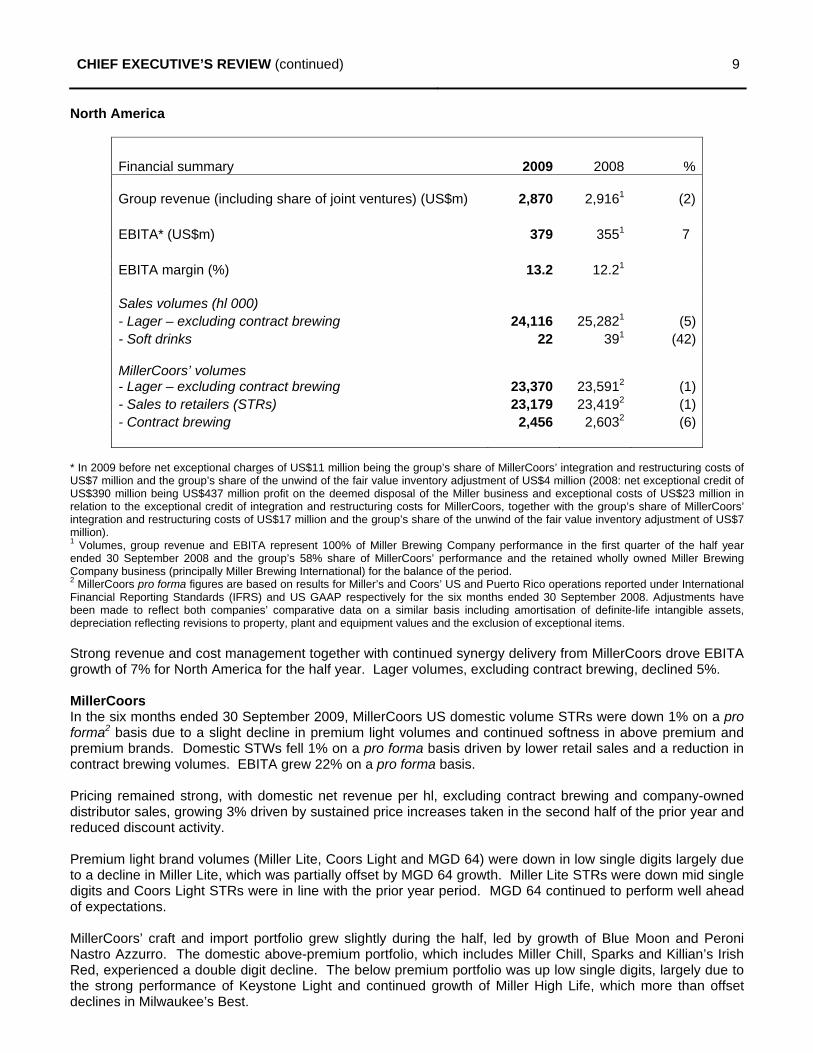
Strong revenue and cost management together with continued synergy delivery from MillerCoors drove EBITA growth of 7% for North America for the half year. Lager volumes, excluding contract brewing, declined 5%.
MillerCoors In the six months ended 30 September 2009, MillerCoors US domestic volume STRs were down 1% on a pro forma2 basis due to a slight decline in premium light volumes and continued softness in above premium and premium brands. Domestic STWs fell 1% on a pro forma basis driven by lower retail sales and a reduction in contract brewing volumes. EBITA grew 22% on a pro forma basis.
Pricing remained strong, with domestic net revenue per hl, excluding contract brewing and company-owned distributor sales, growing 3% driven by sustained price increases taken in the second half of the prior year and reduced discount activity.
Premium light brand volumes (Miller Lite, Coors Light and MGD 64) were down in low single digits largely due to a decline in Miller Lite, which was partially offset by MGD 64 growth. Miller Lite STRs were down mid single digits and Coors Light STRs were in line with the prior year period. MGD 64 continued to perform well ahead of expectations.
MillerCoors’ craft and import portfolio grew slightly during the half, led by growth of Blue Moon and Peroni Nastro Azzurro. The domestic above-premium portfolio, which includes Miller Chill, Sparks and Killian’s Irish Red, experienced a double digit decline. The below premium portfolio was up low single digits, largely due to the strong performance of Keystone Light and continued growth of Miller High Life, which more than offset declines in Milwaukee’s Best.
10 CHIEF EXECUTIVE’S REVIEW (continued)
Cost of goods sold increased as benefits from MillerCoors’ cost leadership programmes were more than offset by brewing and packaging materials cost increases under procurement contracts largely arranged prior to the softening in recent commodity prices.
Marketing, general and administrative costs decreased driven primarily by lower organisational costs and synergies, partially offset by IT integration-related expenses.
MillerCoors achieved US$133 million in synergies in the six months to 30 September 2009, largely within marketing and more broadly from the elimination of duplicate and transitional positions. Network optimisation savings continue to be realised from shifting production of Coors and Miller brands within the larger MillerCoors brewery network, a process which will continue for the next nine months. MillerCoors continued to integrate business processes and systems across the enterprise to improve customer service and capitalise on the scale of the business.
MillerCoors has delivered a total of US$211 million in cost savings since beginning operations on 1 July 2008, and now expects to achieve US$335 million of cumulative synergies by the end of our current financial year, surpassing its original commitment of US$312 million. As previously communicated, MillerCoors will deliver incremental cost savings of US$200 million above its US$500 million synergy target, and these are expected to be delivered by the end of 2012, broadly in line with current market expectations. These cost savings include efficiencies in production costs, procurement, and marketing, general and administrative expenses.
11 CHIEF EXECUTIVE’S REVIEW (continued)
Africa
Financial summary 2009 2008 %
Group revenue (including share of associates) (US$m) 1,263 1,350 (6)
EBITA* (US$m) 246 239 3
EBITA margin (%) 19.5 17.7
Sales volumes (hl 000) - Lager 6,392 6,203 3 - Lager (organic) 6,379 6,203 3 - Soft drinks 5,037 4,084 23 - Soft drinks (organic) 4,275 4,084 5 - Other alcoholic beverages 1,978 2,091 (5)
*In 2009 before net exceptional costs of US$4 million being business capability programme costs (2008: US$nil).
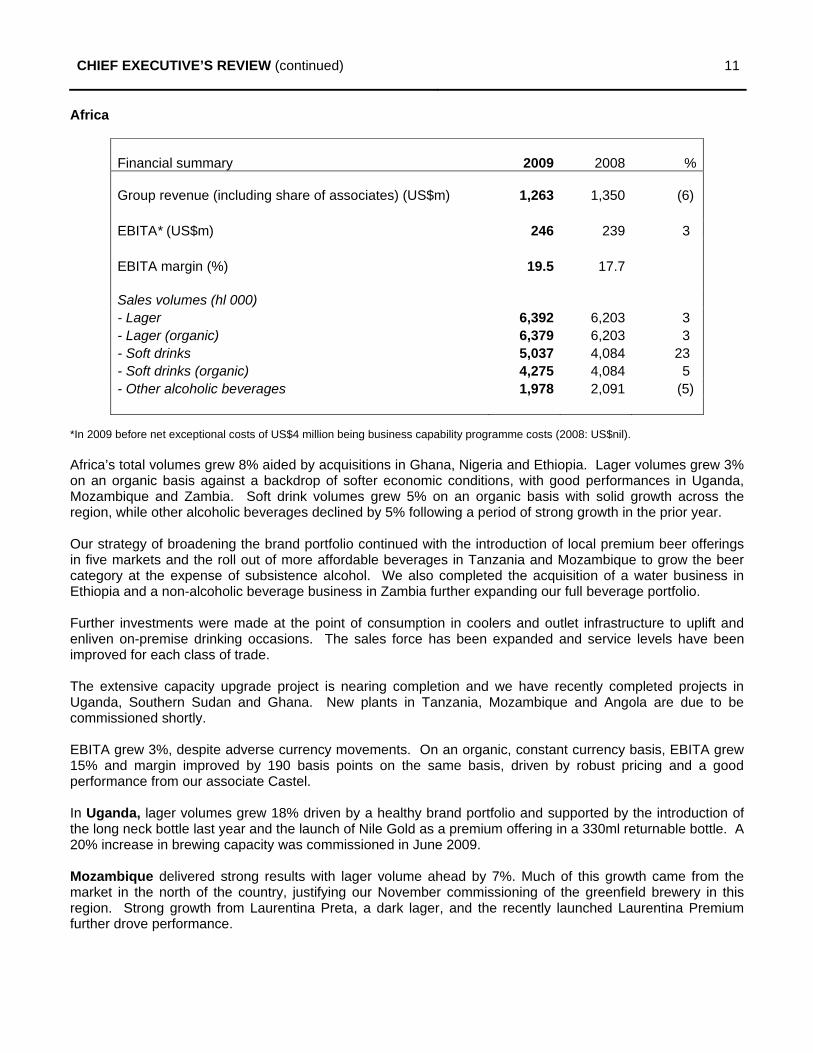
Africa’s total volumes grew 8% aided by acquisitions in Ghana, Nigeria and Ethiopia. Lager volumes grew 3% on an organic basis against a backdrop of softer economic conditions, with good performances in Uganda, Mozambique and Zambia. Soft drink volumes grew 5% on an organic basis with solid growth across the region, while other alcoholic beverages declined by 5% following a period of strong growth in the prior year.
Our strategy of broadening the brand portfolio continued with the introduction of local premium beer offerings in five markets and the roll out of more affordable beverages in Tanzania and Mozambique to grow the beer category at the expense of subsistence alcohol. We also completed the acquisition of a water business in Ethiopia and a non-alcoholic beverage business in Zambia further expanding our full beverage portfolio.
Further investments were made at the point of consumption in coolers and outlet infrastructure to uplift and enliven on-premise drinking occasions. The sales force has been expanded and service levels have been improved for each class of trade.
The extensive capacity upgrade project is nearing completion and we have recently completed projects in Uganda, Southern Sudan and Ghana. New plants in Tanzania, Mozambique and Angola are due to be commissioned shortly.
EBITA grew 3%, despite adverse currency movements. On an organic, constant currency basis, EBITA grew 15% and margin improved by 190 basis points on the same basis, driven by robust pricing and a good performance from our associate Castel.
In Uganda, lager volumes grew 18% driven by a healthy brand portfolio and supported by the introduction of the long neck bottle last year and the launch of Nile Gold as a premium offering in a 330ml returnable bottle. A 20% increase in brewing capacity was commissioned in June 2009.
Mozambique delivered strong results with lager volume ahead by 7%. Much of this growth came from the market in the north of the country, justifying our November commissioning of the greenfield brewery in this region. Strong growth from Laurentina Preta, a dark lager, and the recently launched Laurentina Premium further drove performance.
12 CHIEF EXECUTIVE’S REVIEW (continued)
Zambia benefited from a reduction in excise rates at the beginning of the year, growing lager volumes 23% despite a depressed economy. Soft drinks volumes were level with the prior year, while traditional beer volumes fell by 2% following strong growth in the prior year. We concluded the acquisition of the Maheu business, a traditional maize-based non-alcoholic flavoured drink, in September 2009.
In Tanzania, the economy was impacted more than other African markets by reduced agricultural exports and lower foreign direct investment, and also suffered from extreme drought conditions in the northern and central regions. Lager volumes declined by 6% but market share improved marginally reflecting continued improvements in sales execution and outlet penetration. During the period, we successfully re-launched Ndovu Lager in a 375ml green returnable bottle with enhanced packaging.
The Botswana government implemented a 30% social levy on all alcoholic products in November 2008. The levy, compounded by an economy impacted by reduced diamond exports, resulted in sales for the half year declining dramatically, with lager volumes 47% below the prior year and traditional beer sales down 14%. Soft drinks volumes grew by 7% during the period.
In Angola total volumes declined 1% for the half year due to a combination of port congestion, an economic slowdown following a decline in the oil price and reduced global demand for diamonds and limited availability of foreign currency. Our planned commissioning of a new beer and a new soft drinks plant in north Luanda later this year will alleviate some of the adverse impacts of port congestion by reducing the need to import finished product and the costs associated with demurrage and port handling.
Castel continued its strong performance with organic lager volume growth of 12% aided by the commissioning of two new breweries in Angola at the beginning of the calendar year, and good lager growth from Cameroon. Soft drinks volumes grew 9% with good performances in Tunisia and Algeria.
13 CHIEF EXECUTIVE’S REVIEW (continued)
Asia
Financial summary 2009 2008 %
Group revenue (including share of associates and joint ventures) (US$m)
EBITA* (US$m)
EBITA margin (%)
Sales volumes (hl 000) - Lager - Lager (organic)
1,021
90
8.8
29,229 28,343
905
72
8.0
25,981 25,981
13
24
12 9
*In 2009 before net exceptional costs of US$1 million being business capability programme costs (2008: US$nil).
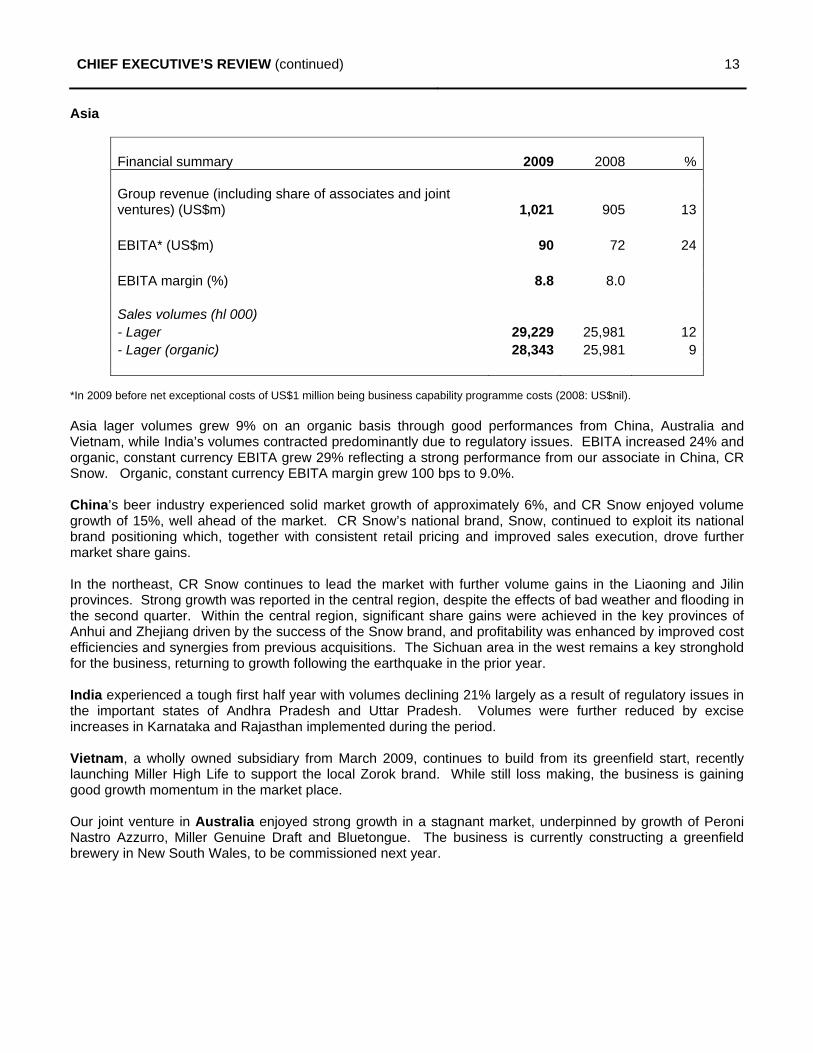
Asia lager volumes grew 9% on an organic basis through good performances from China, Australia and Vietnam, while India’s volumes contracted predominantly due to regulatory issues. EBITA increased 24% and organic, constant currency EBITA grew 29% reflecting a strong performance from our associate in China, CR Snow. Organic, constant currency EBITA margin grew 100 bps to 9.0%.
China’s beer industry experienced solid market growth of approximately 6%, and CR Snow enjoyed volume growth of 15%, well ahead of the market. CR Snow’s national brand, Snow, continued to exploit its national brand positioning which, together with consistent retail pricing and improved sales execution, drove further market share gains.
In the northeast, CR Snow continues to lead the market with further volume gains in the Liaoning and Jilin provinces. Strong growth was reported in the central region, despite the effects of bad weather and flooding in the second quarter. Within the central region, significant share gains were achieved in the key provinces of Anhui and Zhejiang driven by the success of the Snow brand, and profitability was enhanced by improved cost efficiencies and synergies from previous acquisitions. The Sichuan area in the west remains a key stronghold for the business, returning to growth following the earthquake in the prior year.
India experienced a tough first half year with volumes declining 21% largely as a result of regulatory issues in the important states of Andhra Pradesh and Uttar Pradesh. Volumes were further reduced by excise increases in Karnataka and Rajasthan implemented during the period.
Vietnam, a wholly owned subsidiary from March 2009, continues to build from its greenfield start, recently launching Miller High Life to support the local Zorok brand. While still loss making, the business is gaining good growth momentum in the market place.
Our joint venture in Australia enjoyed strong growth in a stagnant market, underpinned by growth of Peroni Nastro Azzurro, Miller Genuine Draft and Bluetongue. The business is currently constructing a greenfield brewery in New South Wales, to be commissioned next year.
14 CHIEF EXECUTIVE’S REVIEW (continued)
South Africa: Beverages
Financial summary 2009 2008 %
Group revenue (including share of associates) (US$m)
EBITA* (US$m)
EBITA margin (%)
Sales volumes (hl 000) - Lager - Soft drinks - Other alcoholic beverages
2,051
333
16.3
11,973 7,248
594
2,007
332
16.5
12,307 7,396
572
2
-
(3) (2) 4
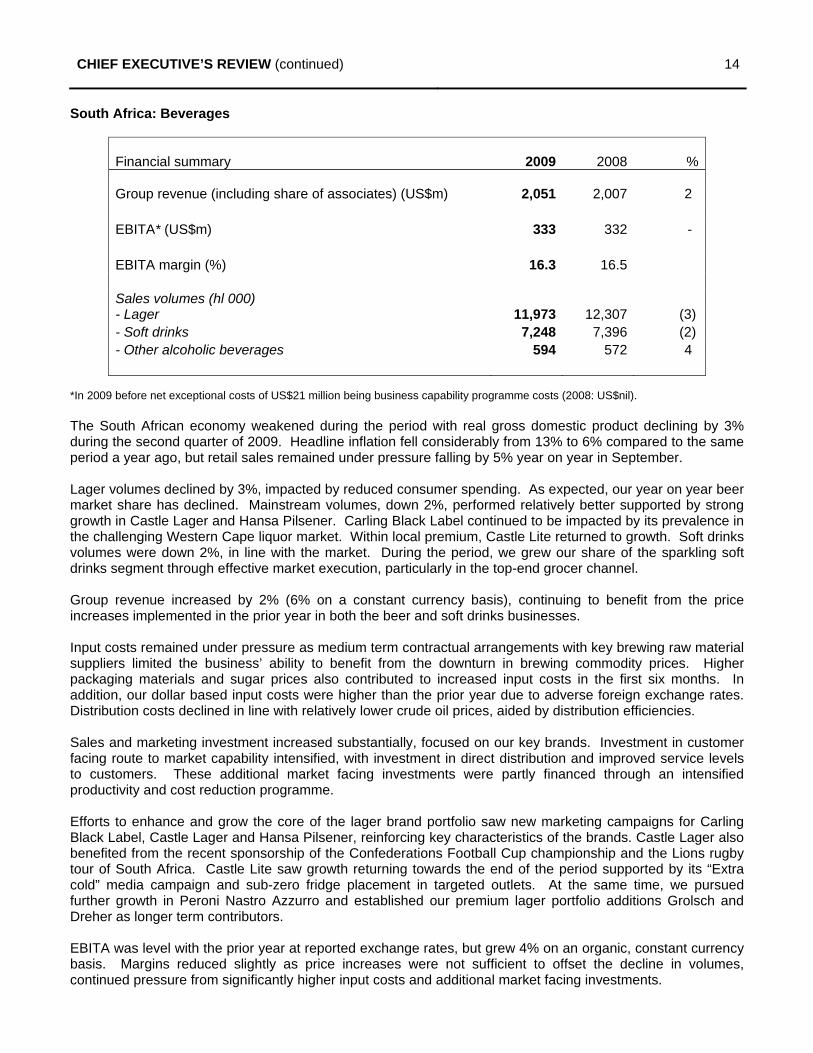
*In 2009 before net exceptional costs of US$21 million being business capability programme costs (2008: US$nil).
The South African economy weakened during the period with real gross domestic product declining by 3% during the second quarter of 2009. Headline inflation fell considerably from 13% to 6% compared to the same period a year ago, but retail sales remained under pressure falling by 5% year on year in September.
Lager volumes declined by 3%, impacted by reduced consumer spending. As expected, our year on year beer market share has declined. Mainstream volumes, down 2%, performed relatively better supported by strong growth in Castle Lager and Hansa Pilsener. Carling Black Label continued to be impacted by its prevalence in the challenging Western Cape liquor market. Within local premium, Castle Lite returned to growth. Soft drinks volumes were down 2%, in line with the market. During the period, we grew our share of the sparkling soft drinks segment through effective market execution, particularly in the top-end grocer channel.
Group revenue increased by 2% (6% on a constant currency basis), continuing to benefit from the price increases implemented in the prior year in both the beer and soft drinks businesses.
Input costs remained under pressure as medium term contractual arrangements with key brewing raw material suppliers limited the business’ ability to benefit from the downturn in brewing commodity prices. Higher packaging materials and sugar prices also contributed to increased input costs in the first six months. In addition, our dollar based input costs were higher than the prior year due to adverse foreign exchange rates. Distribution costs declined in line with relatively lower crude oil prices, aided by distribution efficiencies.
Sales and marketing investment increased substantially, focused on our key brands. Investment in customer facing route to market capability intensified, with investment in direct distribution and improved service levels to customers. These additional market facing investments were partly financed through an intensified productivity and cost reduction programme.
Efforts to enhance and grow the core of the lager brand portfolio saw new marketing campaigns for Carling Black Label, Castle Lager and Hansa Pilsener, reinforcing key characteristics of the brands. Castle Lager also benefited from the recent sponsorship of the Confederations Football Cup championship and the Lions rugby tour of South Africa. Castle Lite saw growth returning towards the end of the period supported by its “Extra cold” media campaign and sub-zero fridge placement in targeted outlets. At the same time, we pursued further growth in Peroni Nastro Azzurro and established our premium lager portfolio additions Grolsch and Dreher as longer term contributors.
EBITA was level with the prior year at reported exchange rates, but grew 4% on an organic, constant currency basis. Margins reduced slightly as price increases were not sufficient to offset the decline in volumes, continued pressure from significantly higher input costs and additional market facing investments.
15 CHIEF EXECUTIVE’S REVIEW (continued)
On 1 July, we announced preliminary details of a proposed broad-based black economic empowerment transaction in South Africa. The transaction is intended to benefit employees, soft drinks and liquor retailers and the wider South African community through the formation of The SAB Foundation, by enabling them to participate in the equity of The South African Breweries Limited. The full terms of the transaction will be announced in early December 2009.
Distell continued its robust performance with both domestic and international volumes exhibiting good growth to deliver increased revenue and improved profitability.
South Africa: Hotels and Gaming
Financial summary 2009 2008 %
Group revenue (share of associates) (US$m) 193 186 3
EBITA* (US$m) 53 61 (12)
EBITA margin (%) 27.8 32.5
Revenue per available room (Revpar) – US$ 63.44 75.56 (16)
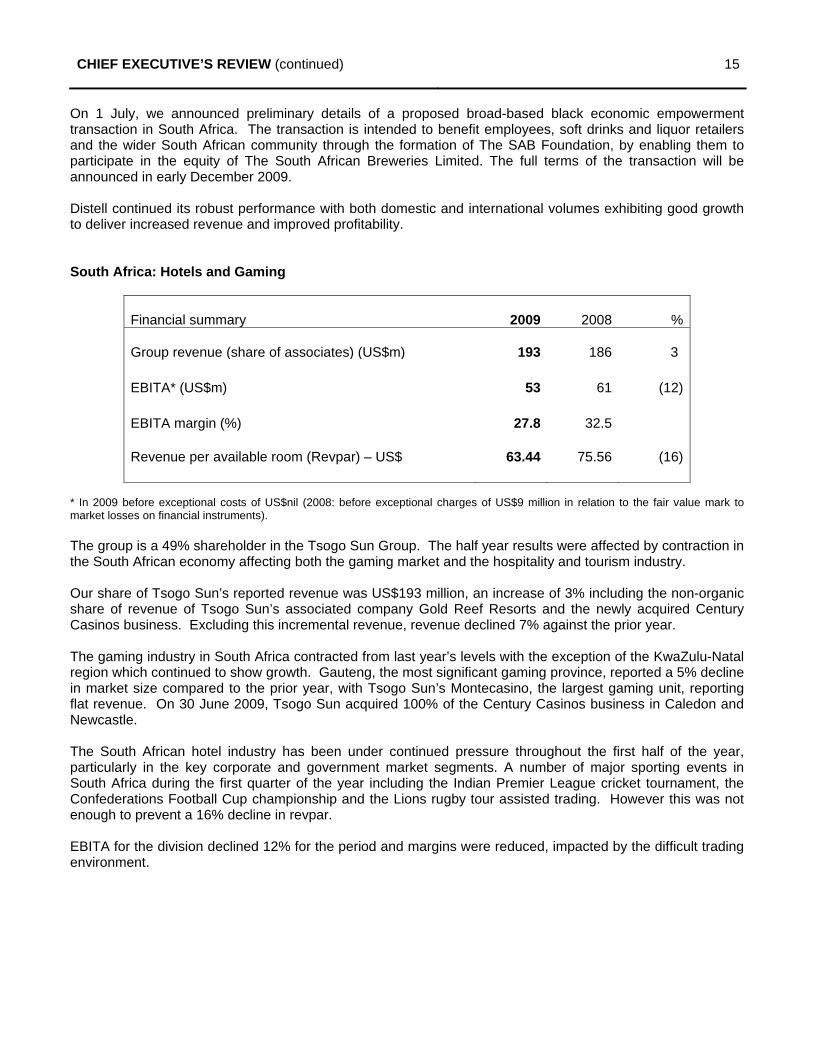
* In 2009 before exceptional costs of US$nil (2008: before exceptional charges of US$9 million in relation to the fair value mark to market losses on financial instruments).
The group is a 49% shareholder in the Tsogo Sun Group. The half year results were affected by contraction in the South African economy affecting both the gaming market and the hospitality and tourism industry.
Our share of Tsogo Sun’s reported revenue was US$193 million, an increase of 3% including the non-organic share of revenue of Tsogo Sun’s associated company Gold Reef Resorts and the newly acquired Century Casinos business. Excluding this incremental revenue, revenue declined 7% against the prior year.
The gaming industry in South Africa contracted from last year’s levels with the exception of the KwaZulu-Natal region which continued to show growth. Gauteng, the most significant gaming province, reported a 5% decline in market size compared to the prior year, with Tsogo Sun’s Montecasino, the largest gaming unit, reporting flat revenue. On 30 June 2009, Tsogo Sun acquired 100% of the Century Casinos business in Caledon and Newcastle.
The South African hotel industry has been under continued pressure throughout the first half of the year, particularly in the key corporate and government market segments. A number of major sporting events in South Africa during the first quarter of the year including the Indian Premier League cricket tournament, the Confederations Football Cup championship and the Lions rugby tour assisted trading. However this was not enough to prevent a 16% decline in revpar.
EBITA for the division declined 12% for the period and margins were reduced, impacted by the difficult trading environment.

16 CHIEF EXECUTIVE’S REVIEW (continued)
Financial review
New accounting standards and restatements The accounting policies followed are the same as those published within the Annual Report and Accounts for the year ended 31 March 2009 as amended for the changes set out in note 1, which have had no material impact on group results. The consolidated balance sheets as at 30 September 2008 and as at 31 March 2009 have been restated for further adjustments relating to initial accounting for business combinations, further details of which are provided in note 12. The Annual Report and Accounts for the year ended 31 March 2009 are available on the company’s website, www.sabmiller.com.
Segmental analysis The group’s operating results on a segmental basis are set out in the segmental analysis of operations. The group has adopted IFRS 8 Operating Segments with effect from 1 April 2009 and this has resulted in a change to the segmental information reported, with Africa and Asia now reported as separate segments. Comparative information has been restated accordingly. Additional historical information for each of the Africa and Asia segments is available on the company’s website.
SABMiller uses group revenue and EBITA (as defined in the Financial Definitions section) to evaluate performance and believes these measures provide stakeholders with additional information on trends and allow for greater comparability between segments. Segmental performance is reported after the specific apportionment of attributable head office costs.
Disclosure of volumes In the determination and disclosure of sales volumes, the group aggregates 100% of the volumes of all consolidated subsidiaries and its equity accounted percentage of all associates’ and joint ventures’ volumes. Contract brewing volumes are excluded from volumes although revenue from contract brewing is included within group revenue. Volumes exclude intra-group sales volumes. This measure of volumes is used in the segmental analyses as it more closely aligns with the consolidated group revenue and EBITA disclosures.
Organic, constant currency comparisons The group discloses certain results on an organic, constant currency basis, to show the effects of acquisitions net of disposals and changes in exchange rates on the group’s results. See the Financial Definitions section for the definition.
In relation to the MillerCoors joint venture no adjustments have been made in the calculation of organic results as the group’s share of the joint venture is deemed to be comparable with 100% of the Miller business in the comparative period.
Business combinations and acquisitions On 10 April 2009 the group assumed control of a 70.56% interest in Bere Azuga in Romania following receipt of clearance from the competition authorities and has consolidated Bere Azuga from this date. Subsequently, further share purchases were made, together with a mandatory public offer for the remainder of shares in Bere Azuga. As at 30 September 2009, the group had an effective interest of 94.85% in Bere Azuga.
In July 2009 the group completed the acquisition of an effective 40% interest in Ambo Mineral Water Share Company in Ethiopia.
In September 2009 the group acquired Maheu, a non-alcoholic maize drinks business, in Zambia.
On 29 May 2009 SABMiller plc acquired the outstanding 28.1% minority interest in its Polish subsidiary, Kompania Piwowarska SA, in exchange for 60 million ordinary shares of SABMiller plc.
17 CHIEF EXECUTIVE’S REVIEW (continued)
Exceptional items Items that are material either by size or incidence are classified as exceptional items. Further details on the treatment of these items can be found in note 3 to the financial information.
Net exceptional charges of US$222 million before finance costs and tax were reported during the period (2008: net exceptional credit of US$371 million) including net exceptional charges of US$11 million (2008: US$33 million) related to the group’s share of joint ventures’ and associates’ exceptional charges. The net exceptional charge included US$170 million related to business capability programme costs in Latin America, Europe, Africa, Asia, South Africa Beverages and Corporate, together with a charge of US$41 million related to integration and restructuring costs in Europe.
The group’s share of joint ventures’ and associates’ exceptional items includes a charge of US$7 million related to the group’s share of MillerCoors’ integration and restructuring costs and US$4 million related to the group’s share of the unwinding of fair value adjustments on inventory in MillerCoors.
In addition there was an exceptional charge in the period of US$17 million (2008: US$nil) within net finance costs related to the business capability programme.
In 2008 the net exceptional credit included a US$437 million profit on the deemed disposal of 42% of the US and Puerto Rico operations of Miller, partly offset by a charge of US$23 million related to MillerCoors’ integration and restructuring costs and a charge of US$10 million relating to the unwinding of fair value adjustments on inventory relating to the acquisition of Grolsch. The group’s share of joint ventures’ and associates’ exceptional items included a charge of US$17 million relating to its share of MillerCoors’ integration and restructuring costs, US$7 million relating to its share of the unwinding of fair value adjustments on inventory in MillerCoors and a charge of US$9 million relating to fair value mark to market losses on financial instruments in Tsogo Sun.
Finance costs Net finance costs decreased to US$266 million, a 31% decrease on the prior period’s US$384 million. Finance costs in the current period include a net gain of US$3 million (2008: net loss of US$26 million) from the mark to market adjustments of various derivatives on capital items for which hedge accounting cannot be applied. Finance costs in the period also include a US$17 million charge resulting from a change in valuation methodology of financial instruments as part of the business capability programme. The mark to market loss and the charge resulting from the change in valuation have been excluded from the determination of adjusted finance costs and adjusted earnings per share. Adjusted net finance costs were US$253 million, down 29% reflecting the reduction in the weighted average interest rate due to the lower global interest rate environment.
Interest cover, as defined in the Financial Definitions section, has increased to 9.1 times from 6.8 times in the comparable prior year period.
Profit before tax Adjusted profit before tax of US$1,920 million increased by 3% over the comparable period in the prior year, benefiting from lower net finance costs.
On a statutory basis, profit before tax of US$1,498 million was down 26% including the impact of the exceptional and other adjusting finance items noted above. The principal differences relate to exceptional items with net exceptional charges of US$239 million in the half year compared to net exceptional credits of US$371 million in the prior period.
Taxation The effective tax rate of 29.4% before amortisation of intangible assets (other than software), exceptional items and the adjustments to finance costs noted above, is below that of the prior year (31.0%). The rate has fallen principally as a result of beneficial changes in the combination of geographic profits, but also through ongoing management of the effective tax rate.
18 CHIEF EXECUTIVE’S REVIEW (continued)
Earnings per share The group presents adjusted basic earnings per share to exclude the impact of amortisation of intangible assets (other than software) and other non-recurring items, which include post-tax exceptional items, in order to present a more meaningful comparison for the periods shown in the consolidated financial information. Adjusted basic earnings per share of 80.0 US cents were up 6% on the comparable period in the prior year, benefiting from lower finance costs and taxation as discussed above together with lower profit attributable to minority interests, partially offset by an increase in the weighted average number of shares in issue. The reduction in profit attributable to minority interests and the increase in shares in issue result from the buyout of the minority interests in our Polish business. An analysis of earnings per share is shown in note 5. On a statutory basis, basic earnings per share are 34% lower at 63.0 US cents.
Cash flow Net cash generated from operations before working capital movements (EBITDA) decreased by 21% to US$1,865 million compared to the prior year period. This decrease was primarily due to the reduction in EBITDA from North America following the formation of the MillerCoors joint venture, as EBITDA excludes cash flows from associates and joint ventures. Dividends received from the MillerCoors joint venture (reported within cash flows from investing activities) amounted to US$427 million (2008: US$81 million). EBITDA together with the MillerCoors dividends decreased by 6% on the same period in the prior year, primarily due to expenditure on the business capability programme and the impact of the strength of the US dollar on translated results. Net cash generated from operating activities of US$1,499 million was up 27% reflecting a significant improvement in working capital, together with lower tax and net interest payments partly offset by the reduction in EBITDA. The working capital improvement compared to the same period last year reflects changes in process management practices applied to inventory, receivables and payables, resulting in net working capital inflows in most major operations. Free cash flow improved by US$1,124 million to US$998 million, as detailed in note 9b.
Capital expenditure The group has continued to invest in its operations, selectively maintaining investment to support future growth, including new breweries in Russia, Angola, Tanzania, Southern Sudan and Mozambique together with recently completed capacity expansions in Poland, Romania, Ghana and Uganda. Capital expenditure for the six months to 30 September 2009 was US$728 million (2008 US$1,245 million). With effect from 1 July 2008, the capital expenditure for the MillerCoors joint venture has been excluded from the consolidated capital expenditure reported.
Capital expenditure including the purchase of intangible assets was US$739 million (2008: US$1,279 million).
Borrowings and net debt Gross debt at 30 September 2009, comprising borrowings together with the fair value of derivative assets or liabilities held to manage interest rate and foreign currency risk of borrowings, has increased to US$9,809 million from US$9,131 million at 31 March 2009, primarily as result of the impact of exchange rates on the retranslation of the group’s Colombian peso and euro denominated debt. Net debt comprising gross debt net of cash and cash equivalents has increased to US$9,345 million from US$8,709 million (restated) at 31 March 2009. An analysis of net debt is provided in note 9c.
The group’s gearing (presented as a ratio of net debt/equity) has decreased to 47.0% from 54.0% (restated) at 31 March 2009. The weighted average interest rate for the gross debt portfolio at 30 September 2009 was 6.0% (31 March 2009: 7.1%).
On 1 July 2009 the US$300 million LIBOR +0.3% Notes issued by SABMiller plc matured and were refinanced from existing facilities. On 17 July 2009 SABMiller plc completed a €1,000 million bond issue which was issued under the US$5,000 million Euro Medium Term Note Programme. The notes were issued in a single tranche of 5.5 year notes with a coupon of 4.5%. The net proceeds of the bond have been used to repay certain indebtedness.
Subsequent to 30 September 2009 the US$1,000 million 364 day facility was voluntarily cancelled in part, reducing the size of the facility to US$600 million. The facility was subsequently extended from October 2009 to 6 October 2010 in the amount of US$515 million, with a one year term out option.
19 CHIEF EXECUTIVE’S REVIEW (continued)
Total equity Total equity increased from US$16,117 million (as restated) at 31 March 2009 to US$19,880 million at 30 September 2009. The increase is principally due to currency translation movements on foreign currency investments, profit for the period and the issue of shares for the Polish minority buyout, partly offset by fair value moves on hedged items and dividend payments.
Goodwill and intangible assets Goodwill has increased to US$11,608 million (31 March 2009: US$8,715 million) primarily due to foreign exchange movements and goodwill on acquisitions in the period, including the Polish minority buyout. Intangible assets have increased in the period to US$4,369 million (31 March 2009: US$3,741 million) as a result of foreign exchange movements partially offset by amortisation. The comparatives for both goodwill and intangible assets have been restated to reflect adjustments to provisional fair values of business combinations, further details of which are provided in note 12.
Currencies The rand appreciated by 27% against the US dollar during the six months to 30 September 2009 and ended the period at R7.55 to the US dollar, while the weighted average rand/dollar rate weakened by 4% to R8.12 compared with R7.79 in the comparable period. The Colombian peso (COP) strengthened by 33% against the US dollar during the six months and ended the period at COP1,922 to the US dollar compared with COP2,561 at 31 March 2009. The weighted average COP/dollar rate weakened by 14% to COP2,113 compared with COP1,827 in the comparable period.
Risks and uncertainties The principal risks and uncertainties for the first six months and remaining six months of the financial year remain as reflected on page 10 of the 2009 Annual Report. These are summarised as follows:
The risk that, as the industry consolidates, failure to participate in attractive value-adding transactions may inhibit the group’s ability to grow and exploit scale benefits. There is also a risk that expected benefits from participating in consolidation and integrating acquisitions may not be captured or may be inadequate, or that the group may not fully leverage its scale across business operations.
The risk that opportunities for profitable growth may not be realised should the group fail to ensure the relevance and attractiveness of its brands, and continuously improve its marketing and related sales capability.
The risk that the group’s global growth potential may be jeopardised due to a failure to develop and maintain a sufficient cadre of talented management or to capture shared learnings and leverage expertise through effective management practices.
The risk that regulatory authorities when making impositions on beer do not recognise the positive contribution of the group’s businesses, and effective ways of addressing health and social concerns. In affected countries the group’s ability to grow profitably and contribute to local communities could be adversely affected.
The risk that margins could fall because the group fails to ensure an adequate supply of brewing and packaging raw materials at competitive prices.
The risk that the group’s plans and responses to changes in global economic conditions may not be adequate.
20 CHIEF EXECUTIVE’S REVIEW (continued)
Dividend The board has declared a cash interim dividend of 17 US cents per share, an increase of 6%. The dividend will be payable on Friday 11 December 2009 to shareholders registered on the London and Johannesburg registers on Friday 4 December 2009. The ex-dividend trading dates will be Wednesday 2 December 2009 on the London Stock Exchange (LSE) and Monday 30 November 2009 on the JSE Limited (JSE). As the group reports in US dollars, dividends are declared in US dollars. They are payable in South African rand to shareholders on the Johannesburg register, in US dollars to shareholders on the London register with a registered address in the United States (unless mandated otherwise), and in sterling to all remaining shareholders on the London register. Further details relating to dividends are provided in note 6.
The rate of exchange applicable for US dollar conversion into South African rand and sterling was determined yesterday. The rate of exchange determined for converting to South African rand was US$:ZAR 7.41400 resulting in an equivalent interim dividend of 126.038 SA cents per share. The rate of exchange determined for converting to sterling was GBP:US$1.6799 resulting in an equivalent interim dividend of 10.1197 UK pence per share.
From the commencement of trading on Thursday 19 November 2009 until the close of business on Friday 4 December 2009, no transfers between the London and Johannesburg registers will be permitted, and from Monday 30 November 2009 until Friday 4 December 2009, no shares may be dematerialised or rematerialised, both days inclusive.
Directors’ responsibility for financial reporting This statement, which should be read in conjunction with the independent review report of the auditors set out below, is made to enable shareholders to distinguish the respective responsibilities of the directors and the auditors in relation to the consolidated interim financial information, set out on pages 22 to 40, which the directors confirm has been prepared on a going concern basis. The directors consider that the group has used appropriate accounting policies, consistently applied and supported by reasonable and appropriate judgements and estimates.
A copy of the interim report of the group is placed on the company’s website. The directors are responsible for the maintenance and integrity of the statutory and audited information on the company’s website. Information published on the internet is accessible in many countries with different legal requirements. Legislation in the United Kingdom governing the preparation and dissemination of the financial statements may differ from legislation in other jurisdictions.
The directors confirm that this condensed set of interim financial information has been prepared in accordance with IAS 34 as adopted by the European Union, and the interim management report herein includes a fair review of the information required by DTR 4.2.7 and DTR 4.2.8 of the Disclosure and Transparency Rules of the United Kingdom’s Financial Services Authority.
The directors of SABMiller plc are listed in the SABMiller plc Annual Report for the year ended 31 March 2009. Howard Willard was appointed to the board with effect from 1 August 2009. A list of current directors is maintained on the SABMiller plc website: www.sabmiller.com.
On behalf of the board
EAG Mackay MI Wyman Chief executive Chief financial officer
19 November 2009

21 INDEPENDENT REVIEW REPORT OF HALF-YEARLY CONSOLIDATED FINANCIAL INFORMATION TO SABMILLER PLC
Introduction We have been engaged by the company to review the condensed set of financial information in the half-yearly financial report for the six months ended 30 September 2009, which comprises the consolidated income statement, consolidated statement of comprehensive income, consolidated balance sheet, consolidated cash flow statement, consolidated statement of changes in equity and related notes. We have read the other information contained in the half yearly financial report and considered whether it contains any apparent misstatements or material inconsistencies with the information in the condensed set of financial information.
Directors’ responsibilities The half-yearly financial report is the responsibility of, and has been approved by, the directors. The directors are responsible for preparing the half-yearly financial report in accordance with the Disclosure and Transparency Rules of the United Kingdom’s Financial Services Authority.
As disclosed in note 1, the annual financial statements of the group are prepared in accordance with IFRS as adopted by the European Union. The condensed set of financial information included in this half-yearly financial report has been prepared in accordance with International Accounting Standard 34, ‘Interim Financial Reporting’, as adopted by the European Union.
Our responsibility Our responsibility is to express to the company a conclusion on the condensed set of financial information in the half-yearly financial report based on our review. This report, including the conclusion, has been prepared for and only for the company for the purpose of the Disclosure and Transparency Rules of the Financial Services Authority and for no other purpose. We do not, in producing this report, accept or assume responsibility for any other purpose or to any other person to whom this report is shown or into whose hands it may come save where expressly agreed by our prior consent in writing.
Scope of review We conducted our review in accordance with International Standard on Review Engagements (UK and Ireland) 2410, ‘Review of Interim Financial Information Performed by the Independent Auditor of the Entity’ issued by the Auditing Practices Board for use in the United Kingdom. A review of interim financial information consists of making enquiries, primarily of persons responsible for financial and accounting matters, and applying analytical and other review procedures. A review is substantially less in scope than an audit conducted in accordance with International Standards on Auditing (UK and Ireland) and consequently does not enable us to obtain assurance that we would become aware of all significant matters that might be identified in an audit. Accordingly, we do not express an audit opinion.
Conclusion Based on our review, nothing has come to our attention that causes us to believe that the condensed set of financial information in the half-yearly financial report for the six months ended 30 September 2009 is not prepared, in all material respects, in accordance with International Accounting Standard 34 as adopted by the European Union and the Disclosure and Transparency Rules of the United Kingdom’s Financial Services Authority.
PricewaterhouseCoopers LLP Chartered Accountants London 19 November 2009

22
SABMiller plc CONSOLIDATED INCOME STATEMENT for the six months ended 30 September
Six months Six months Year ended 30/9/09 ended 30/9/08 ended 31/3/09
Unaudited Unaudited Audited Notes US$m US$m US$m
Revenue 2 8,846 11,166 18,703 Net operating expenses (7,632) (9,011) (15,555)
Operating profit 2 1,214 2,155 3,148 Operating profit before exceptional items 1,425 1,751 3,146 Exceptional items 3 (211) 404 2
Net finance costs (266) (384) (706) Interest payable and similar charges (425) (654) (1,301) Interest receivable and similar income 159 270 595
Share of post-tax results of associates and joint ventures 2 550 249 516
Profit before taxation 1,498 2,020 2,958 Taxation 4 (436) (455) (801)
Profit for the financial period 1,062 1,565 2,157
Profit attributable to minority interests 89 142 276 Profit attributable to equity shareholders 5 973 1,423 1,881
1,062 1,565 2,157
Basic earnings per share (US cents) 5 63.0 94.8 125.2 Diluted earnings per share (US cents) 5 62.6 94.3 124.6
All operations are continuing. The notes on pages 27 to 40 form an integral part of this condensed interim financial information.
23
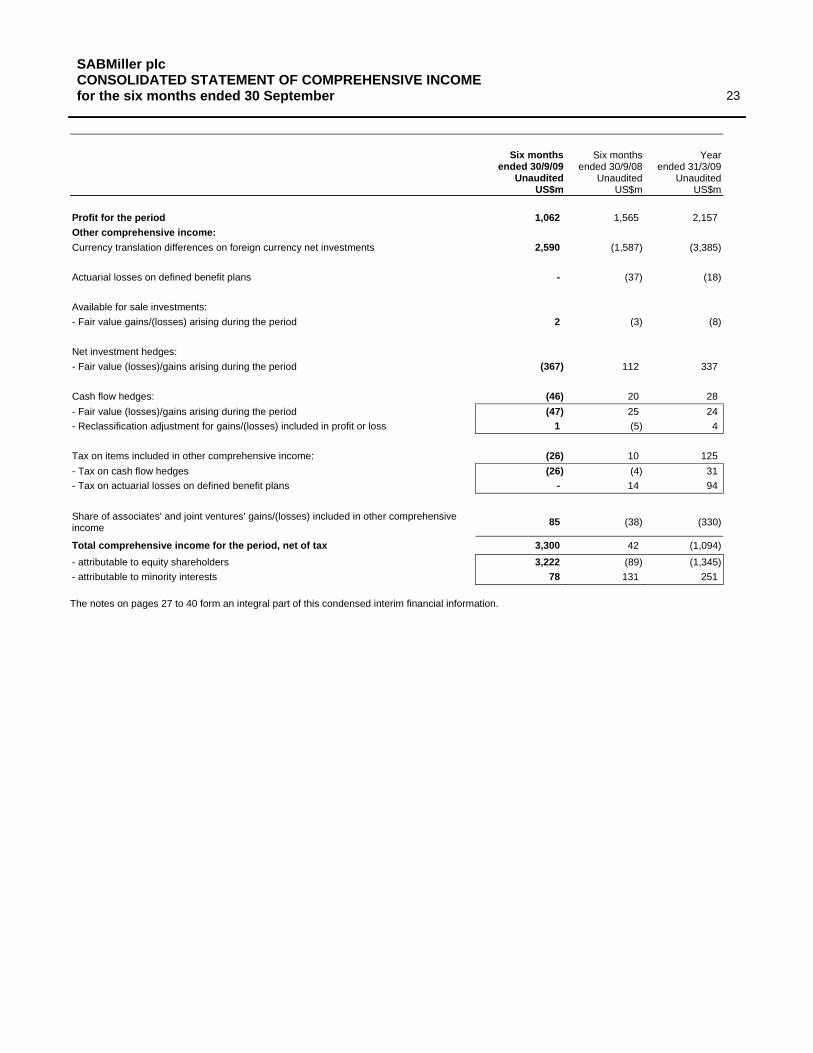
SABMiller plc CONSOLIDATED STATEMENT OF COMPREHENSIVE INCOME for the six months ended 30 September
Six months ended 30/9/09
Unaudited US$m
Six months ended 30/9/08
Unaudited US$m
Year ended 31/3/09
Unaudited US$m
Profit for the period 1,062 1,565 2,157 Other comprehensive income: Currency translation differences on foreign currency net investments 2,590 (1,587) (3,385)
Actuarial losses on defined benefit plans - (37) (18)
Available for sale investments: - Fair value gains/(losses) arising during the period 2 (3) (8)
Net investment hedges: - Fair value (losses)/gains arising during the period (367) 112 337
Cash flow hedges: (46) 20 28 - Fair value (losses)/gains arising during the period (47) 25 24 - Reclassification adjustment for gains/(losses) included in profit or loss 1 (5) 4
Tax on items included in other comprehensive income: (26) 10 125 - Tax on cash flow hedges (26) (4) 31 - Tax on actuarial losses on defined benefit plans - 14 94
Share of associates' and joint ventures' gains/(losses) included in other comprehensive income 85 (38) (330)
Total comprehensive income for the period, net of tax 3,300 42 (1,094) - attributable to equity shareholders 3,222 (89) (1,345) - attributable to minority interests 78 131 251
The notes on pages 27 to 40 form an integral part of this condensed interim financial information.
24
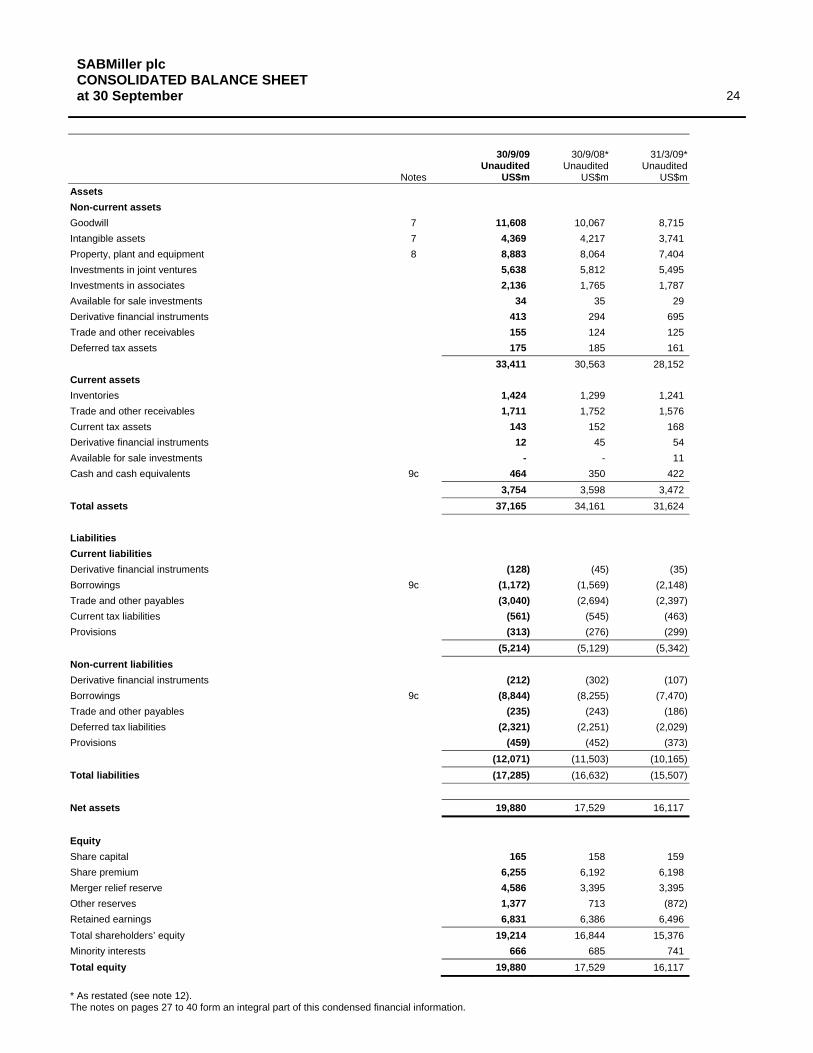
SABMiller plc CONSOLIDATED BALANCE SHEET at 30 September
30/9/09 Unaudited
30/9/08* Unaudited
31/3/09* Unaudited
Notes US$m US$m US$m Assets Non-current assets Goodwill 7 11,608 10,067 8,715 Intangible assets 7 4,369 4,217 3,741 Property, plant and equipment 8 8,883 8,064 7,404 Investments in joint ventures 5,638 5,812 5,495 Investments in associates 2,136 1,765 1,787 Available for sale investments 34 35 29 Derivative financial instruments 413 294 695 Trade and other receivables 155 124 125 Deferred tax assets 175 185 161
33,411 30,563 28,152 Current assets Inventories 1,424 1,299 1,241 Trade and other receivables 1,711 1,752 1,576 Current tax assets 143 152 168 Derivative financial instruments 12 45 54 Available for sale investments - - 11 Cash and cash equivalents 9c 464 350 422
3,754 3,598 3,472 Total assets 37,165 34,161 31,624
Liabilities Current liabilities Derivative financial instruments (128) (45) (35) Borrowings 9c (1,172) (1,569) (2,148) Trade and other payables (3,040) (2,694) (2,397) Current tax liabilities (561) (545) (463) Provisions (313) (276) (299)
(5,214) (5,129) (5,342) Non-current liabilities Derivative financial instruments (212) (302) (107) Borrowings 9c (8,844) (8,255) (7,470) Trade and other payables (235) (243) (186) Deferred tax liabilities (2,321) (2,251) (2,029) Provisions (459) (452) (373)
(12,071) (11,503) (10,165) Total liabilities (17,285) (16,632) (15,507)
Net assets 19,880 17,529 16,117
Equity Share capital 165 158 159 Share premium 6,255 6,192 6,198 Merger relief reserve 4,586 3,395 3,395 Other reserves 1,377 713 (872) Retained earnings 6,831 6,386 6,496 Total shareholders’ equity 19,214 16,844 15,376 Minority interests 666 685 741 Total equity 19,880 17,529 16,117
* As restated (see note 12). The notes on pages 27 to 40 form an integral part of this condensed financial information.
25
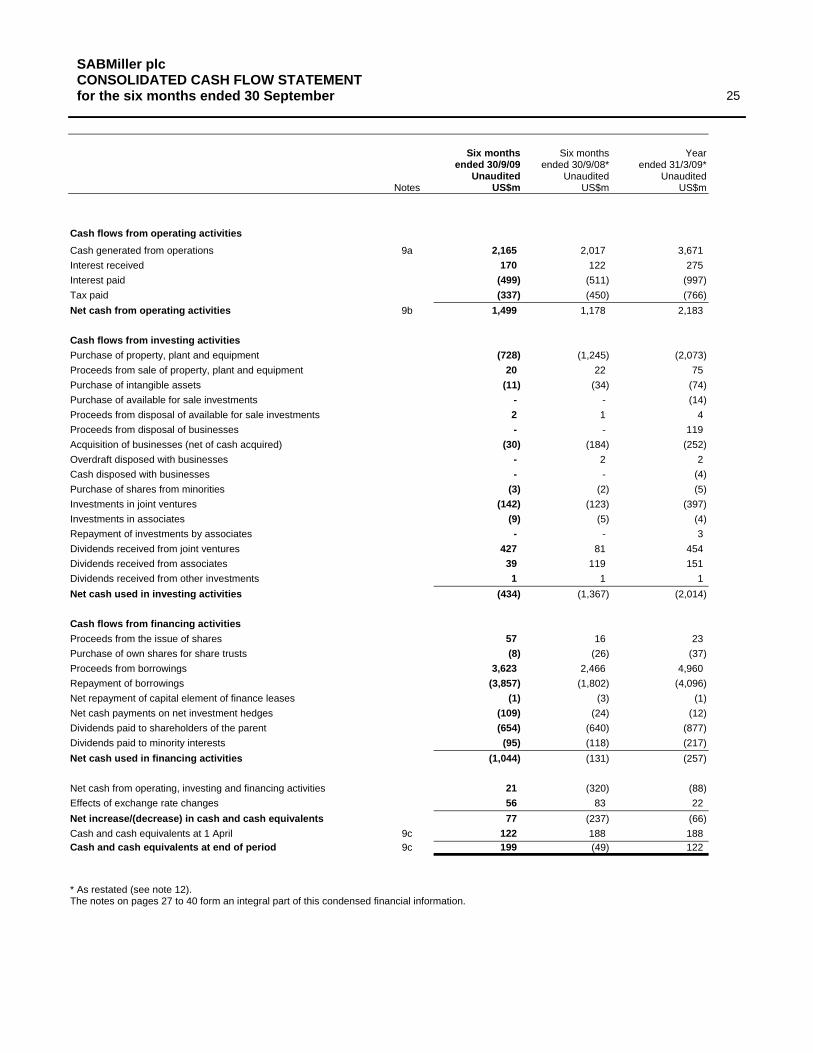
SABMiller plc CONSOLIDATED CASH FLOW STATEMENT for the six months ended 30 September
Six months Six months Year ended 30/9/09
Unaudited ended 30/9/08*
Unaudited ended 31/3/09*
Unaudited Notes US$m US$m US$m
Cash flows from operating activities Cash generated from operations 9a 2,165 2,017 3,671 Interest received 170 122 275 Interest paid (499) (511) (997) Tax paid (337) (450) (766) Net cash from operating activities 9b 1,499 1,178 2,183
Cash flows from investing activities Purchase of property, plant and equipment (728) (1,245) (2,073) Proceeds from sale of property, plant and equipment 20 22 75 Purchase of intangible assets (11) (34) (74) Purchase of available for sale investments - - (14) Proceeds from disposal of available for sale investments 2 1 4 Proceeds from disposal of businesses - - 119 Acquisition of businesses (net of cash acquired) (30) (184) (252) Overdraft disposed with businesses - 2 2 Cash disposed with businesses - - (4) Purchase of shares from minorities (3) (2) (5) Investments in joint ventures (142) (123) (397) Investments in associates (9) (5) (4) Repayment of investments by associates - - 3 Dividends received from joint ventures 427 81 454 Dividends received from associates 39 119 151 Dividends received from other investments 1 1 1 Net cash used in investing activities (434) (1,367) (2,014)
Cash flows from financing activities Proceeds from the issue of shares 57 16 23 Purchase of own shares for share trusts (8) (26) (37) Proceeds from borrowings 3,623 2,466 4,960 Repayment of borrowings (3,857) (1,802) (4,096) Net repayment of capital element of finance leases (1) (3) (1) Net cash payments on net investment hedges (109) (24) (12) Dividends paid to shareholders of the parent (654) (640) (877) Dividends paid to minority interests (95) (118) (217) Net cash used in financing activities (1,044) (131) (257)
Net cash from operating, investing and financing activities 21 (320) (88) Effects of exchange rate changes 56 83 22 Net increase/(decrease) in cash and cash equivalents 77 (237) (66) Cash and cash equivalents at 1 April 9c 122 188 188 Cash and cash equivalents at end of period 9c 199 (49) 122
* As restated (see note 12). The notes on pages 27 to 40 form an integral part of this condensed financial information.

26
SABMiller plc CONSOLIDATED STATEMENT OF CHANGES IN EQUITY for the six months ended 30 September
Called up Share Total share premium Other Retained shareholders’ Minority Total
capital account reserves earnings equity interests equity US$m US$m US$m US$m US$m US$m US$m
At 1 April 2008 (audited) 158 6,176 5,610 5,601 17,545 699 18,244
Total comprehensive income - - (1,499) 1,410 (89) 131 42 Profit for the period - - - 1,423 1,423 142 1,565 Other comprehensive income - - (1,499) (13) (1,512) (11) (1,523) Other movements - - 4 2 6 - 6 Contributed to joint ventures - - (7) - (7) (2) (9) Dividends paid - - - (640) (640) (143) (783) Issue of SABMiller plc ordinary shares - 16 - - 16 - 16 Payment for purchase of own shares for share trusts - - - (26) (26) - (26) Credit entry relating to share-based payments - - - 39 39 - 39
At 30 September 2008* (unaudited) 158 6,192 4,108 6,386 16,844 685 17,529
At 1 April 2008 (audited) 158 6,176 5,610 5,601 17,545 699 18,244
Total comprehensive income - - (3,080) 1,735 (1,345) 251 (1,094) Profit for the period - - - 1,881 1,881 276 2,157 Other comprehensive income - - (3,080) (146) (3,226) (25) (3,251) Other movements - - - (5) (5) - (5) Contributed to joint ventures - - (7) - (7) (2) (9) Dividends paid - - - (877) (877) (221) (1,098) Issue of SABMiller plc ordinary shares 1 22 - - 23 - 23 Payment for purchase of own shares for share trusts - - - (37) (37) - (37) Arising on business combinations - - - - - 17 17 Buyout of minority interests - - - - - (3) (3) Credit entry relating to share-based payments - - - 79 79 - 79
At 31 March 2009* (unaudited) 159 6,198 2,523 6,496 15,376 741 16,117
At 1 April 2009 (unaudited) 159 6,198 2,523 6,496 15,376 741 16,117
Total comprehensive income - - 2,249 973 3,222 78 3,300 Profit for the period - - - 973 973 89 1,062 Other comprehensive income - - 2,249 - 2,249 (11) 2,238 Other movements - - - (4) (4) - (4) Dividends paid - - - (663) (663) (88) (751) Issue of SABMiller plc ordinary shares 6 57 1,191 - 1,254 - 1,254 Payment for purchase of own shares for share trusts - - - (8) (8) - (8) Arising on business combinations - - - - - 14 14 Buyout of minority interests - - - - - (79) (79) Credit entry relating to share-based payments - - - 37 37 - 37
At 30 September 2009 (unaudited) 165 6,255 5,963 6,831 19,214 666 19,880
* As restated (see note 12). The notes on pages 27 to 40 form an integral part of this condensed financial information.
The US$1,191 million increase in other reserves in the six months ended 30 September 2009 relates to merger relief arising on the issue of SABMiller plc ordinary shares for the buyout of minority interests in the group’s Polish business.

27 SABMiller plc NOTES TO THE FINANCIAL INFORMATION
1. Basis of preparation
The condensed consolidated interim financial information (the ‘financial information’) comprises the unaudited results of SABMiller plc for the six months ended 30 September 2009 and 30 September 2008, together with the audited results for the year ended 31 March 2009, restated for further unaudited adjustments relating to initial accounting for business combinations. Further details of these adjustments are provided in note 12. The financial information in this report is not audited and does not constitute statutory accounts within the meaning of s434 of the Companies Act 2006. The board of directors approved this financial information on 18 November 2009. The annual financial statements for the year ended 31 March 2009, approved by the board of directors on 1 June 2009, which represent the statutory accounts for that year, have been filed with the Registrar of Companies. The auditors’ report on those accounts was unqualified and did not contain a statement made under s237(2) or (3) of the Companies Act 1985.
The unaudited financial information in this interim report has been prepared in accordance with the Disclosure and Transparency Rules of the Financial Services Authority, and with IAS 34 ‘Interim Financial Reporting’ as adopted by the European Union. The interim financial information should be read in conjunction with the annual financial statements for the year ended 31 March 2009, which have been prepared in accordance with IFRS as adopted by the European Union.
Items included in the financial information of each of the group’s entities are measured using the currency of the primary economic environment in which the entity operates (the functional currency). The consolidated financial information is presented in US dollars which is the group’s presentational currency.
Accounting policies The financial statements are prepared under the historical cost convention, except for the revaluation to fair value of certain financial assets and liabilities, share-based payments, and pension assets and liabilities.
The accounting policies adopted are consistent with those of the annual financial statements for the year ended 31 March 2009, which were published in June 2009, as described in those financial statements except as set out below.
The following standards are mandatory for the first time in the financial year ending 31 March 2010 and are relevant for the group.
IAS 1 (revised), ‘Presentation of financial statements’ requires the presentation of a statement of changes in equity as a primary statement, includes non-mandatory changes to the titles of primary statements and introduces a statement of comprehensive income, but allows the presentation of a two statement approach with a separate income statement and statement of comprehensive income. The group has chosen to maintain existing primary statement titles and to follow the two statement approach.
IFRS 8, ‘Operating Segments’ requires separate reporting of segmental information for operating segments. Operating segments reflect the management structure of the group and the way performance is evaluated and resources allocated based on group revenue and EBITA by the group’s chief operating decision maker, defined as the executive directors. The group is focussed geographically and as a result of the implementation of IFRS 8, Africa and Asia are now presented as separate segments. Comparative information has been restated accordingly. Whilst not meeting the definition of reportable segments, the group reports separately as segments Asia, South Africa Hotels & Gaming and Corporate as this provides useful additional information.
The following standards and interpretations have been adopted by the group since 1 April 2009 with no significant impact on its consolidated results or financial position:
− Amendment to IAS 23, Revised, ’Borrowing Costs’ − Amendment to IFRS 2, ‘Share based payments’ – Vesting conditions and cancellations − Amendment to IFRS 7, ‘Financial Instruments: Disclosures’ − Amendment to IAS 32, ‘Financial Instruments: Presentation’ and IAS 1, ‘Presentation of financial statements’ – ‘Puttable financial instruments
and obligations arising on liquidation’ − Amendment to IAS 39, ‘Financial Instruments: Recognition and measurement’ – Reclassification of financial assets − IFRIC 13, ‘Customer Loyalty Programmes’ − Amendment to IFRIC 9, ‘Reassessment of Embedded Derivatives’.
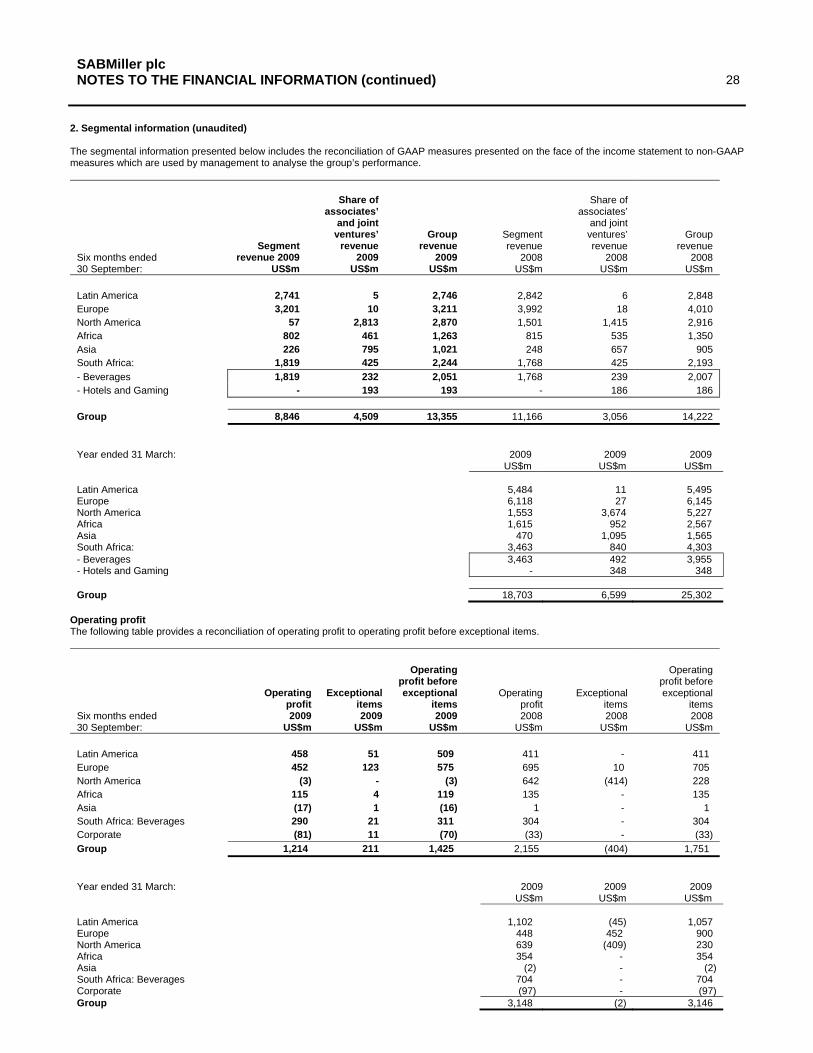
28 SABMiller plc NOTES TO THE FINANCIAL INFORMATION (continued)
2. Segmental information (unaudited)
The segmental information presented below includes the reconciliation of GAAP measures presented on the face of the income statement to non-GAAP measures which are used by management to analyse the group’s performance.
Share of Share of associates’ associates’
and joint and joint ventures’ Group Segment ventures’ Group
Segment revenue revenue revenue revenue revenue Six months ended revenue 2009 2009 2009 2008 2008 2008 30 September: US$m US$m US$m US$m US$m US$m
Latin America 2,741 5 2,746 2,842 6 2,848 Europe 3,201 10 3,211 3,992 18 4,010 North America 57 2,813 2,870 1,501 1,415 2,916 Africa 802 461 1,263 815 535 1,350 Asia 226 795 1,021 248 657 905 South Africa: 1,819 425 2,244 1,768 425 2,193 - Beverages 1,819 232 2,051 1,768 239 2,007 - Hotels and Gaming - 193 193 - 186 186
Group 8,846 4,509 13,355 11,166 3,056 14,222
Year ended 31 March: 2009 2009 2009 US$m US$m US$m
Latin America 5,484 11 5,495 Europe 6,118 27 6,145 North America 1,553 3,674 5,227 Africa 1,615 952 2,567 Asia 470 1,095 1,565 South Africa: 3,463 840 4,303 - Beverages 3,463 492 3,955 - Hotels and Gaming - 348 348
Group 18,703 6,599 25,302
Operating profit The following table provides a reconciliation of operating profit to operating profit before exceptional items.
Operating Operating profit before profit before
Operating Exceptional exceptional Operating Exceptional exceptional profit items items profit items items
Six months ended 2009 2009 2009 2008 2008 2008 30 September: US$m US$m US$m US$m US$m US$m
Latin America 458 51 509 411 - 411 Europe 452 123 575 695 10 705 North America (3) - (3) 642 (414) 228 Africa 115 4 119 135 - 135 Asia (17) 1 (16) 1 - 1 South Africa: Beverages 290 21 311 304 - 304 Corporate (81) 11 (70) (33) (33) Group 1,214 211 1,425 2,155 (404) 1,751
Year ended 31 March: 2009 2009 2009 US$m US$m US$m
Latin America 1,102 (45) 1,057 Europe 448 452 900 North America 639 (409) 230 Africa 354 - 354 Asia (2) - (2) South Africa: Beverages 704 - 704 Corporate (97) - (97) Group 3,148 (2) 3,146
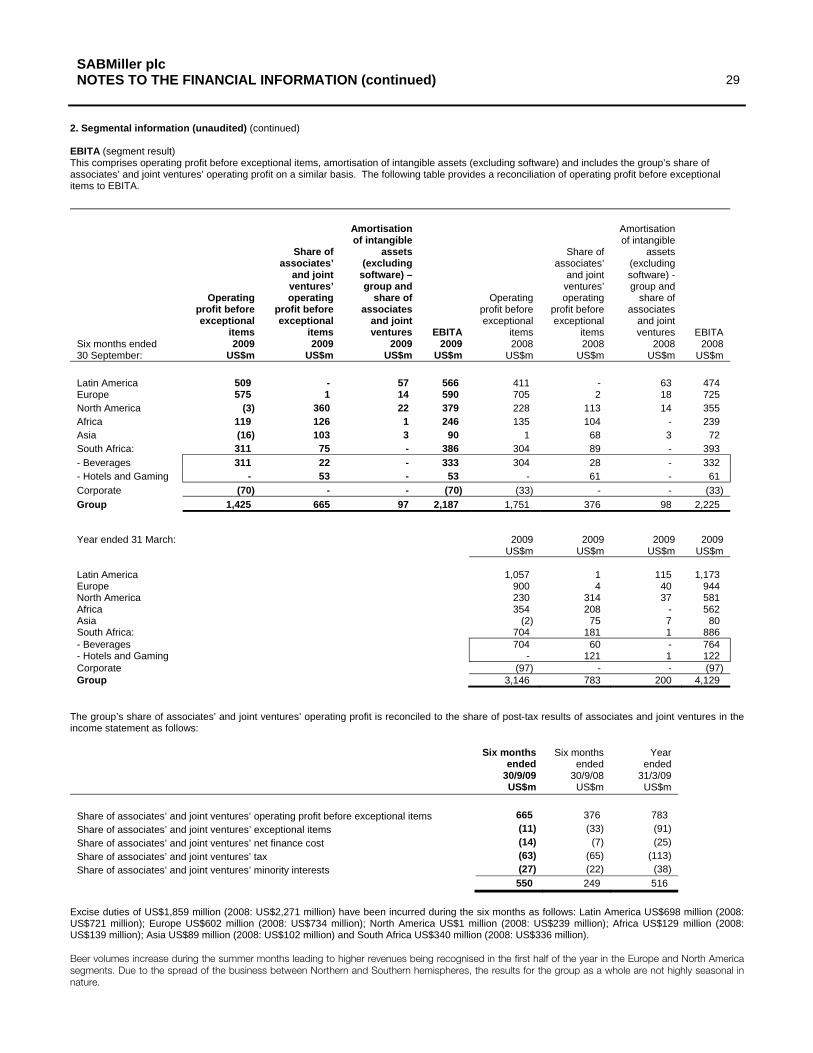
29 SABMiller plc NOTES TO THE FINANCIAL INFORMATION (continued)
2. Segmental information (unaudited) (continued)
EBITA (segment result) This comprises operating profit before exceptional items, amortisation of intangible assets (excluding software) and includes the group’s share of associates’ and joint ventures’ operating profit on a similar basis. The following table provides a reconciliation of operating profit before exceptional items to EBITA.
Amortisation Amortisation of intangible of intangible
Share of assets Share of assets associates’ (excluding associates’ (excluding
and joint software) – and joint software) - ventures’ group and ventures’ group and
Operating operating share of Operating operating share of profit before profit before associates profit before profit before associates exceptional exceptional and joint exceptional exceptional and joint
items items ventures EBITA items items ventures EBITA Six months ended 2009 2009 2009 2009 2008 2008 2008 2008 30 September: US$m US$m US$m US$m US$m US$m US$m US$m
Latin America 509 - 57 566 411 - 63 474 Europe 575 1 14 590 705 2 18 725 North America (3) 360 22 379 228 113 14 355 Africa 119 126 1 246 135 104 - 239 Asia (16) 103 3 90 1 68 3 72 South Africa: 311 75 - 386 304 89 - 393 - Beverages 311 22 - 333 304 28 - 332 - Hotels and Gaming - 53 - 53 - 61 - 61 Corporate (70) - - (70) (33) - - (33) Group 1,425 665 97 2,187 1,751 376 98 2,225
Year ended 31 March: 2009 2009 2009 2009 US$m US$m US$m US$m
Latin America 1,057 1 115 1,173 Europe 900 4 40 944 North America 230 314 37 581 Africa 354 208 - 562 Asia (2) 75 7 80 South Africa: 704 181 1 886 - Beverages 704 60 - 764 - Hotels and Gaming - 121 1 122 Corporate (97) - - (97) Group 3,146 783 200 4,129
The group’s share of associates’ and joint ventures’ operating profit is reconciled to the share of post-tax results of associates and joint ventures in the income statement as follows:
Six months Six months Year ended ended ended
30/9/09 30/9/08 31/3/09 US$m US$m US$m
Share of associates’ and joint ventures’ operating profit before exceptional items 665 376 783 Share of associates’ and joint ventures’ exceptional items (11) (33) (91) Share of associates’ and joint ventures’ net finance cost (14) (7) (25) Share of associates’ and joint ventures’ tax (63) (65) (113) Share of associates’ and joint ventures’ minority interests (27) (22) (38)
550 249 516
Excise duties of US$1,859 million (2008: US$2,271 million) have been incurred during the six months as follows: Latin America US$698 million (2008: US$721 million); Europe US$602 million (2008: US$734 million); North America US$1 million (2008: US$239 million); Africa US$129 million (2008: US$139 million); Asia US$89 million (2008: US$102 million) and South Africa US$340 million (2008: US$336 million).
Beer volumes increase during the summer months leading to higher revenues being recognised in the first half of the year in the Europe and North America segments. Due to the spread of the business between Northern and Southern hemispheres, the results for the group as a whole are not highly seasonal in nature.
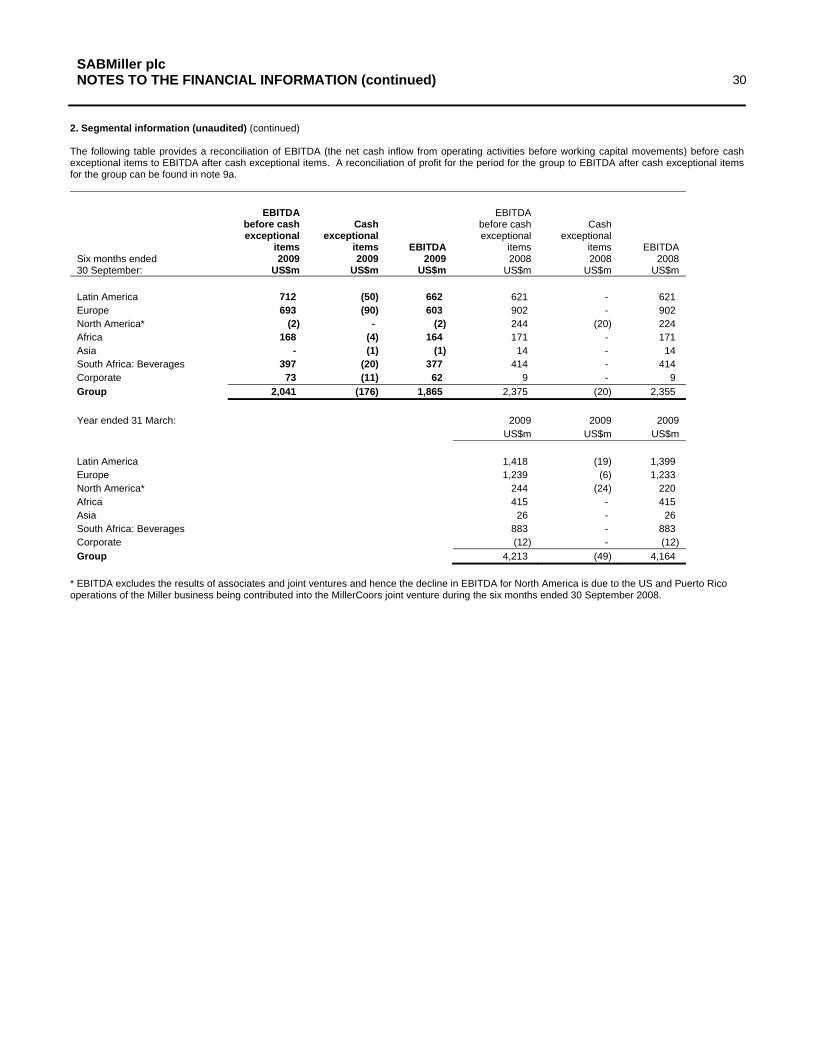
30 SABMiller plc NOTES TO THE FINANCIAL INFORMATION (continued)
2. Segmental information (unaudited) (continued)
The following table provides a reconciliation of EBITDA (the net cash inflow from operating activities before working capital movements) before cash exceptional items to EBITDA after cash exceptional items. A reconciliation of profit for the period for the group to EBITDA after cash exceptional items for the group can be found in note 9a.
EBITDA EBITDA before cash Cash before cash Cash exceptional exceptional exceptional exceptional
items items EBITDA items items EBITDA Six months ended 2009 2009 2009 2008 2008 2008 30 September: US$m US$m US$m US$m US$m US$m
Latin America 712 (50) 662 621 - 621 Europe 693 (90) 603 902 - 902 North America* (2) - (2) 244 (20) 224 Africa 168 (4) 164 171 - 171 Asia - (1) (1) 14 - 14 South Africa: Beverages 397 (20) 377 414 - 414 Corporate 73 (11) 62 9 - 9
Group 2,041 (176) 1,865 2,375 (20) 2,355
Year ended 31 March: 2009 2009 2009 US$m US$m US$m
Latin America 1,418 (19) 1,399 Europe 1,239 (6) 1,233 North America* 244 (24) 220 Africa 415 - 415 Asia 26 - 26 South Africa: Beverages 883 - 883 Corporate (12) - (12) Group 4,213 (49) 4,164
* EBITDA excludes the results of associates and joint ventures and hence the decline in EBITDA for North America is due to the US and Puerto Rico operations of the Miller business being contributed into the MillerCoors joint venture during the six months ended 30 September 2008.

31 SABMiller plc NOTES TO THE FINANCIAL INFORMATION (continued)
3. Exceptional items
Six months Six months Year ended 30/9/09 ended 30/9/08 ended 31/3/09
Unaudited Unaudited Audited US$m US$m US$m
Exceptional items included in operating profit: Business capability programme costs (170) - Integration and restructuring costs (41) (23) (110) Impairments - - (392) Profit on disposal of businesses - 437 526
Unwinding of fair value adjustments on inventory - (10) (9) Litigation - - (13) Net exceptional (losses)/gains included within operating profit (211) 404 2
Exceptional items included in net finance costs Business capability programme costs (17) - Gain on early termination of financial derivatives - - 20
Net exceptional (losses)/gains included within net finance costs (17) - 20
Share of associates’ and joint ventures’ exceptional items: Integration and restructuring costs (7) (17) (33) Unwinding of fair value adjustments on inventory (4) (7) (13) Impairment of intangible assets - - (38) Fair value losses on financial instruments - (9) (7) Share of associates’ and joint ventures’ exceptional items (11) (33) (91)
Taxation credits relating to subsidiaries’ and the group’s share of associates’ and joint ventures’ exceptional items: 31 19 56
Exceptional items included in operating profit
Business capability programme costs Following the establishment of the business capability programme which will streamline finance, human resources and procurement activities through the deployment of global systems and, within regions, the introduction of common sales, distribution and supply chain management systems, costs of US$170 million have been incurred in the period (2008: US$nil).
Integration and restructuring costs In Europe a total of US$41 million has been charged in relation to the integration and restructuring of the Romanian business following the acquisition of Bere Azuga, including the closure of a brewery and in relation to the restructuring of the Polish business including the closure of the Kielce brewery.
In 2008, a charge of US$23 million was incurred within operating profit during the period for staff retention and for certain integration costs of the US and Puerto Rico operations of the Miller business into the MillerCoors joint venture.
Profit on disposal of businesses In 2008, a profit of US$437 million arose on the deemed disposal of the US and Puerto Rico operations of the Miller business into the MillerCoors joint venture.
Unwinding of fair value adjustments on inventory In 2008, on acquisition the Grolsch inventory was fair valued to market value. The uplift is charged to the income statement as the inventory is sold. US$10 million was charged to operating profit in the six months ended 30 September 2008.
Exceptional items included within net finance costs
Business capability programme costs As a result of the business capability programme and resultant changes in treasury systems used and their differing valuation methodologies, a charge of US$17 million has been incurred to reflect differences on the fair valuation of financial instruments (2008: US$nil).
Share of associates’ and joint ventures’ exceptional items
Integration and restructuring costs During 2009, the group’s share of MillerCoors’ integration and restructuring costs was US$7 million and primarily related to relocation.
In 2008, the group’s share of MillerCoors’ integration and restructuring costs was US$17 million mainly related to retrenchment costs.
Unwinding of fair value adjustments on inventory In 2009 the group’s share of MillerCoors’ charge to operating profit in the period relating to the unwind of the fair value adjustment to inventory was US$4 million (2008: US$7 million).
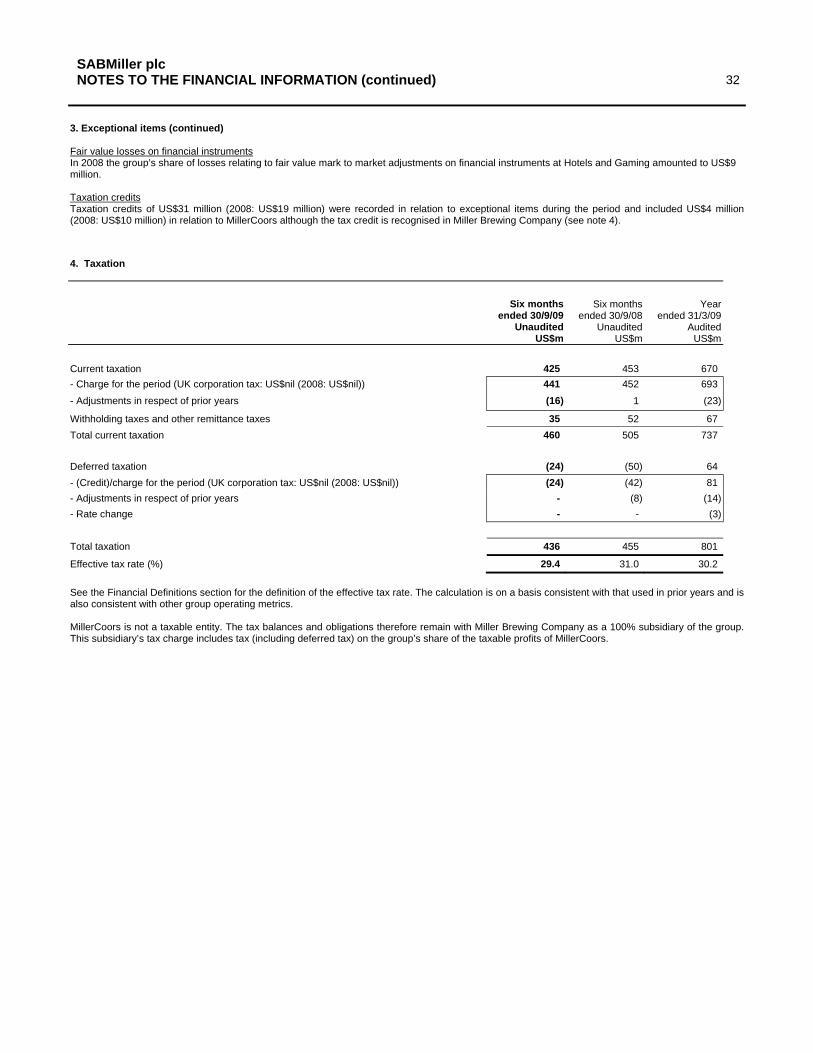
32 SABMiller plc NOTES TO THE FINANCIAL INFORMATION (continued)
3. Exceptional items (continued)
Fair value losses on financial instruments In 2008 the group’s share of losses relating to fair value mark to market adjustments on financial instruments at Hotels and Gaming amounted to US$9 million.
Taxation credits Taxation credits of US$31 million (2008: US$19 million) were recorded in relation to exceptional items during the period and included US$4 million (2008: US$10 million) in relation to MillerCoors although the tax credit is recognised in Miller Brewing Company (see note 4).
4. Taxation
Six months Six months Year ended 30/9/09 ended 30/9/08 ended 31/3/09
Unaudited Unaudited Audited US$m US$m US$m
Current taxation 425 453 670 - Charge for the period (UK corporation tax: US$nil (2008: US$nil)) 441 452 693
- Adjustments in respect of prior years (16) 1 (23)
Withholding taxes and other remittance taxes 35 52 67 Total current taxation 460 505 737
Deferred taxation (24) (50) 64 - (Credit)/charge for the period (UK corporation tax: US$nil (2008: US$nil)) (24) (42) 81 - Adjustments in respect of prior years - (8) (14) - Rate change - - (3)
Total taxation 436 455 801
Effective tax rate (%) 29.4 31.0 30.2
See the Financial Definitions section for the definition of the effective tax rate. The calculation is on a basis consistent with that used in prior years and is also consistent with other group operating metrics.
MillerCoors is not a taxable entity. The tax balances and obligations therefore remain with Miller Brewing Company as a 100% subsidiary of the group. This subsidiary’s tax charge includes tax (including deferred tax) on the group’s share of the taxable profits of MillerCoors.

33 SABMiller plc NOTES TO THE FINANCIAL INFORMATION (continued)
5. Earnings per share
Six months ended 30/9/09
Unaudited US cents
Six months ended 30/9/08
Unaudited US cents
Year ended 31/3/09
Audited US cents
Basic earnings per share 63.0 94.8 125.2
Diluted earnings per share 62.6 94.3 124.6
Headline earnings per share 64.6 65.8 119.0
Adjusted basic earnings per share 80.0 75.2 137.5
Adjusted diluted earnings per share 79.5 74.8 136.8
The weighted average number of shares was:
Six months ended 30/9/09
Unaudited Millions of
shares
Six months ended 30/9/08
Unaudited Millions of
shares
Year ended 31/3/09
Audited Millions of
shares Ordinary shares 1,627 1,506 1,514
Treasury shares (77) - (7)
ESOP trust ordinary shares (5) (6) (5)
Basic shares 1,545 1,500 1,502 Dilutive ordinary shares from share options 9 8 8 Diluted shares 1,554 1,508 1,510
The calculation of diluted earnings per share excludes 12,672,482 (2008: 13,281,197) share options that were non-dilutive for the period because the exercise price of the option exceeded the fair value of the shares during the period and 6,569,614 (2008: 6,922,745) share awards that were non-dilutive for the period because the performance conditions attached to the awards have not been met. These share awards could potentially dilute earnings per share in the future.

34 SABMiller plc NOTES TO THE FINANCIAL INFORMATION (continued)
5. Earnings per share (continued)
Adjusted and headline earnings The group presents an adjusted earnings per share figure to exclude the impact of amortisation of intangible assets (excluding capitalised software) and other non-recurring items in order to present a more useful comparison for the periods shown in the consolidated financial information. Adjusted earnings per share has been based on adjusted headline earnings for each financial period and on the same number of weighted average shares in issue as the basic earnings per share calculation. Headline earnings per share has been calculated in accordance with the South African Circular 8/2007 entitled “Headline Earnings” which forms part of the listing requirements for the JSE Ltd (JSE). The adjustments made to arrive at headline earnings and adjusted earnings are as follows:
Six months Six months Year ended 30/9/09
Unaudited ended 30/9/08
Unaudited ended 31/3/09
Audited US$m US$m US$m
Profit for the financial period attributable to equity holders of the parent 973 1,423 1,881 Headline adjustments Impairment of goodwill - - 364 Impairment of intangible assets - - 14 Impairment of property, plant and equipment - - 16 Loss on disposal of property, plant and equipment 28 - 10 Profit on disposal of businesses - (437) (526) Tax effects of the above items (6) - (4) Minority interests’ share of the above items 3 - (1) Share of joint ventures’ and associates’ headline adjustments, net of tax and minority interests - 2 34
Headline earnings 998 988 1,788 Other adjustments Business capability programme costs 187 - -Integration and restructuring costs 9 23 108 Net (gain)/loss on fair value movements on capital items* (3) 26 27 Gain on early termination of financial derivatives - - (20) Unwind of fair value adjustments on inventory - 10 9 Litigation - - 13 Amortisation of intangible assets (excluding capitalised software) 73 86 164 Tax effects of the above items (59) (48) (110) Minority interests’ share of the above items (3) (2) (4) Share of joint ventures’ and associates’ other adjustments, net of tax and minority interests 34 45 90
Adjusted earnings 1,236 1,128 2,065
* This does not include all fair value movements but includes those in relation to capital items for which hedge accounting cannot be applied.
6. Dividends
Dividends paid were as follows:
Six months Six months Yearended 30/9/09 ended 30/9/08 ended 31/3/09
Unaudited Unaudited Audited US cents US cents US cents
Prior year final dividend paid per ordinary share 42.0 42.0 42.0 Current year interim dividend paid per ordinary share - - 16.0
The interim dividend declared of 17.0 US cents per ordinary share is payable on 11 December 2009 to ordinary shareholders on the register as at 4 December 2009 and will absorb an estimated US$267 million of shareholders’ funds.
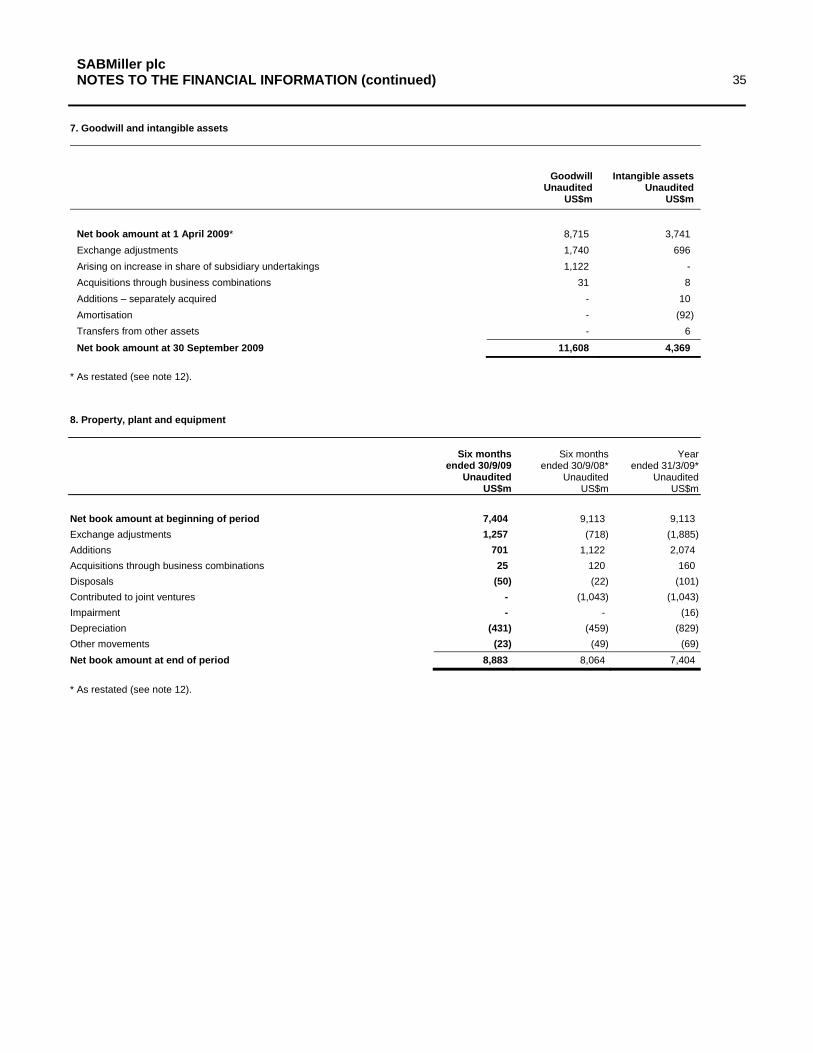
35 SABMiller plc NOTES TO THE FINANCIAL INFORMATION (continued)
7. Goodwill and intangible assets
Goodwill Unaudited
US$m
Intangible assets Unaudited
US$m
Net book amount at 1 April 2009* Exchange adjustments Arising on increase in share of subsidiary undertakings Acquisitions through business combinations Additions – separately acquired Amortisation Transfers from other assets
8,715 1,740 1,122
31 ---
3,741 696
-8
10 (92)
6
Net book amount at 30 September 2009 11,608 4,369
* As restated (see note 12).
8. Property, plant and equipment
Six months ended 30/9/09
Unaudited US$m
Six months ended 30/9/08*
Unaudited US$m
Year ended 31/3/09*
Unaudited US$m
Net book amount at beginning of period Exchange adjustments Additions Acquisitions through business combinations Disposals Contributed to joint ventures Impairment Depreciation Other movements Net book amount at end of period
7,404 1,257
701 25
(50) --
(431) (23)
8,883
9,113 (718)
1,122 120(22)
(1,043) -
(459) (49)
8,064
9,113 (1,885) 2,074
160 (101)
(1,043) (16)
(829) (69)
7,404
* As restated (see note 12).
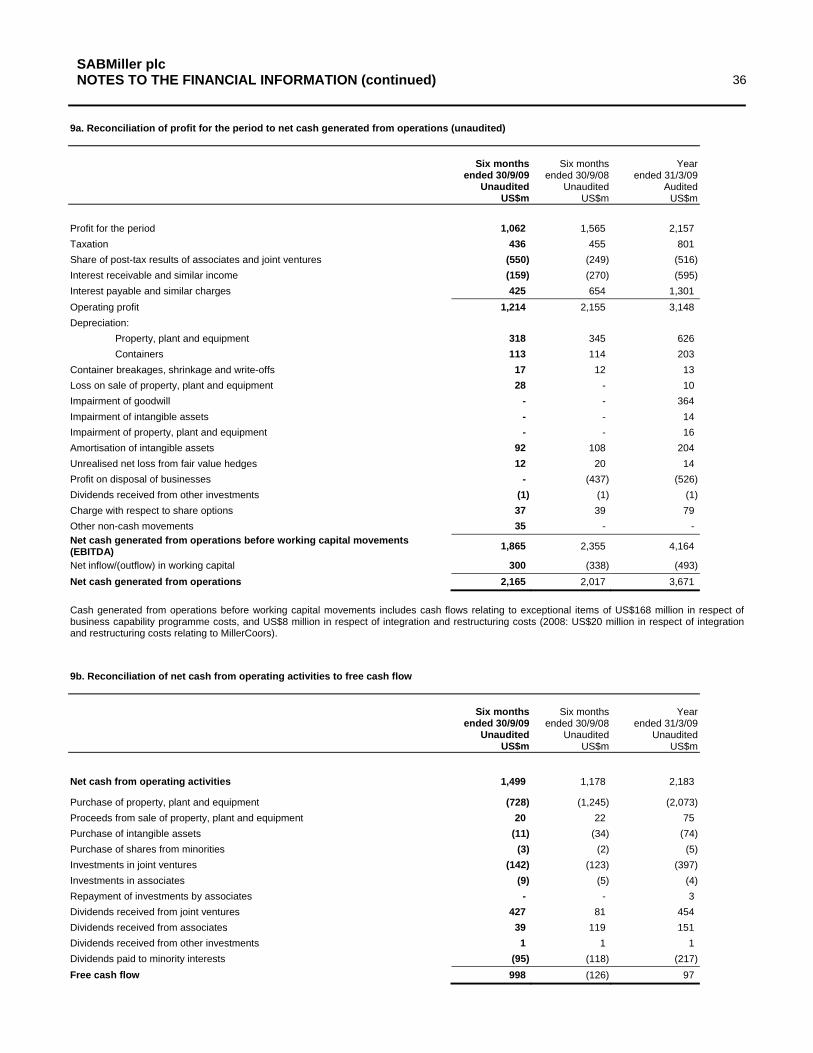
36 SABMiller plc NOTES TO THE FINANCIAL INFORMATION (continued)
9a. Reconciliation of profit for the period to net cash generated from operations (unaudited)
Six months Six months Year ended 30/9/09
Unaudited ended 30/9/08
Unaudited ended 31/3/09
Audited US$m US$m US$m
Profit for the period 1,062 1,565 2,157 Taxation 436 455 801 Share of post-tax results of associates and joint ventures (550) (249) (516) Interest receivable and similar income (159) (270) (595) Interest payable and similar charges 425 654 1,301 Operating profit 1,214 2,155 3,148 Depreciation:
Property, plant and equipment 318 345 626 Containers 113 114 203
Container breakages, shrinkage and write-offs 17 12 13 Loss on sale of property, plant and equipment 28 - 10 Impairment of goodwill - - 364 Impairment of intangible assets - - 14 Impairment of property, plant and equipment - - 16 Amortisation of intangible assets 92 108 204 Unrealised net loss from fair value hedges 12 20 14 Profit on disposal of businesses - (437) (526) Dividends received from other investments (1) (1) (1) Charge with respect to share options 37 39 79 Other non-cash movements 35 - -Net cash generated from operations before working capital movements (EBITDA) 1,865 2,355 4,164
Net inflow/(outflow) in working capital 300 (338) (493) Net cash generated from operations 2,165 2,017 3,671
Cash generated from operations before working capital movements includes cash flows relating to exceptional items of US$168 million in respect of business capability programme costs, and US$8 million in respect of integration and restructuring costs (2008: US$20 million in respect of integration and restructuring costs relating to MillerCoors).
9b. Reconciliation of net cash from operating activities to free cash flow
Six months Six months Year ended 30/9/09
Unaudited ended 30/9/08
Unaudited ended 31/3/09
Unaudited US$m US$m US$m
Net cash from operating activities 1,499 1,178 2,183
Purchase of property, plant and equipment (728) (1,245) (2,073) Proceeds from sale of property, plant and equipment 20 22 75 Purchase of intangible assets (11) (34) (74) Purchase of shares from minorities (3) (2) (5) Investments in joint ventures (142) (123) (397) Investments in associates (9) (5) (4) Repayment of investments by associates - - 3 Dividends received from joint ventures 427 81 454 Dividends received from associates 39 119 151 Dividends received from other investments 1 1 1 Dividends paid to minority interests (95) (118) (217) Free cash flow 998 (126) 97
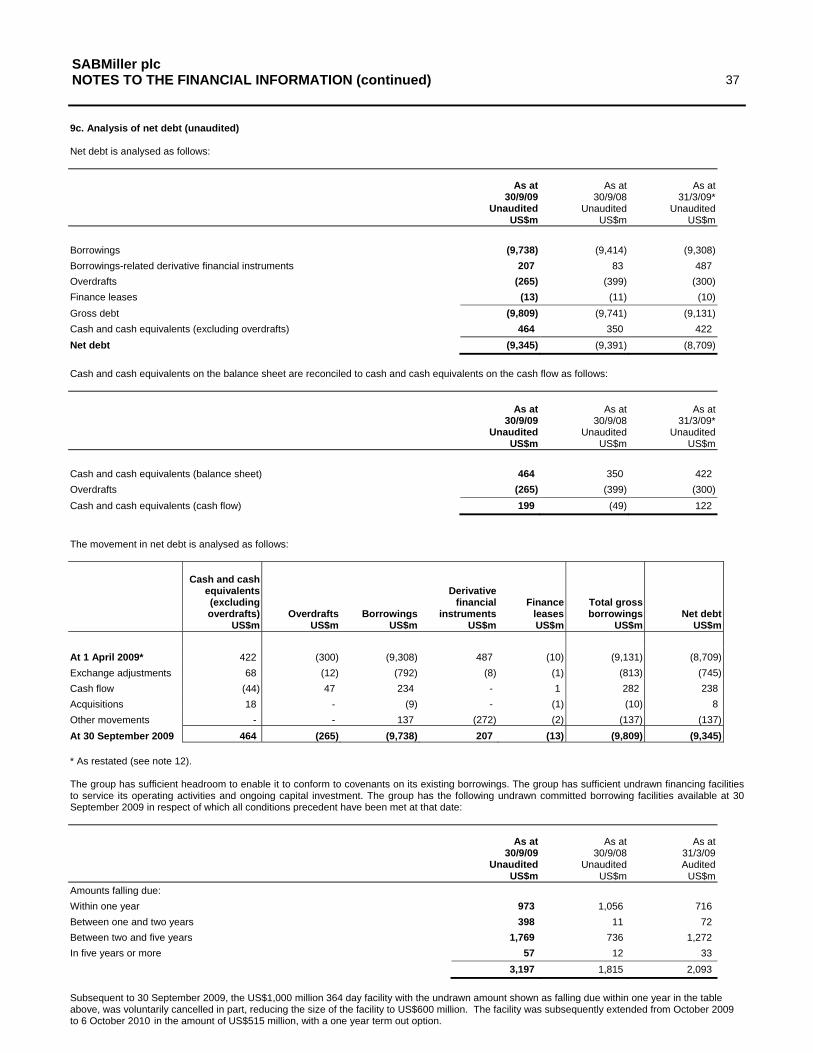
37 SABMiller plc NOTES TO THE FINANCIAL INFORMATION (continued)
9c. Analysis of net debt (unaudited)
Net debt is analysed as follows:
As at As at As at 30/9/09 30/9/08 31/3/09*
Unaudited Unaudited Unaudited US$m US$m US$m
Borrowings (9,738) (9,414) (9,308) Borrowings-related derivative financial instruments 207 83 487
Overdrafts (265) (399) (300) Finance leases (13) (11) (10) Gross debt (9,809) (9,741) (9,131) Cash and cash equivalents (excluding overdrafts) 464 350 422
Net debt (9,345) (9,391) (8,709)
Cash and cash equivalents on the balance sheet are reconciled to cash and cash equivalents on the cash flow as follows:
As at 30/9/09
Unaudited US$m
As at 30/9/08
Unaudited US$m
As at 31/3/09*
Unaudited US$m
Cash and cash equivalents (balance sheet) Overdrafts Cash and cash equivalents (cash flow)
464 (265) 199
350 (399)(49)
422 (300)
122
The movement in net debt is analysed as follows:
Cash and cash equivalents (excluding overdrafts)
US$m Overdrafts
US$m Borrowings
US$m
Derivative financial
instruments US$m
Finance leases US$m
Total gross borrowings
US$m Net debt
US$m
At 1 April 2009* Exchange adjustments Cash flow AcquisitionsOther movements At 30 September 2009
42268
(44) 18
-464
(300) (12) 47
--
(265)
(9,308) (792) 234
(9) 137
(9,738)
487 (8) --
(272) 207
(10) (1) 1
(1) (2)
(13)
(9,131) (813) 282 (10)
(137) (9,809)
(8,709) (745) 238
8 (137)
(9,345)
* As restated (see note 12).
The group has sufficient headroom to enable it to conform to covenants on its existing borrowings. The group has sufficient undrawn financing facilities to service its operating activities and ongoing capital investment. The group has the following undrawn committed borrowing facilities available at 30 September 2009 in respect of which all conditions precedent have been met at that date:
As at As at As at 30/9/09 30/9/08 31/3/09
Unaudited Unaudited Audited US$m US$m US$m
Amounts falling due: Within one year 973 1,056 716 Between one and two years 398 11 72 Between two and five years 1,769 736 1,272 In five years or more 57 12 33
3,197 1,815 2,093
Subsequent to 30 September 2009, the US$1,000 million 364 day facility with the undrawn amount shown as falling due within one year in the table above, was voluntarily cancelled in part, reducing the size of the facility to US$600 million. The facility was subsequently extended from October 2009 to 6 October 2010 in the amount of US$515 million, with a one year term out option.

38 SABMiller plc NOTES TO THE FINANCIAL INFORMATION (continued)
10. Commitments, contingencies and guarantees
Except as stated below there have been no material changes to commitments, contingencies or guarantees as disclosed in the annual financial statements for the year ended 31 March 2009.
Commitments Contracts placed for future capital expenditure for property, plant and equipment not provided in the financial statements amount to US$292 million at 30 September 2009.
As part of the business capability programme the group has entered into contracts for the provision of IT, communications and consultancy services and in relation to which the group had commitments of US$210 million at 30 September 2009.
11. Business combinations
Acquisitions
The following business combinations took effect during the period:
In April 2009 control was assumed over Bere Azuga in Romania and the group had a 94.85% interest as at 30 September 2009.
In July 2009 the group acquired an effective 40% interest in Ambo Mineral Water Share Company in Ethiopia.
In September 2009 the group acquired Maheu, a non-alcoholic maize drinks business in Zambia.
The following table represents the assets and liabilities acquired in respect of all business combinations entered into during the six months ended 30 September 2009:
Carrying values Provisional pre-acquisition fair value
US$m US$m
Intangible assets 4 8 Property, plant and equipment 34 25 Inventories 4 3 Trade and other receivables 2 1 Cash and cash equivalents 18 18 Borrowings (10) (10) Trade and other payables (4) (5)
48 40 Minority interests (14) Net assets acquired 26 Provisional goodwill 31 Consideration 57
Goodwill represents, amongst other things, tangible and intangible assets yet to be recognised separately from goodwill, potential synergies and the value of the assembled workforce.
From the date of acquisition to 30 September 2009 the following amounts have been included in the group’s income statement for the period:
US$m Income statement Revenue 2 Operating loss (5) Loss before tax (2)
If the date of the acquisitions made in the six months ended 30 September 2009 had been 1 April 2009, then the group’s revenue, operating profit and profit before tax for the six months ended 30 September 2009 would have been as follows:
US$m Income statement Revenue 8,855 Operating profit 1,211 Profit before tax 1,491
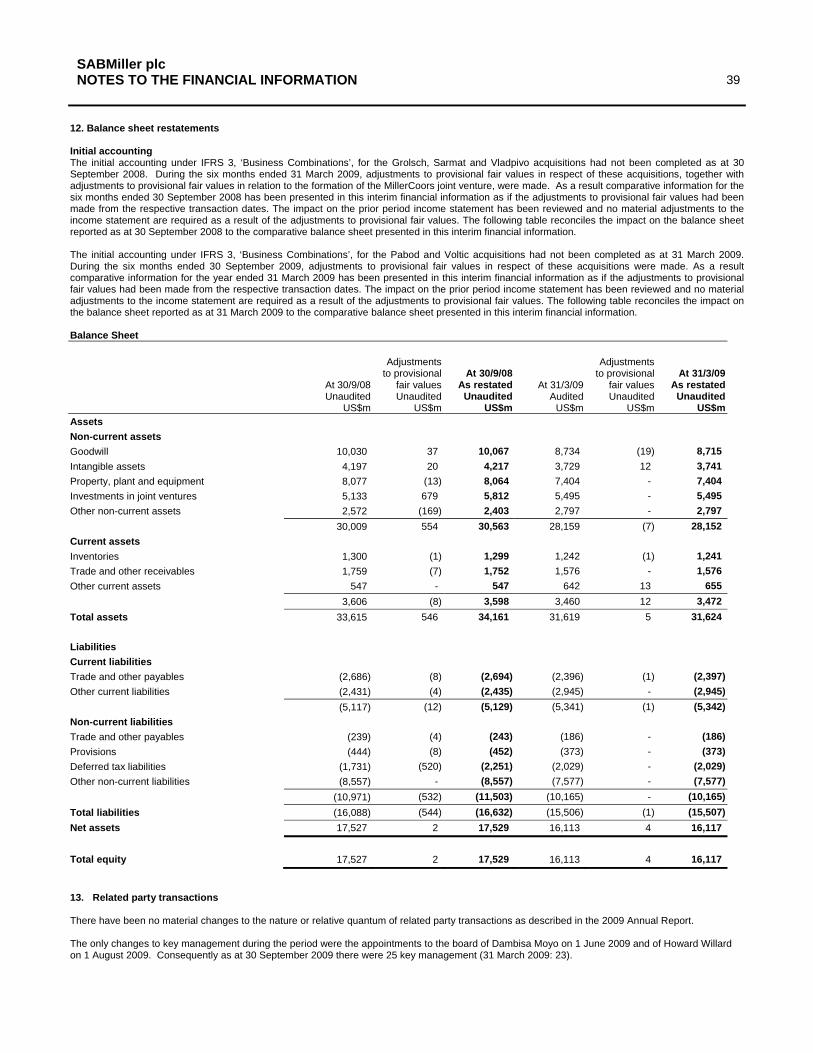
39 SABMiller plc NOTES TO THE FINANCIAL INFORMATION
12. Balance sheet restatements
Initial accounting The initial accounting under IFRS 3, ‘Business Combinations’, for the Grolsch, Sarmat and Vladpivo acquisitions had not been completed as at 30 September 2008. During the six months ended 31 March 2009, adjustments to provisional fair values in respect of these acquisitions, together with adjustments to provisional fair values in relation to the formation of the MillerCoors joint venture, were made. As a result comparative information for the six months ended 30 September 2008 has been presented in this interim financial information as if the adjustments to provisional fair values had been made from the respective transaction dates. The impact on the prior period income statement has been reviewed and no material adjustments to the income statement are required as a result of the adjustments to provisional fair values. The following table reconciles the impact on the balance sheet reported as at 30 September 2008 to the comparative balance sheet presented in this interim financial information.
The initial accounting under IFRS 3, ‘Business Combinations’, for the Pabod and Voltic acquisitions had not been completed as at 31 March 2009. During the six months ended 30 September 2009, adjustments to provisional fair values in respect of these acquisitions were made. As a result comparative information for the year ended 31 March 2009 has been presented in this interim financial information as if the adjustments to provisional fair values had been made from the respective transaction dates. The impact on the prior period income statement has been reviewed and no material adjustments to the income statement are required as a result of the adjustments to provisional fair values. The following table reconciles the impact on the balance sheet reported as at 31 March 2009 to the comparative balance sheet presented in this interim financial information.
Balance Sheet
At 30/9/08 Unaudited
US$m
Adjustments to provisional
fair values Unaudited
US$m
At 30/9/08 As restated
Unaudited US$m
At 31/3/09 Audited
US$m
Adjustments to provisional
fair values Unaudited
US$m
At 31/3/09 As restated
Unaudited US$m
Assets Non-current assets Goodwill 10,030 Intangible assets 4,197 Property, plant and equipment 8,077 Investments in joint ventures 5,133 Other non-current assets 2,572 30,009 Current assets Inventories 1,300 Trade and other receivables 1,759 Other current assets 547 3,606 Total assets 33,615
Liabilities Current liabilities Trade and other payables (2,686) Other current liabilities (2,431) (5,117) Non-current liabilities Trade and other payables (239) Provisions (444) Deferred tax liabilities (1,731) Other non-current liabilities (8,557) (10,971) Total liabilities (16,088)
37 20
(13) 679
(169) 554
(1) (7) -
(8) 546
(8) (4)
10,067 4,217 8,064 5,812 2,403
30,563
1,299 1,752
547 3,598
34,161
(2,694) (2,435)
8,734 3,729 7,404 5,495 2,797
28,159
1,242 1,576
6423,460
31,619
(2,396)(2,945)
(19) 12
---
(7)
(1) -
13 12
5
(1) -
8,715 3,741 7,404 5,495 2,797
28,152
1,241 1,576
6553,472
31,624
(2,397) (2,945)
(12)
(4) (8)
(520) -
(532) (544)
(5,129)
(243) (452)
(2,251) (8,557)
(11,503) (16,632)
(5,341)
(186) (373)
(2,029) (7,577)
(10,165) (15,506)
(1)
-----
(1)
(5,342)
(186) (373)
(2,029) (7,577)
(10,165) (15,507)
Net assets 17,527 2 17,529 16,113 4 16,117
Total equity 17,527 2 17,529 16,113 4 16,117
13. Related party transactions
There have been no material changes to the nature or relative quantum of related party transactions as described in the 2009 Annual Report.
The only changes to key management during the period were the appointments to the board of Dambisa Moyo on 1 June 2009 and of Howard Willard on 1 August 2009. Consequently as at 30 September 2009 there were 25 key management (31 March 2009: 23).

40 SABMiller plc NOTES TO THE FINANCIAL INFORMATION
14. Post balance sheet events
Subsequent to 30 September 2009, the US$1,000 million 364 day facility was voluntarily cancelled in part, reducing the size of the facility to US$600 million. The facility was subsequently extended from October 2009 to 6 October 2010 in the amount of US$515 million, with a one year term out option.
On 12 October 2009, SABSA Holdings Pty Ltd, a wholly owned subsidiary of the group, subscribed for US$65 million preference shares in Tsogo Sun Gaming (Pty) Ltd (TSG), a wholly owned subsidiary of the group's associate, Tsogo Sun Holdings Ltd (TSH), as the group's share of the funding for the 30% increase in the TSH group's effective interest in Tsogo Sun KwaZulu-Natal (Pty) Ltd, the licensee and operator of the Suncoast Casino in Durban.
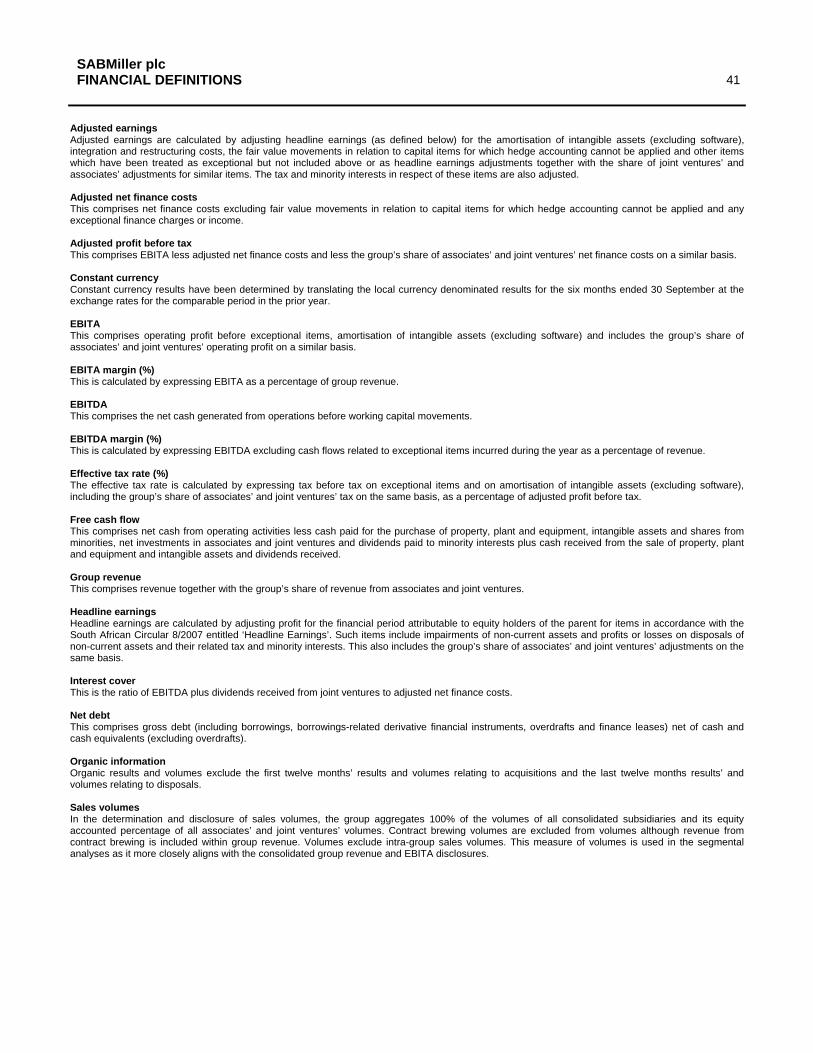
41 SABMiller plc FINANCIAL DEFINITIONS
Adjusted earnings Adjusted earnings are calculated by adjusting headline earnings (as defined below) for the amortisation of intangible assets (excluding software), integration and restructuring costs, the fair value movements in relation to capital items for which hedge accounting cannot be applied and other items which have been treated as exceptional but not included above or as headline earnings adjustments together with the share of joint ventures’ and associates’ adjustments for similar items. The tax and minority interests in respect of these items are also adjusted.
Adjusted net finance costs This comprises net finance costs excluding fair value movements in relation to capital items for which hedge accounting cannot be applied and any exceptional finance charges or income.
Adjusted profit before tax This comprises EBITA less adjusted net finance costs and less the group’s share of associates’ and joint ventures’ net finance costs on a similar basis.
Constant currency Constant currency results have been determined by translating the local currency denominated results for the six months ended 30 September at the exchange rates for the comparable period in the prior year.
EBITA This comprises operating profit before exceptional items, amortisation of intangible assets (excluding software) and includes the group’s share of associates’ and joint ventures’ operating profit on a similar basis.
EBITA margin (%) This is calculated by expressing EBITA as a percentage of group revenue.
EBITDA This comprises the net cash generated from operations before working capital movements.
EBITDA margin (%) This is calculated by expressing EBITDA excluding cash flows related to exceptional items incurred during the year as a percentage of revenue.
Effective tax rate (%) The effective tax rate is calculated by expressing tax before tax on exceptional items and on amortisation of intangible assets (excluding software), including the group’s share of associates’ and joint ventures’ tax on the same basis, as a percentage of adjusted profit before tax.
Free cash flow This comprises net cash from operating activities less cash paid for the purchase of property, plant and equipment, intangible assets and shares from minorities, net investments in associates and joint ventures and dividends paid to minority interests plus cash received from the sale of property, plant and equipment and intangible assets and dividends received.
Group revenue This comprises revenue together with the group’s share of revenue from associates and joint ventures.
Headline earnings Headline earnings are calculated by adjusting profit for the financial period attributable to equity holders of the parent for items in accordance with the South African Circular 8/2007 entitled ‘Headline Earnings’. Such items include impairments of non-current assets and profits or losses on disposals of non-current assets and their related tax and minority interests. This also includes the group’s share of associates’ and joint ventures’ adjustments on the same basis.
Interest cover This is the ratio of EBITDA plus dividends received from joint ventures to adjusted net finance costs.
Net debt This comprises gross debt (including borrowings, borrowings-related derivative financial instruments, overdrafts and finance leases) net of cash and cash equivalents (excluding overdrafts).
Organic information Organic results and volumes exclude the first twelve months’ results and volumes relating to acquisitions and the last twelve months results’ and volumes relating to disposals.
Sales volumes In the determination and disclosure of sales volumes, the group aggregates 100% of the volumes of all consolidated subsidiaries and its equity accounted percentage of all associates’ and joint ventures’ volumes. Contract brewing volumes are excluded from volumes although revenue from contract brewing is included within group revenue. Volumes exclude intra-group sales volumes. This measure of volumes is used in the segmental analyses as it more closely aligns with the consolidated group revenue and EBITA disclosures.

42 SABMiller plc FORWARD-LOOKING STATEMENTS
This announcement does not constitute an offer to sell or issue or the solicitation of an offer to buy or acquire ordinary shares in the capital of SABMiller plc (the "Company") or any other securities of the Company in any jurisdiction or an inducement to enter into investment activity.
This announcement includes ‘forward-looking statements’ with respect to certain of SABMiller plc’s plans, current goals and expectations relating to its future financial condition, performance and results. These statements contain the words “anticipate”, “believe”, “intend”, “estimate”, “expect” and words of similar meaning. All statements other than statements of historical facts included in this announcement, including, without limitation, those regarding the Company’s financial position, business strategy, plans and objectives of management for future operations (including development plans and objectives relating to the Company’s products and services) are forward-looking statements. Such forward-looking statements involve known and unknown risks, uncertainties and other important factors that could cause the actual results, performance or achievements of the Company to be materially different from future results, performance or achievements expressed or implied by such forward-looking statements. Such forward-looking statements are based on numerous assumptions regarding the Company’s present and future business strategies and the environment in which the Company will operate in the future. These forward-looking statements speak only as at the date of this announcement. The Company expressly disclaims any obligation or undertaking to disseminate any updates or revisions to any forward-looking statements contained herein to reflect any change in the Company’s expectations with regard thereto or any change in events, conditions or circumstances on which any such statement is based. The past business and financial performance of SABMiller plc is not to be relied on as an indication of its future performance.

43 SABMiller plc ADMINISTRATION
SABMiller plc Incorporated in England and Wales (Registration No. 3528416)
General Counsel and Group Company Secretary John Davidson
Registered Office SABMiller House
Church Street West Woking
Surrey, England GU21 6HS
Facsimile +44 1483 264103 Telephone +44 1483 264000
Head Office One Stanhope Gate
London, England W1K 1AF
Facsimile +44 20 7659 0111 Telephone +44 20 7659 0100
Internet address http://www.sabmiller.com
Investor Relations Telephone +44 20 7659 0100
Email: [email protected]
Sustainable Development Telephone +44 1483 264139
Email: [email protected]
Independent Auditors PricewaterhouseCoopers LLP
1 Embankment Place London, England
WC2N 6RH Facsimile +44 20 7822 4652 Telephone +44 20 7583 5000
Registrar (United Kingdom) Capita Registrars
The Registry 34 Beckenham Road
Beckenham Kent, England
BR3 4TU Facsimile +44 20 8658 2342
Telephone +44 20 8639 3399 (outside UK) Telephone 0871 664 0300 (from UK)
(calls cost 10p per minute plus network extras, lines are open 8.30am-5.30pm Mon-Fri) Email: [email protected]
www.capitaregistrars.com
Registrar (South Africa) Computershare Investor Services (Pty) Limited
70 Marshall Street, Johannesburg PO Box 61051
Marshalltown 2107 South Africa
Facsimile +27 11 370 5487 Telephone +27 11 370 5000
United States ADR Depositary The Bank of New York Mellon
Shareholder Services PO Box 358516
Pittsburgh PA 15252-8516 United States of America
Telephone +1 888 269 2377 Telephone +1 888 BNY ADRS (toll free within the USA)
Telephone: +1 201 680 6825 (outside USA) Email: [email protected]
www.adrbnymellon.com