s3.amazonaws.coms3.amazonaws.com/zanran_storage/ types of services received...
TRANSCRIPT


AFGHANISTAN HEALTH SURVEY 2006 Estimates of Priority Health Indicators for Rural Afghanistan
Indian Institute of Health
Management Research
Johns Hopkins University Bloomberg School of Public Health

ii
Photographs courtesy: Johns Hopkins/IIHMR Kabul Office Kabul, Afghanistan Cover Design: Anna Knutzen Binay Kumar
iii
CONTENTS LIST OF TABLES .................................................................................................................... v LIST OF FIGURES ................................................................................................................ vii LIST OF ACRONYMS ......................................................................................................... viii ACKNOWLEDGMENTS ....................................................................................................... ix EXECUTIVE SUMMARY ....................................................................................................... x INTRODUCTION ...................................................................................................................1
BACKGROUND .................................................................................................................................. 1 MAIN OBJECTIVES ............................................................................................................................ 1
METHODOLOGY ...................................................................................................................3
SAMPLING FRAME ............................................................................................................................ 3 SAMPLING DESIGN ........................................................................................................................... 3 QUESTIONNAIRES ........................................................................................................................... 4 ETHICAL APPROVAL ....................................................................................................................... 6 TRAINING AND FIELDWORK ....................................................................................................... 6 DATA PROCESSING .......................................................................................................................... 7 DATA ANALYSIS ............................................................................................................................... 7 COVERAGE OF THE SAMPLE ........................................................................................................ 7
HOUSEHOLD AND POPULATION CHARACTERISTICS ............................................ 10
POPULATION DISTRIBUTION BY AGE AND SEX .................................................................. 10 HOUSEHOLD COMPOSITION ..................................................................................................... 13 HOUSEHOLD POSSESSIONS ......................................................................................................... 14 WEALTH INDEX .............................................................................................................................. 14 EDUCATIONAL ATTAINMENT .................................................................................................. 15
Ever Been to School ............................................................................................................. 15 Mean Years of Schooling ......................................................................................................16 Current School Attendance ..................................................................................................18
CHARACTERISTICS OF SURVEY RESPONDENTS .................................................................. 19 MODES OF TRANSPORTATION USED TO TRAVEL TO NEAREST HEALTH FACILITY ........................................................................................................................................... 21 DISTANCE TO THE NEAREST HEALTH FACILITY ............................................................... 22
INFANT AND UNDER-FIVE MORTALITY ...................................................................... 23
METHODS ......................................................................................................................................... 23 SOURCES OF ERROR IN MORTALITY ESTIMATES AND SENSITIVITY ANALYSIS ........ 24 FINAL RESULTS FOR ESTIMATES OF MORTALITY ............................................................... 30 CONCLUSION .................................................................................................................................. 31
MATERNAL AND CHILD HEALTH AND NUTRITION ................................................ 32
CONTRACEPTION KNOWLEDGE AND USE ........................................................................... 32 Knowledge of Contraceptive Methods ................................................................................32 Current Use of Contraception .............................................................................................33 Trends in Contraception Use ...............................................................................................36
ANTENATAL CARE ........................................................................................................................ 37 Antenatal Care Coverage ......................................................................................................37

iv
Types of Services Received ...................................................................................................37 Trends in Antenatal Care Use ..............................................................................................40
TETANUS TOXOID VACCINATIONS ........................................................................................ 41 Data Quality Assessment ......................................................................................................41 Tetanus Toxoid Coverage.....................................................................................................42
DELIVERY CARE ............................................................................................................................. 43 Place of Delivery ...................................................................................................................43 Skilled Birth Attendance .......................................................................................................44 Trends in Skilled Birth Attendance ......................................................................................46
CHILDHOOD IMMUNIZATION .................................................................................................. 47 Immunization Coverage .......................................................................................................47 Trends in Immunization Coverage ......................................................................................50
BREASTFEEDING ............................................................................................................................ 51 CONCLUSION .................................................................................................................................. 54
PERCEPTIONS OF HEALTH SERVICES, CARE-SEEKING PRACTICES AND HEALTH EXPENDITURES ................................................................................................. 55
PERCEPTIONS OF HEALTH SERVICES ...................................................................................... 55 ILLNESS AND INJURY EPISODES IN THE PAST THIRTY DAYS .......................................... 57 CARE-SEEKING BEHAVIOR .......................................................................................................... 59
Treatment Seeking outside the Home .................................................................................59 Reasons for not Seeking Care ...............................................................................................59 Provider Preferences .............................................................................................................62
HEALTH EXPENDITURES ............................................................................................................. 67 Out of Pocket Expenditures .................................................................................................67 Out-of-Pocket Expenditures by Provider Type ..................................................................69 Approximate Estimation of Average Annual Per Capita Expenditures ............................72 Distress Financing .................................................................................................................72
CONCLUSION .................................................................................................................................. 77 REFERENCES ........................................................................................................................ 78 APPENDIX A: SUPPLEMENTAL DATA QUALITY TABLES ON MORTALITY ........ 81 APPENDIX B: ESTIMATES OF SAMPLING ERRORS ..................................................... 83 APPENDIX C: QUESTIONNAIRES .................................................................................... 86

v
LIST OF TABLES Table 2.1: Number of clusters, households and individuals covered ......................................... 9 Table 3.1: Population distribution by age and sex ................................................................... 11 Table 3.2: Comparison of population distribution in AHS and MICS ................................... 12 Table 3.3: Household composition .......................................................................................... 13 Table 3.4: Percentage of households possessing various durable consumer goods ................... 15 Table 3.5: School attendance by sex, age and wealth status ..................................................... 16 Table 3.6: Mean number of completed years of school by sex, among people ever attending school ....................................................................................................................... 17 Table 3.7: Current school attendance by age group and wealth status .................................... 18 Table 3.8: Age and education of respondents in the Women’s Questionnaire ........................ 19 Table 3.9: Exposure to Media .................................................................................................. 20 Table 4.1: IMR estimates by age of mother ............................................................................. 25 Table 4.2: U5MR estimates by age of mother .......................................................................... 25 Table 4.3: Tabulation of total children born and dead by age of mother and sex of child ...... 26 Table 4.4: Proportion of children dead, sex ratio at birth and ratio of proportion of dead boys to proportion of dead girls by age of mother .................................................................. 26 Table 4.5: Difference between observed and expected number of girls (if the observed number of boys is correct) ....................................................................................................... 28 Table 4.6: Sensitivity analysis: varying percentages of girls dead of the total # of under-reported girls ............................................................................................................................ 29 Table 4.7: Sensitivity analysis: IMR estimates for varying proportion dead of under-reported girls ............................................................................................................................ 29 Table 4.8: Sensitivity analysis: U5MR estimates for varying proportion dead of under-reported girls ............................................................................................................................ 29 Table 4.9: IMR and U5MR estimates ...................................................................................... 30 Table 5.1: Knowledge of contraception methods .................................................................... 34 Table 5.2: Contraception use ................................................................................................... 35 Table 5.3: Antenatal care use ................................................................................................... 38 Table 5.4: Types of services received during antenatal care visit ............................................. 39 Table 5.5: Tetanus Toxoid coverage ........................................................................................ 42 Table 5.6: Use of skilled ANC and receipt of Tetanus Toxoid .............................................. 42 Table 5.7: Skilled ANC and complete Tetanus Toxoid immunization (TT2) ......................... 42 Table 5.8: Institutional deliveries ............................................................................................. 44 Table 5.9: Skilled birth attendance .......................................................................................... 45 Table 5.10: Vaccine receipt by background characteristics ...................................................... 49 Table 5.11: Trends in immunization coverage ......................................................................... 51 Table 5.12: Breastfeeding ......................................................................................................... 53 Table 6.1: Perceptions of health services by household characteristics .................................... 56 Table 6.2: Distribution of reported illnesses and injuries in the last 30 days by age, sex and wealth status ............................................................................................................................. 58 Table 6.3: Care-seeking behavior, by age, sex and wealth status .............................................. 61 Table 6.4: Types of providers sought for first, second and third visits .................................... 62 Table 6.5: Care-seeking behavior and provider preferences for the first provider ................... 64 Table 6.6: Care-seeking behavior and provider preferences for the second provider .............. 65

vi
Table 6.7: Care-seeking behavior and provider preferences for the third provider ................. 66 Table 6.8: Out-of-pocket health expenditures, by age, sex, wealth quintile and travel time to facility .................................................................................................................................. 70 Table 6.9: Out-of-pocket health expenditures, by provider type (among households that only saw one provider) ............................................................................................................. 71 Table 6.10: Financial distress incurred by households seeking care, by age, sex, wealth quintile and travel time to facility ............................................................................................ 74 Table 6.11: Sources of money used to pay for health care among households incurring distress financing, by household wealth status ......................................................................... 74 Table 6.12: “Severe distress financing” incurred by households seeking care, by age, sex, wealth quintile and travel time to facility ................................................................................ 75 Table 6.13: Median amount of Afghanis paid for health care by distress financing status, patient age, patient sex, wealth status and travel time to facility .............................................. 75 Table 6.14: Distribution of types of “severe distress financing” by wealth status .................... 77

vii
LIST OF FIGURES
Figure 2.1: Distribution of clusters in the Afghanistan Health Survey 2006 ............................ 8 Figure 3.1: Afghanistan Population Pyramid (AHS 2006) ...................................................... 11 Figure 3.2: Afghanistan Population Pyramid (MICS 2003) ..................................................... 13 Figure 3.3: Mean number of school years by age group and sex, among people ever ............. 17 attending school ....................................................................................................................... 17 Figure 5.1: Trends in contraceptive use in rural Afghanistan ................................................. 36 Figure 5.2: Trends in skilled antenatal care utilization in rural Afghanistan .......................... 40 Figure 5.3: Trends in utilization of skilled birth attendants in rural Afghanistan .................. 46 Figure 6.1: Types of Providers sought for first, second and third visits .................................. 63 Figure 6.2: Sources of money used to pay for health care among households incurring distress financing ...................................................................................................................... 74 Figure 6.3: Sources of money for households incurring “severe distress financing” ............... 76
viii
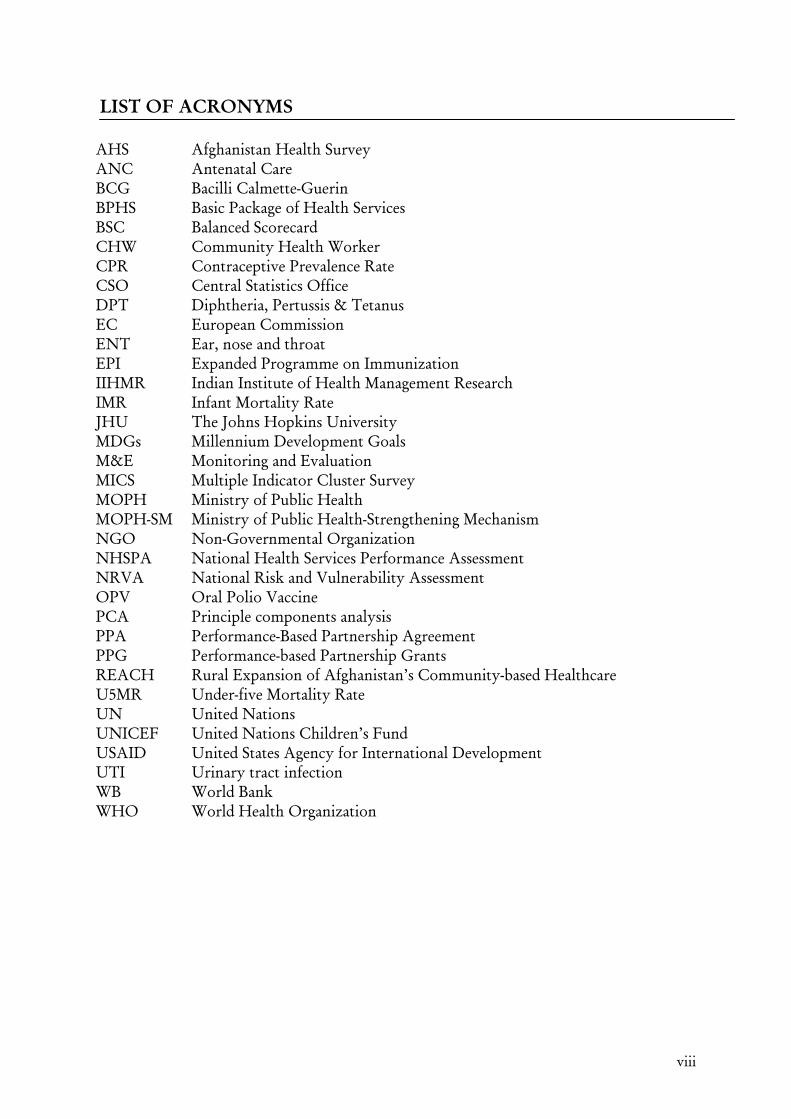
LIST OF ACRONYMS AHS Afghanistan Health Survey ANC Antenatal Care BCG Bacilli Calmette-Guerin BPHS Basic Package of Health Services BSC Balanced Scorecard CHW Community Health Worker CPR Contraceptive Prevalence Rate CSO Central Statistics Office DPT Diphtheria, Pertussis & Tetanus EC European Commission ENT Ear, nose and throat EPI Expanded Programme on Immunization IIHMR Indian Institute of Health Management Research IMR Infant Mortality Rate JHU The Johns Hopkins University MDGs Millennium Development Goals M&E Monitoring and Evaluation MICS Multiple Indicator Cluster Survey MOPH Ministry of Public Health MOPH-SM Ministry of Public Health-Strengthening Mechanism NGO Non-Governmental Organization NHSPA National Health Services Performance Assessment NRVA National Risk and Vulnerability Assessment OPV Oral Polio Vaccine PCA Principle components analysis PPA Performance-Based Partnership Agreement PPG Performance-based Partnership Grants REACH Rural Expansion of Afghanistan’s Community-based Healthcare U5MR Under-five Mortality Rate UN United Nations UNICEF United Nations Children’s Fund USAID United States Agency for International Development UTI Urinary tract infection WB World Bank WHO World Health Organization

ix
ACKNOWLEDGMENTS
The Afghanistan Health Survey (AHS), 2006, was conducted at the request of the Ministry of Public Health (MOPH). The survey was implemented by the Monitoring and Evaluation Department of the MOPH, with technical assistance provided in each phase of the survey by the Johns Hopkins University (JHU) and Indian Institute of Health Management Research (IIHMR). The AHS 2006 was funded through the Third Party Evaluation Contract between the MOPH and JHU/IIHMR.
The findings of this survey include information on many priority maternal and child health indicators. The results from this survey are instrumental in evaluating the level of progress made in the health sector in Afghanistan since the implementation of the Basic Package of Health Services (BPHS) began in 2003.
Many people contributed to the success of this survey. Experts from international and national non-governmental organizations and multi-lateral funding and technical agencies participated in the planning of the survey and are instrumental in its success. Professionals from the MOPH and JHU/IIHMR office in Kabul were involved in all aspects of planning, implementation and dissemination.
Special acknowledgement goes to the men and women of Afghanistan who collected data in difficult conditions and the people of Afghanistan who took time from their daily lives to participate in this survey.
The design, analyses and report were prepared by a team from the MOPH and JHU/IIHMR, including Aneesa Arur, Rahmatullah Azfar, Zakria Barakati, Stanley Becker, Gilbert Burnham, Vikas Dwivedi, Anbrasi Edward, Syed Ahmed Gawhari, Shivam Gupta, Peter Hansen, Mohammed Ismail Hassanzai, Binay Kumar, Dhirendra Kumar, Eric Maiese, Haseebullah Niayesh, David Peters, Krishna Rao, Ihsan Sahak, L.P. Singh, Laura Steinhardt, Sandhya Sundaram, Kavitha Viswanathan, Earl Wall and Rajpal Singh Yadav. Kavitha Viswanathan ([email protected]) led the writing of the report.

x
EXECUTIVE SUMMARY
The 2006 Afghanistan Health Survey (AHS) is a population based survey designed to provide information on maternal and child health, child survival, family planning, health care utilization and related expenditures in rural Afghanistan. Other national surveys such as the Multiple Indicator Cluster Survey (MICS 2003) and the National Risk and Vulnerability Assessment (NRVA 2005) have both produced estimates on priority maternal and child health indicators. However, neither the MICS nor the NRVA provide information on what has occurred in Afghanistan’s heath sector following implementation of the Basic Package of Health Services (BPHS). The reference period for many of the indicators in the MICS and NRVA pre-dates implementation of the BPHS. The results from the AHS are instrumental in evaluating the level of progress made in the health sector in Afghanistan since the implementation of the BPHS began in late 2003 and 2004.
The AHS is a multistage cluster survey that is representative of most of rural
Afghanistan (excluding 6 major cities and provinces and districts that could not be covered due to insecurity). The sampling frame used to select villages for the survey was obtained from the Central Statistics Office (CSO) in July 2006. The sampling frame included over 45,000 enumeration units in rural and urban areas. The AHS included a total of 425 sampled clusters, of which 397 were completed. Twenty eight clusters were not completed due to security reasons. The final sample included 8,278 households. In each sampled household, all ever-married women between 10 and 49 years of age were interviewed, as well as primary caretakers of children 0-59 months of age whose mothers were either dead or no longer living in the household. Data collection started in mid-September and was completed by late December 2006.
The AHS 2006 was conducted at the request of the Ministry of Public Health
(MOPH). The Monitoring and Evaluation Department implemented the survey with technical assistance in all aspects of the survey from Johns Hopkins University (JHU) and the Indian Institute of Health Management Research (IIHMR).
The main objective of this report is to provide estimates of priority health
indicators for rural Afghanistan. The priority indicators to be measured include the following:
• Proportion of births attended by a doctor/nurse/midwife; • Contraceptive prevalence rate; • Proportion of women receiving ante-natal care during pregnancy; • Proportion of pregnant women receiving tetanus injections; • Proportion of children 12-23 months of age having BCG immunization; • Proportion of children 12-23 months of age having OPV3 immunization; • Proportion of children 12-23 months of age having DPT3 immunization; • Proportion of children 12-23 months of age having measles immunization; • Proportion of children 12-23 months of age fully immunized; • Proportion of children 6-59 months of age receiving vitamin A
supplementation;

xi
• Proportion of children 0-5 months who were exclusively breastfed in the last 24 hours;
• Proportion of children 6-9 months who received breast milk and appropriate complementary food for the last 24 hours;
• Infant Mortality Rate; • Under-five Mortality Rate.
MATERNAL HEALTH INDICATORS Contraceptive Prevalence Rate: Questions on contraception were only asked of currently married women. Thirty three percent of currently married women in the sample demonstrated knowledge of at least one modern method. Some respondents may know and even practice certain traditional methods of birth control without formally identifying them as methods of birth control. Current use of at least one modern contraceptive method was 16% by all currently married women. Comparisons of contraceptive prevalence in rural Afghanistan were made between estimates from the 2003 Multiple Indicator Cluster Survey (MICS 2003), the 2005 National Risk and Vulnerability Assessment (NRVA 2005) and AHS 2006. There has been a threefold increase in use of modern contraceptives in rural Afghanistan, from 5% in the MICS 2003 to 16% in the AHS 2006. Skilled Antenatal Care: Skilled antenatal care was defined as receiving care from a doctor, midwife, nurse or CHW at least one time during a woman’s most recent pregnancy in the two years preceding the survey. Slightly over 32% of the respondents who were pregnant in the last 2 years saw a skilled antenatal care provider during their most recent pregnancy. Seventeen percent (17%) of respondents saw a traditional birth attendant and 51% did not see anyone for their pregnancy. The educational status of a respondent is strongly associated with receipt of antenatal care from a skilled provider. Fifty two percent (52%) of respondents who had some schooling received antenatal care from a skilled provider compared to 31% of respondents who had never attended school. Thirty nine percent (39%) of respondents who lived less than 2 hours from a health facility received skilled antenatal care compared to 8% of respondents who lived more than 6 hours away from a facility. Trends in antenatal care use in rural Afghanistan show a several-fold increase from 5% in the MICS 2003 to 32% in the AHS 2006. Skilled Birth Attendants: Doctors, midwives and nurses were considered skilled attendants for delivery care. Use of skilled birth attendants was substantially lower than use of skilled antenatal care, but a threefold increase is observed in rural Afghanistan, from 6% in MICS 2003 to 19% in AHS 2006. The age of a woman and her educational and wealth status and travel time to the facility are all associated with use of a skilled provider for delivery care. Women who live less than 2 hours from a health facility were almost twice as likely to receive assistance from a skilled birth attendant compared to women who live between 2 and 3 hours from a facility (26% of respondents living within 2 hours used skilled birth attendants compared to 15% of respondents living between 2 and 3 hours from a facility).

xii
Institutional Deliveries: Delivering in a public health facility, a private health facility or a hospital was classified as an institutional delivery. Overall approximately 15% of women who had delivered in the last two years had their delivery in an institution. Younger women (less than 20 years of age) were slightly more likely to deliver in an institution (19%) compared to women in other age groups (13%-14%). Thirty percent (30%) of women who had some schooling delivered in an institution compared to 14% of women who had no schooling. Wealth status is strongly associated with institutional deliveries, with 33% of respondents in the wealthiest quintile delivering in an institution compared to 3% of respondents in the poorest quintile. Twenty percent (20%) of respondents living less than 2 hours from a facility had an institutional delivery compared to less than 1% of respondents living more than 6 hours from a facility. CHILD HEALTH INDICATORS Child Immunization: BCG coverage among children 12-23 months, as the first vaccine given, is at more than 70%, indicating that most children have at least initial contact with the health care system. The proportion of children 12-23 months of age receiving 3 doses of polio is also almost 70%. Since polio is given through both the routine health care system and through campaigns, this estimate likely reflects both the routine health care system and campaigns. DPT coverage is commonly used as a measure of the effectiveness of the routine health care system in delivering immunization services. Over 60% of 12-23 month olds received DPT1, which also indicates that there is an initial contact with the health care system. However, with the second dose of DPT there is a 12 percentage point drop in coverage and with the third dose there is a further 14 point drop. These declines in DPT coverage indicate that there are opportunities missed by the health care system. Measles coverage is at 63% – higher than DPT3 – which likely indicates some effect of measles campaigns. Full immunization is considerably lower (27% percent), being largely a function of low DPT3 coverage. Slightly over 14% of children between 12-23 months of age received none of the antigens in the Expanded Programme on Immunization. Child Nutrition: Among children 6-59 months old, 77% received Vitamin A supplementation within the last six months. Vitamin A is often given during polio campaigns with polio vaccine, so the levels of Vitamin A coverage often coincide with levels of polio vaccine coverage (70% for OPV3). Exclusive breastfeeding in the last 24 hours is defined as the proportion of infants aged 0 to 5 months who were only given breast milk in the last 24 hours. While the number of children between 0 and 5 months of age was small (527 children), 83% were reported to have received only breast milk in the last 24 hours. This estimate is considerably higher than expected. Standard definitions from the Demographic and Health Survey (DHS) and MICS were used to measure exclusive breastfeeding in the last 24 hours. After a child turns six months, it needs additional food beyond mother’s breast milk. The percentage of children 6-9 months of age that received liquid and solid food in addition to mother’s breast milk in the last 24 hours was approximately 28%. Given the low prevalence of complementary foods given to children 6-9 months of age in this survey, there is some concern that infants 6 months and older are not being appropriately fed. There is no evidence that these feeding practices differ significantly by the sex of the child.

xiii
Infant and under-five mortality: Using the Brass method, the AHS estimated the infant mortality rate in Afghanistan to be 129 per thousand live births and the under-five mortality rate to be 191 per thousand live births. The 95% confidence intervals for the estimate of infant mortality are 103 to 155 and those for the estimate of under-five mortality are 149 to 233. The reference date for these estimates is November 2004. These estimates provide evidence that infant and child mortality has decreased in Afghanistan in recent years. In 2000, the infant mortality rate in Afghanistan was estimated to be 165 per thousand live births and the under-five mortality rate was estimated to be 257 per thousand live births. CARE SEEKING PRACTICES Care-seeking practices: Fifteen percent (15%) of individuals in the total sample were reported to have an illness or injury in the 30 days preceding the survey. Seventy six percent (76%) of the people that were reported to have an illness or injury sought treatment outside their homes. The three primary reasons for not seeking care are “illness or disability not severe enough” (28%), “facility too far” (27%) and “cannot afford the cost of treatment” (24%). There were significant differences in care-seeking practices by household wealth status and travel time to the facility. Sixty five percent (65%) of sick household members from the poorest quintile sought care compared to 88% of sick household members from the wealthiest quintile. Eighty four percent (84%) of sick household members living within 2 hours travel time to a health facility sought care compared to 47% of sick household members living 6 or more hours from a health facility. Provider preferences: For the first visit to a provider for an illness or injury, 55% went to private providers, 44% went to public providers and less than 2% went to traditional healers or sought other care. For second visits, 50% of sick people went to private providers, while 27% went to public providers. The use of traditional providers changes sharply by sequence of visit—less than 2% of people saw traditional providers for the first visit but 22% saw traditional providers for the third visit. People from households in the poorest quintile are more likely to use public providers as their first source of care compared to households from the wealthiest quintile (51% vs. 38%). There is a drop in the utilization of public health facilities as the first source of care when reported travel time increases (from 26% for households living within 2 hours of a health facility to 18% for households living 6 or more hours from a health facility), however, there is no change in utilization of district and provincial hospitals with increasing travel times. The use of private providers is higher for households reporting travel times of 6 or more hours (63%) compared to households living within 2 hours of a health facility (54%). These results show that the use of private sector health services is pervasive in Afghanistan, even among poor and remote households. Health expenditures: Median total out-of-pocket expenditures were calculated for those who saw one provider for the illness episode. A total (median) of 500 Afghanis (~$10 USD) was spent for the most recent illness episode in the 30 days preceding the survey, including fees paid for registration and consultation, lab tests/x-rays, drugs and supplies,

xiv
transportation and food and lodging. Fifteen percent (15%) of individuals in the sample were reported to have experienced an illness or injury in the 30 days preceding the survey, of whom 76% sought care outside the home. These care-seeking practices yielded an estimated annual per capita median health expenditure of 683 Afghanis (~$14 USD). People in the poorest quintile spent more money per illness episode compared to people in the wealthiest quintile (500 Afghanis vs. 420 Afghanis). The total median expenditure in a public health clinic was 150 Afghanis (~$3 USD) compared to 500 Afghanis (~$10) at a district/provincial hospital and 600 Afghanis (~$12 USD) at a private doctor/clinic. Financial distress: Using savings or regular household budget to pay for care was considered as “non-distress,” while all other forms of borrowing or selling were considered distress financing. Overall 36% of the households that sought care for a sick household member in the 30 days preceding the survey incurred distress financing. Over 53% of households from the poorest wealth quintile that sought care for an ill or injured individual incurred distress financing compared to 21% of households from the wealthiest quintile. Among households that live 6 or more hours from a health facility, 55% incurred distress financing compared to 31% among households that live within 2 hours of a health facility. A separate indicator was calculated to measure “severe distress financing.” The definition of “severe distress financing” used here does not include borrowing money. This definition includes only mortgaging or selling land, selling household possessions and selling blood. Households incurred severe distress financing in 12% of cases of care seeking for an illness or injury. Households in the poorest quintile were significantly more likely to incur severe distress financing compared to households in the wealthiest quintile (15% vs. 10%). Households living 6 or more hours from a health facility were significantly more likely to incur severe distress financing compared to households living within 2 hours of a health facility (19% vs. 11%).

1
C h a p t e r 1
INTRODUCTION
BACKGROUND
In 2002, the Ministry of Public Health (MOPH) and its partners faced massive
challenges in their efforts to rebuild Afghanistan’s health sector after many decades of conflict. Health infrastructure had been extensively destroyed, there was a paucity of health personnel, and existing personnel and services were distributed in a highly inequitable manner, with many rural areas extremely underserved.
In coordination with its partner agencies, including the European Commission (EC), United Nations Children’s Fund (UNICEF), United States Agency for International Development (USAID), World Bank (WB), World Health Organization (WHO) and others, the MOPH determined to focus primarily on its role as steward of the health sector, while contracting out health service delivery to non-governmental organizations (NGOs) in much of the country. A primary health care package called the Basic Package of Health Services (BPHS), which includes a set of cost-effective primary health care services with emphasis on the needs of rural areas and women and children, was developed in 2003.
The 2006 Afghanistan Health Survey (AHS) is a population based survey designed
to provide information on maternal and child health, child survival, family planning, health care utilization and related expenditures in rural Afghanistan. Other national surveys such as the Multiple Indicator Cluster Survey (MICS 2003) and the National Risk and Vulnerability Assessment (NRVA 2005) have both produced estimates on priority maternal and child health indicators. However, neither the MICS nor the NRVA provide information on what has occurred in Afghanistan’s heath sector following implementation of the Basic Package of Health Services (BPHS). The reference period for many of the indicators in the MICS and NRVA pre-dates implementation of the BPHS. The results from the AHS are instrumental in assessing the level of progress made in the health sector in Afghanistan since the implementation of the BPHS in began in late 2003 and 2004.
MAIN OBJECTIVES The main objectives of this report are: 1) To provide estimates of priority health indicators for rural Afghanistan. The priority indicators to be measured include the following:
1. Proportion of births attended by a doctor/nurse/midwife;

2
2. Contraceptive prevalence rate; 3. Proportion of women receiving ante-natal care during pregnancy; 4. Proportion of pregnant women receiving tetanus injections; 5. Proportion of children 6-59 months of age receiving vitamin A supplementation; 6. Proportion of children 12-23 months of age having measles immunization; 7. Proportion of children 12-23 months of age having DPT3 immunization; 8. Proportion of children 12-23 months of age fully immunized; 9. Proportion of children 0-5 months who were exclusively breastfed in the last 24
hours; 10. Proportion of children 6-23 months who received breast milk and appropriate
complementary food for the last 24 hours. 11. Infant Mortality Rate 12. Under-five Mortality Rate
2) To describe care-seeking practices, provider preferences and health expenditures for illnesses and injuries in rural Afghanistan. 3) To present breakdowns of priority maternal and child health indicators and care-seeking practices by wealth status and travel time to the nearest health facility.

3
C h a p t e r 2
METHODOLOGY
SAMPLING FRAME Administratively, Afghanistan is comprised of 34 provinces. Each of these provinces is divided into districts. Districts are divided into enumeration units, which are villages and sub-villages in rural areas and urban blocks in urban areas. The sampling frame used to select villages for conducting the survey was obtained from the Central Statistics Office (CSO) in July 2006. The sampling frame, a pre-census household listing, included over 45,000 enumeration units in rural and urban areas. At the time of sampling, enumeration was not completed in all the provinces.1 Abandoned and destroyed villages were removed from the sampling frame before sampling was conducted.
SAMPLING DESIGN
For the purposes of sampling, all districts in the country outside of the six largest cities were classified into one of five groups: 1) the “contracting out” groups that consist of districts covered by the three major contracting out groups (those financed by the European Commission, the United States Agency for International Development and the World Bank), 2) the “contracting in” group that consists of the three provinces in which implementation of the MOPH-Strengthening Mechanism program began in September 2004, and 3) the “other” group, which is a residual category including all other districts in the country not falling into one of the previous groups. The “other” group is not characterized by a lack of health services; rather it is characterized by a disparate group of service providers that do not fall into the previous categories. The six largest cities of Afghanistan—Kabul, Herat, Mazar-e-Sharif, Kunduz, Jalalabad and Kandahar—were not included in the survey, since the primary interest of the MOPH was to assess the impact of BPHS implementation, which is largely targeted at rural areas.
Within each group, clusters (enumeration units) were selected from a list of all
enumeration units by probability proportional to size (PPS) sampling. In the second stage, a compact segment method (Turner, Magnani and Shuaib, 1996) was used to sample households within a cluster. The enumeration unit was segmented into groups, each containing an equal and pre-determined number of compounds. One segment was randomly chosen. Within a segment, all compounds were listed and selected based on
1 As of August 2006, 17 districts had not been enumerated by CSO. These districts were primarily in Kandahar, Zabul and Uruzgan, with one district missing from Ghazni and Helmand. In one district in Daykundi, 26 villages had yet to be enumerated.

4
simple random sampling. If a compound contained multiple households, then all households in the compound were included. The resultant sample is self weighted within contracting group/strata. Information was obtained about the household using the Household Questionnaire. All ever-married women between the ages of 10-49 years and unmarried primary caretakers at least 18 years of age of children between the ages of 0-59 months whose mothers were either dead or no longer living in the household were interviewed using the Individual Woman Questionnaire.
The twelve priority indicators defined by the MOPH cover four principal target populations: children under five years of age, children 12-23 months of age, ever-married women of reproductive age and ever-married women of reproductive age who had a pregnancy in the two years prior to the survey. Depending on how frequently the target group occurs, the precision of the indicator estimates varies. For purposes of estimating the sample size required, DPT3 coverage among children 12-23 months of age was used as the reference, since this age group is relatively rare compared to the other target age groups.
Assuming that one in four households would have a child 12-23 months of age and that 7% of the target sample of households in each strata would be non-responses, 1,785 households (the expected number of sampled households after adjusting for non-response) were sampled to yield at least 400 children. For estimates of vaccination coverage among rural children 12-23 months of age, if the true coverage is 50%, and the design effect is 2.0, then a total of 400 children 12-23 months of age within each strata is adequate to estimate immunization coverage to within +/- 7% of the true coverage with 95% confidence. For indicators related to other target groups which occur with more frequency, such as children under five years of age and women of reproductive age, the precision is greater.
QUESTIONNAIRES
The AHS followed a participatory process in the development and finalization of the questionnaires. The questions on care-seeking were modeled on a community survey conducted by MOPH with technical support from JHU and IIHMR in 2004 and the questionnaires on maternal and child health were modeled both on Afghanistan MICS (UNICEF and CSO, 2003) and Measure DHS+ (ORC Macro, 2001). Draft questionnaires were created by the JHU/IIHMR team in partnership with the Monitoring and Evaluation Department of the General Directorate of Policy and Planning of the MOPH. During the meeting of the Consultative Group of Health and Nutrition on July 23, 2006, a presentation was given on the objectives, design and instruments proposed for use in the AHS and a discussion was held. The purpose of this was to provide stakeholders with a forum to provide input on the design of the survey, the approach to determining which areas to remove from the sampling frame for issues related to physical insecurity, and the instruments used to collect data.

5
The Household Questionnaire includes a cover sheet to identify the household and a household listing form where all members of the household are listed. Other information on each household member was collected, including: • Sex • Age • Education • Survival of parents for children under age 18 • Illnesses and injuries experienced in the previous 30 days • Care-seeking for illness and injuries experienced • Expenditures related to care-seeking • Sources of money used to pay for expenses related to care-seeking • Household characteristics, such as type of water source, sanitation facilities, quality of
flooring, and ownership of durable goods • Travel time to the nearest health care facility and usual mode of transportation • Perceptions of available health care.
The three modules in the Household Questionnaire were: • Module I: Household listing • Module II: Economics (including main source of household income, dwelling
characteristics and assets) • Module III: Health care utilization The Household Questionnaire also enabled the interviewer to identify women who were eligible for the Individual Questionnaire. Ever-married women between 10-49 years who are members of selected household as well as unmarried primary caretakers at least 18 years of age of children between the ages of 0-59 months whose mothers are either dead or no longer living in the household were eligible to be interviewed with the individual questionnaire. The Individual Questionnaire collected information on the following topics: • Module IV: Respondent’s background (including information on age of respondent,
exposure to media and residence information). • Module V: Reproduction (including questions on total children ever born and children
dead) • Module VI: Contraception (knowledge and use of contraceptive methods) • Module VII: Prenatal (including questions on use of antenatal care services, types of
antenatal care services received, tetanus toxoid, types of attendants used for delivery and place of delivery.
• Module VIII: Child immunization and child health

6
ETHICAL APPROVAL
MOPH and JHU require ethical approval for any data collection activities involving human subjects. Ethical approval was obtained from both the Institutional Review Board (IRB) at MOPH and the Committee for Human Subjects Research (CHR) at JHU.
TRAINING AND FIELDWORK Translations of draft questionnaires in Dari and Pashto were completed in July. Recruitment and training of regional managers was conducted from late July to early August in Kabul, Afghanistan. Recruitment of master trainers was conducted in July and the training of master trainers was conducted in Kabul from early to mid August. The regional managers and master trainers, in turn, went to regional centers to conduct regional training. Pre-testing of instruments was conducted by MOPH staff, JHU/IIHMR staff and master trainers in July and August. Changes were made to the draft questionnaires based on observations made during pre-testing on problems such as translation or the structure and wording of the questions. The revised questionnaires were back-translated by independent translators. Candidates for regional training were recruited between early and mid-August. Regional training in 5 regional centers of Kabul, Kunduz, Mazar-e-Sharif, Herat and Jalalabad was conducted from the third week of August to the middle of September. Training involved both didactic lectures and interactive activities, such as role-plays, mock-interviews and mistake-identification tests. At the end of the training, a written exam and field-test were conducted, with those achieving the highest marks hired to collect data in the field. Fieldwork was conducted by teams. Each team consisted of 6 people (supervisor, 2 field editors and 3 data collectors). A total of 35 teams comprising 203 data collectors, field editors and supervisors participated in the survey. The responsibility of the supervisor was to ensure that all field protocols were followed correctly by the teams. Data collection in over 80% of the clusters was observed directly by an independent monitor. The responsibility of the monitor was to ensure that selected sites were surveyed by the teams and that quality was maintained.
Quality control mechanisms were employed both at the field level and the central level. At the field level, a selected set of questions were independently administered to 10% (2 households, randomly chosen) of the households in the cluster by a different interviewer. The field editor compared the questionnaires of the two data collectors to assess the level of agreement between the two sets of forms. The main focus of these re-interviews was to check if all the household members had been captured in the household listing, all the eligible women in the households had been interviewed and all the under-five children were included. In case of discrepancy between the two questionnaires, the two data collectors were brought together to clarify the problem and the household revisited to rectify any mistakes (if the original questionnaire had the mistake).

7
DATA PROCESSING Completed questionnaires were brought back from the field to the central office in Kabul. A team of 24 data editors were trained in early December for data editing. Data editing commenced in the second week of December and was completed by the third week of January, 2007. Data entry started in the third week of December with a total of 12 data entry operators. The data entry program was created in CS-Pro (U.S. Census Bureau, 2006). The database manager and assistant manager supervised the data entry. Double-entry verification of data was conducted by independent operators. The double-entered data was verified to capture discrepancies between the two data entry operators, and appropriate changes were made to the database. A data editor was present during the data entry to advise the data entry operators on any problems encountered during data entry. In addition, data quality checks were simultaneously run on the single-entered data. Double-entry verification was completed by mid-March, 2007.
DATA ANALYSIS Calculation of estimates for all priority indicators was conducted by two independent analysts, using standard classifications from DHS and MICS. Each individual analyst calculated the indicators independently and cross-checked with the second analyst. If there were any discrepancies in the results between the two analysts, a review was conducted, indicators were re-calculated and agreement was reached. All data analyses were performed using Stata version 9.0 (Stata Corp, 2005) The sample was self-weighting at the level of the contracting group (EC, USAID, WB, MOPH-SM and Others). Clusters and households within each contracting group had the same probability of selection but did not have the same probability of selection overall. Sample weights were calculated for each group to account for the different selection probabilities. Clustering of observations at the village level, to adjust for within cluster levels of homogeneity (or the intra-cluster correlation), was taken into account by using the Taylor-linearization method in Stata (Stata Corp, 2005).
COVERAGE OF THE SAMPLE
AHS covered 29 out of 34 provinces of Afghanistan. The provinces of Kandahar, Helmand, Zabul, Uruzgan and Nuristan were excluded prior to selection of the clusters, due to the inability of survey teams and monitors to move safely in those provinces. Some districts in other provinces were also excluded due to insecurity. The 6 major cities of Herat, Kabul, Kandahar, Kunduz, Jalalabad and Mazar were also excluded, since the primary interest of MOPH was to have information on priority indicators for rural areas. The results from the AHS are representative of 72% of the rural population of Afghanistan.

8
Figure 2.1: Distribution of clusters in the Afghanistan Health Survey 2006
Source for population estimates: Central Statistics Office, 2006

9
Based on the sampling design outlined earlier, 85 clusters were sampled within each stratum to account for an estimated 7% non-response. Out of a total of 425 clusters sampled, 397 clusters were completed yielding a total of 8,278 households. Figure 2.1 presents the distribution of the clusters. Due to insecurity and inaccessibility (floods and snow), 28 clusters were dropped from the sample. In line with what was estimated in advance, the cluster non-response rate was 7%. Out of the total 8,320 households sampled, 42 households were either absent, refused to participate or the building was not a dwelling, making the household response rate 99%. There were a total of 8,659 eligible women in the sample, of which 8,281 were interviewed, making the individual response rate over 95%. Table 2.1 gives a breakdown of the coverage of the survey. The primary reason for individual non-response was the eligible woman not being home.
Table 2.1: Number of clusters, households and individuals covered Number Percent Clusters Covered Clusters completed 397 93.4 Clusters dropped due to insecurity 20 4.7 Clusters dropped due to flood/snow 8 1.9
TOTAL 425 100 Household Interviews Interviews completed 8278 99.5 Refusals 7 0.1 Household absent for extended period of time 29 0.4
Dwelling vacant or not a dwelling 5 0.1 Dwelling destroyed 1 <0.1 TOTAL 8320 100 Individual Interviews (Women) Completed 8281 95.6 Not at home 185 2.1 Partially completed 3 <0.1 Refused 53 0.6 Incapacitated 4 0.1 Eligibility misclassified 132 1.5 Other 1 <0.1 TOTAL 8659 100

10
C h a p t e r 3
HOUSEHOLD AND POPULATION CHARACTERISTICS
This chapter provides information on household and population characteristics,
such as age distribution, household composition, educational attainment and wealth status.
For the purpose of AHS 2006, the operational definition of household used was one person or a group of persons who usually live together and eat their meals together, whether or not they are related. A visitor was not considered a member of the household for the purposes of this survey. A family member who does not live in the household but shares (and in some cases contributes to) household resources (assets, income, etc) and has not been away from the household for longer than 6 months was considered a member of the household. Individual information was collected on all individuals meeting these eligibility criteria.
POPULATION DISTRIBUTION BY AGE AND SEX Age and sex variables underpin all demographic analyses. Table 3.1 presents a breakdown of all household members by five-year age groups and sex. The percentage column reflects the percentage male and female of each age group as a percentage of the total population in the sample. Figure 3.1 shows the population pyramid of AHS 2006.

11
Table 3.1: Population distribution by age and sex
Age group (years) Female Female % Male Male % Total Total %
Under 5 3827 6.8 4007 7.1 7834 13.8 5 - 9 4939 8.7 5131 9.1 10,070 17.8
10 - 14 4276 7.6 4800 8.5 9076 16.0 15 - 19 3762 6.6 3670 6.5 7432 13.1 20 - 24 2278 4.0 2137 3.8 4415 7.8 25 - 29 2097 3.7 1693 3.0 3790 6.7 30 - 34 1382 2.4 1423 2.5 2805 5.0 35 - 39 1577 2.8 1197 2.1 2774 4.9 40 - 44 959 1.7 1363 2.4 2322 4.1 45 - 49 723 1.3 960 1.7 1683 3.0 50 - 54 695 1.2 976 1.7 1671 3.0 55 - 59 311 0.5 422 0.7 732 1.3 60 - 64 327 0.6 663 1.2 990 1.7 65 - 69 101 0.2 213 0.4 314 0.6 70 - 74 131 0.2 316 0.6 447 0.8 75 - 79 19 0.0 71 0.1 90 0.2 80+ 42 0.1 107 0.2 149 0.3 Total 27,445 48.5 29,149 51.5 56,594 100
Figure 3.1: Afghanistan Population Pyramid (AHS 2006)
6.76
8.73
7.56
6.65
4.03
3.71
2.44
2.79
1.69
1.28
1.23
0.55
0.58
0.18
0.23
0.03
0.07
7.08
9.07
8.48
6.48
3.78
2.99
2.51
2.12
2.41
1.70
1.73
0.75
1.17
0.38
0.56
0.13
0.19
10.00 8.00 6.00 4.00 2.00 0.00 2.00 4.00 6.00 8.00 10.00
Under 5
5 - 9
10 - 14
15 - 19
20 - 24
25 - 29
30 - 34
35 - 39
40 - 44
45 - 49
50 - 54
55 - 59
60 - 64
65 - 69
70 - 74
75 - 79
80+
Percent
Female % Male %
The population pyramid, with its wide base and narrow top, reflects the general trend of populations living in developing countries with high fertility and mortality. There is, however, a slight deviation found in the base, where the under-five group is

12
smaller than the 5-9 age group. While one could attribute some reduction in the base (under-five group) to increased use of contraceptives and lower fertility rates, the phenomenon seen here probably reflects some misreporting of age. In countries where recording birth dates is not a prevalent practice, ages of household members are frequently misreported. There is a marked digit preference for ages ending in 0s and 5s—this can be seen in the tendency to undercount the under-five year olds and in the peaks at all ages with digits ending in 0 or 5. It is possible that many of these under five children were included in the 5-9 age group. These factors are likely the primary explanation for the smaller number of people in the 0–4 age range compared to the 5–9 age range.
Table 3.2 shows a comparison of the AHS 2006 population distribution to the
population distribution of Afghanistan from the Best Estimates (UNICEF, 2006). The percentage of the total population for each age group for males and females is shown. Figure 3.2 presents the age pyramid for the population estimates included in the Best Estimates. Over and above the specific numbers, the pyramids are comparable to each other. The smaller base from the Best Estimates likely indicates a probable misreporting of ages similar to the AHS. This is common in surveys conducted in settings where birth dates and ages are not commonly recorded. These data show that estimating ages in such settings is problematic – especially at very young ages.
Table 3.2: Comparison of population distribution in AHS and MICS
Age group (years)
AHS MICS AHS MICS
Female % Female % Male % Male % Under 5 6.8 8.5 7.1 9.0
5 - 9 8.7 8.7 9.1 9.2 10 - 14 7.6 6.9 8.5 7.7 15 - 19 6.6 5.2 6.5 5.2 20 - 24 4.0 4.0 3.8 3.5 25 - 29 3.7 3.3 3.0 2.7 30 - 34 2.4 2.6 2.5 2.3 35 - 39 2.8 2.5 2.1 2.1 40 - 44 1.7 1.9 2.4 2.0 45 - 49 1.3 1.2 1.7 1.6 50 - 54 1.2 1.9 1.7 1.5 55 - 59 0.5 0.7 0.7 0.9 60 - 64 0.6 0.8 1.2 1.6 65 - 69 0.2 0.3 0.4 0.6 70+ 0.3 0.5 0.9 1.2

13
Figure 3.2: Afghanistan Population Pyramid (MICS 2003)
8 .4 5
8 .72
6 .9 4
5.17
3 .9 6
3 .2 8
2 .58
2 .4 6
1.9 0
1.2 3
1.8 9
0 .72
0 .77
0 .2 7
0 .50
8 .9 8
9 .2 3
7.71
5.18
3 .51
2 .72
2 .2 6
2 .0 8
2 .0 1
1.6 4
1.51
0 .9 1
1.6 0
0 .6 0
1.19
10 .0 0 8 .0 0 6 .0 0 4 .0 0 2 .0 0 0 .0 0 2 .0 0 4 .0 0 6 .0 0 8 .0 0 10 .0 0 12 .0 0
Under 5
5 - 9
10 - 14
15 - 19
20 - 24
25 - 29
30 - 34
35 - 39
40 - 44
45 - 49
50 - 54
55 - 59
60 - 64
65 - 69
70+
Percent
Female Male
Source Data: UNICEF Best Estimates, 2006
HOUSEHOLD COMPOSITION Table 3.3 gives the breakdown by percentage of households that are headed by females, the distribution of household size and mean household size. Approximately 3% of households are headed by females. The overall estimates of female-headed households for MICS 2003 and NRVA 2005 were 3% and 2%, respectively. Over 85% of the households in the sample had fewer than 10 members. The mean household size was 6.8. The national mean household size in the MICS was 6.9,
with the rural mean estimated at 7.02. In the NRVA, the national mean household size was 7.4 and the rural mean household size was 7.5. The AHS, a rural survey, did not cover 4 provinces in the South—Kandahar, Helmand, Zabul and Uruzgan—and had to
Table 3.3: Household composition N Percentage Sex of head of household
Male 8021 96.9 Female 256 3.1
Household Size
1 5 0.1 2 271 3.3 3 593 7.3 4 904 10.9 5 968 11.7 6 1160 14.0 7 1251 15.1 8 1101 13.3 9 790 9.6
10 + 1234 14.9
N Mean Size Mean Household Size 8277 6.8

14
drop several districts in Farah, Nimroz and Paktika. These provinces have larger average household sizes than other provinces (MICS 2003 and NRVA 2006), which likely explains the lower mean household size observed in the AHS compared to the rural mean household sizes in the MICS and NRVA.
HOUSEHOLD POSSESSIONS Questions were asked of each household interviewed on ownership of durable
goods. Items included were a sewing machine, clock/watch, kerosene lamp, gold jewelry, pressure cooker, radio, television, bicycle, motorbike, electricity generator, car, tractor and refrigerator. Ownership of some of these items may have additional benefits, beyond what ownership indicates regarding wealth status. Possession of a radio or TV may enable one, for example, to receive health communication messages. Having a vehicle may give one greater access to health services when they are not available close by. Table 3.4 gives a breakdown of ownership of the different items.
The most common owned durable good was a kerosene lamp, with almost all households owning one. Almost 80% of the households owned a clock or watch. Slightly more than 50% of the households owned a sewing machine or a pressure cooker. Possession of a radio was close to 50%. However, there were many items that were owned by only a small percentage of the population.
WEALTH INDEX The asset-based measure of wealth status followed the technique developed by
Filmer and Pritchett (1999; 2001). This technique uses principle components analysis (PCA), which is a data reduction tool whereby a large number of variables are collapsed into a smaller, more manageable number of dimensions by identifying relationships within the original set of variables. The linear combinations of the original asset variables used are determined so as to capture the maximum variance. The first component is the linear combination of asset variables that best captures the information that is common to all the original variables included in the analysis—it can be viewed as the “line of best fit” amongst all of the original variables used in PCA. This linear combination captures the essence of multiple items, and the resultant “variable” (or factor or component) can be used more efficiently in subsequent analysis than the individual items from which it is derived.

15
Wealth is a latent
variable that can have multiple dimensions. For example, wealth can reflect the ability or resources of a family to acquire physical goods (e.g. television, radio, stove, phone) or the ability to purchase services (e.g. electricity, piped water), but wealth also has dimensions that cannot be directly measured in economic terms. For example, households living in rural areas might not have the same level of access to electricity as people in urban areas. Or, the
presence of electricity in a household may make it easier for a child to study in the evenings. These indirect effects or consequences of wealth are included in its definition. PCA retains both the direct and indirect aspects of wealth in its components.
In the current study, kerosene lamp was dropped from the list of durable items as it
had little variation – almost 95% of households owned a kerosene lamp. The extent of missing data for most items was negligible. Only the question on type of toilet used by the house had more than a small amount of missingness. A hotdeck method was used to impute missing values for this variable. The factor scores of the total 8240 households with information on assets were divided into five approximately equal categories: 1st quintile (the poorest), 2nd, 3rd, 4th quintiles and the 5th quintile (the wealthiest).
EDUCATIONAL ATTAINMENT
Ever Been to School The educational status of household members is strongly associated with many health outcomes. In the AHS 2006, questions were asked regarding whether each household member at least 5 years of age had ever attended school and the number of years of school completed. Table 3.5 gives a breakdown of population that has had some schooling by sex, age and wealth status. The age-group 10-14 years has the highest percentage of people with some schooling followed by the 15-19 year and 5-9 year age groups. Under the Taliban regime, the education sector suffered tremendously with schools being shut down, and females prohibited from attending schools. Most of the advancements in the education sector have been made over the last 4-5 years, and these advancements are reflected in the higher total percentage of schooled people in younger age groups. Older age groups have a lower percentage of people who have attended school. Males have consistently higher schooling rates than females in each age group.
Table 3.4: Percentage of households possessing various durable consumer goods
Ownership of Durable Goods No. % Owned Sewing Machine 4301 52.2 Clock/Watch 6532 79.3 Kerosene Lamp 7804 94.7 Gold Jewelry 1226 14.9 Pressure Cooker 4685 56.9 Radio 3992 48.4 Television 1628 19.8 Bicycle 1749 21.2 Motorbike 710 8.6 Electricity Generator 528 6.4 Car 301 3.6 Tractor 112 1.4 Refrigerator 117 1.4 Total # of Households 8240

16
Interestingly, the effect of wealth status on school enrollment is not large. Overall, the wealthiest quintile has a higher percentage of schooled people than the other quintiles. However, any difference between the other quintiles is not apparent. The effect of wealth status on school enrollment varies by the sex of the individual. The discrepancy in school attendance between the poor and the non-poor is greater among males than females. The AHS 2006 was primarily a rural survey. The association between wealth status and school attendance may be different in urban areas than rural areas. Other factors that may affect school attendance, such as attitudes toward schooling and physical access to schools, are beyond the scope of this survey.
Table 3.5: School attendance by sex, age and wealth status
School Attendance Female Female
% Male Male % Total Total % Never Attended School 18,388 77.8 13,741 54.6 32,261 66.2 Attended School 5234 22.2 11,405 45.4 16,707 34.3 Total 23,622 25,146 48,768
Age group (years)
Total # of
Females
% Female
Schooled Total #
of Males % Male
Schooled
Total in Age
Group % Total Schooled
5 - 9 4860 35.6 5037 46.4 9897 41.1 10 - 14 4270 47.8 4788 71.1 9058 60.1 15 - 19 3759 25.3 3665 58.5 7424 41.7 20 - 24 2274 10.2 2133 42.1 4407 25.6 25 - 29 2086 6.5 1685 35.1 3771 19.3 30 - 34 1377 5.2 1421 29.1 2798 17.3 35 - 39 1573 4.2 1193 29.2 2766 15.0 40 - 44 952 4.2 1358 30.6 2310 19.7 45 - 49 719 4.1 954 30.0 1672 18.8 50 - 54 694 3.0 972 23.9 1666 15.2 55 - 59 309 1.6 420 21.5 729 13.1 60 - 64 326 2.5 660 17.1 986 12.3 65 + 292 2.2 706 16.8 998 12.5 Total 23491 22.7 24992 45.6 48483 34.5
Wealth quintile
Lowest 5472 19.2 5755 33.3 11227 26.4 Second 5111 19.3 5350 36.8 10461 28.2 Middle 4191 21.5 4498 44.9 8689 33.6 Fourth 3914 21.9 4219 52.9 8133 38.0 Highest 4599 32.5 4951 63.8 9550 48.7
Total 23287 22.7 24773 45.6 48060 34.5 Mean Years of Schooling Table 3.6 and Figure 3.3 show the distribution of the mean number of years of school attended by age group and sex. Overall, among all people who attended some schooling, the average time spent in school was 5.2 years. However, the overall time spent

17
for females was lower than for males. The mean time spent in school is similar for males and females in the younger age groups, but males have higher mean time spent in school in the older age groups. Though the number of females who have attended school is much lower than the number of males who have attended school, looking at the mean time spent in school, once females enter school, their mean time spent in school is not considerably lower than the mean time spent in school by males. This indicates that entering school is likely a larger barrier for females than staying in school once enrolled.
Table 3.6: Mean number of completed years of school by sex, among people ever attending school Age group (years)
Total # Schooled Persons Mean school years
Female Male Total Female Male Total 5 - 9 1534 2150 3684 2.0 2.0 2.0 10 - 14 2006 3358 5364 4.0 4.4 4.2 15 - 19 925 2103 3028 5.8 7.0 6.6 20 - 24 210 856 1066 7.6 8.7 8.4 25 - 29 119 564 683 6.4 8.6 8.2 30 - 34 61 386 446 8.0 8.8 8.7 35 - 39 55 332 387 8.0 8.6 8.5 40 - 44 31 369 400 7.6 9.2 9.1 45 - 49 18 265 283 9.1 10.1 10.0 50 - 54 11 211 222 7.8 9.2 9.1 55 - 59 3 71 74 6.5 9.2 9.1 60 - 64 5 106 110 7.0 8.6 8.5 65 + 1 99 100 5.7 8.0 8.0 Total 4979 10,869 15,848 4.1 5.8 5.2
Figure 3.3: Mean number of school years by age group and sex, among people ever attending school
0.0
2.0
4.0
6.0
8.0
10.0
12.0
5 - 9 10 - 14 15 - 19 20 - 24 25 - 29 30 - 34 35 - 39 40 - 44 45 - 49 50 - 54 55 - 59 60 - 64 65 +
Age group
Year
s
Female Male
18
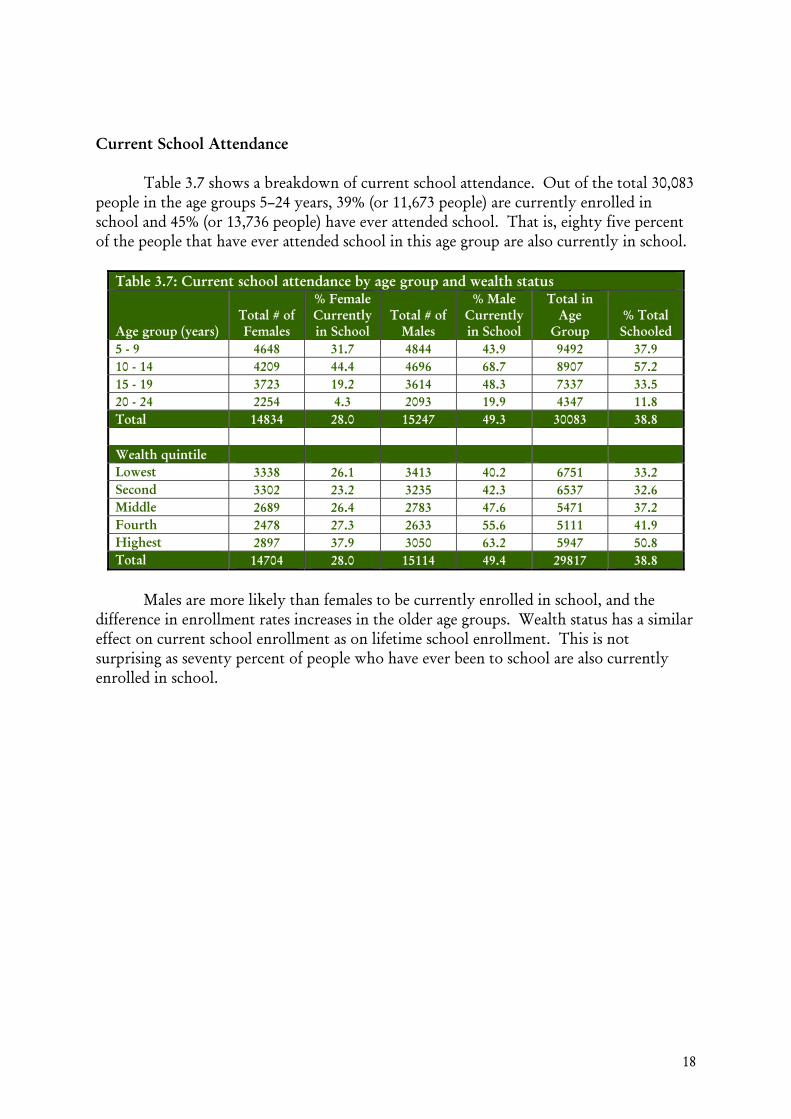
Current School Attendance Table 3.7 shows a breakdown of current school attendance. Out of the total 30,083 people in the age groups 5–24 years, 39% (or 11,673 people) are currently enrolled in school and 45% (or 13,736 people) have ever attended school. That is, eighty five percent of the people that have ever attended school in this age group are also currently in school.
Table 3.7: Current school attendance by age group and wealth status
Age group (years) Total # of Females
% Female Currently in School
Total # of Males
% Male Currently in School
Total in Age
Group % Total Schooled
5 - 9 4648 31.7 4844 43.9 9492 37.9 10 - 14 4209 44.4 4696 68.7 8907 57.2 15 - 19 3723 19.2 3614 48.3 7337 33.5 20 - 24 2254 4.3 2093 19.9 4347 11.8 Total 14834 28.0 15247 49.3 30083 38.8 Wealth quintile Lowest 3338 26.1 3413 40.2 6751 33.2 Second 3302 23.2 3235 42.3 6537 32.6 Middle 2689 26.4 2783 47.6 5471 37.2 Fourth 2478 27.3 2633 55.6 5111 41.9 Highest 2897 37.9 3050 63.2 5947 50.8 Total 14704 28.0 15114 49.4 29817 38.8
Males are more likely than females to be currently enrolled in school, and the
difference in enrollment rates increases in the older age groups. Wealth status has a similar effect on current school enrollment as on lifetime school enrollment. This is not surprising as seventy percent of people who have ever been to school are also currently enrolled in school.

19
CHARACTERISTICS OF SURVEY RESPONDENTS
Having an educated population is intrinsic to the development of the country and is especially crucial for health outcomes. Table 3.8 gives a breakdown of the age distribution and educational status of the eligible respondents in the household. An eligible respondent was defined as a woman between 10 and 49 years of age who has ever been married.
Women 25-29 years of age
represented the single largest group, though women in the 20-24, 30-34, and 35-39 age groups had fairly similar distributions. Over 70% of the respondents were between the ages of 20 and 39, prime
reproductive ages. Married women in younger age groups (10-19) constituted less than 10% of the total sample. Whereas 22% of all females have had some schooling, only 5% of the eligible respondents for the Women’s Questionnaire have attended some school.
Table 3.9 gives a breakdown of eligible respondents by their exposure to mass media. Exposure to information may increase knowledge and awareness of issues that are different from their everyday realities. There are different ways one can access information. Print media, radio and television are a few such methods. Respondents were asked about their frequency of listening to radio and watching television. Both radio listening and television viewing were categorized into a dichotomous variable measuring whether or not the respondent listened to radio or watched television at least one time every week. In table 3.9, there is no significant pattern in the association of age and listening to radio, watching television or doing both. However, educational status is significantly associated with both listening to the radio and watching television, with a higher proportion of women who have some education listening to radio and watching television. There is a linear association between wealth and both listening to radio and watching television. Possession of a radio and television are most likely instrumental to a respondent listening to a radio and/or watching television. Possession of these two items was used in calculating the wealth quintiles. It is, therefore, not surprising that the poorest wealth quintile had very low levels of listening to radio and watching television.
Table 3.8: Age and education of respondents in the Women’s Questionnaire
Ever married women
Number Percent Age
10 - 14 11 0.1 15 - 19 754 9.1 20 - 24 1370 16.6 25 - 29 1814 21.9 30 - 34 1282 15.5 35 - 39 1506 18.2 40 - 44 895 10.8 45 - 49 647 7.8
School Attendance Never Attended School 8362 95.0 Attended School 437 5.0

20
Table 3.9: Exposure to Media Percentage of ever-married women who usually listen to radio and/or watch television at least once a week by background characteristics, AHS 2006
Age group (years)
Listens to radio at
least once a week
Watches television at least once a
week
Both media at least once a
week Number of
women < 20 yrs 43.9 21.0 15.1 768 20 - 24 37.2 18.3 11.7 1373 25 - 29 39.3 16.5 12.4 1815 30 - 34 44.1 18.9 14.9 1282 35 - 39 40.6 16.4 12.6 1506 40 - 44 39.8 19.1 14.8 893 45 - 49 47.6 18.3 15.5 645
Total 41.0 17.9 13.4 8282 Education
Never Attended School
40.0 16.3 12.1 7812
Attended School 62.0 46.0 35.8 438 Wealth quintile
Lowest 9.5 0.7 0.5 2034 Second 30.9 3.8 2.5 1832 Middle 43.5 11.8 7.2 1431 Fourth 60.1 24.4 16.6 1371 Highest 76.3 57.9 46.8 1540

21
MODES OF TRANSPORTATION USED TO TRAVEL TO NEAREST HEALTH FACILITY
The primary respondent in each surveyed household was asked how long it takes to travel one-way to the nearest health facility using the household’s routine mode of transportation. Table 3.10 shows the breakdown of the types of transportation reported by households as their routine mode of transportation to the nearest health facility. The majority of households reported using non-mechanized modes of transportation, such as walking or using a donkey, horse or bicycle. A small proportion of households (7.6%) used multiple modes of transportation to travel to the health facility, such as walking to the road and then taking a bus.
Table 3.10 : Routine modes of transportation used by households to travel to the nearest health facility
% of
households Types of transportation n=7926
Foot 75.1 Bus 12.2 Car 11.5 Donkey/Horse/Bicycle 8.2 Motorcycle 0.6
Transportation characteristics n=7922
Non-mechanized transport only 75.9 Mechanized transport only 18.7 Both mechanized & non-mechanized
transport 5.5 Total no. of modes of transportation used to travel to the facility n=7922
1 92.4 2 or more 7.6

22
DISTANCE TO THE NEAREST HEALTH FACILITY Households were asked how long it usually takes them to travel one-way from their home to the nearest health facility using their routine mode of transportation. The distribution of average travel times for surveyed households and communities is shown in Table 3.11. This table presents the breakdown of time required to travel from the individual household to the facility using the household’s routine mode of transportation and the average time required to walk from surveyed communities to the nearest health facility. The former is a household-level variable, while the latter is a community level variable (either a village or an urban block). The household-level travel time variable based on the usual mode of transportation to the facility is the variable that is used in the subsequent analyses presented in this report showing how outcomes of interest vary by distance from health facilities.
Table 3.11: Travel time to the nearest health facility
Avg. time required to travel from home using
usual mode of transportation
(%) Cumulative (%)
Avg. time required to walk from community
(%) Cumulative (%) Travel time to nearest facility n=7959
n=397
<1 hour 35.5 35.5 32.1 32.1 1 to <2 hours 25.6 61.1 26.4 58.5 2 to <3 hours 18.1 79.2 14.4 72.8 3 to <4 hours 7.5 86.7 6.7 79.5 4 to <6 hours 7.2 93.9 8.7 88.2 ≥6 hours 6.1 100.0 11.8 100.0
Over 60% of surveyed households live within 2 hours of the nearest health facility using their routine mode of transportation. When examining the time required to walk to the nearest health facility, 58.5% of surveyed communities are within 2 hours of the nearest health facility. This result is logical in that household travel time using the routine mode of transportation includes both mechanized and non-mechanized transportation and thus shows a slightly higher percentage living within 2 hours of the nearest health facility. All times presented here are based on one-way travel.

23
C h a p t e r 4
INFANT AND UNDER-FIVE MORTALITY
Afghanistan is ranked as having the third highest under-five mortality (U5MR) rate in the world at 257 deaths per thousand live births, following Sierra Leone and Angola (State of the World’s Children, 2007). Cited infant mortality rates (IMR) for 2005 are also very high at 165 deaths per thousand live births.
As part of the global community, Afghanistan has made a commitment to contribute to improvements in global health outcomes and to create a healthy and prosperous society. The Afghan National Development Strategy incorporates commitments made in the Millennium Development Goals (MDG) Report. Decreasing infant and under-five mortality are two key commitments.
The AHS was a rural survey. The mortality estimates from AHS, like the other
estimates, are not national estimates. They do not include urban areas, which typically have lower morality estimates compared to rural areas, and they do not include insecure areas that had to be removed from the sampling frame. Especially insecure areas that could not be covered by the survey may have higher mortality rates among infants and children under five, but there are no data available to test this hypothesis. Inferences from the estimates derived from this survey can only be made to the areas covered by the survey.
METHODS The indirect method of estimation (Brass technique) of mortality was used to calculate infant and under-five mortality rates.
In the AHS information was collected from every ever-married woman between 10 and 49 years of age.2 Each of these eligible respondents was asked questions on the total number of children that she had delivered up to the time of the survey and the total number of children that are dead. The complete set of questions used to estimate mortality is included in Module V of the Individual Questionnaire included in Appendix C.
2 Information on births and deaths of children were only asked of women who have ever been married. In Afghanistan, it was culturally inappropriate to ask these questions from never-married women. However, calculations of mortality included all women between the ages of 15 and 49.

24
The Brass technique uses age patterns of fertility (parity), proportion of children dead among children ever born for women of different ages and converts it into the probability of a child dying before reaching a certain age. This probability of dying is, in turn, translated into mortality estimates by using model life tables (United Nations, 1983).3
There are both strengths and limitations to the Brass technique. The data requirements for calculating Brass mortality estimates are few compared to other methods of estimating mortality. The Brass technique is often used in developing countries where it is difficult to get precise dates of births and deaths of children and the precise age of the mother. However, it also has limitations and these should be kept in mind when interpreting the estimates. The Brass technique assumes that child mortality risks only depend on age of the child and not age of the woman. This assumption is problematic especially for women of younger ages as there is some indication that children of younger mothers suffer a higher mortality risk than children of older mothers (DESA, 1983). This technique also assumes that there have been no changes in fertility levels and there has been either no change or a linear decline in mortality. While these assumptions can hold in stable populations, in Afghanistan, where there has been considerable instability for more than 20 years, these mortality estimates have to be interpreted with caution. Finally, the mortality estimates are derived from model life tables that reflect patterns of mortality of mostly European countries, which do not always apply to the mortality experiences of developing countries – especially developing countries in conflict.
SOURCES OF ERROR IN MORTALITY ESTIMATES AND SENSITIVITY ANALYSIS Estimates of mortality are subject to both sampling and non-sampling errors. Sampling errors for variables related to mortality are given in Appendix B and are discussed further in this section. Non-sampling errors tend to be a more central concern for mortality estimates.
One source of non-sampling error is the difficulty of classifying the mother in the correct age group. In Afghanistan, as in many other developing countries, women do not know their exact ages or birth dates. Classifying a woman in one group versus another can affect mortality estimates. Age-heaping exists at ages ending in the digits 0 and 5. Categorizing women in 5 year age groups, such as 15-19 and 20-24, mitigates to some extent the effect of age heaping. Another significant source of non-sampling error is under-reporting of deaths. Under-reporting of deaths is a common problem faced in most surveys. In any retrospective survey, the farther back a child’s death occurs, the greater is the likelihood of under-reporting of dead children.
3 The estimates of IMR and U5MR were produced using the Trussell variant of the Brass Technique of the West Model Life Tables.

25
There is clear evidence from the AHS data that there is under-reporting of child deaths among women in older age groups. Tables 4.1 and 4.2 give a breakdown of IMR and U5MR with their reference dates, respectively. The very low levels of mortality for reference years in the past compared to the more recent time period shows that there is under-reporting of child deaths by older women. Given the under-reporting of deaths of children in women in age groups 25 and above, the mortality analysis was confined to women in the age-groups 15-19 and 20-24.
Table 4.1: IMR estimates by age of mother Age of Woman Reference Date IMR
[95% Confidence Interval]
15-19 2005-August 127 92 163
20-24 2004-June 130 109 151
25-29 2002-November 111 99 124
30-34 2000-October 103 91 114
35-39 1998-July 97 87 108
40-44 1996-January 100 87 113
45-49 1993-January 95 79 110
Table 4.2: U5MR estimates by age of mother Age of Woman Reference Date U5MR
[95% Confidence Interval]
15-19 2005-August 188 132 245
20-24 2004-June 192 158 226
25-29 2002-November 162 142 182
30-34 2000-October 148 130 166
35-39 1998-July 140 123 156
40-44 1996-January 144 123 165
45-49 1993-January 135 111 160
Further data quality checks were conducted on the 15-19 and 20-24 age groups by
the single year age of mother to assess data quality in this group. Tables 4.3 and 4.4, shown below, give a breakdown of total births and deaths for all children, total births and deaths by sex, overall proportion dead, proportion dead by sex, sex ratio at birth and ratio of proportion dead boys to proportion dead girls.

26
Table 4.3: Tabulation of total children born and dead by age of mother and sex of child
Age of Woman
Total women
Total ever born
Total dead
Total girl born
Total boy born
Total girl dead
Total boy dead
15 810 26 2 10 16 1 2 16 797 19 4 12 7 1 2 17 592 98 11 45 53 5 6 18 916 192 31 84 108 15 16 19 581 509 55 237 271 30 24 20 863 615 98 285 330 34 64 21 278 376 55 167 209 20 36 22 403 597 102 292 306 45 57 23 207 422 72 203 219 31 41 24 487 1405 190 667 738 77 113
Table 4.4: Proportion of children dead, sex ratio at birth and ratio of proportion of dead boys to proportion of dead girls by age of mother
Age of Woman
Children Dead /
Children Ever Born
Boys ever born /
Girls ever born
Girls Dead / Girls Ever
Born
Boys Dead / Boys Ever
Born
Ratio of proportion
boys dead to proportion girls
dead
Col 1 Col 2 Col 3 Col 4 Col 5 Col 6
15 0.09 1.62 0.07 0.11 1.51 16 0.18 0.62 0.12 0.29 2.39 17 0.11 1.19 0.1 0.11 1.05 18 0.16 1.28 0.18 0.15 0.8 19 0.11 1.14 0.13 0.09 0.7 20 0.16 1.16 0.12 0.19 1.63 21 0.15 1.25 0.12 0.17 1.46 22 0.17 1.05 0.15 0.19 1.22 23 0.17 1.08 0.15 0.19 1.22 24 0.13 1.11 0.11 0.15 1.34
The breakdown by single year age of mother for the 15-19 and 20-24 age groups
shows some unusual patterns in the data. As the number of births and deaths in ages 15-17 were small, ages 18-24 were considered for in-depth analysis. Column 3 of Table 4.4 shows the sex ratio at birth (Total number of boys born/total number of girls born). The typical range of sex ratio at birth is between 104 and 107 boys born for every 100 girls born (Chanazarian, 1986). In the breakdown given here, the sex ratio at birth is highly skewed towards boys. When sex ratio at birth is much higher than 1.05 (as is the case here), it means there are far more boys born than girls. This phenomenon indicates a strong preference for sons. In a non-discriminating society, the sex ratio at birth would not be so skewed. Preference for sons manifests itself pre-birth in the form of sex-selective abortions and post-birth as feticide/infanticide, abandonment, unequal treatment of girl children/neglect, which leads to higher female mortality.

27
Sex-selective abortion as a cause of the skewed sex ratio is discarded as an explanation for Afghanistan where the prevalence of ultrasound machines and the utilization of ante-natal care is low. There is little evidence in the literature that infanticide is practiced in Afghanistan. Anecdotal evidence also indicates that infanticide is not widely practiced in Afghanistan.
The preference for sons in Afghanistan is well known, but the extent and reasons
for this have never been fully studied. Health care seeking practices in AHS for sickness in the last 30 days shows no statistically significant difference in the percentage of sick boys and sick girls that received care. Evidence for immunization rates from the AHS show that while the immunization rates appear somewhat higher for boys than for girls (for BCG, OPV3, DPT3 and measles), the difference was statistically significant only for measles vaccine. The estimates of exclusive breastfeeding and complementary feeding also do not vary by the sex of the child. The point estimate for proportion of children 6-9 months of age that received liquid and solid food in addition to mother’s breast milk in the last 24 hours appears slightly higher for girls than boys, but this difference is not statistically significant (the breakdown for these indicators is provided in the Maternal and Child Health Section of this report).
The high sex ratios can be explained by two possible reasons, or—most likely—some combination of the two: 1) intentional mis-classification of girls as boys, and 2) under-reporting of girls, assuming the number of boys reported is correct. Mis-classification of girls as boys increases the total number of boys ever born but keeps the total number of children ever born and dead constant. Mis-classification of girls as boys affects sex-specific mortality rates but if the total number of children ever born is correct, it would not affect the overall mortality rates. Anecdotal evidence suggests that households that have more girls than boys may intentionally mis-classify girls as boys, since there is some stigma in Afghanistan attached to only having girls.
Under-reporting of girls could indicate that dead girls are not being counted in the total births. Or, some more conservative households may intentionally under-report the number of living girls in the household, since they do not want strangers to know about the presence of females within the household. Many households refuse to divulge the names of females in the household; in some cases they may refuse to report the presence of living females within the household. In contrast to the first explanation—misclassification of girls as boys, which would only affect sex-specific mortality rates—the under-reporting of girls could introduce error in the overall estimates of mortality. The level of under-reporting and the proportion of under-reported girls who are dead need to be determined. If girls are under-reported and the proportion of under-reported girls who are dead is different than the proportion of reported girls who are dead, error will be introduced in the estimate of mortality. If a higher proportion of missing girls are dead compared to the proportion of reported girls who are dead, the estimate of mortality among girls and the overall estimate of mortality will be erroneously low.
It is likely that some degree of both mis-classification of girls as boys and under-reporting of girls is present, but it is not clear to what degree the observed imbalance between boys and girls is attributable to each of these factors. Further investigations were

28
conducted on the total number of boys and girls ever born and dead by parity of the mother to determine if the predominant problem was mis-classification or under-reporting. Detailed tables showing the observed and expected number of boys and girls by parity of the mother are presented in Annex A. The natural sex ratio quotient of 0.512 (105 total boys born for every 100 girls born) is used to calculate the expected values. The expected number of girls is, then, compared to the observed number of girls.
When the total number of girls ever born is lower than expected, and the ratio of boy deaths to girl deaths is high, it is probable that there is differential under-reporting of girl deaths. To determine if the lower expected number of girls ever born and the skewed ratio of boy deaths to girl deaths is predominantly due to mis-classification or under-reporting, the distribution of births and deaths of boys and girls born to women who reported having only girls or only boys was examined. Columns 5 and 6 in Table A 4.1 in Annex A show that the observed number of women having only girls is lower than the expected number having only girls. This low expected value in all the parities (up to 4) indicates that many women that have only girls are not reporting them. The proportion of dead boys is also higher among women that reported only giving birth to boys, compared to the proportion of dead girls among women that reported only giving birth to girls. When women who report giving birth to only girls have a lower proportion of dead girls, this indicates that under-reporting of girls is likely a greater problem than mis-classification of girls as boys. It is very probable that deaths of girls are not being mentioned, and to some extent are not even included in the total births.
Assuming that there is under-reporting of girl deaths, Table 4.5 shows the expected number of girls, assuming that the natural sex ratio at birth of 1.05 and the total observed number of boys is correct, by single year of age of the mother. Table 4.6 shows a sensitivity analysis, with a breakdown of varying numbers of dead girls for different proportions dead of the under-reported girls.
Table 4.5: Difference between observed and expected number of girls (if the observed number of boys is correct)
Age of Woman
OBSERVED Total Girls
Born
OBSERVED Total Boys
Born
EXPECTED # of Girls Ever
Born based on Sex Ratio at
Birth = Observed Total Boy Born/1.05
Difference between
OBSERVED AND
EXPECTED Girls Ever Born (# OF GIRLS
UNDER-REPORTED)
15 10 16 15 16 12 7 7 17 45 53 51 18 84 108 103 18 19 237 271 258 21 20 285 330 314 29 21 167 209 199 32 22 292 306 291 1 23 203 219 209 6 24 667 738 703 35
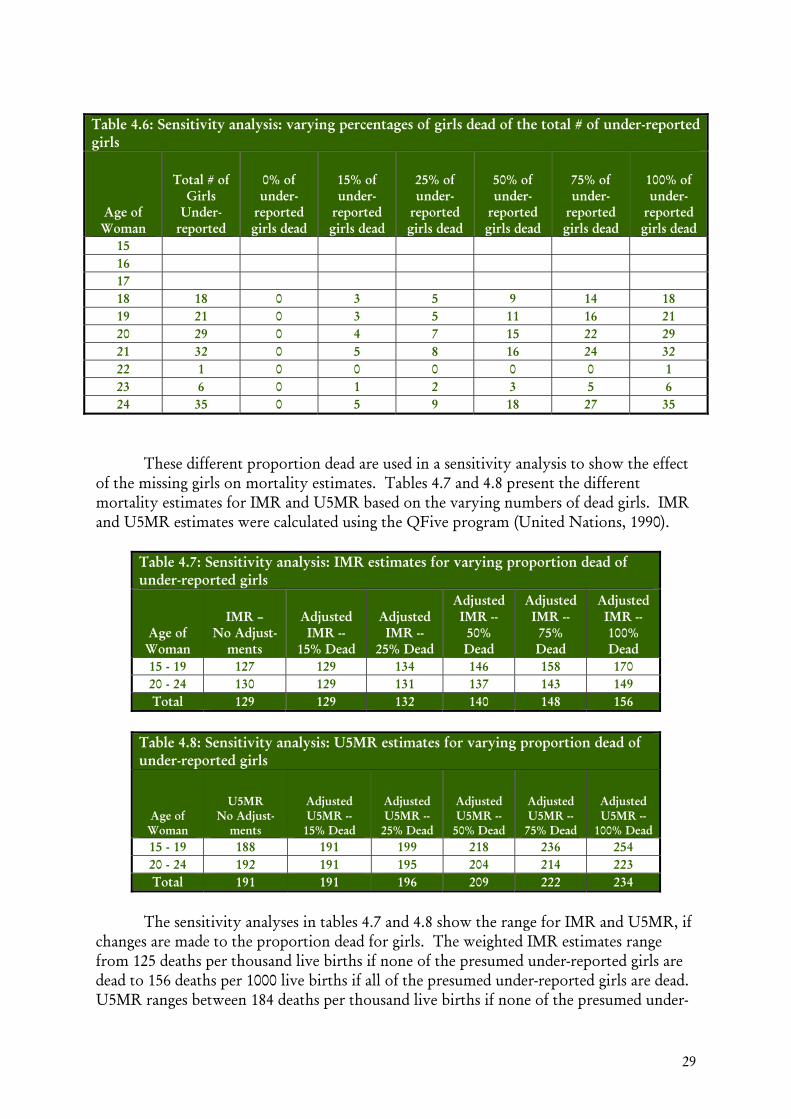
29
Table 4.6: Sensitivity analysis: varying percentages of girls dead of the total # of under-reported girls
Age of Woman
Total # of Girls
Under-reported
0% of under-
reported girls dead
15% of under-
reported girls dead
25% of under-
reported girls dead
50% of under-
reported girls dead
75% of under-
reported girls dead
100% of under-
reported girls dead
15 16 17 18 18 0 3 5 9 14 18 19 21 0 3 5 11 16 21 20 29 0 4 7 15 22 29 21 32 0 5 8 16 24 32 22 1 0 0 0 0 0 1 23 6 0 1 2 3 5 6 24 35 0 5 9 18 27 35
These different proportion dead are used in a sensitivity analysis to show the effect
of the missing girls on mortality estimates. Tables 4.7 and 4.8 present the different mortality estimates for IMR and U5MR based on the varying numbers of dead girls. IMR and U5MR estimates were calculated using the QFive program (United Nations, 1990).
Table 4.7: Sensitivity analysis: IMR estimates for varying proportion dead of under-reported girls
Age of Woman
IMR – No Adjust-
ments
Adjusted IMR --
15% Dead
Adjusted IMR --
25% Dead
Adjusted IMR -- 50% Dead
Adjusted IMR -- 75% Dead
Adjusted IMR -- 100% Dead
15 - 19 127 129 134 146 158 170 20 - 24 130 129 131 137 143 149 Total 129 129 132 140 148 156
Table 4.8: Sensitivity analysis: U5MR estimates for varying proportion dead of under-reported girls
Age of Woman
U5MR No Adjust-
ments
Adjusted U5MR --
15% Dead
Adjusted U5MR --
25% Dead
Adjusted U5MR --
50% Dead
Adjusted U5MR --
75% Dead
Adjusted U5MR --
100% Dead 15 - 19 188 191 199 218 236 254 20 - 24 192 191 195 204 214 223 Total 191 191 196 209 222 234
The sensitivity analyses in tables 4.7 and 4.8 show the range for IMR and U5MR, if
changes are made to the proportion dead for girls. The weighted IMR estimates range from 125 deaths per thousand live births if none of the presumed under-reported girls are dead to 156 deaths per 1000 live births if all of the presumed under-reported girls are dead. U5MR ranges between 184 deaths per thousand live births if none of the presumed under-

30
reported girls are dead to 234 deaths per thousand live births if we assume all of the presumed under-reported girls are dead. The true figure lies somewhere between the extreme percentages. For example, if one assumes that the imbalance between boys and girls is entirely attributable to under-reported girls and 50% of the under-reported girls are dead, than the IMR estimate increases from 129 deaths per thousand live births to 140 deaths per thousand live births.
There is some evidence from Bangladesh that a higher proportion of un-reported
children are dead compared to reported children (Becker and Mahmud, 1984; Espeut, 2002). Becker and Mahmud (1984) present data that show that 25% of the missed live births were dead and Espeut (2002) presents results from a different study that show that 85% of the missed live births were dead. These validation studies show that there is a wide range in the percentage of un-reported children that are dead, even within the same country.
Since it is not possible to determine exactly to what degree under-reporting of girls
is present and what proportion of under-reported girls are dead in the AHS, unadjusted mortality estimates are used. However, it is likely that some of the missing girls are dead and this issue should be kept in mind while interpreting the mortality estimates.
FINAL RESULTS FOR ESTIMATES OF MORTALITY Confidence intervals were calculated for unadjusted estimates of IMR and U5MR. The Taylor linearization method (Lehtonen and Pahkinen 1995) was used to calculate robust standard errors for the number of children dead in each age group. As shown in Table A4.4, the lower bound and upper bound estimates for the number of children dead were used to calculate the lower and upper bound for the mortality estimate for each age group. The total number of children ever born was left unadjusted. Tables 4.1 and 4.2 show the IMR and U5MR for all age groups with their confidence intervals.
Since the IMR and U5MR were retained only for the two age groups, 15-19 and 20-24, the final estimates of mortality presented are a weighted mortality estimate of the two age groups. The proportion of ever-married women in each group was used as a weight. There are more ever-married women in the 20-24 age group, hence estimates from this group were given more weight. The reference date for the estimates is also a weighted date with more weight given to the reference date for the 20-24 age group. The confidence intervals presented for the final estimates are also weighted based on the proportion of ever-married women in each of the two age groups. Table 4.9 below gives the IMR and U5MR estimates, their reference dates and confidence intervals.
Table 4.9: IMR and U5MR estimates
Mortality Indicator Reference Date
Estimate (deaths per 1000
live births)
95% Confidence
Interval IMR Nov-04 129 103 155
U5MR Nov-04 191 149 233

31
CONCLUSION There is evidence indicating that both mis-classification of girls as boys and under-
reporting of girls are likely present to some degree. Presented with the sensitivity analysis for the different proportion dead of under-reported girls in Tables 4.7 and 4.8, estimates of mortality would increase if a greater proportion of the under-reported girls are dead, compared to the proportion of reported girls who are dead. For example, if the skew in the sex ratio at birth is entirely attributable to under-reporting of girls and 50% of these girls are dead, the estimate for IMR would increase from 129 to 140 per thousand live births and U5MR would increase from 191 to 209 per thousand live births. Some of the skew is likely to be attributable to the intentional mis-classification of girls as boys, but the degree to which this occurred is not clear. This would affect the sex-specific mortality estimates, but not the overall mortality estimates.
Caution needs to be maintained while interpreting the mortality estimates from AHS 2006. The confidence intervals for the estimates are wide, and the possible under-reporting of deaths among girls may lead to an underestimate of the true level of mortality. Furthermore, mortality estimates of the youngest age groups were used. As referred to earlier, mortality of children is related to the age of the mother and when births to younger mothers are used to calculate mortality, the mortality estimates may be instable. To mitigate the instability associated with using mortality estimates from the youngest age group (15-19), weighted estimates using both the 15-19 and 20-24 age groups were used. The effect of the age of mother on child mortality is related to parity. Younger mothers have first-borns, and first-borns are more likely to die. In Afghanistan, the mean number of children for women in the 20-24 age group is almost 2.5, which makes children in this group less vulnerable than children born to mothers in the 15-19 age group.
Using the State of the World’s Children (2003) estimate for IMR of 165 per
thousand live births and U5MR of 257 per thousand live births, the unadjusted estimates in the AHS show a large decrease in both the mortality indicators. Even when assuming that the skewed reporting of boy children and girl children is entirely attributable to under-reporting of girl children and 50% of the under-reported girls are dead, the estimates of IMR and U5MR are still considerably lower than the State of the World’s Children Estimates.

32
C h a p t e r 5
MATERNAL AND CHILD HEALTH AND NUTRITION
Maternal and child health services in Afghanistan were severely affected during the many years of instability. Measurement of maternal and child health indicators is intrinsic to monitoring changes in health. They are key process measures that indicate likely changes in impact measures such as infant, child and maternal mortality. Maternal health indicators related to contraceptive use, utilization of antenatal care, type of antenatal care services provided, tetanus toxoid, use of skilled birth attendants and institutional delivery were measured in AHS 2006, as well as child health indicators related to immunization and breastfeeding.
CONTRACEPTION KNOWLEDGE AND USE
Knowledge of Contraceptive Methods
Information was collected on both traditional and modern methods of family planning. Modern methods include female sterilization, intra-uterine device, contraceptive pill, contraceptive injection and condom. Traditional methods included lactational amenorrhea (LAM), periodic abstinence, and withdrawal. Only currently married women between the ages of 10-49 years were asked questions on both their knowledge and use of contraception methods. Tables 5.1 and 5.2 present breakdowns on knowledge of contraceptive methods and use of contraceptive methods, respectively. Almost 33% of currently married respondents demonstrated knowledge of at least one modern method of contraception. The birth control pill was the best known modern contraceptive method. Knowledge of traditional methods was lower than knowledge of modern methods. Overall, knowledge of at least one method of contraception (including modern and traditional methods) was only 36.7%. Since respondents were asked to spontaneously name family planning methods, it is possible that they did not think to include some of the traditional methods of family planning as methods of contraception. It is also possible that the format of the question – where respondents were asked to name family planning methods that they knew – and cultural sensitivity of this topic resulted in under-reporting of knowledge of contraceptive methods. The relationship between knowledge of different methods of modern and traditional contraception and mother’s age, educational status, wealth status and time

33
taken to travel to a health facility was assessed. Currently married women who had some schooling were significantly more likely to know about contraception than currently married women who had never been to school. Wealth status showed a positive association with knowledge, with women in the wealthiest quintile twice as likely to have knowledge of contraceptive methods compared to women in the poorest quintile. A significantly higher proportion of women who lived within two hours of the nearest health facility had knowledge of contraceptive methods compared to women who lived at distances greater than two hours.
Current Use of Contraception Questions on contraceptive use were asked only of currently married non-pregnant
women, irrespective of their response to the knowledge of contraceptive methods question. Approximately 16% of the currently married, non-pregnant respondents reported current use of at least one method of modern contraception. Overall, the most common method of modern contraception was the oral contraceptive pill, with approximately 8% of the respondents using it, followed by injections at around 5%. Mother’s age is not significantly associated with contraceptive use. Women who had attended school were significantly more likely to use contraception than women who had no schooling. Respondents from the wealthiest quintile were more than 3 times as likely to use contraception compared to respondents in the poorest quintile. While overall contraception use tended to decline with travel time to facility, the pattern was not consistent between all categories of travel time.

34
Table 5.1: Knowledge of contraceptive methods Percent distribution of currently married women who have knowledge of modern and traditional contraception methods, AHS 2006
Background Characteristic
Knowledge of at least one of
any contraceptive
method
Knowledge of at least
one modern method
Modern Method Traditional method
Number of
women Female
Sterilization IUD Pill Injections Condom LAM Periodic
Abstinence Withdrawal Age
10 - 14 0.0 0.0 0.0 0.0 0.0 0.0 0.0 0.0 0.0 0.0 8 15 - 19 35.8 30.8 2.7 6.9 26.8 16.7 7.1 9.2 3.2 0.7 715 20 - 24 33.5 29.0 2.0 7.1 24.4 15.9 6.2 7.9 0.9 0.9 1288 25 - 29 38.4 32.8 2.1 6.2 25.6 19.2 5.8 8.8 2.2 1.5 1710 30 - 34 40.5 36.5 3.1 6.9 27.5 20.3 8.6 9.4 1.3 1.9 1193 35 - 39 39.7 36.8 3.5 6.0 28.8 20.6 7.5 6.2 1.0 2.0 1402 40 - 44 33.5 31.9 3.5 5.6 24.2 19.3 5.2 4.4 0.6 1.4 798 45 - 49 29.4 28.5 4.0 6.0 20.8 17.6 4.4 3.3 1.1 1.3 564 Total 36.7 32.9 2.8 6.4 25.9 18.7 6.5 7.4 1.5 1.5 7678
Education Never Attended School 35.9 32.1 2.8 6.1 25.3 18.5 6.2 7.4 1.5 1.4 7302 Has Attended Some School 52.3 48.5 4.1 13.3 37.4 22.6 14.0 8.9 1.7 2.9 376
Wealth quintile Lowest 26.3 24.7 1.9 3.3 19.4 15.5 1.8 1.7 0.2 0.5 1900 Second 31.1 26.7 1.6 4.2 21.5 14.1 3.9 5.7 0.6 1.0 1702 Middle 33.0 28.4 2.0 6.0 22.3 16.1 5.5 7.5 1.3 1.4 1306 Fourth 42.7 38.1 3.2 9.2 30.8 23.4 10.8 12.0 4.3 1.8 1252 Highest 55.1 50.6 6.0 11.2 38.8 26.5 13.6 12.9 1.9 3.1 1449 Travel time to facility using routine mode of transportation
<2 hrs 41.7 37.5 3.3 8.4 28.8 20.5 9.1 9.6 2.3 1.9 4568 ≥2 hrs but <3 hrs 28.6 24.9 1.8 3.3 19.8 12.3 2.9 4.8 0.2 0.8 1222 ≥3 hrs but <4 hrs 30.2 26.0 2.3 8.0 22.0 17.6 4.8 5.4 0.4 0.4 554 ≥4 hrs but <6 hrs 24.1 21.4 3.3 1.3 17.5 11.8 0.9 3.7 0.2 0.4 549 ≥6 hrs 28.8 26.7 0.4 1.7 24.9 21.3 1.0 2.9 0.2 0.7 480

35
Table 5.2: Contraception use Percent distribution of currently married women who use modern and/or traditional contraception methods, AHS 2006
Background Characteristic
Use of at least one of any
contraceptive method
Use of at least one modern method
Modern Method Traditional method
Female Sterilization IUD Pill Injections Condom LAM
Periodic Abstinence Withdrawal
Number of
women
Age 10 - 14 0.0 0.0 0.0 0.0 0.0 0.0 0.0 0.0 0.0 0.0 7 15 - 19 12.7 9.6 0.1 1.0 6.2 2.4 1.3 3.4 0.8 0.7 544 20 - 24 15.2 11.1 0.1 0.7 7.0 2.3 1.9 4.8 0.6 0.4 991 25 - 29 19.5 15.4 0.3 1.0 8.2 6.2 2.6 4.1 0.8 0.8 1341 30 - 34 23.8 19.8 1.2 1.4 9.2 7.0 2.8 4.0 0.5 0.9 930 35 - 39 21.6 19.3 1.3 0.6 10.7 5.7 2.5 2.2 0.3 0.6 1225 40 - 44 17.8 16.4 0.9 1.9 7.4 6.5 1.4 1.5 0.2 0.3 749 45 - 49 13.7 12.9 1.2 0.6 5.1 6.8 1.4 1.1 0.2 0.2 532 Total 18.6 15.5 0.7 1.0 8.1 5.4 2.2 3.2 0.5 0.6 6319
Education Never Attended School 18.0 15.0 0.7 0.9 7.8 5.4 2.1 3.2 0.5 0.6 5937
Has Attended Some School
28.8 25.2 1.3 3.1 13.9 4.6 3.5 3.0 0.3 1.4 356
Wealth Index
Lowest 8.2 7.4 0.2 0.4 3.4 3.2 0.5 0.6 0.0 0.2 1554 Second 16.0 13.0 0.4 0.2 7.6 3.8 1.8 2.9 0.1 0.9 1383 Middle 17.1 13.4 1.1 0.6 6.4 4.8 1.8 3.5 0.5 0.5 1075 Fourth 23.5 19.1 0.5 1.6 10.5 6.7 3.4 5.5 1.8 0.4 1061 Highest 31.9 27.8 1.6 2.7 14.4 9.1 4.0 4.6 0.6 1.1 1194
Travel time to facility using routine mode of transportation
<2 hrs 22.9 19.4 0.6 1.5 10.2 6.6 3.0 3.7 0.8 0.8 3774 ≥2 hrs but <3hrs 14.7 11.6 1.4 0.1 6.1 3.7 1.1 3.2 0.0 0.4 1040 ≥3hrs but <4 hrs 15.9 12.3 0.9 0.8 7.1 3.9 1.1 3.7 0.0 0.1 443 ≥4 hrs but <6hrs 4.0 2.9 0.0 0.0 1.5 1.4 0.0 0.9 0.3 0.0 420 ≥6hrs 6.8 5.5 0.0 0.0 2.6 2.9 0.2 1.3 0.0 0.0 399

36
Trends in Contraception Use Figure 5.1 shows the trends in contraceptive prevalence over a period of 3 years. The percentage of women of reproductive age in rural Afghanistan4 who are using a modern family planning method has increased from an estimated 5.1 in the 2003 MICS (Johns Hopkins University, 2005) to 10.4 in the 2005 NRVA (Johns Hopkins University, 2006) and 15.5 in 2006 from the current assessment. The definition of modern family planning methods in AHS included female sterilization, intra-uterine device, contraceptive pill, contraceptive injection, and condom. The MICS and the NRVA did not include intra-uterine device in their definition of modern methods of contraception. Only 1% of women in the AHS reported using an intra-uterine device, so this has a minimal effect on the comparability of the estimates across the three surveys. Figure 5.1: Trends in contraceptive use in rural Afghanistan
5.1
10.4
15.5
0
2
4
6
8
10
12
14
16
18
2003 MICS 2005 NRVA 2006 AHS
Perc
ent
4 The rural estimates from the MICS 2003 and NRVA 2005 were compared to the overall estimates from AHS 2006. The definitions of urban and rural areas were identical in the MICS 2003 and AHS 2006 and slightly different in the NRVA 2005. The NRVA 2005 classified four units as urban that were classified as rural in MICS 2003 and AHS 2006. These include Taloqan, Pul-e-Khumri, Maimana and Shiberghan.

37
ANTENATAL CARE Antenatal care services are very important for the well-being of the woman and her child. They identify pregnancies that could result in complicated deliveries. Women receive appropriate information on how to manage their pregnancies and deliveries. During antenatal care check-ups, health messages on child spacing, immunization, breastfeeding and other information are communicated to the pregnant woman. Also, antenatal care can be used as an entry point into the health care system for women to promote the use of safe delivery care.
Antenatal Care Coverage
Currently married women who had delivered in the two years preceding the survey – August 2004 and afterwards – were asked questions on antenatal care use. Included in the definition of skilled antenatal care providers are doctors, midwives, nurses, and community health workers (CHW). Traditional birth attendants (TBA) are not considered as skilled providers. Women who only received advice from friends or relatives are considered not to have received skilled antenatal care. Interviewers recorded all providers that were seen for antenatal care. Table 5.3 gives a breakdown of antenatal care coverage in relation to different factors. If a woman saw multiple providers, only the most skilled provider was counted. Over 32% of women who were pregnant in the last two years saw one of these skilled providers at least once during their latest pregnancy. Midwives were seen most frequently—15.9% of the time. However, most of the women (51.1%) did not see any skilled provider for their last delivery in the two years preceding the survey.
There was no clear pattern between the age of the respondent and antenatal care-
seeking practices. While a small percentage of women had attended school, antenatal care use was highly associated with whether or not a respondent had some level of schooling. There was mostly an increasing trend in the use of antenatal care services according to wealth status of a respondent. Women from wealthier households were more likely to use antenatal care services compared to women from poorer households. Respondents living within 2 hours of a facility were more likely to receive antenatal care from a skilled provider compared to respondents who lived farther away from a facility.
Types of Services Received Women who had at least one antenatal care visit were asked about the types of services they received. They were asked if they were weighed, if their height was measured, if they were counseled on breastfeeding, EPI and child spacing, if their blood pressure was measured and if urine and blood were tested. They were also asked if the provider talked to them about pregnancy complications. Table 5.4 gives a breakdown by the types of services the respondent reported receiving based on her age, wealth status, and travel time to facility.

38
There was no clear pattern between the age of mother and the types of services she received. Women in the lowest wealth quintile were least likely to receive all types of services and women in the highest wealth quintile were most likely to receive all types of services, but respondents in the middle three wealth quintiles had no clear pattern in the types of services they received. One possible explanation for these wealth differences is that certain types of antenatal care services (such as giving blood and urine samples) are only conducted in higher level facilities such as comprehensive health centers (CHC) and hospitals and women from wealthier households tend to live closer to these facilities than women from poorer households and thus have greater access to care. Table 5.3: Antenatal care use Percent distribution of women who had a live birth in the two years preceding the survey by source of antenatal care (ANC) provider during pregnancy for the most recent birth, according to background characteristics, AHS 2006
Background Characteristic
Received any ANC
from skilled
provider
Skilled Provider Non-skilled
Provider
Number of women Doctor Midwife Nurse CHW TBA
No Provider
Age of mother at birth
<20 yrs 37.2 15.1 18.0 0.2 3.9 14.6 48.2 699
20 - 24 31.9 13.5 15.2 0.5 2.7 16.2 51.9 899
25 - 29 30.0 12.0 16.3 0.3 1.4 17.4 52.6 806
30 - 34 32.1 16.5 13.5 0.2 1.9 14.7 53.3 434
35 - 49 28.7 12.2 15.1 0.5 0.9 22.2 49.1 408 Total 32.3 13.7 15.9 0.3 2.3 16.7 51.1 3246
Education
Never Attended School
31.1 13.1 15.5 0.3 2.2 17.1 51.9 3073
Has Attended Some School
51.7 24.1 22.4 0.6 4.7 10.2 38.1 173
Wealth quintile
Lowest 18.6 5.9 10.9 0.0 1.8 14.0 67.4 762
Second 26.2 10.0 13.7 0.2 2.3 24.8 49.0 735
Middle 37.2 16.2 18.4 0.5 2.2 19.3 43.5 553
Fourth 36.8 17.2 16.5 0.9 2.1 12.5 50.7 545
Highest 47.9 22.8 21.8 0.2 3.1 11.7 40.4 621
Travel time to facility using routine mode of transportation
<2 hrs 39.3 17.5 18.2 0.5 3.1 17.4 43.4 1894 ≥2 hrs but <3
hrs 33.2 13.7 18.3 0.2 1.0 21.5 45.3 537
≥3 hrs but <4 hrs 23.0 8.1 12.7 0.4 1.9 17.1 59.9 256
≥4 hrs but <6 hrs 10.6 4.3 5.4 0.0 0.9 13.9 75.5 223
≥6 hrs 7.6 2.4 5.2 0.0 0.0 8.5 84.0 218

39
Table 5.4: Types of services received during antenatal care visit Percent distribution of women who received specific health services during pregnancy for the most recent birth in the two years preceding the survey, according to background characteristics, AHS 2006
Background Characteristic
Weight measured
Height measured
Counseled on Breastfeeding
Counseled on EPI
Counseled on child spacing
Blood pressure measured
Urine sample taken
Blood sample taken
Informed on signs of
pregnancy complications
Received iron tablets
or syrup Number of
women
Age of mother at birth
<20 yrs 16.2 11.9 12.6 14.1 10.2 23.5 13.1 13.9 14.5 28.8 699 20 - 24 15.9 12.2 12.4 12.9 11.0 23.7 12.8 14.5 11.9 29.5 899 25 - 29 16.7 12.4 14.9 13.1 11.4 21.2 12.0 11.7 14.8 29.0 806 30 - 34 17.3 13.2 15.1 15.8 11.8 22.6 11.6 12.6 14.6 29.8 434 35 - 49 17.3 12.3 15.5 12.5 15.2 22.5 13.0 14.7 12.5 29.8 408 Total 16.3 12.3 13.8 13.6 11.5 22.7 12.5 13.5 13.6 29.3 3246
Education
Never Attended School 16.0 12.0 13.5 13.2 11.4 21.8 12.3 13.2 13.1 28.8 3045
Has Attended some School 22.2 17.2 19.5 20.1 15.0 36.9 16.2 16.7 20.1 39.5 185
Wealth Index
Lowest 8.0 6.2 8.6 5.6 6.2 12.4 4.8 6.1 7.2 15.0 762 Second 14.9 11.5 13.5 12.2 10.2 21.5 9.1 10.5 10.1 24.3 735 Middle 20.6 16.1 16.1 11.6 11.3 26.3 12.6 14.0 16.9 36.2 553 Fourth 18.0 13.1 13.1 15.9 12.8 27.3 16.9 16.8 17.0 36.7 545 Highest 23.0 16.7 19.3 25.2 19.0 30.5 22.9 23.1 20.1 40.6 621
Travel time to facility using routine mode of transportation
<2 hrs 20.5 15.8 17.7 17.9 15.0 28.3 16.3 17.1 17.8 36.5 1894 ≥2 hrs but <3 hrs 15.0 11.2 12.9 11.0 10.8 21.7 11.8 14.7 11.0 26.9 537
≥3hrs but <4 hrs 10.8 8.2 8.9 7.8 5.7 18.1 5.7 6.5 8.4 17.6 256 ≥4 hrs but <6 hrs 7.5 5.1 5.5 5.4 4.5 8.5 2.6 3.1 3.9 13.8 223
≥6hrs 4.1 2.9 2.0 4.1 3.6 5.9 2.1 1.4 2.4 11.0 218

40
A significantly higher percentage of women who had some education received counseling on immunization, information on breastfeeding, had their blood pressure measured and received iron tablets during pregnancy. Receiving other antenatal care services was not significantly associated with education.
Overall, women living within 2 hours of a health facility received more of the
different antenatal care services than women who lived greater than 6 hours away from a health facility. However, there were no significant differences in the types of services received between women who lived less than 2 hours from a health facility and women who lived between 2 to less than 3 hours from a health facility. A significant decrease in the receipt of different services only started occurring when women lived more than 3 hours from a health facility. The low utilization rates of the different antenatal care services even for women that live close to the health facility signals that other factors besides distance are playing a role in low utilization rates.
Trends in Antenatal Care Use Figure 5.2 presents trends in receipt of skilled antenatal care from 2003 to 2006 in rural Afghanistan. There is a substantial increase in the use of skilled providers for antenatal care Figure 5.2: Trends in skilled antenatal care utilization in rural Afghanistan
4.6
12.6
32.3
0
5
10
15
20
25
30
35
2003 MICS 2005 NRVA 2006 AHS
Perc
ent
services from 2003 to 2006. There were slight differences in definitions between the MICS, NRVA and AHS. The 2003 MICS and 2005 NRVA excluded visits for getting injections of tetanus toxoid from the definition of skilled antenatal care used. The AHS followed the definition from MICS3 (UNICEF, 2005), where a respondent is asked who she saw for antenatal care if she was pregnant in the last 2 years. Also, in the 2003 MICS and the 2005

41
NRVA, Community Health Workers (CHW) were not included as part of the answer choices and they were not included in the definition of skilled antenatal care. While some of the increase seen from 2003 to 2006 for skilled antenatal care use could thus be artifactual, only 2.3% of women received antenatal care from a CHW in the AHS 2006. The difference in definitions would thus have only a small effect on the comparability of the estimates.
TETANUS TOXOID VACCINATIONS
Tetanus toxoid (TT) is given to pregnant women to prevent the neonate from getting tetanus. Typically, a woman requires 2 doses of tetanus toxoid for each pregnancy to be fully protected. However, the infant is also thought to have adequate protection if the mother was fully vaccinated in her previous pregnancies. There are different ways a mother can be considered protected against neonatal tetanus:
Mother receives two doses during current pregnancy; Mother receives one dose during this pregnancy and at least one another dose in a
prior pregnancy; Mother receives two doses in a prior pregnancy but the last dose was less than 3
years before birth of the child in question; Mother receives three doses within 5 years of the current pregnancy; Mother receives four doses with the last dose less than 10 years before the current
pregnancy Or, she has received 5 doses or more for lifetime protection5
Data Quality Assessment
To estimate TT coverage, all eligible respondents were asked to show the card documenting their TT status. In addition, recall questions on receiving tetanus injections were asked of respondents who had delivered in the last two years before the survey. Respondents were asked to recall if they received TT and, if so, the number of doses they received.
Before providing estimates for TT, it is necessary to describe data quality concerns related to TT. Due to the structure of the questionnaire, only respondents who saw a provider for antenatal care were asked the recall-based question on TT receipt (the questions related to the card were asked of all eligible women, irrespective of whether they received antenatal care from a skilled provider). This excludes women who received TT during campaigns.6 The question about having a TT card referred to a “maternal health card”, which some women may have understood as referring to something other than a card that has information on TT. While attempts were made to re-inforce the understanding that this refers to any card that has information on the woman’s TT status, this may have led to inconsistency in the responses and the missing of some TT cards. The 5 In Afghanistan, fully vaccinated against TT for lifetime protection is considered to be 5 doses. 6 TT campaigns were held in 9 provinces from August 2005 to August 2006. Information from EPI Department, MOPH (2006)

42
estimate for TT coverage may thus be lower than the true level of TT coverage and these estimates should be interpreted with caution.
Tetanus Toxoid Coverage
Table 5.5 gives a breakdown of women who are protected against tetanus (using the definition given above on what constitutes protection). Of the women who had a delivery in the last two years, only 24% were protected against neonatal tetanus [refer to data qualifications above]. TT coverage was not calculable in either the MICS or the NRVA, so there are no other data from household surveys to which these estimates can be compared.
Table 5.5: Tetanus Toxoid coverage Percentage of women receiving 2 doses of TT for their most recent pregnancy in the two years preceding the survey Percentage N=3246 Did not receive 2 doses of TT 76.3 Received 2 doses of TT 23.8
Analysis was also conducted on the receipt of Tetanus Toxoid by utilization of
skilled antenatal care services. Table 5.6 shows that 64% of women who saw a skilled antenatal care provider at least once received at least one dose of Tetanus Toxoid compared to 13% of women who did not see a skilled antenatal care provider. It is concerning that out of the women who used skilled antenatal care services, 36% still did not receive any doses of Tetanus Toxoid. Table 5.7 presents results similar to those in Table 5.6, but it shows the proportion of women that saw a skilled provider for ANC that are fully immunized for tetanus (2+ doses). Over 45% of the women who saw a skilled ANC provider for their last pregnancy did not have complete protection against neonatal tetanus. These women represent a missed opportunity for service providers, as these women attended facilities but did not receive complete care.
Table 5.6: Use of skilled ANC and receipt of Tetanus Toxoid
Received 0 doses of
TT
Received at least 1 dose of
TT Total Did not see skilled ANC provider 86.6 13.4 2084 Saw ANC provider at least 1 35.9 64.1 993
Table 5.7: Skilled ANC and complete Tetanus Toxoid immunization (TT2)
Not fully immunized
for TT Have 2+
doses of TT Total Did not see skilled ANC provider 89.0 11.0 2084 Saw ANC provider at least 1 45.7 54.3 993

43
DELIVERY CARE
Safe delivery practices are essential for the health of the mother and her child. In Afghanistan, use of skilled birth attendants and delivering in institutions is traditionally low. This section examines how respondent characteristics are associated with utilization of skilled birth attendants and delivering in an institution.
Place of Delivery An institutional delivery was classified as any delivery that occurred in a hospital, a public health clinic or a private health clinic. Table 5.8 presents the breakdown of institutional deliveries by respondents’ characteristics. Overall, only 14.6% of women who delivered in the two years preceding the survey delivered in an institution. Most women delivered in their own or a relative or neighbor’s home. Among women who delivered in an institution, hospitals were the most common type of institution. Utilization of public health and private health clinics for deliveries is very low.
Women who were less than 20 years were more likely to deliver in institutions than women older than 20 years of age. Women with some level of education had a higher likelihood of having a delivery in an institution than women who had no schooling. Wealth status was also associated with institutional delivery. Women in the wealthiest quintile were ten times more likely to have a delivery in an institution than women in the poorest quintile. Women were more likely to deliver in institutions if the travel time to a facility was less than 2 hours. There was a considerable drop in institutional deliveries when respondents lived more than 3 hours away from the facility. However, there seems to be virtually no difference between women that lived between 3 and 4 hours from a facility and respondents that lived farther away. There is some evidence of a threshold effect for institutional deliveries at the 3 hour travel time mark.

44
Table 5.8: Institutional deliveries Site of delivery by respondent characteristics, AHS 2006
Background Characteristic
Delivered at an
Institution
Institutional Delivery Home
Delivery
Number of
women Hospital
Public Health Clinic
Private Health Clinic
Delivered at own, relative or neighbor's
home
Age of mother at birth
<20 yrs 19.0 12.0 3.9 3.1 81.0 674 20 - 24 13.4 10.1 2.3 1.0 86.6 857 25 - 29 12.9 8.0 3.4 1.5 87.1 764 30 - 34 13.5 9.8 2.7 1.0 86.5 412 35 - 49 14.2 8.9 3.5 1.8 85.8 380 Total 14.6 9.8 3.1 1.7 85.4 3087
Education
Never Attended School 13.7 9.1 3.1 1.5 86.3 2920
Has Attended Some School 30.0 22.4 2.8 4.8 70.0 167
Wealth quintile
Lowest 3.2 2.2 1.0 0.1 96.8 738 Second 7.1 4.5 2.2 0.4 92.9 699 Middle 15.3 8.2 4.4 2.7 84.7 524 Fourth 19.1 13.2 3.7 2.1 80.9 516 Highest 33.0 24.1 5.0 3.9 67.0 584
Travel time to facility using routine mode of transportation
<2 hrs 20.2 13.5 4.3 2.4 79.8 1786 ≥2 hrs but <3
hrs 11.1 7.0 3.1 1.0 88.9 513
≥3 hrs but <4 hrs 4.7 4.0 0.3 0.4 95.3 245
≥4 hrs but <6 hrs 3.3 2.7 0.1 0.5 96.7 219
≥6 hrs 0.5 0.0 0.1 0.3 99.5 208
Skilled Birth Attendance Use of skilled birth attendants who follow safe delivery practices and can recognize danger signs is very important in reducing maternal mortality. Afghanistan has one of the highest maternal mortality ratios in the world (Bartlett et al, 2005). There needs to be a significant increase in the use of skilled birth attendants to help reduce the high maternal mortality ratio. Skilled birth attendants include a doctor, midwife or nurse. CHWs are not considered skilled birth attendants. Overall use of skilled birth attendants is low in

45
Afghanistan. The majority of the women have only a friend or relative assisting them with their deliveries. Table 5.9 gives a breakdown of use of skilled birth attendants during delivery by characteristics of the respondents.
Table 5.9: Skilled birth attendance Use of skilled birth attendants by respondent characteristics, AHS 2006
Background Characteristic
Used Skilled
Attendant
Skilled birth attendant Non-skilled birth attendant
Number of
women Doctor Midwife Nurse CHW TBA Relative
or Friend No One Age of mother at delivery
<20 yrs 22.7 9.7 13.0 0.3 2.9 20.0 49.6 4.6 675 20 – 24 17.0 6.2 10.7 0.5 2.6 19.3 57.2 3.4 858 25 – 29 18.0 5.5 12.5 0.1 1.1 19.6 56.4 4.8 768 30 – 34 20.0 9.3 10.7 0.0 2.3 19.5 52.5 5.6 415 35 – 49 17.6 7.0 10.6 0.0 1.9 25.8 49.5 5.2 380 Total 19.0 7.3 11.6 0.2 2.2 20.4 53.8 4.5 3095
Education
Never Attended School 17.8 6.6 11.2 0.2 2.0 20.9 54.5 4.6 2928
Has Attended Some School 39.6 20.0 19.6 0.6 5.1 10.6 40.3 3.7 167
Wealth quintile
Lowest 7.3 2.6 4.7 0.0 0.9 18.2 67.6 6.1 740 Second 11.6 3.1 8.6 0.0 2.6 25.7 54.2 5.9 701 Middle 19.0 6.8 12.2 0.6 2.2 26.2 49.0 3.1 525 Fourth 22.9 10.1 12.8 0.1 2.4 18.2 51.7 4.7 517 Highest 38.4 16.1 22.3 0.6 3.0 12.8 43.2 1.9 587
Travel time to facility using routine mode of transportation <2 hrs 25.8 10.3 15.5 0.3 2.7 20.3 47.2 3.7 1792 ≥2 hrs but <3 hrs 14.7 4.2 10.5 0.1 1.8 26.2 53.3 3.9 515 ≥3 hrs but <4 hrs 7.1 3.2 4.0 0.4 2.5 26.5 58.6 4.8 245 ≥4 hrs but <6 hrs 4.3 2.2 2.1 0.0 0.0 12.1 76.9 6.8 219 ≥6 hrs 1.9 0.0 1.9 0.0 0.0 16.8 72.8 8.5 208
Women less than 20 years of age were significantly more likely to use a skilled birth
attendant compared to women 20-29 years of age and women 35-49 years of age. Women with some education had twice the likelihood of using a skilled birth attendant for deliveries compared to women with no education. Use of skilled birth attendants for delivery significantly increases with the wealth status of the respondent. Respondents in the highest wealth quintile were 5 times more likely than respondents in the poorest quintile to use skilled attendants for delivery. Distance from a facility is another important factor in the use of skilled birth attendants during delivery. Respondents who live less than 2 hours from a health facility were more likely to use skilled attendants compared to women who live farther away. Even compared to respondents who live between 2 to 3 hours from a facility, a respondent who lives less than 2 hours away is

46
almost twice as likely to use a skilled attendant. Using a skilled attendant during delivery either requires a pregnant woman to go to a facility that has a skilled provider or the skilled provider has to come to the respondent’s home. Given that institutional delivery is lower than the use of skilled birth attendants, in many cases skilled attendants are traveling to women’s homes to assist with deliveries.
Trends in Skilled Birth Attendance As shown in Figure 5.3, there has been a threefold increase in the use of skilled birth attendants during deliveries in AHS 2006 compared to MICS 2003. While the absolute level of use of skilled birth attendants is still very low, at less than one in five women, this increase is substantial.
Figure 5.3: Trends in utilization of skilled birth attendants in rural Afghanistan
6.0
8.4
18.9
0.0
2.0
4.0
6.0
8.0
10.0
12.0
14.0
16.0
18.0
20.0
2003 MICS 2005 NRVA 2006 AHS
Perc
ent

47
CHILDHOOD IMMUNIZATION The Expanded Program on Immunization (EPI) for infants (under one year of age) includes vaccinations against six diseases: tuberculosis (BCG vaccine), poliomyelitis (OPV), diphtheria, pertussis, tetanus (DPT), and measles. The schedule recommended by the World Health Organization (WHO) is BCG and polio (OPV0) at birth, followed by 1 dose each of OPV and DPT at 6, 10 and 14 weeks, and finally measles vaccine at 9 months. A child is considered fully immunized when it has received all of the vaccines in the EPI under-1 schedule. The goal of EPI programs is to immunize children before they reach their first birthday, and this indicator is measured in children 12–23 months of age. The rationale for calculating these indicators in the 12-23 month age group is that the children would need one full year to get all the required vaccines according to the schedule and to allow for uncertainties about the child’s age. So, assessment of child’s immunization status can only be accurately calculated once they have completed their first year.
Immunization Coverage Estimates for immunization coverage were calculated using both the immunization card and mother’s recall. A mother of an under-five year old child was first asked if the child has an immunization card. When the mother presented the card, all information was recorded from the card onto the questionnaire. The estimates for a child who had a card were calculated based on the immunizations recorded in the card, as well as any other immunizations that a child could have received that were not recorded on the card (such as vaccines received during campaigns and immunization days). For example, if a child has two doses of polio vaccine recorded on the card and the mother reported that the child received an additional dose not recorded on the card, this child would be recorded as having received three doses of polio vaccine. When the mother could not present an immunization card or when the child did not have an immunization card, immunization estimates for the child were calculated solely based on mother’s recall. Only 17% of children 12-23 months of age had immunization cards, so the estimates presented here are based on the mother’s recall for the majority of cases. Table 5.10 presents overall estimates for the different antigens and a breakdown by characteristics of the child and the household. BCG and DPT are given through the routine health care system, while polio and measles are given both at health clinics and through campaigns. BCG, as the first vaccine given, has been received by more than 70% of children 12-23 months of age, indicating that children have at least initial contact with the health care system. Coverage of OPV3 is almost 70%. Since polio is given through both the routine health care system and through campaigns, the estimates of polio are attributable to both the routine health care system and campaigns. DPT is used as a measure of the effectiveness of the routine health care system in delivering immunization services. Over 60% of 12-23 month olds received DPT1. This indicates that most children have at least initial contact with the health care system. However, with the second dose of DPT there is a 12 percentage point drop in coverage and there is a further 14 percentage

48
point drop in the proportion of children receiving the third dose of DPT. The declines in DPT estimates indicate that there are opportunities missed by the health care system. One reason for low estimates for vaccine coverage is that people are not being adequately mobilized to access the system. That is, they do not have appropriate contact with the health care system. However, in the case of the DPT estimates, people are having some contact with the health care system but are not coming back. Measles vaccine coverage is 62.6% – higher than DPT3 – indicating some effect of the measles campaigns. Full immunization is considerably lower at slightly over 27% percent, largely being a function of the low DPT3 levels. More than three quarters (76.5%) of children 6-59 months of age received Vitamin A in the last six months. Vitamin A is often given during polio campaigns with the polio vaccine. There are slightly over 14% of children between 12-23 months of age that are not vaccinated at all. These children are being completely missed by the system.
Caution should be used in interpreting the DPT estimates. DPT is only given
through the routine health care system and involves 3 doses -- making it harder for a respondent to remember whether her child actually received all the doses in the absence of a written immunization record. This is especially true if the mother was not the person who took the child to the facility, which may frequently be the case. The respondent was only able to produce a vaccination card in 17% of the cases. This makes recall of DPT difficult without a card to verify the number of doses received. While polio also requires 3 doses, they may be easier to remember as they are often given through campaigns. Measles is also easier to remember as it is only 1 dose and can be given through campaigns. The estimates for measles, which follows the third dose of DPT in the EPI schedule, are higher than the DPT estimates. This brings to question whether the DPT estimates are accurate. There are several possible explanations for this: 1) the higher level of measles immunization coverage can be attributed to the recent campaigns and campaigns reach into areas where distance limits the number of contacts residents have with health facilities; 2) some children make contact with the routine system at an age appropriate to receive measles vaccine without making a sufficient number of visits to receive the third dose of DPT or 3) there is some recall bias with the DPT vaccinations. Any combination of these factors may affect the estimated levels of DPT3 and measles coverage.

49
There were no statistically significant differences in immunization coverage between male and female children 12-23 months of age, except for measles, with a higher proportion of male children receiving measles vaccination compared to female children. Children from progressively wealthier quintiles were more likely to be immunized than children from lower wealth quintiles.
There are some differences apparent in immunization coverage between mothers who have received some education and mothers who have not, but these differences are not statistically significant. The differences in coverage by education status appear to be smaller in proportional terms for vaccines and supplements given during campaigns (polio, measles and Vitamin A) compared to those given only through the routine system (BCG and DPT).
Table 5.10: Vaccine receipt by background characteristics Percentage of children 12-23 months who received specific vaccinations at any time before the survey by health card or mother's report, and percentage with a health card, by background characteristics, AHS 2006
Percentage of children who received:
Vitamin A
% with a
health card seen Total BCG OPV3 DPT1 DPT2 DPT3 Measles All1
No Vacci-
nations Sex
Male 72.2 70.6 62.8 50.6 36.5 66.0 29.4 13.6 76.1 17.9 843 Female 68.2 68.8 57.9 46.9 32.6 59.1 24.6 14.7 76.9 16.8 822 Total 70.2 69.7 60.4 48.7 34.6 62.6 27.1 14.1 76.5 17.4 1665
Mother’s Education Never Attended School
69.6 69.5 59.9 48.2 34.3 62.3 26.9 14.4 76.2 17.5 1559
Has Attended Some School 78.4 73.3 70.6 60.1 40.1 67.3 31.4 10.7 81.7 17.0 98
Wealth quintile
Lowest 52.9 63.0 44.5 35.1 21.5 48.5 14.3 20.9 75.6 13.9 348 Second 67.5 63.7 57.7 45.4 32.6 59.9 23.0 14.1 77.6 17.9 382 Middle 74.6 68.7 59.5 47.7 35.6 64.6 28.1 13.1 76.8 17.4 288 Fourth 78.0 76.6 68.2 57.6 39.0 68.5 31.1 10.1 78.6 18.4 292 Highest 81.0 77.7 73.8 59.4 45.2 73.3 39.9 11.3 74.7 19.8 345
Travel time to facility using routine mode of transportation
<2 hrs 78.8 74.2 68.9 56.2 41.6 69.5 33.4 10.5 78.2 19.5 1039 ≥2 hrs but <3 hrs 59.6 63.5 50.7 42.7 28.7 48.6 20.4 19.0 72.7 16.8 241 ≥3 hrs but <4 hrs 65.2 69.4 54.1 39.8 24.3 63.4 17.1 13.8 73.0 13.1 146 ≥4 hrs 47.7 55.5 38.0 26.8 14.5 44.0 11.0 25.1 75.4 10.6 186
1 BCG (for tuberculosis), measles, three doses of DPT (diptheria, pertussis and tetanus) and three doses of OPV (polio)

50
While children who live more than 4 hours from a health facility had uniformly lower immunization coverage than children who live within 2 hours of a health facility, the coverage levels for the travel times in between are less straightforward. For BCG, OPV3, DPT1 and measles, a slightly higher proportion of children who live between 3-4 hours from a facility have received the antigens compared to children who live between 2-3 hours from a health facility. The lack of a clear pattern in the association between distance to facility and receipt of OPV3, measles and Vitamin A can be attributed to campaigns, but the explanation for BCG and DPT1 is less clear. One possible explanation is that BCG and DPT1 are given at first contact with the health facility. First contact can happen when children are brought to the health facility for curative care. Care-seeking for sick children under-five may be less sensitive to travel time to the health facility than use of preventive services. In contrast, DPT2 and DPT3 require repeat visits to a health facility, and both show decreasing levels of coverage for children living in households farther away from the facility. More than 10% of children living within 2 hours of a health facility received no vaccinations, indicating that while distance from a health facility is an important barrier to receiving services it is by no means the only barrier.
Trends in Immunization Coverage Table 5.11 shows the trends in immunization coverage. BCG coverage increased by almost 15 percentage points from 2003 to 2006. Polio (OPV3) coverage increased from 30% to almost 70%. This large increase from 2003 to 2006 can be attributed to both the rebuilding of the health system and sustained campaigns by MOPH, WHO, UNICEF and other partners. Measles coverage was lower in 2006 compared to 2003. One of the main reasons for this decline was a nationwide measles campaign conducted before the MICS in 2003. Full immunization, while increasing over the years, is considerably lower than coverage of the individual vaccines, due to the low estimated coverage of DPT3. Vitamin A is also higher in 2003 compared to 2006, which is likely due to Vitamin A being included in the 2003 measles campaign.

51
Table 5.11: Trends in immunization coverage 2003 MICS 2005 NRVA 2006 AHS
RURAL MEDIAN (%) RURAL MEAN
(%) RURAL MEAN
(%) BCG 56.5 58.8 70.2
95% Confidence Interval N/A [56.6, 61.0] [66.1,74.0]
OPV3 29.9 49.2 69.7 95% Confidence Interval N/A [47.1, 51.4] [65.8,73.2]
DPT3 19.5 16.7 34.6
95% Confidence Interval N/A [14.9, 18.6] [30.9,38.4]
Measles 75.6 52.8 62.6 95% Confidence Interval N/A [50.6, 54.9] [58.5,66.9]
Full Immunization 15.5 11.2 27.1
95% Confidence Interval N/A [9.9, 12.7] [23.6,30.6]
Vitamin A 90.3 44.8 79.5 95% Confidence Interval N/A [43.2, 46.4] [77.3,81.6]
BREASTFEEDING One important factor that impacts the well-being of young children is their nutritional status. Breastfeeding plays an essential component in the prevention of childhood illnesses. Breastfeeding questions were asked from mothers of children less than 2 years of age. Information was collected on ever breastfeeding, when breastfeeding began, current breastfeeding status and duration of breastfeeding. These questions are used to measure exclusive breastfeeding and appropriate complementary feeding. Table 5.12 gives the breakdown of children under 2 years of age and their breastfeeding status. Almost 98% of the children under two years of age were ever breastfed. Colostrum, a fluid that precedes the production of breast milk, has antiviral and antibacterial properties as well as nutritional value that is very important for the infant. Putting the child to the breast immediately after birth ensures that the baby receives the benefit of colostrum and the body warmth of the mother. In many cultures colostrum is considered unclean and is thrown away. There is anecdotal evidence that colostrum is considered unclean in Afghanistan. The respondent was asked if the baby was put to the breast within the first hour of birth or after the first hour of birth. While this question does not immediately measure whether the discarding of colostrum is a common practice in Afghanistan, almost 37% of respondents reported that they put their infants to the breast within the first hour of birth. Over sixty percent of the respondents, however, did not feed the infant immediately after birth or did not remember. Exclusive breastfeeding is defined as infants 0-5 months of age who received only breast milk in the last 24 hours. While the number of children between 0-5 months of age

52
was small (636 children), 83% were reported to have received only breast milk in the last 24 hours. There is anecdotal evidence that infants in Afghanistan are frequently given tea or maska (butter) soon after birth. The high percentage of exclusive breastfeeding belies the anecdotal evidence of supplemental liquids/solids commonly being given to infants. Some mothers may not consider tea or maska as supplemental foods, and thus may not have reported giving these items to their infants. To the extent that this occurred, the estimated proportion of children exclusively breastfed in the last 24 hours would be artificially high.
After a child turns six months, it needs additional food beyond mother’s breast milk. The percentage of children 6-9 months of age that received liquid and solid food in addition to mother’s breast milk in the last 24 hours was 28%. The appropriateness of the complementary foods cannot be ascertained as data on the types of complementary foods given were not collected in the survey. A nutrition survey conducted by UNICEF/CDC in Badghis province in 2002 (Woodruff et al., 2002) found that only 21% of infants received timely complementary foods. MICS 2003 estimated that 28% of children 6-9 months of age received timely complementary foods (UNICEF, 2006). A national UNICEF/CDC Nutrition Assessment conducted in 2004 (UNICEF and CDC, 2005) showed that 37% of the children in the survey were stunted at 12 months of age and the prevalence of underweight and wasting in children increases after the first 6 months, and is found to be highest in children that are 6-24 months of age. Given the low prevalence of complementary foods given to children 6-9 months of age in this survey and supporting evidence from the UNICEF/CDC nutrition assessments, there is concern that infants 6 months and older are not being appropriately fed in Afghanistan.

53
Table 5.12: Breastfeeding Percentage distribution of breastfeeding status of children under 2 years of age by background characteristics Afghanistan 2006
Total
Sex Wealth Status Mother's education
status
Male Female 1st
Quintile 2nd
Quintile 3rd
Quintile 4th
Quintile 5th
Quintile No
school Some school
Ever Breastfed n=2530 n=1321 n=1209 n=570.1 n=569.5 n=425.7 n=436.5 n=510 n=2379 n=138 Never Breastfed 2.5 2.2 2.8 1.7 2.7 2.3 2.6 3.1 2.3 6.1 Breastfed 97.6 97.8 97.2 98.3 97.3 97.7 97.4 96.9 97.8 93.9 First breastfeeding n=2456 n=1348 n=1219 n=555 n=552 n=414 n=424 n=493 n=2313 n=129 Immediately/within 1st hour of birth 36.7 37.3 36.2 29.6 35.5 36.1 37.1 45.8 36.5 39.0
After the first hour of birth 49.0 48.6 49.4 53.2 55.4 46.9 46.1 41.7 48.9 51.5 Don't remember/ Don't know 14.3 14.1 14.4 17.2 9.0 17.0 16.8 12.4 14.6 9.5 Exclusive Breastfeeding n=636 n=331 n=305 n=135 n=146 n=115 n=105 n=129 n=597 n=34 Children 0-5 months not exclusively breastfed 17.0 15.5 18.7 18.4 13.4 10.7 19.7 22.6 17.1 18.1
Children 0-5 months exclusively breastfed 83.0 84.5 81.3 81.6 86.6 89.3 80.3 77.4 82.9 81.9
Complementary feeding n=474 n=264 n=211 n=123 n=101 n=77 n=75 n=92 n=447 n=24 Children 6-9 months not getting complementary foods 71.6 74.3 68.2 71.0 71.0 71.4 65.3 79.1 72.1 65.0
Children 6-9 months getting complementary foods 28.4 25.7 31.8 29.0 29.0 28.6 34.7 20.9 27.9 35.0

54
CONCLUSION
Reproductive Health: While large improvements between 2003 and 2006 are noted in the priority maternal health indicators, the absolute levels of these indicators are still very low. Educational status, wealth and access play a key role in the use of health services by women. While distance is an important barrier to the use of maternal health services, many women who live close to health facilities are not receiving essential services. Over 32% of women make at least one visit to a skilled provider for antenatal care, but not all women who make a visit for skilled antenatal care receive all services that should be provided during an antenatal care visit. In particular, few women are receiving counseling on breastfeeding, EPI and child spacing. These services should be available at every level of the health system, including the health post.
Other sections in this report demonstrate that women are seeking curative care for themselves or for their children at levels that are similar to or greater than men. This shows that women are having contact with the health system. There are potential missed opportunities in promoting preventive health care when women who attend facilities for other reasons are not asked about their pregnancy status. It is essential to use a woman’s contact with the health system to promote use of maternal health services.
Child Health: The results for child health are similar to the results for reproductive health – they show large improvements for some, but not all, indicators. Substantial increases are observed in the coverage of BCG, OPV3 and DPT3 from 2003 to 2006. The estimates for measles and Vitamin A, however, have decreased over this time period, reflecting a campaign conducted before the 2003 MICS. The antigens that are delivered both through the routine system and campaigns have a higher coverage than antigens that are only delivered through the routine system. Drop-off is a particular problem with DPT, which drops from 60% coverage for DPT1 to 35% for DPT3. Even with the difficulty of measuring DPT3 coverage, the low estimated coverage of DPT3 and the small proportion of households that have immunization cards indicate priority areas to be addressed in the routine system.
The high percentage of exclusive breastfeeding belies the anecdotal evidence of supplemental liquids given to infants at an early stage. The estimated proportion of children exclusively breastfed in the last 24 hours is probably an over-estimate that reflects potentially incorrect reporting by respondents. However, multiple sources indicate that the introduction of timely complementary foods is low. Increasing stunting rates in children between 6-24 months (UNICEF and CDC, 2005) validates the low prevalence of timely complementary foods. Efforts need to focus on removing barriers that impede exclusive breastfeeding and preventing the introduction of complementary foods at the appropriate age.
55
C h a p t e r 6
PERCEPTIONS OF HEALTH SERVICES, CARE-SEEKING PRACTICES AND HEALTH
EXPENDITURES
PERCEPTIONS OF HEALTH SERVICES
A respondent in each household was asked a series of questions related to their perceptions of health services. Results to these questions are shown in Table 6.1. Among the 2013 respondents reporting that they were aware of a community health worker in their community, almost 90% reported that they somewhat agreed (57.0%) or strongly agreed (31.2%) with the statement “The community health workers provide a useful service to the community.”
All respondents were asked to rate their level of agreement or disagreement with the following question regarding the nearest health facility: “The health facility provides a useful service to the community.” Approximately 22% of the respondents reported that they strongly agreed with this statement, while 52.4% reported that they somewhat agreed.
Among the 1478 reporting that there was a shura-e-sehie in their community,
almost 90% of respondents reported that they somewhat agreed (57.0%) or strongly agreed (33.5%) that the shura-e-sehie provides a useful service to the community.
Respondents in each household were asked whether they felt the availability of health services is a lot worse, somewhat worse, about the same, somewhat improved or a lot improved compared to three years ago. Just under 10% of respondents reported “a lot worse” (3.5%) or “somewhat worse” (5.9%) and 31.8% reported “about the same.” Approximately 44% reported either “somewhat improved” (36.8%) or “a lot improved” (7.4%). Approximately 15% reported that they did not know. Wealthier people were significantly more likely than poor people to strongly agree that community health workers and health facilities provide a useful service to the community. Wealthier people were also significantly more likely than poor people to report that the availability of health services has improved a lot compared to three years ago. People living more than 6 hours from the nearest health facility were significantly less likely than people residing within 2 hours from the nearest health facility to report that the health facility and shura-e-sehie provide a useful service to the community. People living more than 6 hours from the nearest health facility were also significantly less likely than people residing within 2 hours from the nearest health facility to report that the availability of health services has improved a lot compared to three years ago.

56
Table 6.1: Perceptions of health services by household characteristics
Total
Wealth status Reported travel time to nearest facility by
usual mode of transportation 1st
Quint. 2nd
Quint. 3rd
Quint. 4th
Quint. 5th
Quint. <2 hrs 2 - 3 hrs
3 - 4 hrs
4 - 6 hrs
6+ hrs
Perceptions of CHWs: “The CHWs provide a useful service to the community.” n=2013 n=410 n=453 n=405 n=350 n=348 n=1407 n=276 n=136 n=103 n=22 Strongly Disagree 1.8 3.0 1.5 1.2 3.0 0.7 1.9 0.0 7.2 0.0 1.9 Somewhat Disagree 9.9 12.2 11.6 7.4 8.7 9.3 10.4 7.9 4.9 15.6 3.1 Somewhat Agree 57 57.4 62.8 61.3 52.4 48.4 58.6 51.2 66.3 37.7 60.3 Strongly Agree 31.2 27.5 24.1 30.1 35.9 41.6 29.3 39.1 28.8 39.6 36.6 Perceptions of nearest health facility: “The health facility provides a useful service to the community.” n=8183 n=2028 n=1758 n=1395 n=1332 n=1456 n=4736 n=1399 n=579 n=558 n=474 Strongly Disagree 14 24.9 14.9 9.9 7.6 7.2 6.4 16.7 20.3 19.3 43.7 Somewhat Disagree 11.8 13.5 10.1 14.9 11.7 8.6 11.8 12.3 9.5 17.9 8.6 Somewhat Agree 52.4 43.9 56.9 54.6 54.3 54.7 57.8 48.0 52.8 43.1 36.0 Strongly Agree 21.9 17.8 18.1 20.7 26.3 29.5 24.0 22.9 17.3 19.6 11.6 Perceptions of shura-e-sehie: “The shura-e-sehie provides a useful service to the community.” n=1478 n=250 n=367 n=306 n=243 n=270 n=1126 n=166 n=57.5 n=50 n=33 Strongly Disagree 1.6 2.9 2.3 1.4 1.2 0.3 0.3 9.7 2.9 0.0 6.9 Somewhat Disagree 6.7 6.6 8.4 6.3 6.3 5.9 6.6 7.4 0.5 9.7 9.9 Somewhat Agree 57 64.2 59.7 59.5 51.2 48.0 59.1 45.8 60.6 37.3 66.4 Strongly Agree 33.5 25.1 29.6 31.7 39.3 43.6 32.5 37.1 33.5 53.0 16.8 Don't know 1.2 1.3 0.0 1.0 2.0 2.2 1.4 0.0 2.5 0.0 0.0 Perceptions of availability of health services: “Would you say that availability of health services is a lot worse, somewhat worse, the same, somewhat improved or a lot improved compared to 3 years ago?”
n=8080 n=2032 n=1777 n=1409 n=1339 n=1460 n=4760 n=1411 n=581 n=561 n=476
A lot worse 3.5 3.9 2.4 2.7 2.4 3.5 1.7 5.0 8.0 6.8 7.9 Somewhat worse 5.9 6.2 7.0 5.4 5.2 5.3 5.9 5.6 5.8 7.2 7.4 About the same 31.8 29.6 35.6 35.8 30.8 27.5 32.9 33.7 35.9 34.2 21.1 Somewhat improved 36.8 32.1 34.3 36.8 41.6 41.9 39.7 37.0 34.8 29.0 29.7 A lot improved 7.4 4.3 4.8 8.0 9.0 12.8 9.7 5.9 2.6 2.4 2.7 Don’t know 14.7 22.7 14.5 11.8 10.7 10.0 10.1 12.7 12.8 20.5 31.3

57
ILLNESS AND INJURY EPISODES IN THE PAST THIRTY DAYS
A respondent in each household was asked to list each member of the household and whether each one had experienced an illness or injury in the 30 days preceding the survey. If a household member was reported to have experienced an illness or injury, detailed information was collected on the type of illness or injury, whether health care was sought outside the house, what type of provider was seen, how many times providers were seen and how much money was spent on treatment related costs as well as auxiliary costs such as transportation and food and lodging. Each respondent was further asked the source of the money that was used to pay the expenses associated with that illness or injury. All the information on illnesses, care-seeking and expenditures are self-reported. The sections below provide information on the types of illnesses and injuries reported, care-seeking practices and related expenditures. This information is disaggregated by age, sex, household wealth status and travel time to the nearest health facility. Of the 56,500 household members in the sample, 15% (8475 individuals) were reported to have been unable to perform normal activities because of an injury or illness in the 30 days preceding the survey date (Results in Table 6.2). Children under-five were significantly more likely to have been sick or injured than people over five years of age. Significantly more females were sick or injured compared to males. A significantly higher percentage of people from households in the poorest quintiles were sick in the last 30 days compared to people from households in the wealthiest quintile. People living more than 6 hours from the nearest health facility were significantly more likely to be sick or injured compared to people living within 2 hours from the nearest health facility.
The four most prevalent complaints cited were diarrhea/intestinal problems (18.5%), fever (13.9%), respiratory illness (12.0%) and gastritis (11.9%). These four ailments totaled to over 55% of all cited complaints. The main illness reported for under-five children was diarrhea (46%), followed by fever (22.2%) and respiratory problems (12.8%). The most cited complaints for individuals over age five were gastritis (15.7%), respiratory problems (11.7%) and fever (10.9%). Comparing reported complaints from households in the poorest quintile to those in the wealthiest quintile, significantly more individuals from the poorest quintile were reported to have diarrhea and significantly more individuals from the wealthiest quintile were reported to have fever.

58
Table 6.2: Distribution of reported illnesses and injuries in the last 30 days by age, sex and wealth status
Total
Age Sex Wealth status Reported travel time to nearest facility
by usual mode of transportation
< 5 years
≥ 5 years Male Female
1st Quint.
2nd Quint.
3rd Quint.
4th Quint
. 5th
Quint. <2 hrs
2 - 3 hrs
3 - 4 hrs
4 - 6 hrs
6+ hrs
Illness in last 30 days
n= 56500
n= 7820
n= 48676
n= 29092
n= 27406
n= 13033
n= 12189
n= 10104
n= 11178
n= 9516
n= 34358
n= 9320
n= 3873
n= 3585
n= 3237
No 85.0 71.8 87.1 87.6 82.2 82.1 85.0 85.6 86.2 86.8 85.7 84.4 83.7 83.9 81.8 Yes 15.0 28.2 12.9 12.4 17.8 17.9 15.1 14.4 13.9 13.2 14.3 15.6 16.3 16.1 18.2
Type of complaint n= 8492
n= 2203
n= 6274
n= 3611
n= 4866
n= 2325
n= 1830
n= 1456
n= 1318
n= 1474
n= 4917
n= 1455
n= 628
n= 576
n= 583
Temporary Injury 1.5 0.6 1.9 2.1 1.1 0.7 1.5 1.6 2.5 2.2 2.0 1.1 0.8 0.6 0.8 Mental Illness 2.9 0.4 3.8 2.7 3.1 2.4 2.4 3.6 2.5 4.0 3.2 2.5 3.6 2.0 2.6 Respiratory Problems 12.0 12.8 11.7 13.2 11.1 13.1 13.2 12.3 8.7 10.9 10.0 12.3 15.8 16.0 19.2
Heart Problem 4.3 0.6 5.7 3.3 5.1 3.1 3.9 4.9 5.3 5.3 4.5 5.1 4.6 3.1 2.0 Fever 13.9 22.2 10.9 15.1 12.9 10.3 11.8 14.0 18.5 18.1 16.9 10.3 8.8 8.2 9.2 Intestinal Problem or Diarrhea 18.5 46.5 8.7 22.7 15.4 22.6 18.9 16.1 16.9 15.3 16.8 19.6 20.2 21.2 22.7
ENT Problems 6.8 6.4 7.0 7.7 6.1 5.9 6.4 7.9 6.2 8.2 6.6 6.4 7.4 9.2 5.8 Permanent Disability 2.6 0.7 3.2 3.1 2.1 2.3 2.9 2.9 2.6 2.4 2.4 2.9 3.7 3.7 1.8
Skin Problems 2.9 1.9 3.3 2.7 3.1 2.8 3.7 2.7 2.6 2.6 2.9 2.8 3.1 2.8 2.2 UTI 3.7 1.5 4.5 3.8 3.6 4.5 4.3 3.1 3.3 2.4 3.4 3.7 2.9 4.6 5.7 Gastritis 11.9 1.0 15.7 9.5 13.6 13.9 11.5 11.3 11.4 9.9 11.9 11.5 12.9 13.2 10.7 Anemia 2.7 0.9 3.3 1.9 3.3 2.1 2.9 2.9 3.6 2.3 3.0 3.2 2.2 0.9 1.2 Headaches 7.0 1.6 8.9 5.2 8.3 7.5 7.3 7.1 5.9 6.5 7.2 8.6 5.1 5.7 4.7 Problems during Pregnancy 2.1 0.0 2.9 0.0 3.7 2.1 1.8 2.1 2.4 2.4 2.1 2.5 3.1 2.0 1.1
Malaria 1.8 1.2 2.0 2.0 1.5 1.1 1.2 2.1 2.4 2.5 1.7 2.9 1.4 0.5 0.9 Pain in back and body 1.7 0.1 2.2 1.4 1.9 1.8 2.2 1.4 2.2 0.8 1.3 2.0 1.8 2.4 3.4
Other 3.8 1.6 4.6 3.5 4.1 3.8 4.2 3.9 3.0 4.0 4.0 2.8 2.6 3.7 6.0 **Missing and don't know responses excluded from analysis, in this and subsequent tables except where noted

59
CARE-SEEKING BEHAVIOR Treatment Seeking outside the Home Table 6.3 below presents results on treatment seeking outside the home and reasons for not seeking care when ill. Among those who were reported to have been sick in the 30 days preceding the survey, 75.9% sought care outside the home. While more females than males were reported to have been sick in the 30 days preceding the survey, there are no significant differences in care-seeking outside the homes between male and female individuals who were reported to have been sick. There are no significant differences between people under five and people five years of age or older in seeking treatment outside the home. Wealth status is significantly associated with treatment seeking outside the home, with 88.1% of sick persons from the wealthiest quintile seeking care when ill compared to 65.0% of sick persons from the poorest quintile. Reported travel time to the health facility is also significantly associated with seeking care outside the home, with 84.1% of sick persons from households living within 2 hours of a health facility seeking care when ill compared to only 47% of sick persons from households living 6 or more hours from the health facility. Reasons for not Seeking Care
Reasons cited by households for not seeking care are presented in Table 6.3 below. The three primary reasons for not seeking care are illness or disability not severe enough (27.5%), facility too far (26.9%) and cannot afford the cost of treatment (23.5%). The illness or disability not being severe enough was cited as the primary reason for not seeking care for a significantly greater proportion of people in the under-five group compared to the five-and-over group. The inability to pay for transportation costs was cited as the primary reason for not seeking care for a significantly greater proportion of people in the five-and-over group compared to the under-five group.
The reasons cited for not seeking care do not differ significantly between males and females, but they do differ significantly between poor households and wealthier households. A significantly higher proportion of individuals in the wealthiest quintile cited illness/disability not severe enough to seek care outside the home as the primary reason for not seeking care outside the home compared to households in the poorest quintile (69.1% vs. 12.9%). The absolute number of individuals reported to not seek care because the illness or disability was not severe are, however, quite similar. One hundred five individuals in the poorest quintile (12.9% of 811 individuals) did not seek care because the illness of disability was not severe, compared to 116 individuals in the wealthiest quintile (69.1% of 169 individuals). This indicates that a similar number of individuals in poor and wealthier households did not seek care due to the illness or disability not being severe, while much larger numbers of individuals from poor households are not seeking care due to other reasons, including the facility being too far and not being able to afford the cost of transportation or treatment.

60
The association between travel time to the nearest health facility and reasons for not seeking care is similar to that between household wealth status and reasons for not seeking care. Households living within 2 hours of the nearest health facility were significantly more likely to cite illness or disability not being severe enough as the primary reason for not seeking care compared to households living 6 or more hours from a health facility. Compared to households that are closer to a health facility, a significantly higher proportion of households living more than 6 hours from a health facility cited distance as the reason for not seeking care. These results show that poorer households and households living far away from a health facility are less likely to seek care when they are ill compared to relatively better off households and those that live closer to facilities. Poor and remote households are also more likely to cite as reasons for not seeking care the distance to the facility, the cost of transportation and the cost of treatment. These results indicate that cost and distance remain serious barriers to seeking care among poor households and remote communities.

61
Table 6.3: Care-seeking behavior, by age, sex and wealth status
Total
Age Sex Wealth status Reported travel time to nearest facility by
usual mode of transportation
< 5 years
≥ 5 years Male Female
1st Quint.
2nd Quint.
3rd Quint.
4th Quint.
5th Quint
. <2 hrs
2 - 3 hrs
3 - 4 hrs
4 - 6 hrs
6+ hrs
Treatment sought outside home
n= 8488
n= 2207
n= 6281
n= 3612
n= 4876
n= 2331
n= 1833
n= 1457
n= 1318
n= 1476
n= 4921
n= 1453
n= 630
n= 576
n= 590
No 24.1 25.3 23.7 24.9 23.5 35.0 28.5 19.2 17.0 11.9 15.9 24.2 34.8 40.2 53.0 Yes 75.9 74.7 76.3 75.1 76.5 65.0 71.5 80.8 83.0 88.1 84.1 75.8 65.2 59.8 47.0 Primary reason for not seeking care
n= 1995
n= 542
n= 1453
n= 877
n= 1118
n= 811
n= 505
n= 268
n= 216
n= 169
n= 761
n= 341
n= 217
n= 232
n= 309
Illness or Disability not severe
27.5 34.6 24.9 28.6 26.7 12.9 21.2 40.0 48.0 69.1 47.1 26.9 13.0 7.5 9.9
Lack of transport 5.9 7.1 5.5 6.3 5.7 8.3 3.4 4.5 4.5 6.7 4.9 5.1 9.0 7.3 6.2 Cannot afford cost of transport 11.1 8.0 12.2 9.6 12.3 13.4 15.8 6.0 5.0 3.7 11.9 16.8 12.7 8.2 6.2
Cannot afford cost of treatment 23.5 21.0 24.5 23.8 23.3 28.7 25.2 17.4 23.4 7.2 25.2 25.0 23.2 16.7 20.0
Quality of services is low 2.6 1.0 3.2 2.9 2.4 2.6 3.0 1.0 2.8 4.5 2.7 3.5 1.6 6.4 0.4
No Drugs Available 1.4 2.6 1.0 0.8 1.9 1.0 1.7 3.5 0.0 0.8 2.2 1.1 0.0 0.0 2.3
Facility too far 26.9 24.2 28.0 27.5 26.5 32.3 29.2 26.7 15.0 5.4 4.6 20.2 40.6 53.0 54.7 Afraid to travel due to security concerns
0.5 0.6 0.4 0.5 0.5 0.3 0.2 0.7 1.4 0.7 0.7 0.2 0.0 0.9 0.0
Others 0.5 1.0 0.4 0.3 0.8 0.7 0.3 0.2 0.0 1.9 0.6 1.2 0.0 0.0 0.4

62
Provider Preferences Table 6.4 below presents care-seeking by type of provider for the first, second and
third provider sought. Almost 80% of those seeking care sought care from only one provider. The remaining 20% had two or three following visits with the same or another provider. For the first provider sought, almost 55% went to a private provider (private doctor/clinic, private pharmacy with or without doctor), 43.7% went to a public provider (CHW, public health clinic or district or provincial hospital) and less than 2% went to traditional healers or sought care from other sources.
Care-seeking patterns are somewhat different for the second and third providers
seen. Figure 6.1 displays the types of providers seen for each subsequent visit. The proportion of people seeking care from public providers (CHW, public health clinic and district and provincial hospital) decreases from 43.7% for the first provider to 27% for the third provider. The use of private providers is mostly invariant around the 50% mark for the first, second and third providers sought. There is a large change in the use of traditional providers from the first provider to the third provider. Only 1.5% of people reported seeing traditional providers as their first provider, but this increases to 12.2% and 22.3% for the second and third providers, respectively.
Table 6.4: Types of providers sought for first, second and third visits
Total CHW Public health clinic
District or
provincial hospital
Private doctor or
clinic
Private pharmacy
with doctor
Private pharmacy without doctor
Traditional healers* Other
1st provider sought n=6388 3.1 24.8 15.9 38.9 3.8 12.0 1.4 0.2
2nd provider sought n=1290 1.5 16.8 13.2 34.3 16.6 5.1 12.2 0.4
3rd provider sought n=454 0.7 17.0 9.4 24.6 20.4 5.5 22.3 0.2
*Traditional healers include unani, ziarat, mullah, elderly woman in village and dais

63
Figure 6.1: Types of Providers sought for first, second and third visits
0
10
20
30
40
50
60
1st provider 2nd provider 3rd provider
Perc
ent (
%)
Traditional Healers Private Practitioners Public providers
Tables 6.5 to 6.7 present provider preference by age, sex, wealth status and travel time to the nearest health facility for the first, second and third providers, respectively. As shown in Table 6.5, there are significant differences in the types of providers sought by patient age, with children under five more likely to go to a public health clinic and older individuals more likely to go to a private doctor or clinic. There are no significant differences between males and females in the utilization of the different providers. Patients from the poorest quintile were significantly more likely to use district or provincial hospitals compared to patients from the wealthiest quintile. A significantly higher proportion of wealthier households used private pharmacies with doctors compared to poorer households. Households living 6 or more hours from a health facility were significantly more likely to use a private pharmacy without a doctor compared to households living within two hours of a health facility. There were no other significant differences in the types of providers from whom care was sought for a first visit for an illness episode.

64
Table 6.5: Care-seeking behavior and provider preferences for the first provider
Total
Age Sex Wealth status Reported travel time to nearest facility
by usual mode of transportation < 5 years
≥ 5 years Male Female
1st Quint.
2nd Quint.
3rd Quint.
4th Quint.
5th Quint.
<2 hrs
2 - 3 hrs
3 - 4 hrs
4 - 6 hrs
6+ hrs
Type of 1st Provider (%)
n= 6388
n= 1634
n= 4754
n= 2688
n= 3700
n= 1498
n= 1301
n= 1168
n= 1088
n= 1288
n= 4112
n= 1086
n= 403
n= 341
n= 274
CHW 3.1 4.2 2.7 2.9 3.2 2.1 3.7 5.1 2.7 2.3 3.7 2.1 1.6 1.4 1.8
Public Health Clinic 24.8 29.2 23.2 24.5 24.9 30.1 23.5 21.3 25.4 22.5 25.5 22.8 24 34.4 18.3
DH or Provincial Hospital 15.9 13.2 16.8 15.8 15.9 19.2 19.5 13.6 12.7 12.8 15.5 19.4 15.1 15.5 14.3
Private doctor/clinic 38.9 35.6 40 38 39.5 34.3 36.5 41.9 40.8 42 39.5 37.6 46 33.6 35.2
Private pharmacy w/o doctor 3.8 5.8 3.1 4.4 3.4 6.3 4.2 2.1 2.3 3.3 2.1 1.6 3.3 8.2 20.5
Private pharmacy w/ doctor 12 10.8 12.5 12.3 11.8 6.6 11.2 14.5 14.3 15.3 12.3 14.5 8.9 5.2 7.6
Traditional Healers 1.4 1.1 1.4 1.7 1.1 1.2 1.1 1.4 1.5 1.2 1.1 1.7 1.1 1.7 2.4
Other 0.2 0.1 0.3 0.3 0.2 0.0 0.1 0.2 0.3 0.6 0.3 0.3 0.0 0.0 0.0

65
Table 6.6: Care-seeking behavior and provider preferences for the second provider
Type of 2nd Provider (%)
Total
Age Sex Wealth status Reported travel time to nearest facility by
usual mode of transportation < 5 yrs
≥ 5 yrs Male Female
1st Quint.
2nd Quint.
3rd Quint.
4th Quint.
5th Quint.
<2 hrs
2 - 3 hrs
3 - 4 hrs
4 - 6 hrs
6+ hrs
n=1290 n=313 n= 977
n= 542
n= 749
n= 342
n= 232
n= 217
n= 245 n=248 n=
807 n= 258
n= 70
n= 82
n= 41
CHW 1.5 1.4 1.5 1.1 1.8 0.0 2.2 1.7 2.0 2.3 2.1 0.0 3.3 0.0 0.0
Public Health Clinic 16.8 19.9 15.8 15.5 17.7 33.5 16.0 8.5 5.9 12.5 10.8 28.4 31.8 33.6 12.7
DH or Provincial Hospital 13.2 6.9 15.2 13.1 13.2 16.0 13.9 13.7 11.7 9.8 13.1 16.8 8.3 12.1 2.8
Private doctor/clinic 34.3 36.8 33.5 34.1 34.5 24.8 34.1 37.5 38.2 42.0 39.3 31.3 23.2 20.3 7.9
Private pharmacy w/o doctor 5.1 8.0 4.2 5.7 4.7 6.1 10.4 4.4 1.2 2.8 4.6 1.0 5.0 9.1 23.0
Private pharmacy w/ doctor 16.6 12.6 17.8 17.6 15.8 10.7 12.0 20.4 28.3 14.4 17.6 11.7 14.3 11.8 35.2
Traditional Healers 12.2 14.4 11.5 12.4 12.1 9.0 10.9 13.0 12.0 16.2 12.0 10.6 14.1 13.1 18.5
Other 0.4 0.0 0.5 0.6 0.2 0.0 0.4 0.9 0.7 0.0 0.5 0.4 0.0 0.0 0.0

66
Table 6.7: Care-seeking behavior and provider preferences for the third provider
Type of 3rd Provider (%)
Total
Age Sex Wealth status Reported travel time to nearest facility by
usual mode of transportation
< 5 yrs ≥ 5 yrs Male Female 1st
Quint. 2nd
Quint. 3rd
Quint. 4th
Quint. 5th
Quint. <2 hrs
2 - 3 hrs
3 - 4 hrs
4 - 6 hrs
6+ hrs
n= 454 n=97 n=358 n=188 n=266 n=139 n=76 n=83 n=73 n=83 n=26
8 n=96 n=24 n=35 n=23
CHW 0.7 0.0 0.8 1.0 0.4 0.0 0.0 2.2 0.0 1.4 1.1 0.0 0.0 0.0 0.0
Public Health Clinic 17.0 20.5 16.1 15.7 18.0 32.2 14.1 7.9 6.5 12.8 10.6 29.1 33.4 35.8 1.3
DH or Provincial Hospital
9.4 8.1 9.7 7.0 11.0 16.6 6.6 4.6 8.0 5.9 9.4 12.6 21.7 0.0 0.0
Private doctor/clinic 24.6 26.2 24.2 27.0 23.0 20.6 23.3 32.2 19.4 30.0 29.5 24.4 17.3 7.1 8.2
Private pharmacy w/o doctor
5.5 9.8 4.3 6.2 4.9 7.3 14.5 4.2 0.4 0.0 5.3 0.0 4.7 4.1 29.7
Private pharmacy w/ doctor
20.4 17.0 21.3 21.3 19.7 6.6 20.8 21.7 47.2 18.5 19.7 21.0 14.5 25.6 24.7
Traditional Healers 22.3 18.4 23.4 21.8 22.7 16.7 20.8 27.2 17.5 31.5 24.2 13.0 8.4 27.5 36.1
Other 0.2 0.0 0.2 0.0 0.3 0.0 0.0 0.0 0.9 0.0 0.3 0.0 0.0 0.0 0.0

67
While there were no significant differences between under-fives and over-fives in the utilization of private pharmacies with doctors as the first provider, over-five patients were significantly more likely to use private pharmacies with doctors as their second and third providers compared to under-five patients. There were no significant differences between households in the poorest quintile and the wealthiest quintile in the utilization of public health clinics or traditional healers.
Distance, cost, severity of illness and levels of satisfaction with different types of health services may all play a role in explaining why the proportion of people using pharmacies and traditional healers increases from the first provider to the second and third. Households living more than 6 hours from a clinic may seek care at pharmacies and traditional healers for their second and third visits because their illness, while not completely cured, may not warrant a return trip to the health facility. Or, conversely, being dissatisfied with the care provided by the first provider, they may seek care from traditional healers for subsequent visits.
The high level of reported utilization of private sector services shows that the
private health sector is large in Afghanistan. Even poor households and those living in remote communities commonly use private sector services for curative care.
HEALTH EXPENDITURES Out of Pocket Expenditures
For each household member that was sick in the 30 days preceding the survey and sought care outside the house, information was collected on payments made for different purposes related to the care seeking episode. Patients were asked to give a breakdown of payments made for registration, consultation, tests (including labs and x-rays), drugs and supplies, transportation, and food and lodging. Then they were asked to give the total amount spent. If the total expenditures cited did not tally with the summed total of the individual expenditures, the respondents were asked to clarify and possibly correct the discrepancy.
Median amounts spent on each category were calculated. These estimates are
presented in Table 6.8. Almost 99% of the persons who sought care outside the home spent some money out of pocket to seek care and the median spent in total was 500 Afghanis7 per illness episode. The estimates presented here include people who sought care from multiple providers. The median amounts spent for consultation, food and lodging and tests was 100 Afghanis each. The median amount spent for drugs was 300 Afghanis, for registration 7 Afghanis and transportation 140 Afghanis. Table 6.8 shows further breakdowns of amounts spent for seeking care.
7 At the time of data collection, 50 Afghani were equal to approximately 1 US dollar.

68
A significantly higher percentage of under-fives paid a registration fee compared to over-fives (39.0% vs. 32.4%).8 There were no significant differences in the percentage of patients paying something for registration by patient sex, wealth status or travel time to the facility. A significantly higher percentage of over-fives spent money out of pocket for consultation compared to under-fives (62.9% vs. 53.9%). Also, a significantly higher percentage of patients from households in the wealthiest quintile paid consultation fees (66.3%) compared to patients from households in the poorest quintile (53.1%).
A sub-analysis was conducted of households only seeking care at public health facilities (clinics and hospitals). Median consultation fees paid at public health facilities by households in the poorest quintile were 20 Afghanis compared to 60 Afghanis paid by households in the wealthiest quintile. This indicates that exemption mechanisms set in place to protect the poor are likely effective to some degree, although poor patients are still paying for services.
There were no significant differences in the proportion of patients making different types of expenditures by patient sex or their reported travel time to the health facility. Over-fives were significantly more likely to pay for tests compared to under-fives (30.1% vs. 16.4%). Patients from the wealthiest quintile were significantly more likely to pay for tests compared to patients in the poorest quintile (30.1% vs. 18.9%). A higher proportion of patients living closer to a health facility paid for tests compared to patients living farther away from a health facility (29.3% vs. 19.7%). A significantly higher proportion of over-fives paid for drugs compared to under-fives (89.3% vs. 84.7%), and a significantly higher proportion of patients from wealthier households paid for drugs compared to patients from poorer households (90.9% vs. 80.7%). While a significantly higher proportion of patients living within 2 hours of a health facility paid for drugs compared to patients living between 4 and 6 hours from a health facility (90.3% vs. 78.9%), the group of patients living more than 6 hours from a health facility were a bit of an anomaly: a similar proportion of these patients paid for drugs compared to patients living within 2 hours of a health facility.
Patients over five were significantly more likely to pay for transportation
compared to under-fives (56.1% vs. 41.1%). A significantly higher proportion of wealthier households paid for transportation compared to poorer households (54.6% vs. 41.8%). This result can be largely explained by the fact that poor households are more likely to walk to the health facility compared to wealthier households. A significantly higher proportion of households living within 2 hours of a health facility paid for transportation compared to households living 6 hours or more from a health facility (54.1% vs. 39.1%). This result is also a bit of an anomaly. One caveat to keep in mind while interpreting this result is that the definition of travel time used in the analyses here is based on a household’s reported travel time using their routine mode of transportation. This result can, then, be explained by the fact that households living 6 or more hours from a health facility are more likely to walk rather than drive to the health facility and thus would not be paying for transportation.
8 Comparisons are being made between reported payments made for the different services. It is not possible to determine if the respondent actually received the service.

69
A significantly higher proportion of over-fives paid for food and lodging compared to under-fives (27.6% vs. 19.6%). A significantly higher proportion of patients from the poorest quintile paid for food and lodging compared to patients from the wealthiest quintile (31.8% vs. 17.7%). Again, this finding is not unusual: if patients from poorer households have to spend more time traveling to a health facility, they are more likely to pay for food or lodging as part of their treatment seeking. This reasoning is supported by the results showing that patients living within 2 hours of a health facility are significantly less likely to pay for food and lodging compared to patients living 6 hours or more from a health facility (23% vs. 34%). Median expenditures were also calculated for each background characteristic. Under-fives had lower expenditures compared to over-fives (310 vs. 580 Afghanis). There were no differences between male and female patients with regard to amounts paid when seeking care. The median expenditures by wealth status showed that patients in the poorest quintile had higher expenditures compared to patients in the wealthiest quintile (500 vs. 420 Afghanis). This may indicate that the poor wait until their illness is severe before seeking care. A more severe illness is likely to cost more to treat. Poorer patients have higher median expenditures for drugs and tests than patients from wealthier households. Median expenditures for registration and consultation were lower for poorer households compared to wealthier households. These differences may indicate that exemption mechanisms or sliding rates offer some level of protection for poor households. Households having longer travel times to the facility had slightly higher median expenditures compared to households traveling less than 2 hours to a health facility (500 vs. 477 Afghanis).
Out-of-Pocket Expenditures by Provider Type
Out-of-pocket expenditures by provider type were also examined. Since expenditure data were collected for all care seeking associated with one illness episode in the past 30 days, it is not possible to disaggregate expenditure levels for each provider visit. Median expenditure levels are thus compared between provider types for patients who saw only one provider.
The percentage of people paying anything for care varies by type of provider. The highest proportion paying for registration is at a public health clinic (64.6%), but the percentage paying anything for consultation is low at a public health (24%). In contrast, 88.7% of patients paid for consultation when going to a private doctor or clinic. The percentage of patients paying for tests was highest for private doctors and clinics at 32.4%. The percentage of people that paid anything for the other services is also the highest at private doctors and clinics. The proportion paying for drugs and supplies at private doctors and clinics is 96.8%; 66.6% paid for transportation and 29.6% paid for food and lodging.
The total median expenditure level in a public health clinic was 150 Afghanis, compared to 500 Afghanis at a district or provincial hospital and 600 Afghanis at a private doctor or clinic. While public health clinics are still the least expensive option, a higher percentage of people even in the poorest quintile seek care first from a private doctor or clinic compared to a public health clinic (34.3% vs. 30.1%) (results shown in Table 6.9).

70
Table 6.8: Out-of-pocket health expenditures, by age, sex, wealth quintile and travel time to facility
Indicators*
Total
Age Sex Wealth Status
Reported travel time to nearest facility by usual mode of
transportation < 5 years
≥ 5 years Male Female
1st Quint.
2nd Quint.
3rd Quint.
4th Quint.
5th Quint.
<2 hrs
2 - 3 hrs
3 - 4 hrs
4 - 6 hrs
6+ hrs
Number sought treatment**
n= 6444
n= 1649
n= 4794
n= 2713
n= 3731
n= 1515
n= 1311
n= 1177
n= 1094
n= 1300
n= 4137
n= 1101
n= 411
n= 345
n= 277
Amount paid as registration fees
% Paying anything
* 34.1 39.0 32.4 34.7 33.7 37.5 32.1 30.2 37.3 32.6 35.8 33.9 39.2 31.7 18.9
Median 7 6 9.5 10 7 7 10 5 5 10 6 10 10 5 10 Amount paid as consultation fees
% Paying anything 60.7 53.9 62.9 59.3 61.6 53.1 64.7 64.2 56.6 66.3 62.9 57.7 57.1 63.1 51.1
Median 100 100 100 100 100 80 100 100 100 100 100 100 100 100 100 Amount paid for tests (lab and X-ray)
% Paying anything 26.6 16.4 30.1 25.7 27.3 18.9 26.3 24.7 36.3 30.4 29.3 26.5 14.3 21.8 19.7
Median 100 80 150 100 100 150 125 120 100 100 100 100 140 180 155
Amount paid for drugs and supplies
% Paying anything 88.2 84.7 89.3 87.7 88.6 80.7 87.8 91.9 92.4 90.9 90.3 83.5 83.8 78.9 89.6
Median 300 200 300 300 300 300 320 300 270 250 300 350 300 320 300 Amount paid for transportation
% Paying anything 52.2 41.1 56.1 51.0 53.2 41.8 52.6 56.2 59.6 54.6 54.1 50.7 51.9 48.1 39.4
Median 140 100 150 120 150 200 200 200 120 100 100 200 200 200 200 Amount paid for food and lodging
% Paying anything 25.6 19.6 27.6 26.8 24.6 31.8 29.1 25.9 20.4 17.7 23.0 28.1 29.2 40.3 34.0
Median 100 100 100 100 100 100 100 100 100 100 100 100 200 100 100
Total amount paid
% Paying anything 98.7 98.6 98.7 98.9 98.5 98.8 98.2 99.1 99.1 98.5 99.0 96.9 99.0 98.9 100.0
Median 500 310 580 500 500 500 550 500 500 420 477.5 600 500 500 500 *For the different types of expenditures, respondents that either did not know how much they paid for the service or where the information was missing were excluded from the analysis. **These numbers show the total number of people that sought treatment in each category. Many of them, however, had missing information for the individual expenditure items.

Table 6.9: Out-of-pocket health expenditures, by provider type (among households that only saw one provider)
Total CHW
Public Health Clinic DH or
Private doctor or
clinicTraditional
Healers
Private pharmacy without doctor
Private pharmacy
with doctor Other
Total seeking care at 1 type of provider for one visit
n=5076 n=135 n=1198 N=790 n=2082 n=58 n=193 n=610 n=12
Amount paid as % Paying hi 31.0 38.7 64.6 40.7 12.8 8.8 3.6 14.6 0.0
registration fees anything 31.0 38.7 64.6 40.7 12.8 8.8 3.6 14.6 0.0
Median 6 5 5 10 10 20 270 100 0
Amount paid as consultation fees
% Paying anything 60.1 49.9 24.0 45.2 88.7 39.8 6.8 75.4 87.2
Median 100 50 20 80 100 50 50 100 400Median 100 50 20 80 100 50 50 100 400
Amount paid for tests (lab and X-ray)
% Paying anything 25.4 14.0* 17.4 25.2 32.4 3.8* 1.8 31.4 87.2
Median 100 50 50 150 120 50 50 100 500
Amount paid for drugs % Paying 88 1 88 0 75 2 82 2 96 8 54 8 96 3 95 9 100 0p gand supplies
y ganything 88.1 88.0 75.2 82.2 96.8 54.8 96.3 95.9 100.0
Median 270 130 120 300 300 95 200 300 1500
Amount paid for transportation
% Paying anything 50.3 32.5 29.2 49.8 66.6 32.2 16.5 52.6 43.6
M di 100 110 100 200 100 175 60 100 2400Median 100 110 100 200 100 175 60 100 2400
Amount paid for food and lodging
% Paying anything 24.3 10.8 16.5 32.7 29.6 15.9 5.4 19.4 43.6
Median 100 50 100 100 100 200 50 100 1800
% Paying Total amount paid
% Paying anything 98.4 97.1 97.3 95.5 99.8 93.3 100.0 100.0 100.0
Median 450 200 150 500 600 150 250 500 5000
*May indicate that provider took the patient to health facility or hospital

72
Approximate Estimation of Average Annual Per Capita Expenditures
An approximate estimation of average annual per capita expenditures on health can be made from these data. As described above, the estimated median level of out-of-pocket expenditures associated with seeking care for an illness or injury experienced in the last month is 500 Afghanis (approximately USD 10). Fifteen percent of individuals in the sample experienced an illness or injury in the previous 30 days (Table 6.1), out of which 75.9% sought care outside the home (Table 6.3). Based on these figures, one can estimate the approximate annual per capita median health expenditure to be 683 Afghanis (approximately USD 14). The annual total median health expenditure for a family of 7 members would be 4781 Afghanis (approximately USD 96).
Mean per capita expenditures were also calculated. When six outliers with reported
expenditure levels of 100,000 Afghanis or greater (approximately USD 2000) were excluded from the analysis, the mean per capita health expenditure per episode of illness or injury was 1303 Afghanis (approximately USD 26). With the aforementioned morbidity and care seeking rates, the annual per capita mean expenditures would be 1780 Afghanis (approximately USD 36 dollars). When these six outliers were included in the analysis, the mean expenditure per episode of illness or injury increased to 2536 Afghanis (approximately USD 51), with the annual per capita mean expenditure rising to 3465 Afghanis (approximately USD 69).
Distress Financing
A national catchment-area survey conducted in 2004 by MOPH and JHU/IIHMR collected data on care-seeking behavior and expenditures on health. Distress financing in this report (JHU/IIHMR, 2005) was defined as households spending over and above their regular savings and budget on health care. Using savings or regular household budget to pay for care was considered as “non-distress” while all other forms of borrowing or selling – from friends and family, other people, selling or mortgaging household possessions and land and selling blood were all considered distress financing.
Results for distress financing from the AHS are presented in Table 6.10. Overall 36.2% of the households that sought care for a sick household member in the 30 days preceding the survey incurred distress financing. There were no significant differences in the prevalence of distress financing between under and over-fives or between males and females. However, there were significant differences in prevalence of distress financing by household wealth status and travel time to the nearest health facility. Over 53% of households from the poorest wealth quintile that sought care for an ill or injured individual incurred distress financing compared to 21.2% of households from the wealthiest quintile. Among households that live 6 or more hours from a health facility, 54.6% incurred distress financing compared to 31% among households that live within 2 hours of a health facility.
The sources of money used to pay for care among households incurring distress financing are shown in Figure 6.2. The primary source of money used by those incurring

73
distress financing was borrowing from friends and family (59%), followed by selling household possessions (24%). A report on informal credit practices by the Afghanistan Research and Evaluation Unit (AREU) (Klijn and Pain, 2007) notes that informal credit practices are highly pervasive with households simultaneously being lenders and borrowers of credit. Borrowing of money is typically used for consumption needs and marriage. Borrower-lender relations are variable but they typically occur between people who know each other. There is also transfer or lending of money from wealthy households to poorer households. There are different types of credit, but cost-free loans between relatives, friends, neighbors and colleagues are especially common. Credit that comes with interest typically comes from shopkeepers and wealthier households in the community (Klijn and Pain, 2007).
Repayment of borrowed money, irrespective of whether interest is charged, can lead to financial distress for a household if they have to sell or mortgage land or other possessions to repay the loan. Given the pervasiveness of informal borrowing, the relationship between the sources of distress financing and household wealth status was explored, with Table 6.11 presenting a breakdown of the source of money used to pay for health care when distress financing is incurred. Households in the poorest quintile are more likely to borrow money and less likely to sell household possessions when incurring distress financing, compared to households in the richest quintile.

74
Table 6.10: Financial distress incurred by households seeking care, by age, sex, wealth quintile and travel time to facility
Financial distress among households with sick members*
Total
Age Sex Wealth status Reported travel time to nearest facility
by usual mode of transportation < 5 years
≥ 5 years Male Female
1st Quint.
2nd Quint.
3rd Quint.
4th Quint.
5th Quint.
<2 hrs
2 - 3 hrs
3 - 4 hrs
4 - 6 hrs
6+ hrs
n= 6360
n= 1626
n= 4733 n=2684 n=3676 n=1497 n=1287 n=1167 n=1085 n=1280 n=
4097 n=
1067 n=40
6 n=34
1 n=27
7
Not Distress 62.2 64.4 61.5 62.7 61.9 44.4 60.6 64.1 69.1 77.5 67.8 57.0 53.2 47.6 42.5
Financially Distressed 36.2 34.0 37.0 35.5 36.7 53.4 37.9 35.1 29.9 21.2 31.0 41.0 44.3 50.8 54.6
Did not know 1.6 1.6 1.5 0.8 0.8 2.2 1.6 0.8 1.0 1.3 1.2 1.9 2.5 1.6 3.0
* Financial distress is defined as paying for health care using one of the following sources of money (either primary or secondary source): 1) Selling household possessions; 2) mortgaging or selling land; 3) borrowing money from a friend or relative; 4) borrowing money from someone other than friend or relative; or 5) Selling blood
Figure 6.2: Sources of money used to pay for health care among households incurring distress financing
Borrowed money from someone other than
friend or relative 11%
Selling household possessions
24%
Mortgaging or selling land 6%
Selling Blood 0.14%
Borrowed money from friend or family
59%
Table 6.11: Sources of money used to pay for health care among households incurring distress financing, by household wealth status
Wealth Status 1st
Quintile 2nd
Quintile 3rd
Quintile 4th
Quintile 5th
Quintile Types of distress financing n=800 n=488 n=409 n=324 n=271 Selling household possessions 19.2 26.0 25.5 27.6 35.0 Mortgaging or selling land 7.3 8.6 6.0 4.7 6.9 Borrowed money from a friend or relative 62.5 53.5 55.5 57.7 48.9 Borrowed money from someone other than friend or relative 11.1 11.6 12.9 9.7 9.1 Selling blood 0.0 0.4 0.1 0.3 0.0

75
Table 6.12: “Severe distress financing” incurred by households seeking care, by age, sex, wealth quintile and travel time to facility Financial distress among households with sick members*
Total
Age Sex Wealth status Reported travel time to nearest facility by usual
mode of transportation < 5 years
≥ 5 years Male Female
1st Quint.
2nd Quint.
3rd Quint.
4th Quint.
5th Quint. <2 hrs
2 - 3 hrs
3 - 4 hrs
4 - 6 hrs 6+ hrs
n=6360 n=1626 n=4733 n=2684 n=3676 n=1497 n=1287 n=1167 n=1085 n=1280 n=4097 n=1067 n=406 n=341 n=277
Not “severe distress financing”
86.2 85.3 86.5 85.5 86.7 83.2 84.1 87.6 88.2 89.2 88.3 82.3 81.4 85.8 77.6
“Severe distress financing”
12.3 13.1 12.0 12.7 11.9 14.6 14.3 11.5 10.8 9.5 10.5 15.8 16.2 12.6 19.4
Did not know 1.6 1.6 1.5 1.8 1.4 2.2 1.6 0.8 1.0 1.3 1.2 1.9 2.5 1.6 3.0
* “Severe distress financing” is defined as paying for health care using one of the following sources of money (either primary or secondary source): 1) Selling household possessions; 2) mortgaging or selling land; and 3) selling blood
Table 6.13: Median amount of Afghanis paid for health care by distress financing status, patient age, patient sex, wealth status and travel time to facility
Median Expend.
Age Sex Wealth status Reported travel time to nearest facility by
usual mode of transportation < 5 years
≥ 5 years Male Female
1st Quint.
2nd Quint.
3rd Quint.
4th Quint.
5th Quint.
<2 hrs
2 - 3 hrs
3 - 4 hrs
4 - 6 hrs 6+ hrs
Not “severe distress financing”
500 300 540 450 500 500 510 500 500 400 455 600 450 500 500
“Severe distress financing” 640 400 830 603 650 660 800 740 500 600 600 670 978 700 740
Respondent did not know source of funds
430 300 500 435 430 360 835 280 450 500 500 500 300 140 300

76
Given the pervasive nature of borrowing and lending and the uncertainty regarding how distressful borrowing money is for households, a separate indicator is calculated to measure “severe distress financing.” The definition of “severe distress financing” used here does not include borrowing money. This definition includes only mortgaging or selling land, selling household possessions and selling blood. Results for “severe distress financing” are shown in Table 6.12.
As shown in Table 6.12, households incurred “severe distress financing” in 12.3% cases
of care seeking for an illness or injury. There is no significant association between incurring “severe distress financing” and age and sex of the patient. Wealth and travel time to the facility were both significantly associated with “severe distress financing.” Households in the poorest quintile were significantly more likely to incur “severe distress financing” compared to households in the wealthiest quintile (14.6% vs. 9.5%). Households living 6 or more hours from a health facility were significantly more likely to incur distress financing compared to households living within 2 hours of a health facility (19.4% vs. 10.5%). The sources of money used to pay for care among households incurring “severe distress financing” are presented in Figure 6.2. Among those incurring “severe distress financing,” 77% sold household possessions.
Figure 6.3: Sources of money for households incurring “severe distress financing”
Mortgaging or selling land, 23% Selling Blood, 0.4%
Selling household possessions, 77%
Table 6.13 shows that median expenditures among households who experienced “severe distress financing” are higher than median expenditures among other households. There is also some evidence that poorer households have higher median expenditures when incurring “severe distress financing” compared to wealthier households. Households that live within 2 hours of a health facility have lower median expenditures when incurring “severe distress financing” compared to households that have longer travel times to the health facility.

77
Table 6.14: Distribution of types of “severe distress financing” by wealth status Types of “severe distress financing”
Wealth Status 1st
Quintile 2nd
Quintile 3rd
Quintile 4th
Quintile 5th
Quintile n=218 n=184 n=135 n=117 n=122
Selling household possessions 70.8 75.0 79.4 82.4 82.8 Mortgaging or selling land 29.2 24.0 20.4 16.8 17.2 Selling Blood 0.0 1.0 0.2 0.9 0.0
Table 6.14 presents a breakdown of the types of “severe distress financing” by household wealth status. The differences in the types of "severe distress financing" by wealth quintile are not statistically significant.
CONCLUSION Care-seeking practices by sick household members show that while the poor experience illness or injury with greater frequency compared to the non-poor, they are less likely to seek care whey they are ill or injured. For the poor, distance to the facility and cost of treatment are major barriers to receiving care. While the cost of transportation is a much greater barrier to care for the poor compared to the non-poor, there is evidence that the cost of transportation is also a barrier for some households that have relatively higher wealth status. A higher percentage of people in the poorest wealth quintile use public health clinics when ill compared to those in the wealthiest quintile; a higher proportion of the latter seek care from private providers. Though a higher percentage of poor use public health clinics compared to the wealthy, a relatively high percentage of the poor still see a private provider as their first point of care, in spite of the higher cost of private sector services compared to public sector services. Further enquiry is needed to understand for profit private sector health services in Afghanistan and the reasons that people seek care from different types of providers.

78
REFERENCES Becker, S, Mahmud, S. A Validation study of backward and forward pregnancy histories in Matlab, Bangladesh. World Fertility Survey Scientific Report Series No. 52, October 1984. Central Statistics Office. Settled Population by Civil Division (Urban and Rural ) and Sex 2006. Kabul, Afghanistan, 2006. Chanazarian A. Determinants of Sex Ratio at Birth: Review of Recent Literature. Social Biology 1986; 35(3-4): 214-235. Espeut, Donna. A Validation of Birth and Pregnancy Histories in Matlab, Bangladesh. Johns Hopkins University Doctoral Dissertation, 2002. Unpublished. Johns Hopkins Bloomberg School of Public Health & Indian Institute of Health Management Research. Afghanistan Multiple Indicator Cluster Survey 2003: A Re-analysis of Critical Health Service Delivery Indicators, Report to the Afghanistan Ministry of Public Health, 2005. Johns Hopkins Bloomberg School of Public Health & Indian Institute of Health Management Research. 2005 National Risk and Vulnerability Assessment. Analysis of Priority Health Service Delivery Indicators. Kabul, Afghanistan: Report to the Ministry of Public Health of the Islamic Republic of Afghanistan, 2006 (Draft). Klijn, F, Pain, A. Finding the Money: Informal Credit Practices in Rural Afghanistan. Synthesis Paper Series. Kabul, Afghanistan: Afghanistan Research and Evaluation Unit, 2007. Lehtonen R, Pahkinen EJ. Practical Methods for Design and Analysis of Complex Surveys. 1995. John Wiley and Sons. ORC Macro. Model “B” Questionnaire with Commentary for Low Contraceptive Prevalence Countries. MEASURE DHS+ Basic Documentation No. 2. Calverton, Maryland, U.S.A.: ORC Macro, 2001. Stata Corp. Stata Statistical Package: Release 9. College Station, TX: Stata Corp LP, 2005. Turner AG, Magnani RJ and Shuaib M. A Not Quite as Quick but Much Cleaner Alternative to the Expanded Programme on Immunization (EPI) Cluster Survey Design. International Journal of Epidemiology 1996; 25(1): 198-203. UNICEF. Best Estimates of Social Indicators for Children in Afghanistan. Kabul, Afghanistan. May 2006. UNICEF. State of the World’s Children 2003. New York, NY: UNICEF, 2003.

79
UNICEF and Centers for Disease Control and Prevention. Summary Report of the National Nutrition Survey, Afghanistan, 2004. Kabul, Afghanistan: Report to the Ministry of Public Health of the Islamic Republic of Afghanistan, 2005 UNICEF and Central Statistics Office. Multiple Indicator Cluster 2003: Data Collection Form. Kabul, Afghanistan. 2003. United Nations. Manual X: Indirect Techniques of Demographic Estimation. Population Studies No. 81. New York, NY: Department of International Economic and Social Affairs, 1983. United Nations. QFIVE: United Nations Program for Child Mortality Estimation. Population Studies No. 107. New York, NY: Department of International Economic and Social Affairs, 1990. U.S. Census Bureau. CSPro Version 3.0. Washington, DC: International Programs Center, 2006. Woodruff BA, Reynolds M, Tchibindat F, Ahimana C. Summary of Nutrition and Health Survey, Badhgis Province, Afghanistan. Kabul, Afghanistan: UNICEF Country Office and Atlanta, GA: United States Center for Disease Control, 2002.

80
APPENDICES

81
APPENDIX A: SUPPLEMENTAL DATA QUALITY TABLES ON MORTALITY
Table A 4.1: Comparison between women who have only girls or only boys by parity FAMILIES THAT HAVE ONLY GIRLS (SRB=0.512) FAMILIES THAT HAVE ONLY BOYS (SRB=0.512)
PARITY
TOTAL # OF
WOMEN IN
PARITY GROUP
Weighted Observed
# of women
who only had girls
Weighted Expected
# of women having
only girls
Total Observed # of Girls
Ever Born
Total Expected # of Girls
Ever Born
Total # of Girls Dead
Weighted Observed # of women who only had boys
Weighted Expected
# of women having
only boys
Total # of Observed Boys Ever
Born
Total Expected # of Boys
Ever Born
Total # of Boys Dead
Ratio of proportion boys dead
to proportion girls dead
Col 1 Col 2 Col 3 Col 4 Col 5 Col 6 Col 7 Col 8 Col 9 Col 10 Col 11 Col 12 Col 13
1 543 229 265 229 265 9 312 278 312 278 18 1.504 2 490 107 117 214 234 11 141 129 282 257 24 1.726 3 353 33 41 99 123 11 46 47 138 142 25 1.647 4 191 8 11 32 43 4 12 13 48 52 8 1.262
Table A 4.2: Comparison between mothers that have 1 girl and remaining boys for parities 3 and 4 FAMILIES THAT HAVE 1 GIRL AND REMAINING BOYS (SRB=0.512)
PARITY
TOTAL # OF
WOMEN IN
PARITY GROUP
Weighted Observed
# of women
who have 1 girl and remaining
boys
Weighted Expected
# of women
who have 1 girl and remaining
boys
Total Observed # of Girls Ever Born
Total Expected # of Girls
Ever Born
Total # of Girls Dead
Total # of Boys Ever
Born
Total # of Boys Dead
Ratio of proportion boys dead
to proportion girls dead
1 543 2 490 3 353 142 136 142 136 24 284 34 0.706 4 191 42 50 42 50 2 124 15 2.579
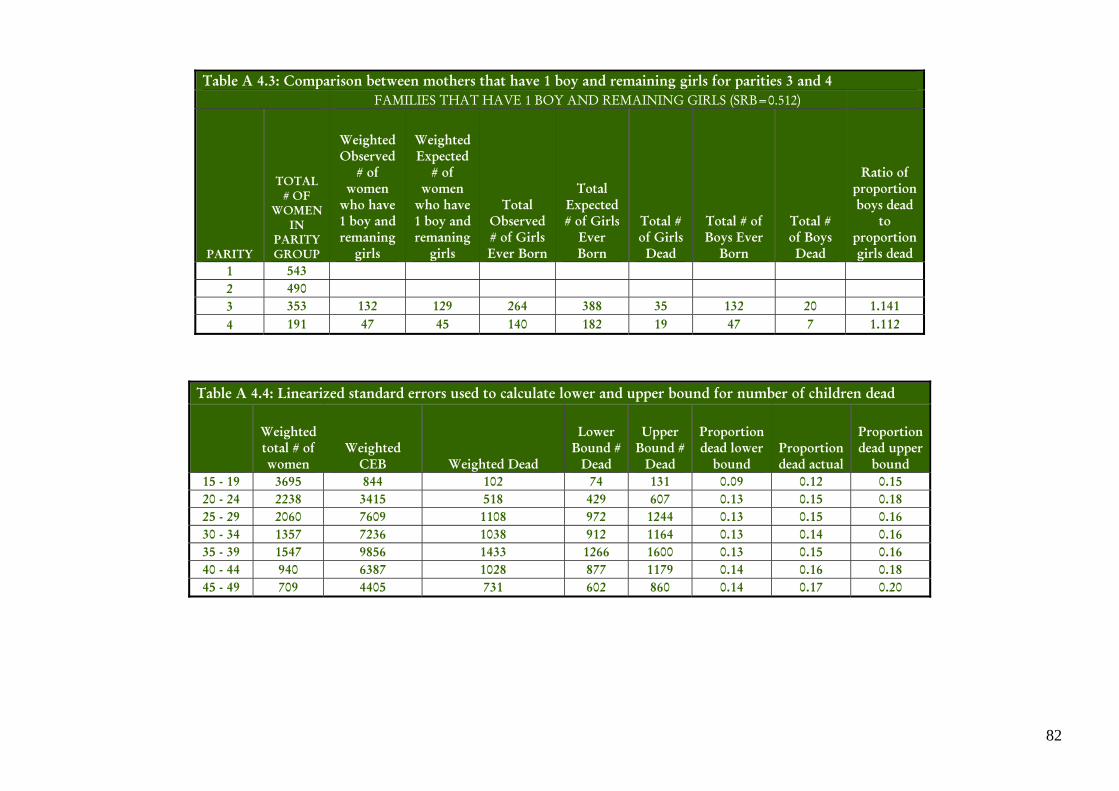
82
Table A 4.3: Comparison between mothers that have 1 boy and remaining girls for parities 3 and 4 FAMILIES THAT HAVE 1 BOY AND REMAINING GIRLS (SRB=0.512)
PARITY
TOTAL # OF
WOMEN IN
PARITY GROUP
Weighted Observed
# of women
who have 1 boy and remaning
girls
Weighted Expected
# of women
who have 1 boy and remaning
girls
Total Observed # of Girls Ever Born
Total Expected # of Girls
Ever Born
Total # of Girls Dead
Total # of Boys Ever
Born
Total # of Boys Dead
Ratio of proportion boys dead
to proportion girls dead
1 543 2 490 3 353 132 129 264 388 35 132 20 1.141 4 191 47 45 140 182 19 47 7 1.112
Table A 4.4: Linearized standard errors used to calculate lower and upper bound for number of children dead
Weighted total # of women
Weighted CEB Weighted Dead
Lower Bound #
Dead
Upper Bound #
Dead
Proportion dead lower
bound Proportion dead actual
Proportion dead upper
bound 15 - 19 3695 844 102 74 131 0.09 0.12 0.15 20 - 24 2238 3415 518 429 607 0.13 0.15 0.18 25 - 29 2060 7609 1108 972 1244 0.13 0.15 0.16 30 - 34 1357 7236 1038 912 1164 0.13 0.14 0.16 35 - 39 1547 9856 1433 1266 1600 0.13 0.15 0.16 40 - 44 940 6387 1028 877 1179 0.14 0.16 0.18 45 - 49 709 4405 731 602 860 0.14 0.17 0.20

83
APPENDIX B: ESTIMATES OF SAMPLING ERRORS
There are two types of errors: non-sampling errors and sampling errors. Non-sampling errors arise, for example, when a questionnaire has not been properly implemented, the correct household is not selected or mistakes are made during data editing and data entry. While precaution is taken at every stage of the survey to limit non-sampling error, they are invariably present in all surveys and are difficult to quantify. Each time a sample is drawn from a population (the same population), there is variability in the individual estimates derived from the different samples. One measure of this variability is the standard error. The standard error is used to determine the confidence intervals of the estimates.
The standard errors are calculated for certain select variables using the Taylor linearization method (the survey commands) in STATA 9 (Stata Corp, 2005). The DEFT (design effect) for specific indicators is also given. The DEFT is the ratio of the standard errors from the implemented survey to the standard errors from simple random sampling. The AHS is a multi-stage cluster survey. Since simple random sampling was not conducted for the AHS, the variance estimation for the different variables is not as efficient as it would have been if simple random sampling was used.
Table B.1 presents the definitions of the selected indicators and the type of estimate. Table B.2 gives a breakdown for each variable on the value of the statistic (R), the standard error (SE), the number of un-weighted (N) and weighted (W) cases, the design effect (DEFT), the 95% confidence interval (R+ 2SE).

84
Table B1: Definitions for selected indicators, AHS 2006
INDICATOR NUMERATOR DENOMINATOR ESTIMATE
Contraceptive Prevalence Rate (CPR)
Number of women currently married 10-49 years of age that
are using a contraceptive method (traditional or modern)
Total number of women 10-49 years of age that are currently
married Proportion
Skilled antenatal (ANC) care
Number of women 10-49 years of age that were attended to at least once during pregnancy in the 2 yrs preceding the survey by a
skilled health care professional
Total number of women surveyed 10-49 yrs of age with a birth in the 2 yrs preceding
the survey
Proportion
Skilled attendant at delivery
Number of women 10-49 years of age with a birth in the 2 yrs
preceding the survey that were attended during childbirth by a
skilled professional
Total number of women surveyed 10-49 yrs of age with a birth in the 2 yrs preceding
the survey
Proportion
Institutional Delivery
Number of women 10-49 years of age with a birth in the 2 yrs preceding the survey that
delivered at a health facility
Total number of women surveyed 10-49 yrs of age with a birth in the 2 yrs preceding
the survey
Proportion
Tuberculosis Immunization Coverage
Number of children aged 12-23 months receiving BCG vaccine
before their first birthday
Total number of children 12-23 months surveyed Proportion
Polio Immunization Coverage
Number of children aged 12-23 months receiving OPV3 vaccine
before their first birthday
Total number of children 12-23 months surveyed Proportion
Immunization Coverage for Diptheria, Pertussis, Tetanus
Number of children aged 12-23 months receiving DPT3 vaccine
before their first birthday
Total number of children 12-23 months surveyed Proportion
Measles Immunization Coverage
Number of children aged 12-23 months receiving measles vaccine
before their first birthday
Total number of children 12-23 months surveyed Proportion
Fully Immunized Children
Number of children aged 12-23 months receiving BCG, OPV (1-3), DPT (1-3), measles vaccines
before their first birthday
Total number of children 12-23 months surveyed Proportion
Vitamin A Supplementation (under-fives)
Number of children 6 - 59 months of age receiving at least one high dose vitamin A supplement in the
last six months
Total number of children 6 - 59 months surveyed Proportion
Exclusive Breastfeeding Rate
Number of infants 0-5 months that are exclusively breastfed
Total number of infants aged 0-5 months surveyed Proportion
Timely Complementary Feeding Rate
Number of infants 6-9 months that are receiving timely
complementary food and being breastfed
Total number of infants aged 6-9 months surveyed Proportion
Under-5 mortality rate
Probability of dying by exact age 5 yrs Rate
Infant mortality rate
Probability of dying by exact age 1 yrs Rate

85
Table B.2: Sampling errors, Total Sample, Afghanistan 2006
Variable Value
(R) Standard error (SE)
Number of cases
Design effect
(DEFT)
Relative error
(SE/R)
Confidence limits
Un-weighted
(N) Weighted
(WN) R - 1.96SE R + 1.96SE Maternal Variables Contraceptive Prevalence Rate (CPR) 0.155 0.009 1035 978 1.987 0.058 0.137 0.173
Skilled antenatal care during pregnancy 0.323 0.017 993 1009 2.019 0.052 0.290 0.356
Skilled attendant during delivery 0.189 0.014 605 581 1.928 0.072 0.162 0.216 Institutional delivery 0.147 0.012 484 449 1.897 0.082 0.123 0.170 Child Variables Tuberculosis immunization coverage (BCG) 0.702 0.020 1122 1091 1.756 0.029 0.663 0.742
Polio Immunization Coverage (OPV3) 0.697 0.019 1093 1030 1.599 0.027 0.660 0.734
Immunization Coverage for Diptheria, Pertussis, Tetanus (DPT3)
0.346 0.019 549 502 1.559 0.056 0.308 0.383
Measles Immunization Coverage 0.626 0.021 964 937 1.684 0.033 0.586 0.667 Fully Immunized Children 0.271 0.018 429 393 1.523 0.065 0.236 0.305 Vitamin A Supplementation (under-fives) 0.795 0.011 5076 4950 2.152 0.014 0.774 0.816
Exclusive Breastfeeding Rate 0.830 0.020 513 527 1.353 0.024 0.790 0.869 Timely Complementary Feeding Rate 0.284 0.026 125 135 1.281 0.093 0.233 0.336

86
APPENDIX C: QUESTIONNAIRES

87
2006 AFGHANISTAN HOUSEHOLD SURVEY
Ministry of Public Health, Islamic Republic of Afghanistan
Johns Hopkins University
HOUSEHOLD QUESTIONNAIRE
Interview Visits
Interviewer Team Code |___|___| Time (at beginning of interview): |___|___|:|___|___|
Interviewer Code |___|___| Time (at end of interview): |___|___| : |___|___| Date of interview : |___||___| |___||___| |___||___||___||___|
Month Day Year
Result: |___| Codes: 1.Completed 2. Household Present but no competent respondent at home 3. Household absent 4. Refused 5. Dwelling vacant or not a dwelling 6. Dwelling destroyed 7. Other_____________________(SPECIFY)
Total # of People in Household Listing |___|___|
If there are more than 30 people in household, how many more ? |___|___|
Total Eligible Women in Household |___|
Identification
Unique Code |_6|___|___|___|___|___| Province Name District Name Name of village Nahia |___|___| Block No. |___|___|
Cluster Number |___|___||___|
Dwelling Number |___|___|
Household number inside Compound |___|___|
Name of Household Head Name and Line number of Respondent of Household Roster. _________________ |___|___|
Superviser Code : |___|___| Supervisor Name & Signature:
Field Editor Code : |___|___| Field Editor Name & Signature:
For Office Use Only
GROUP CODE
1=PPA 2=SM 3=EC 4=REACH 5=Other
|___|
Province Code |___|___|
District Code |___|___|___|___|
Geocode |___|___|___|___|___|___|___|___|___||___|___|___|___|

88
First, I would like to make a complete list of all persons living in this household. I understand sometimes there is more than one family living under the same roof. What I would like to know are the members of the household that regularly eat meals together and/or contribute to meal expenses. If the person has been away for more than 6 months continuously do not include this person in the list. Module 1: Household Listing LINE NO.
USUAL RESIDENTS RELATION TO THE HOH
SEX AGE PARENTAL SURVIVORSHIP AND RESIDENCE FOR PERSONS LESS THAN 18 YEARS OLD (IF PERSON 18 YRS OR OLDER GO TO Q. 111)
Please name all the people in the household from the oldest to the youngest. Don’t forget to include yourself.
What is the relationship of (NAME) to the
HoH GO TO END OF PAGE TO GET LIST OF CODES
Is (NAME) male or female? F…....…0 M…..…..1
How old is (NAME) in completed years?
Is (NAME)’s natural mother alive No…….0 Yes…...1 DK….…8 (IF “NO” OR “DK”, SKIP TO Q.108
IF MOTHER IS ALIVE Does (NAME)’s natural mother live in this household? If “yes”, what is her name? RECORD MOTHER’S LINE NUMBER & GO TO Q.109 IF “NO”, RECORD ‘00’ AND GO TO Q.108
IF MOTHER DEAD OR NOT LIVING IN THIS HOUSE-HOLD Does (NAME) have another woman who takes care of him/her? RECORD CARETAKER’S LINE NUMBER (IF “NO” RECORD “00” & GO TO Q.109 )
Is (NAME)’s natural father alive No…….0 Yes……1 DK…….8 (IF “NO” OR “DK”, SKIP TO 111)
IF ALIVE Does (NAME)’s natural father live in this household? If yes, what is his name? RECORD FATHER’S LINE NUMBER
101 102 103 104 105 (Yrs) 106 107 108 109 110 01 0 1 __ __ 0 1 8 0 1 8 02 0 1 __ __ 0 1 8 0 1 8 03 0 1 __ __ 0 1 8 0 1 8 04 0 1 __ __ 0 1 8 0 1 8 05 0 1 __ __ 0 1 8 0 1 8 06 0 1 __ __ 0 1 8 0 1 8 07 0 1 __ __ 0 1 8 0 1 8 08 0 1 __ __ 0 1 8 0 1 8 09 0 1 __ __ 0 1 8 0 1 8 10 0 1 __ __ 0 1 8 0 1 8 11 0 1 __ __ 0 1 8 0 1 8 12 0 1 __ __ 0 1 8 0 1 8 13 0 1 __ __ 0 1 8 0 1 8 14 0 1 __ __ 0 1 8 0 1 8 15 0 1 __ __ 0 1 8 0 1 8

89
LINE NO.
USUAL RESIDENTS RELATION TO THE HOH
SEX AGE PARENTAL SURVIVORSHIP AND RESIDENCE FOR PERSONS LESS THAN 18 YEARS OLD (IF PERSON 18 YRS OR OLDER GO TO Q. 111)
Please name all the people in the household from the oldest to the youngest. Don’t forget to include yourself.
What is the relationship of (NAME) to the
HoH GO TO END OF PAGE TO GET LIST OF CODES
Is (NAME) male or female? F…....…0 M…..…..1
How old is (NAME) in completed years?
Is (NAME)’s natural mother alive No…….0 Yes…...1 DK….…8 (IF “NO” OR “DK”, SKIP TO Q.108
IF MOTHER IS ALIVE Does (NAME)’s natural mother live in this household? If “yes”, what is her name? RECORD MOTHER’S LINE NUMBER & GO TO Q.109 IF “NO”, RECORD ‘00’ AND GO TO Q.108
IF MOTHER DEAD OR NOT LIVING IN THIS HOUSE-HOLD Does (NAME) have another woman who takes care of him/her? RECORD CARETAKER’S LINE NUMBER (IF “NO” RECORD “00” & GO TO Q.109 )
Is (NAME)’s natural father alive No…….0 Yes……1 DK…….8 (IF “NO” OR “DK”, SKIP TO 111)
IF ALIVE Does (NAME)’s natural father live in this household? If yes, what is his name? RECORD FATHER’S LINE NUMBER
101 102 103 104 105 (Yrs) 106 107 108 109 110
16 0 1 __ __ 0 1 8 0 1 8 17 0 1 __ __ 0 1 8 0 1 8 18 0 1 __ __ 0 1 8 0 1 8 19 0 1 __ __ 0 1 8 0 1 8 20 0 1 __ __ 0 1 8 0 1 8 21 0 1 __ __ 0 1 8 0 1 8 22 0 1 __ __ 0 1 8 0 1 8 23 0 1 __ __ 0 1 8 0 1 8 24 0 1 __ __ 0 1 8 0 1 8 25 0 1 __ __ 0 1 8 0 1 8 26 0 1 __ __ 0 1 8 0 1 8 27 0 1 __ __ 0 1 8 0 1 8 28 0 1 __ __ 0 1 8 0 1 8 29 0 1 __ __ 0 1 8 0 1 8 30 0 1 __ __ 0 1 8 0 1 8
CODES FOR QUESTION 103 1. Head of Household; 2.. 1st Wife; 3. 2nd wife; 4. 3rd wife; 5. 4th wife; 6. Son; 7. Daughter; 8. Son-in-law; 9. Daughter-in-law ; 10. Grandson; 11. Granddaughter; 12. Niece; 13. Nephew; 14. Father; 15. Mother; 16. Brother; 17. Sister; 18. Brother’s wife; 19. Sister’s husband; 20. Grandfather; 21. Grandmother; 22. Other male relative; 23. Other female relative; 24. Unrelated male; 25. Unrelated female; 26. Adopted/Foster/Stepchild
For Question 102 Just to make sure that I have a complete listing of all the people: 102A) Are there any other persons such as small children or infants that we have not listed? Yes…1 (ENTER EACH IN TABLE) No…0 102B) In addition, are there any other people who may not be members of your family, such as domestic servants, lodgers or friends who usually live here? Yes…1 (ENTER EACH IN TABLE) No…0

90
LINE NO.
MARITAL STATUS
EDUCATION (If Age 5years or older) RESIDENCE ELIGIBILITY
ONLY ASK FOR PEOPLE 10 YEARS OF AGE OR MORE Has (Name) ever been married? No……0 Yes…..1 DK……8
Has (NAME) ever attended school? No…..0 Yes….1 DK…..8
(IF “NO” OR “DK”, SKIP TO Q.115
Is (NAME) still in school? No……0 Yes…..1 DK……8
How many years of school did (name) complete? ____yrs DK….98
Can name read and write? Cannot read or write……0 Read only...........1 Read and write………2 DK………..8
Does (NAME) usually live here? No…...0 Yes..…1 Sometimes…….2 (IF “YES” SKIP TO Q. 118)
Why does (NAME) not usually live here? For job/work……….1 Get better education………….2 Get better health services…………...3 Away visiting family and friends………..4 Stays with a separate hhld…….5 Other___________6 (SPECIFY) DK…………………98 IF “6” SPECIFY IN SPACE PROVIDED
Did (NAME) sleep here last night? No….…0 Yes...…1 DK……8
CIRCLE LINE NUMBER OF ALL WOMAN, BETWEEN 10 AND 49 YEARS WHO HAVE EVER BEEN MARRIED AND ANY OTHER WOMAN WHO IS A CARE-TAKER OF ANY CHILDREN AND IS AT LEAST 18 YRS OLD.
In the past 30 days, has (name) been or unable to perform normal activities because of a disability or illness? No……….0 Yes..........1 DK...........8 (If “NO” or “DK”, GO TO Q.105 FOR THE NEXT PERSON. IF ALL MEMBERS HAVE BEEN ENTERED, GO TO Q.201)
101 111 112 113 114 115 116 117 118 119A 120 01 0 1 8 0 1 8 0 1 8 __ __ 98 0 1 2 8 0 1 2 ______________________ 0 1 8 1 0 1 8
02 0 1 8 0 1 8 0 1 8 __ __ 98 0 1 2 8 0 1 2 ______________________ 0 1 8 2 0 1 8 03 0 1 8 0 1 8 0 1 8 __ __ 98 0 1 2 8 0 1 2 ______________________ 0 1 8 3 0 1 8 04 0 1 8 0 1 8 0 1 8 __ __ 98 0 1 2 8 0 1 2 ______________________ 0 1 8 4 0 1 8 05 0 1 8 0 1 8 0 1 8 __ __ 98 0 1 2 8 0 1 2 ______________________ 0 1 8 5 0 1 8 06 0 1 8 0 1 8 0 1 8 __ __ 98 0 1 2 8 0 1 2 ______________________ 0 1 8 6 0 1 8 07 0 1 8 0 1 8 0 1 8 __ __ 98 0 1 2 8 0 1 2 ______________________ 0 1 8 7 0 1 8 08 0 1 8 0 1 8 0 1 8 __ __ 98 0 1 2 8 0 1 2 ______________________ 0 1 8 8 0 1 8 09 0 1 8 0 1 8 0 1 8 __ __ 98 0 1 2 8 0 1 2 ______________________ 0 1 8 9 0 1 8 10 0 1 8 0 1 8 0 1 8 __ __ 98 0 1 2 8 0 1 2 ______________________ 0 1 8 10 0 1 8 11 0 1 8 0 1 8 0 1 8 __ __ 98 0 1 2 8 0 1 2 ______________________ 0 1 8 11 0 1 8 12 0 1 8 0 1 8 0 1 8 __ __ 98 0 1 2 8 0 1 2 ______________________ 0 1 8 12 0 1 8 13 0 1 8 0 1 8 0 1 8 __ __ 98 0 1 2 8 0 1 2 ______________________ 0 1 8 13 0 1 8 14 0 1 8 0 1 8 0 1 8 __ __ 98 0 1 2 8 0 1 2 ______________________ 0 1 8 14 0 1 8 15 0 1 8 0 1 8 0 1 8 __ __ 98 0 1 2 8 0 1 2 ______________________ 0 1 8 15 0 1 8 16 0 1 8 0 1 8 0 1 8 __ __ 98 0 1 2 8 0 1 2 ______________________ 0 1 8 16 0 1 8

91
LINE NO.
MARITAL STATUS
EDUCATION (If Age 5years or older) RESIDENCE ELIGIBILITY
ONLY ASK FOR PEOPLE 10 YEARS OF AGE OR MORE Has (Name) ever been married? No……0 Yes…..1 DK……8
Has (NAME) ever attended school? No…..0 Yes….1 DK…..8
(IF “NO” OR “DK”, SKIP TO Q.115
Is (NAME) still in school? No……0 Yes…..1 DK……8
How many years of school did (name) complete? ____yrs DK….98
Can name read and write? Cannot read or write……0 Read only...........1 Read and write………2 DK………..8
Does (NAME) usually live here? No…...0 Yes..…1 Sometimes…….2 (IF “YES” SKIP TO Q. 118)
Why does (NAME) not usually live here? For job/work……….1 Get better education………….2 Get better health services…………...3 Away visiting family and friends………..4 Stays with a separate hhld…….5 Other___________6 (SPECIFY) DK…………………98 IF “6” SPECIFY IN SPACE PROVIDED
Did (NAME) sleep here last night? No….…0 Yes...…1 DK……8
CIRCLE LINE NUMBER OF ALL WOMAN, BETWEEN 10 AND 49 YEARS WHO HAVE EVER BEEN MARRIED AND ANY OTHER WOMAN WHO IS A CARE-TAKER OF ANY CHILDREN AND IS AT LEAST 18 YRS OLD.
In the past 30 days, has (name) been or unable to perform normal activities because of a disability or illness? No……….0 Yes..........1 DK...........8 (If “NO” or “DK”, GO TO Q.105 FOR THE NEXT PERSON. IF ALL MEMBERS HAVE BEEN ENTERED, GO TO Q.201)
101 111 112 113 114 115 116 117 118 119A 120
17 0 1 8 0 1 8 0 1 8 __ __ 98 0 1 2 8 0 1 2 ______________________ 0 1 8 17 0 1 8 18 0 1 8 0 1 8 0 1 8 __ __ 98 0 1 2 8 0 1 2 ______________________ 0 1 8 18 0 1 8 19 0 1 8 0 1 8 0 1 8 __ __ 98 0 1 2 8 0 1 2 ______________________ 0 1 8 19 0 1 8 20 0 1 8 0 1 8 0 1 8 __ __ 98 0 1 2 8 0 1 2 ______________________ 0 1 8 20 0 1 8 21 0 1 8 0 1 8 0 1 8 __ __ 98 0 1 2 8 0 1 2 ______________________ 0 1 8 21 0 1 8 22 0 1 8 0 1 8 0 1 8 __ __ 98 0 1 2 8 0 1 2 ______________________ 0 1 8 22 0 1 8 23 0 1 8 0 1 8 0 1 8 __ __ 98 0 1 2 8 0 1 2 ______________________ 0 1 8 23 0 1 8 24 0 1 8 0 1 8 0 1 8 __ __ 98 0 1 2 8 0 1 2 ______________________ 0 1 8 24 0 1 8 25 0 1 8 0 1 8 0 1 8 __ __ 98 0 1 2 8 0 1 2 ______________________ 0 1 8 25 0 1 8 26 0 1 8 0 1 8 0 1 8 __ __ 98 0 1 2 8 0 1 2 ______________________ 0 1 8 26 0 1 8 27 0 1 8 0 1 8 0 1 8 __ __ 98 0 1 2 8 0 1 2 ______________________ 0 1 8 27 0 1 8 28 0 1 8 0 1 8 0 1 8 __ __ 98 0 1 2 8 0 1 2 ______________________ 0 1 8 28 0 1 8 29 0 1 8 0 1 8 0 1 8 __ __ 98 0 1 2 8 0 1 2 ______________________ 0 1 8 29 0 1 8 30 0 1 8 0 1 8 0 1 8 __ __ 98 0 1 2 8 0 1 2 ______________________ 0 1 8 30 0 1 8
NOTE: To calculate Q.119B (Total No. of Eligibile women): FIRST, Total all FEMALES between the ages of 10 and 49 years who have EVER been married. Confirm with Q.104 with SEX of person and Q.111 with MARITAL STATUS OF PERSON. SECOND, total all UNIQUE caregivers from Q.108 who are NOT listed in Q.107. Add these together. To calculate Q.119C (Total No. of Children under 5 yrs): Check Q. 105 & total children under 5 yrs
Q. 119B: TOTAL NUMBER OF ELIGIBLE WOMEN: _______ Q. 119D: TOTAL NUMBER OF CHILDREN UNDER 5 YRS: _______

92
LINE NO.
HEALTH CARE SEEKING AND UTILIZATION (ASK ONLY FOR INDIVIDUALS WHO SAID “1” (YES) IN QUESTION 120)
What was the main complaint, condition or disability? IF MORE THAN ONE COMPLAINT, ASK FOR THE MOST RECENT PLEASE MARK ONLY ONE Temporary injury........................................................1 Mental illness………………………………………..…..2 Respiratory problem………………………………...….3 Heart problem.……………………………………….….4 Fever……………………………………………….........5 Intestinal problem or diarrhea………………………….6 ENT Problems……………………………………..…....7 Permanent disability…………………………….…......8 Skin Problems……………………………………………9 UTI…………………………………………………………10 Gastritis………………………………………….……….11 Anemia……………………………………………………12 Headaches……………………………………………….13 Problems during Pregnancy……………………………14 Other_____________________________________15
(SPECIFY) IF “OTHER” PLEASE FILL IN THE SPACE NEXT TO “15” FOR THE APPROPRIATE PERSON
Did this member seek care or was he/she taken for care outside the home for this illness or disability? No……0 Yes......1 DK.......8 (IF “YES”, SKIP TO 124)
What was the main reason that care was not sought for (name) outside the home for his/her illness or disability? Illness or disability not severe enough.................................1 Lack of transport..................................................................2 Cannot afford cost of transport……………………………….3 Cannot afford cost of treatment/cost too high…………........4 The quality of available services is low………………….......5 There are no drugs available ..............................................6 Facility too far…………………………………………….........7 Afraid to travel to facility because of security concerns……8 Other _________________________________________9 (SPECIFY) IF OTHER THAN THE PROVIDED CHOICES ARE GIVEN BY THE RESPONDENT, PLEASE CHOOSE “9” AND FILL IN THE SPACE NEXT TO “9” GO TO Q.105 FOR THE NEXT PERSON. IF ALL HOUSEHOLD MEMBERS HAVE BEEN ENTERED, GO TO Q.201
101 121 122 123 1 2 3 4 5 6 7 8 9 10 11 12 13 14 15 ____________________________ 0 1 8 1 2 3 4 5 6 7 8 9 ____________________________________
1 2 3 4 5 6 7 8 9 10 11 12 13 14 15 ____________________________ 0 1 8 1 2 3 4 5 6 7 8 9 ____________________________________
1 2 3 4 5 6 7 8 9 10 11 12 13 14 15 ____________________________ 0 1 8 1 2 3 4 5 6 7 8 9 ____________________________________
1 2 3 4 5 6 7 8 9 10 11 12 13 14 15 ____________________________ 0 1 8 1 2 3 4 5 6 7 8 9 ____________________________________
1 2 3 4 5 6 7 8 9 10 11 12 13 14 15 ____________________________ 0 1 8 1 2 3 4 5 6 7 8 9 ____________________________________
1 2 3 4 5 6 7 8 9 10 11 12 13 14 15 ____________________________ 0 1 8 1 2 3 4 5 6 7 8 9 ____________________________________
1 2 3 4 5 6 7 8 9 10 11 12 13 14 15 ____________________________ 0 1 8 1 2 3 4 5 6 7 8 9 ____________________________________
1 2 3 4 5 6 7 8 9 10 11 12 13 14 15 ____________________________ 0 1 8 1 2 3 4 5 6 7 8 9 ____________________________________
1 2 3 4 5 6 7 8 9 10 11 12 13 14 15 ____________________________ 0 1 8 1 2 3 4 5 6 7 8 9 ____________________________________
1 2 3 4 5 6 7 8 9 10 11 12 13 14 15 ____________________________ 0 1 8 1 2 3 4 5 6 7 8 9 ____________________________________
1 2 3 4 5 6 7 8 9 10 11 12 13 14 15 ____________________________ 0 1 8 1 2 3 4 5 6 7 8 9 ____________________________________

93
LINE NO.
HEALTH CARE SEEKING AND UTILIZATION (CONTINUED) (ASK ONLY FOR INDIVIDUALS WHO SAID “1” (YES) IN QUESTION 120)
Which type of provider did you or [name] consult first for the illness/disability? If you or [name] went to more than one provider, please indicate the first, second, and third provider consulted. (CODES GIVEN BELOW) IF ONLY ONE TYPE OF PROVIDER CONSULTED, THEN CHOOSE “00” IN 124.B AND 124.C. IF OTHER THAN THE PROVIDED CHOICES ARE GIVEN BY THE RESPONDENT, PLEASE CHOOSE “12” AND FILL IN THE SPACE UNDERNEATH “12” WITH THE TYPE OF PROVIDER.
124.A
1ST Provider
124.B
2ND Provider
124.C
3RD Provider 101 124
1 2 3 4 5 6 7 8 9 10 11 12 _________________________________
1 2 3 4 5 6 7 8 9 10 11 12 00 _________________________________
1 2 3 4 5 6 7 8 9 10 11 00 _________________________________
1 2 3 4 5 6 7 8 9 10 11 12 _________________________________
1 2 3 4 5 6 7 8 9 10 11 12 00 _________________________________
1 2 3 4 5 6 7 8 9 10 11 00 _________________________________
1 2 3 4 5 6 7 8 9 10 11 12 _________________________________
1 2 3 4 5 6 7 8 9 10 11 12 00 _________________________________
1 2 3 4 5 6 7 8 9 10 11 00 _________________________________
1 2 3 4 5 6 7 8 9 10 11 12 _________________________________
1 2 3 4 5 6 7 8 9 10 11 12 00 _________________________________
1 2 3 4 5 6 7 8 9 10 11 00 _________________________________
1 2 3 4 5 6 7 8 9 10 11 12 _________________________________
1 2 3 4 5 6 7 8 9 10 11 12 00 _________________________________
1 2 3 4 5 6 7 8 9 10 11 00 _________________________________
1 2 3 4 5 6 7 8 9 10 11 12 _________________________________
1 2 3 4 5 6 7 8 9 10 11 12 00 _________________________________
1 2 3 4 5 6 7 8 9 10 11 00 _________________________________
1 2 3 4 5 6 7 8 9 10 11 12 _________________________________
1 2 3 4 5 6 7 8 9 10 11 12 00 _________________________________
1 2 3 4 5 6 7 8 9 10 11 00 _________________________________
1 2 3 4 5 6 7 8 9 10 11 12 _________________________________
1 2 3 4 5 6 7 8 9 10 11 12 00 _________________________________
1 2 3 4 5 6 7 8 9 10 11 00 _________________________________
1 2 3 4 5 6 7 8 9 10 11 12 _________________________________
1 2 3 4 5 6 7 8 9 10 11 12 00 _________________________________
1 2 3 4 5 6 7 8 9 10 11 00 _________________________________
1 2 3 4 5 6 7 8 9 10 11 12 _________________________________
1 2 3 4 5 6 7 8 9 10 11 12 00 _________________________________
1 2 3 4 5 6 7 8 9 10 11 00 _________________________________
1 2 3 4 5 6 7 8 9 10 11 12 _________________________________
1 2 3 4 5 6 7 8 9 10 11 12 00 _________________________________
1 2 3 4 5 6 7 8 9 10 11 00 _________________________________
1 2 3 4 5 6 7 8 9 10 11 12 _________________________________
1 2 3 4 5 6 7 8 9 10 11 12 00 _________________________________
1 2 3 4 5 6 7 8 9 10 11 00 _________________________________
1 2 3 4 5 6 7 8 9 10 11 12 _________________________________
1 2 3 4 5 6 7 8 9 10 11 12 00 _________________________________
1 2 3 4 5 6 7 8 9 10 11 00 _________________________________
CODES FOR Q.124 Community health worker.................1 Public health clinic …………..…...…2 District or Provincial Hospital……….3 Private doctor/clinic……...…….……4
Traditional healer (unani)….…….………….5 Ziarat……………….....................................6 Private pharmacy with out doctor................7 Private pharmacy with doctor.………………8
Mullah or Imam……………..…………....9 Elderly woman in village……..…...........10 Dais……………………………...………..11 Other___________________________12 (SPECIFY)

94
LINE NO.
HEALTH CARE SEEKING AND UTILIZATION (CONTINUED) (ASK ONLY FOR INDIVIDUALS WHO SAID “1” (YES) IN QUESTION 120)
How much was paid in total for the following items related to the health care (Name) received in the previous month? (IN AFGHANIS). (IF NO PAYMENT, WRITE “00” IN EACH COLUMN AND SKIP TO Q. 127. IF ONLY THE TOTAL PAYMENT IS KNOWN, FILL IN 125.G AND CIRCLE “DK” FOR 125.A TO 125.F)
Registration fees
Consultation fees
Tests (lab & x-ray)
Drugs and supplies
Transportation
Food and lodging
Total
101 125 A. 125 B. 125 C. 125 D. 125 E. 125 F. 125 G. ___________ DK ___________ DK ___________ DK ___________ DK ___________ DK ___________ DK ___________ DK
___________ DK ___________ DK ___________ DK ___________ DK ___________ DK ___________ DK ___________ DK
___________ DK ___________ DK ___________ DK ___________ DK ___________ DK ___________ DK ___________ DK
___________ DK ___________ DK ___________ DK ___________ DK ___________ DK ___________ DK ___________ DK
___________ DK ___________ DK ___________ DK ___________ DK ___________ DK ___________ DK ___________ DK
___________ DK ___________ DK ___________ DK ___________ DK ___________ DK ___________ DK ___________ DK
___________ DK ___________ DK ___________ DK ___________ DK ___________ DK ___________ DK ___________ DK
___________ DK ___________ DK ___________ DK ___________ DK ___________ DK ___________ DK ___________ DK
___________ DK ___________ DK ___________ DK ___________ DK ___________ DK ___________ DK ___________ DK
___________ DK ___________ DK ___________ DK ___________ DK ___________ DK ___________ DK ___________ DK
___________ DK ___________ DK ___________ DK ___________ DK ___________ DK ___________ DK ___________ DK
___________ DK ___________ DK ___________ DK ___________ DK ___________ DK ___________ DK ___________ DK
___________ DK ___________ DK ___________ DK ___________ DK ___________ DK ___________ DK ___________ DK

95
LINE NO.
HEALTH CARE SEEKING AND UTILIZATION (CONTINUED) (ASK ONLY FOR INDIVIDUALS WHO SAID “1” (YES) IN QUESTION 120)
Where did the money come from that was used to pay for these costs? Savings or regular household budget……………………………………………………………….…….1 Selling household possessions………………………………………………………………………...…..2 Mortgaging or selling land………………………………………………………..………………………....3 Borrowed money from a friend or relative………………………………………………………………...4 Borrowed from someone other than friend or family………………………………………………….....5 Selling Blood…………………………………………………………………………………………….......6 Other_________________________________________________________________________7 (SPECIFY) IF OTHER THAN THE PROVIDED CHOICES ARE GIVEN BY THE RESPONDENT, PLEASE RECORD “7” AND FILL IN THE SPACE NEXT TO “7” IF ONLY ONE SOURCE WAS USED, PUT 00 FOR 126.B.
Other than money, were any goods, gifts or services given to the provider for the health care received by (name) in the last month?
What was the most important source?
What was the second most important source?
No……0 Yes.....1 DK..….8 (IF “NO” OR “DK”, GO
TO 201 )
What would you estimate was the value of this contribution in Afghanis? GO TO Q.105 FOR THE NEXT PERSON. IF ALL MEMBERS HAVE BEEN ENTERED, GO TO Q.201)
101 126 A. 126 B. 127 A. 127 B.
1 2 3 4 5 6 7 _________________________________ 1 2 3 4 5 6 7 __ ______________________________ 00 0 1 8
1 2 3 4 5 6 7 _________________________________ 1 2 3 4 5 6 7 __ ______________________________ 00 0 1 8
1 2 3 4 5 6 7 _________________________________ 1 2 3 4 5 6 7 __ ______________________________ 00 0 1 8
1 2 3 4 5 6 7 _________________________________ 1 2 3 4 5 6 7 __ ______________________________ 00 0 1 8
1 2 3 4 5 6 7 _________________________________ 1 2 3 4 5 6 7 __ ______________________________ 00 0 1 8
1 2 3 4 5 6 7 _________________________________ 1 2 3 4 5 6 7 __ ______________________________ 00 0 1 8
1 2 3 4 5 6 7 _________________________________ 1 2 3 4 5 6 7 __ ______________________________ 00 0 1 8
1 2 3 4 5 6 7 _________________________________ 1 2 3 4 5 6 7 __ ______________________________ 00 0 1 8
1 2 3 4 5 6 7 _________________________________ 1 2 3 4 5 6 7 __ ______________________________ 00 0 1 8
1 2 3 4 5 6 7 _________________________________ 1 2 3 4 5 6 7 __ ______________________________ 00 0 1 8
1 2 3 4 5 6 7 _________________________________ 1 2 3 4 5 6 7 __ ______________________________ 00 0 1 8
1 2 3 4 5 6 7 _________________________________ 1 2 3 4 5 6 7 __ ______________________________ 00 0 1 8

96
Module II: Economics: THE NEXT QUESTIONS ARE GOING TO BE ABOUT THE ECONOMIC STATUS OF YOUR HOUSEHOLDNo. Questions and filters Coding Categories Skip
201 What is the main source of household income? DO NOT READ CHOICES, CIRCLE THE ANSWER GIVEN, OR WRITE IN IF “OTHER”
Agriculture…………………………………………………..…..…... 1 Rearing animals……………...…. ………………………………….2 Service/ Salaried………………... ………………………………….3 Business/trading………………... …………………………………..4 Remittance…………………….… ………………………………….5 Seasonal Worker…………………………………………………….6 Labor………………………..…………………………………………7 Other______________________________________________8 (SPECIFY)
202 What is the main source of lighting for the household? RECORD THE ANSWER GIVEN, OR WRITE IN IF “OTHER.” RECORD ONLY ONE ANSWER. IF RESPONDENT GIVES MORE THAN ONE SOURCE OF ELECTRICITY, ASK WHAT THE MAIN SOURCE IS.
No source of lighting………..……………………………………..…0 Electrical mains……………..…………………………………..…....1 Generator…………….….….…………………………………......…2 Gas lamp………………………………………………………….…..3 Kerosene or oil lamp…..….....................................................…..4 Candles……………….….………………………………….….…....5 Other______________________________________________6 (SPECIFY)
203A What is the main source of water for drinking and food preparation for the household? RECORD THE ANSWER GIVEN, OR WRITE IN IF “OTHER.” RECORD ONLY ONE ANSWER IF RESPONDENT GIVES MORE THAN ONE SOURCE OF WATER, ASK WHAT THE MAIN SOURCE IS.
Piped into residence/ yard/ plot/compound…………………..…..01 Public tap…………………… ………………………….……….…..02 Hand pump in residence/yard/ plot…………………………...…...03 Public Hand-pump……………………………………….……...…..04 Covered well in residence/yard/ plot..……………………….…....05 Covered well elsewhere ……………………………………..….…06 Open well in residence/yard/plot….………………….….……......07 Open well elsewhere………………………………………………..08 Spring…………………….…………………………….…..……...…09 River/ Stream…………....………………………………...……..….10 Pond / Lake…………………………….……………….……….…..11 Dam……………………………………….…………………..….…..12 Rain water……………………………………………...……..……..13 Tanker/ Truck……………………………………….… ….…….…..14 Other__________________________________________ __ 15 (SPECIFY)
203B Did you do anything to the water to make it safer to drink in the last 2 weeks? IF YES, What did you do? Anything else? (RECORD ALL THAT APPLY) NOTE: IF DID NOT DO ANYTHING (“A”) OR DON’T KNOW (“J”) OTHER CHOICES SHOULD NOT BE CHOSEN
Did not do anything……………………………….…………………A Boil............................................................................................. B Bleach/chlorine (other than Clorin)........... ……………………….C Add Clorin............................................. ………………………….D Filter it through cloth.............................. …………………………E Water filter (ceramic, sand, composite).... ………………………F Solar disinfection.................................... ………………………..G Salt...................................................... ………………………….H Letting it sit and settle……………………………………………..I Don’t know…………………………………………………………. J Other_____________________________________________ K (specifiy)
204 What type of fuel is mainly used in your household for cooking? RECORD THE ANSWER GIVEN, OR WRITE IN IF “OTHER”
Gas………………….……………………………………………….…1 Stove with kerosene..………………………………………………...2 Firewood……………….……..…....................................................3 Charcoal……………….….….. ………………………………………4 Dung…………..….….....................................................................5 Electricity (mains)………..……………………………………….…..6 Leaves/bushes/grass…………………………………………………7 Other______________________________________________ 8 ( SPECIFY)
205 What is the main source of heating for his house in the winter? No heating in the house……………………………………………...0 Electric heater…………………………………………………………1 Gas heater…………………………………………………………….2 Kerosene heater………………………………………………………3 Firewood………………………………………………………………4 Stoves burning straw, ping or manure……………………………..5 Charcoal………………………………………………………………6 Leaves/bushes/grass…………………………………………………7 Other______________________________________________8 (SPECIFY)
206 What kind of toilet facility do people in your house mainly use? RECORD THE ANSWER GIVEN, OR WRITE IN IF “OTHER”
Defecation in field/outside the house............................................0 Traditional Pit…………………………………………………….…...1 Ordinary Vault latrine…………… …..………………………….…...2 Improved Vault latrine…………… …………....…………………...3 Flush……………………………………………………………….….4

97
Other______________________________________________ 5 (SPECIFY)
207 Is the Latrine located within the compound of the household?
No………………………………………………………………………0 Yes……………………………………………………………………..1
208 Does any member of YOUR household own any of the following? READ EACH CHOICE AND MARK 1 OR 2
NO YES
208A A sewing machine 0 1 208B A clock or watch 0 1 208C A kerosene lamp 0 1 208D Gold jewelry 0 1 208E A pressure cooker 0 1 208F A radio 0 1 208G A television 0 1 208H A bicycle 0 1 208I A motorbike 0 1 208J A electricity generator 0 1 208K A car 0 1 208L A tractor 0 1 208M A refrigerator 0 1 III. HEALTH CARE UTILIZATION 301 Are you aware of a Community Health Worker (CHW) or a
CHW Health post in your community? No………………………………………………………………………0 Yes……………………………………………………………………..1DK……………………………………………………………..……….8
308 308
302 How many CHWs are there in your community? NUMBER OF CHWs _________ DK…………………………………………………………………. 98
303 Is this person(s) male, female or are both present? Female……………………...………………………………….………0 Male……………………….……………………………………………1 Both…………………………………………………………….………2
304 Have you or your family members used his/her services in the past three months?
No………………………………………………………………………0 Yes……………………………………………………………………..1DK……………………………………………………………..……….8
306 306
305 What services did you receive? Anything else? RECORD ALL SERVICES MENTIONED BY THE MOTHER GO TO Q. 307 AFTER THIS QUESTION
Health education……………………………………………………...A Treatment for illness/injury….………………………………..…......B Family Planning……………………………………………….…......C Ante-natal care………………………………………………..……...D Post-natal care………………………………………………..….......E ORS……………………………………………………………….......F Vitamin A…………………………………………………………......G Referral to health facility……………………………………………..H Other _____________________________________________ I (SPECIFY)
306 What were the reasons for not using CHW services? RECORD ALL THAT APPLY
No one was sick/no need……………………………………………………………....……A Not knowledgeable…………………………………………………...B Poor quality of services………………………………………..….…C No drugs…………………………………………………..................D No equipment…………………………………………………...........E CHW not female………………………………………………….......F Health post too far……………………………………………………G Family member objected…………………………………………….H Illness too severe……………………………………………………..I Other ______________________________________________J (SPECIFY)
307 I am going to read you a statement about what you think of the CHWs in your community. Please consider the following statement carefully. Choose the answer that best reflects your opinion. Would you say you Strongly Disagree, Somewhat Disagree, Somewhat Agree or Strongly Agree with this statement? There are no right or wrong answers. “The CHWs provide a useful service to the community. Do you Strongly Disagree, Somewhat Disagree, Somewhat Agree or Strongly Agree with this statement?”
Strongly Disagree.……………………………………………………1 Somewhat Disagree………………………………………………….2 Somewhat Agree……………………………………………………..3 Strongly Agree……..…………………………………………………4

98
308 How long does it take you to travel from your home to the nearest health facility (one way)? ENSURE THAT THIS TRAVEL TIME IS TO THE HEALTH FACILITY, NOT TO THE CHW OR HEALTH POST. CODE “98” IF THE PERSON DOES NOT KNOW.
DAYS ___________ HOURS ___________ MINUTES ___________ DK…………………………………………………………………….98
309 What is your normal mode of transport to the facility? RECORD ALL THAT APPLY NOTE: IF “A” OTHER CHOICES ARE NOT ALLOWED.
I have never been……………………………………………………A By foot……………………………………………………..…………..B By Bus…………………………………………………………………C By Car……………………………………………………………..…..D Other _____________________________________________ E (SPECIFY)
310 I am going to read you a statement about what you think of the nearest health facility. Please consider the following statement carefully based on what you have experienced yourself or what you have heard from someone else. Choose the answer that best reflects your opinion. Would you say you Strongly Disagree, Somewhat Disagree, Somewhat Agree or Strongly Agree with this statement? There are no right or wrong answers. “The health facility provides a useful service to the community. Do you Strongly Disagree, Somewhat Disagree, Somewhat Agree or Strongly Agree with this statement”
Strongly Disagree.……………………………………………………1 Somewhat Disagree………………………………………………….2 Somewhat Agree……………………………………………………..3 Strongly Agree……..…………………………………………………4 DK………………………………………………………………………8
311 Have you ever been to the facility yourself? No………………………………………………………………………0 Yes……………………………………………………………………..1
312 Is there a shura-e-sehie in your community No………………………………………………………………………0 Yes……………………………………………………………………..1DK……………………………………………………………..……….8
314 314
313 I am going to read you a statement about what you think of the shura-e-sehie in your community. Please consider the following statement carefully. Choose the answer that best reflects your opinion. Would you say you Strongly Disagree, Somewhat Disagree, Somewhat Agree or Strongly Agree with this statement? There are no right or wrong answers. “The shura-e-sehie provides a useful service to the community. Do you Strongly Disagree, Somewhat Disagree, Somewhat Agree or Strongly Agree with this statement?”
Strongly Disagree.……………………………………………………1 Somewhat Disagree………………………………………………….2 Somewhat Agree……………………………………………………..3 Strongly Agree……..…………………………………………………4 DK………………………………………………………………………8
314 I am going to read you a statement about the availability of heath services. Please consider the following statement carefully. Choose the answer that best reflects your opinion. “Would you say that availability of health services are Alot Worse, Somewhat Worse, Are the Same, Somewhat Improved or A lot improved compared to 3 years ago? “
Alot worse………………………………………………………….….1 Somewhat worse…………………………………………………..…2 Are the same…………………………………………………….……3 Somewhat improved………………………………………………….4 A lot improved…………………………………………………………5 DK………………………………………………………………………8

99
2006 AFGHANISTAN HOUSEHOLD SURVEY
Ministry of Public Health, Islamic Republic of Afghanistan
Johns Hopkins University
INDIVIDUAL WOMAN’S QUESTIONNAIRE
Interview Visits
Interviewer Team Code |___|___| Time (at beginning of interview): |___|___|:|___|___|
Interviewer Code |___|___| Time (at end of interview): |___|___| : |___|___|
Date of interview : |___||___| |___||___| |___||___||___||___|
Month Day Year
Result: |___| Codes: 1.Completed 2. Not at home 3. Partly completed 4. Refused 5. Incapacitated 6. Other_____________________(SPECIFY)
Identification
Unique Code |_6|___|___|___|___|___| Province Name District Name Name of village Nahia |___|___| Block No. |___|___|
Cluster Number |___|___||___|
Dwelling Number |___|___|
Household number inside Compound |___|___|
Name of Household Head Name and Line number of Respondent of Household Roster. _________________ |___|___|
For Office Use Only
GROUP CODE
1=PPA 2=SM 3=EC 4=REACH 5=Other
|___|
Province Code |___|___|
District Code |___|___|___|___|
Geocode |___|___|___|___|___|___|___|___|___||___|___|___|___|
Superviser Code : |___|___| Supervisor Name & Signature:
Field Editor Code : |___|___| Field Editor Name & Signature:

100
MODULE IV: RESPONDENT’S BACKGROUND First, I would like to ask you some questions about you and your household.
401 For most of the time until you were 10 years old, did you live in a city, in a town or in the countryside?
City………………………………………………1 Town…………………………………………….2 Countryside…………………………..…………3
402 How long have you been living continuously in (NAME OF CURRENT PLACE OF RESIDENCE)? IF LESS THAN ONE YEAR, RECORD “00” YEARS
Years _______ Always…………………………………………95
IF “ALWAYS” SKIP TO
404
403 Just before you moved here, where did you live? Rural Afghanistan……………………………...1 Urban Afghanistan……………………………..2 Outside of Afghanistan………………………..3
404 In what month and year were you born? Month _______ DK Month……………………………………98 Year _______ DK Year…………………………………….9998
405 How old were you at your last birthday? COMPARE AND CORRECT 404/405 AND 105 IF INCONSISTENT.
Age in completed years _________ DK……………………………………………98
406 Can you read a letter? No………………………………………………..0 Yes ……………………………………………...1
408
407 Now, I would like you to read this sentence out for me. SHOW THE CARD TO THE RESPONDENT IF RESPONDENT CANNOT READ WHOLE SENTENCE, PROBE: Can you read any part of the sentence to me?
Cannot read at all………………………..…….1 Able to read only part of sentence…………...2 Able to read whole sentence………………….3 No card with required language____________________________4 (SPECIFY LANGUAGE)
408 Do you listen to the radio almost every day, at least once a week, less than once a week or not at all? (Circle only one)
Almost every day………………………………1 At least once a week…………………………..2 Less than once a week………………………..3 Not at all………………………………………...4
409 Do you watch television almost every day, at least once a week, less than once a week or not at all? (Circle only one)
Almost every day………………………………1 At least once a week…………………………..2 Less than once a week………………………..3 Not at all………………………………………...4
MODULE V: REPRODUCTION 501 Are you currently married or previously married but currently widowed, previously
married but currently divorced or separated? Never married…………………………………1 Currently Married………………………………2 Previously married but widowed……………..3 Previously married but divorced/separated…4
801
503 503
502 Can you please give me the name of your husband? RECORD NAME AND LINE NUMBER OF HUSBAND FROM HOUSEHOLD LISTING FORM
NAME ______________ LINE NO. ___________
503 At what age did you get married?
Age _________ DK……………………………………………..98
504 Now I would like to ask about all the births you have had during your life. Have you ever given birth?
No………………………………………………..0 Yes ……………………………………………...1
509
505 Do you have any sons or daughters to whom you have given birth who are now living with you?
No………………………………………………..0 Yes ……………………………………………...1
507
506 How many sons live with you? And how many daughters live with you? IF NONE, RECORD ‘00’
Sons at home _____ Daughters at home _____ Total _____
507 Do you have any sons or daughters to whom you have given birth who are now living elsewhere?
No………………………………………………..0 Yes ……………………………………………...1
509

101
508 How many sons are alive but do not live with you? And how many daughters are alive but do not live with you?
Sons Elsewhere _____ Daughters Elsewhere _____ Total Elsewhere _____
509 Have you ever given birth to a boy or a girl who was born alive but later died? IF NO, PROBE: Was there any baby who cried or showed any sign of life but only survived a few minutes or a few hours or a few days?
No………………………………………………..0 Yes ……………………………………………...1
511
510 How many boys have died? And how many girls have died? IF NONE, RECORD ‘00’.
Sons Died _____ Daughters Died _____ Total Died _____
511 SUM ANSWERS OF THE TOTALS IN 506, 508, AND 510, AND ENTER TOTAL IF NONE, RECORD ‘00’
Total ________
512 Just to make sure that I have this right: you have had in total (REPEAT NUMBER FROM Q.511) births during your life. Is that correct? IF “NO” PROBE AND CORRECT Q.505-Q.510 AS NECESSARY
No………………………………………………..0 Yes ……………………………………………...1
513 PLEASE RECORD FROM Q.501 IF RESPONDENT IS CURRENTLY MARRIED No………………………………………………..0 Yes ……………………………………………...1
605
MODULE V: CONTRACEPTION 601 Are you pregnant now? No……………………………………………….0
Yes ……………………………………………..1 Unsure………………………………………….2
602 B
602 B 602A How many months pregnant are you?
Months _____ DK……………………………………………...98
Now I would like tot talk about family planning – the various ways or methods that a couple can use to delay or avoid pregnancy. 602B Have you heard or know about any method to delay or avoid getting pregnant?
IF YES, What are they? Anything else? RECORD ALL MENTIONED NOTE: IF ‘A’ IS CHOSEN BY THE RESPONDENT, OTHER CHOICES CANNOT BE CHOSEN
Do not know any method…………………….A Female sterilization……………………………B IUD……………..……………………………….C Pill……………………………………………….D Injections……………………………………….E Condom…………………………………………F Lactational Amenorreah method...…………..G Periodic abstinence…………………………...H Withdrawal……………………………………..I Other_______________________________J (SPECIFY)
603A CHECK WITH Q.601 IF THE RESPONDENT IS CURRENTLY PREGNANT No or Unsure……………………….…………0 Is Pregnant……………………………..……..1
605
603B Are you currently doing something or using any method to delay or avoid getting pregnant?
No………………………………………………..0 Yes ……………………………………………...1
605
604 Which method are you using? RECORD ALL MENTIONED
Female sterilization……………………………A IUD……………..……………………………….B Pill……………………………………………….C Injections……………………………………….D Condom…………………………………………E Lactational Amenorreah method...…………..F Periodic abstinence…………………………...G Withdrawal……………………………………..H Other_______________________________I (SPECIFY)
605 CHECK TOTAL IN Q.511 AND CIRCLE THE APPROPRIATE CHOICE No Births………………………………………..0 One or more births….…………………………1
801

102
MODULE VII: PRENATAL Now I would like to ask you a question about all the deliveries you had in the last two years 701 Did you have a delivery in the last two years? No……………………………………………..0
Yes …………………………………………...1 801
Now, we will talk about each of your deliveries separately. LAST BIRTH NEXT-TO-LAST BIRTH NEXT-TO-NEXT –TO LAST
BIRTH 702 Can you please give me the month and
year for your most recent (next recent) delivery? WRITE “98” IF DK FOR MONTH. YOU NEED AN ESTIMATE FOR YEAR OF BIRTH
Month _______ Year _______
Month _______ Year _______
Month _______ Year _______
703 Is this child currently alive? No………………………….…...0 (GO TO Q.705 ) Yes……………………………...1
No………………………….…...0 (GO TO Q.705 ) Yes……………………………...1
No………………………….…...0 (GO TO Q.705 ) Yes……………………………...1
704 IF ALIVE IN 703, GET NAME What is the name of this child? AND RECORD LINE NUMBER FROM HOUSEHOLD LISTING
Name _______________ Line No. ________
Name _______________ Line No. ________
Name _______________ Line No. ________
705 Did you see anyone for antenatal care for this pregnancy? IF YES: Whom did you see? Anyone else? PROBE FOR THE TYPE OF PERSON AND RECORD ALL PERSONS MENTIONED
Doctor………………….……..A Midwife…………………..…...B Nurse...…………...................C CHW………..………….……..D TBA……………………..…….E Other_________________ X (SPECIFY) No one………………………..F (IF “NO ONE” SKIP TO 715)
Doctor………………….……..A Midwife…………………..…...B Nurse...…………...................C CHW………..………….……..D TBA……………………..…….E Other_________________ X (SPECIFY) No one………………………..F (GO TO Q. 722 AFTER THIS QUESTION )
Doctor………………….……..A Midwife…………………..…...B Nurse...…………...................C CHW………..………….……..D TBA……………………..…….E Other_________________ X (SPECIFY) No one………………………..F (GO TO Q. 722 AFTER THIS QUESTION )
706 How many months pregnant were you when you first received antenatal care for this pregnancy?
Months…………………______ DK…………………………….98
707 How many times did you see someone for care during the pregnancy?
NO. OF TIMES ________ DK……………………………..98
708 CHECK 707: NUMBER OF TIMES RECEIVED ANTENATAL CARE
Once…………………………….1 (GO TO Q.710 ) More than Once………………..2
709 How many months pregnant were you the last time you received antenatal care?
Months…………………______ DK…………………………….98
710 During this pregnancy, were any of the following done at least once?
NO YES
Were you weighed? Weight 0 1 Was your height measured? Height 0 1 Counseled on breastfeeding? Breastfeeding 0 1 Counseled on EPI? EPI 0 1 Counseled on child spacing? Child Spacing 0 1 Was your blood pressure measured? Blood Pressure 0 1 Did you give a urine sample? Urine Sample 0 1 Did you give a blood sample? Blood Sample 0 1
711 Were you told about the signs of pregnancy complications?
No……………………….…….0 (GO TO Q.713) Yes…………………………....1 DK………………………….…8 (GO TO Q.713)
712A Were you told where to go if you had these complications?
No……………………….…….0 Yes…………………………....1 DK………………………….…8

103
712B Do you know of symptoms during pregnancy that indicate the need to seek care? IF YES, what are they? Anything else? RECORD ALL MENTIONED.
Don’t know……………………A Fever………………………….B Shortness of breath…………C Bleeding………………………D Swelling of the Body/hands/face……………E Headaches……………………F Blurred vision…………………G Other___________________H x (SPECIFY)
713 During this pregnancy, did you receive an injection in the arm to prevent the baby from getting tetanus, that is, convulsions after birth?
No……………………….…….2 (GO TO Q.715 ) Yes…………………………....1 DK………………………….…8 (GO TO Q.715 )
714 How many doses/injections did you receive?
No. of doses ________
715 Do you have a maternal health card for your pregnancy?
YES, SEEN……………..….…..1 HAS, BUT NOT SEEN………..2 (GO TO Q.718 ) NEVER HAD A CARD…….….3 (GO TO Q.718)
716 LOOK AT THE CARD AND RECORD THE NUMBER OF PRENATAL VISITS WHILE MOTHER WAS PREGNANT WITH (NAME). IF MOTHER HAD VISITS YET SAID “NO ONE” IN Q.705, PROBE AND CORRECT Q.705-713 AS NECESSARY)
No. of visits _________
717 LOOK AT THE CARD AND RECORD THE DATES FOR EACH TT INJECTION LISTED ON THE CARD DAY MO YEAR
1ST
2ND
3RD
4TH
5TH
6TH
718 During this pregnancy, were you given or did you buy any iron tablets or iron syrup? SHOW TABLET/SYRUP
No……………………….…….0 (GO TO Q.720 ) Yes…………………………....1 DK………………………….…8 (GO TO Q.720 )
719 During the whole pregnancy, for how many days did you take tablets or syrup?
Number of Days __ __ __ DK……………………………998
720 During this pregnancy, did you take any drugs to prevent you from getting malaria?
No……………………….…….0 (GO TO Q. 722 ) Yes…………………………....1 DK………………………….…8 (GO TO Q. 722 )
721 What drugs did you take? RECORD ALL MENTIONED. IF TYPE OF DRUG IS NOT DETERMINED, SHOW TYPICAL ANTI-MALARIAL DRUG TO RESPONDENT
Fansidar………………………..A Chloroquin……………………..B Unknown drug…………………C Other____________________D (SPECIFY)

104
722 Who was the primary person to assist with this delivery?
No one…………………………0 Doctor……………….………….1 Midwife……………………..…..2 Nurse………………...…………3 CHW…………….………….….4 TBA……..……………………...5 Relative/Neighbor/ Friend………………………….6 Other_______________ ____7 (SPECIFY)
No one…………………………0 Doctor……………….………….1 Midwife……………………..…..2 Nurse………………...…………3 CHW…………….………….….4 TBA……..……………………...5 Relative/Neighbor/ Friend………………………….6 Other_______________ ____7 (SPECIFY)
No one…………………………0 Doctor……………….………….1 Midwife……………………..…..2 Nurse………………...…………3 CHW…………….………….….4 TBA……..……………………...5 Relative/Neighbor/ Friend………………………….6 Other_______________ ____7 (SPECIFY)
723 What was the site of your last delivery (next-to-last delivery, next-to-next to last delivery)?
Hospital……………..……..….1 (GO TO Q.724 ) Public Health Facility…………2 (GO TO Q.724 ) Private Health facility………...3 (GO TO Q.724 ) At own, neighbor’s or relative’s home…………..……….……..4 (GO TO Q.725 ) Other ___________________5 (SPECIFY) (GO TO Q.725 )
Hospital……………..……..….1 Health Center…………………2 Private health facility………...3 At own, neighbor’s or relative’s home…………..……….……..4 Other ___________________5 (GO TO Q.727 AFTER THIS QUESTION )
Hospital……………..……..….1 Health Center…………………2 Private health facility………...3 At own, neighbor’s or relative’s home…………..……….……..4 Other ___________________5 (GO TO Q.801 AFTER THIS QUESTION )
724 What made you decide to deliver at (READ THE SITE OF DELIVERY). RECORD ALL THAT APPLY GO TO Q. 726 AFTER THIS QUESTION
CHW referred me……………...A Husband told me .......………...B Told by doctor at clinic………..C Received good care during last visit……………………………..D Complications during last delivery........……………………E Other____________________F (SPECIFY)
725 What made you decide to deliver at (READ THE SITE OF DELIVERY)? RECORD ALL THAT APPLY
Feel comfortable delivering at home……………………..……..A Lack of transport......................B Cannot afford cost of transport………………………..C Cannot afford cost of treatment/cost to high…………D The quality of available services is low……………………………E Facility too far………………….F Afraid to go to facility because of security……………………...G Other ___________________H (SPECIFY)
726 Who made the decision about where you should deliver? Anyone else? RECORD ALL THAT APPLY
Yourself…...……………………A Husband………..………………B Your mother……………………C Mother-in-law……………….….D Father-in-law…………………...E Friends/neighbors………….….F CHW…………………………...G OTHER _________________ H (SPECIFY)
727 Did you give birth to any other child besides this one in the last two years?
No……………………….…….0 Yes…………………………....1 (IF “YES” GO TO Q. 702 OF NEXT-TO-LAST BIRTH COLUMN)
No……………………….…….0 Yes…………………………....1 (IF “YES” GO TO Q.702 OF NEXT-TO-NEXT TO LAST BIRTH COLUMN)

105
MODULE VII: IMMUNIZATION AND CHILD HEALTH (LESS THAN 5 YRS OLD) PLEASE RECORD ONLY FOR CHILDREN AGED 5 YRS OR LESS FROM THE HOUSEHOLD LISTING. 801 Do you have any children that less than 5 yrs of age or are you the primary
caretaker for a young child less than 5 yrs of age that is not your own, for example a child whose mother has died? CONFIRM IF SHE HAS ANY CHILD LESS THAN 5 YRS BY LOOKING AT Q.105B FOR CHILD’S AGE AND Q.107 AND Q.108 IS SHE IS THE APPROPRIATE MOTHER
No………………………………………………………….……….…0 (IF “NO” GO TO THE END THE INTERVIEW) Yes ……………………………………………………..…………….1
Now, I would like to ask you some questions about the health of all your children between 0-59 months of age. We will talk about each one separately. Let’s start with the youngest child YOUNGEST CHILD SECOND
YOUNGEST CHILD THIRD YOUNGEST
CHILD FOURTH
YOUNGEST CHILD FIFTH YOUNGEST
CHILD 802 What is the child’s Name? RECORD
CORRESPONDING LINE NO. FROM HOUSEHOLD LISTING
Name ____________ Line No. __________
Name ____________ Line No. __________
Name ____________ Line No. __________
Name ____________ Line No. __________
Name ____________ Line No. __________
803 SEX OF (NAME)
Female……………….0 Male………………..…1
Female……………….0 Male………………..…1
Female……………….0 Male………………..…1
Female……………….0 Male………………..…1
Female……………….0 Male………………..…1
804 What is the date of birth of (NAME). CHECK WITH Q.105. IF “DK” CODE “98” FOR MONTH . YOU MUST GET AN ESTIMATE FOR YEAR OF BIRTH. DO NOT ACCEPT “DK”
MO YEAR MO YEAR MO YEAR MO YEAR MO YEAR
805 Does (NAME) have an immunization card? IF YES, could you show it to me?
Yes, Seen……………..1 Yes, Not Seen.………..2 (GO TO 808 ) Never had card……….3 (GO TO 808 )
Yes, Seen……………..1 Yes, Not Seen.………..2 (GO TO 808 ) Never had card……….3 (GO TO 808 )
Yes, Seen……………..1 Yes, Not Seen.………..2 (GO TO 808 ) Never had card……….3 (GO TO 808 )
Yes, Seen……………..1 Yes, Not Seen.………..2 (GO TO 808 ) Never had card……….3 (GO TO 808 )
Yes, Seen……………..1 Yes, Not Seen.……..2 (GO TO 808 ) Never had card……….3 (GO TO 808 )
806 COPY DATES FOR EACH VACCINE FROM THE CARD. WRITE “44” IN DAY COLUMN IF CARD SHOWS THAT A VACCINATION WAS GIVEN, BUT NO DATE IS RECORDED
DAY MO YEAR DAY MO YEAR DAY MO YEAR DAY MO YEAR DAY MO YEAR
BCG OPV0 OPV1 OPV2 OPV3 DPT1 DPT2 DPT3 MEASLES

106
YOUNGEST CHILD SECOND
YOUNGEST CHILD THIRD YOUNGEST
CHILD FOURTH
YOUNGEST CHILD FIFTH YOUNGEST
CHILD 807 Has (NAME) received any vaccinations
that are not recorded on this card? For example, any vaccinations received in a national immunization day campaign?
No………………….…..0 (GO TO Q.815 ) Yes……………...…......1 (GO TO Q.809 ) DK….…………………..8 (GO TO Q.815 )
No………………….…..0 (GO TO Q.815 ) Yes……………...…......1 (GO TO Q.809 ) DK….…………………..8 (GO TO Q.815 )
No………………….…..0 (GO TO Q.815 ) Yes……………...…......1 (GO TO Q.809 ) DK….…………………..8 (GO TO Q.815 )
No………………….…..0 (GO TO Q.815 ) Yes……………...…......1 (GO TO Q.809 ) DK….…………………..8 (GO TO Q.815 )
No………………….…..0 (GO TO Q.815 ) Yes……………...…......1 (GO TO Q.809 ) DK….…………………..8 (GO TO Q.815 )
808 Did (NAME) ever receive any vaccinations to prevent him/her from getting diseases, including vaccinations received in a national immunization day campaign?
No………………….…..0 (GO TO Q.815 ) Yes……………...…......1 DK….…………………..8 (GO TO Q.815 )
No………………….…..0 (GO TO Q.815 ) Yes……………...…......1 DK….…………………..8 (GO TO Q.815 )
No………………….…..0 (GO TO Q.815 ) Yes……………...…......1 DK….…………………..8 (GO TO Q.815 )
No………………….…..0 (GO TO Q.815 ) Yes……………...…......1 DK….…………………..8 (GO TO Q.815 )
No………………….…..0 (GO TO Q.815 ) Yes……………...…......1 DK….…………………..8 (GO TO Q.815 )
809 Has (NAME) ever been given BCG vaccination against tuberculosis – i.e. an injection in the left shoulder that caused a scar? (CHECK FOR SCAR MARK)
No………………….…..0 Yes……………...…......1 DK….…………………..8
No………………….…..0 Yes……………...…......1 DK….…………………..8
No………………….…..0 Yes……………...…......1 DK….…………………..8
No………………….…..0 Yes……………...…......1 DK….…………………..8
No………………….…..0 Yes……………...…......1 DK….…………………..8
810 Has (NAME) ever been given any ‘vaccination drops in the mouth’ to protect him/her from getting polio?
No………………….…..0 (GO TO Q.812 ) Yes……………...…......1 DK….…………………..8 (GO TO Q.812 )
No………………….…..0 (GO TO Q.812 ) Yes……………...…......1 DK….…………………..8 (GO TO Q.812 )
No………………….…..0 (GO TO Q.812 ) Yes……………...…......1 DK….…………………..8 (GO TO Q.812 )
No………………….…..0 (GO TO Q.812 ) Yes……………...…......1 DK….…………………..8 (GO TO Q.812 )
No………………….…..0 (GO TO Q.812 ) Yes……………...…......1 DK….…………………..8 (GO TO Q.812 )
811 How many times has (NAME) been given these drops?
TIMES ______ TIMES ______ TIMES ______ TIMES ______ TIMES ______
812 Has (NAME) ever been given ‘vaccination injections’ – i.e. an injection in the mid-outer surface of thigh – to prevent him/her from getting DPT (tetanus, whooping cough, diphtheria)?
No………………….…..0 (GO TO Q.814 ) Yes……………...…......1 DK….…………………..8 (GO TO Q.814 )
No………………….…..0 (GO TO Q.814 ) Yes……………...…......1 DK….…………………..8 (GO TO Q.814 )
No………………….…..0 (GO TO Q.814 ) Yes……………...…......1 DK….…………………..8 (GO TO Q.814 )
No………………….…..0 (GO TO Q.814 ) Yes……………...…......1 DK….…………………..8 (GO TO Q.814 )
No………………….…..0 (GO TO Q.814 ) Yes……………...…......1 DK….…………………..8 (GO TO Q.814 )
813 How many times has (NAME) been given these injections? TIMES ______ TIMES ______ TIMES ______ TIMES ______ TIMES ______
814 Has (NAME) ever been given ‘vaccination injections’ – i.e. a shot in the outer part of the upper right arm at the age of 9 months are older – to prevent him/her from getting measles?
No………………….…..0 Yes……………...…......1 DK….…………………..8
No………………….…..0 Yes……………...…......1 DK….…………………..8
No………………….…..0 Yes……………...…......1 DK….…………………..8
No………………….…..0 Yes……………...…......1 DK….…………………..8
No………………….…..0 Yes……………...…......1 DK….…………………..8
815 Has (NAME) received Vitamin A capsule within the last 6 months? SHOW RED/GREEN VIT-A CAPSULE
No………………….…..0 Yes……………...…......1 DK….…………………..8
No………………….…..0 Yes……………...…......1 DK….…………………..8
No………………….…..0 Yes……………...…......1 DK….…………………..8
No………………….…..0 Yes……………...…......1 DK….…………………..8
No………………….…..0 Yes……………...…......1 DK….…………………..8
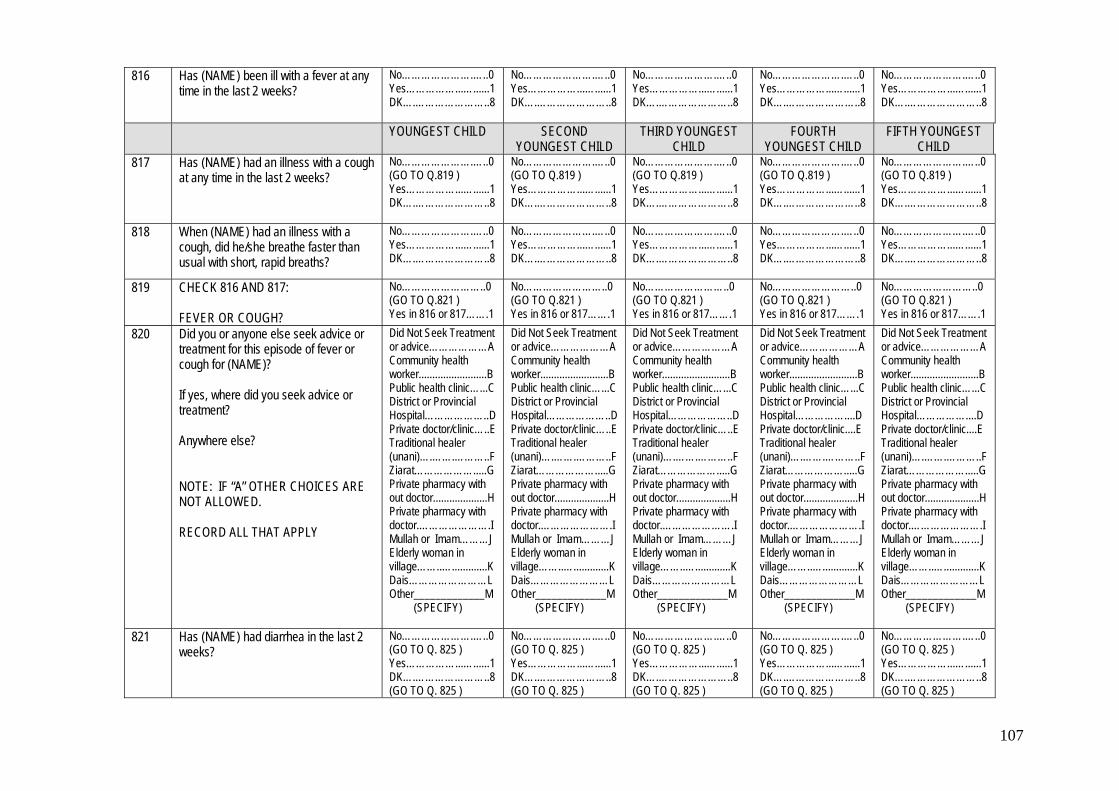
107
816 Has (NAME) been ill with a fever at any time in the last 2 weeks?
No………………….…..0 Yes……………...…......1 DK….…………………..8
No………………….…..0 Yes……………...…......1 DK….…………………..8
No………………….…..0 Yes……………...…......1 DK….…………………..8
No………………….…..0 Yes……………...…......1 DK….…………………..8
No………………….…..0 Yes……………...…......1 DK….…………………..8
YOUNGEST CHILD SECOND YOUNGEST CHILD
THIRD YOUNGEST CHILD
FOURTH YOUNGEST CHILD
FIFTH YOUNGEST CHILD
817 Has (NAME) had an illness with a cough at any time in the last 2 weeks?
No………………….…..0 (GO TO Q.819 ) Yes……………...…......1 DK….…………………..8
No………………….…..0 (GO TO Q.819 ) Yes……………...…......1 DK….…………………..8
No………………….…..0 (GO TO Q.819 ) Yes……………...…......1 DK….…………………..8
No………………….…..0 (GO TO Q.819 ) Yes……………...…......1 DK….…………………..8
No………………….…..0 (GO TO Q.819 ) Yes……………...…......1 DK….…………………..8
818 When (NAME) had an illness with a cough, did he/she breathe faster than usual with short, rapid breaths?
No………………….…..0 Yes……………...…......1 DK….…………………..8
No………………….…..0 Yes……………...…......1 DK….…………………..8
No………………….…..0 Yes……………...…......1 DK….…………………..8
No………………….…..0 Yes……………...…......1 DK….…………………..8
No………………….…..0 Yes……………...…......1 DK….…………………..8
819 CHECK 816 AND 817: FEVER OR COUGH?
No……………………..0 (GO TO Q.821 ) Yes in 816 or 817…….1
No……………………..0 (GO TO Q.821 ) Yes in 816 or 817…….1
No……………………..0 (GO TO Q.821 ) Yes in 816 or 817…….1
No……………………..0 (GO TO Q.821 ) Yes in 816 or 817…….1
No……………………..0 (GO TO Q.821 ) Yes in 816 or 817…….1
820 Did you or anyone else seek advice or treatment for this episode of fever or cough for (NAME)? If yes, where did you seek advice or treatment? Anywhere else? NOTE: IF “A” OTHER CHOICES ARE NOT ALLOWED. RECORD ALL THAT APPLY
Did Not Seek Treatment or advice………………A Community health worker.........................B Public health clinic…...C District or Provincial Hospital………………..D Private doctor/clinic…..E Traditional healer (unani)….…….………..F Ziarat……………….....G Private pharmacy with out doctor....................H Private pharmacy with doctor.………………….I Mullah or Imam………J Elderly woman in village……..….............K Dais……………………L Other_____________M (SPECIFY)
Did Not Seek Treatment or advice………………A Community health worker.........................B Public health clinic…...C District or Provincial Hospital………………..D Private doctor/clinic…..E Traditional healer (unani)….…….………..F Ziarat……………….....G Private pharmacy with out doctor....................H Private pharmacy with doctor.………………….I Mullah or Imam………J Elderly woman in village……..….............K Dais……………………L Other_____________M (SPECIFY)
Did Not Seek Treatment or advice………………A Community health worker.........................B Public health clinic…...C District or Provincial Hospital………………..D Private doctor/clinic…..E Traditional healer (unani)….…….………..F Ziarat……………….....G Private pharmacy with out doctor....................H Private pharmacy with doctor.………………….I Mullah or Imam………J Elderly woman in village……..….............K Dais……………………L Other_____________M (SPECIFY)
Did Not Seek Treatment or advice………………A Community health worker.........................B Public health clinic…...C District or Provincial Hospital……………....D Private doctor/clinic....E Traditional healer (unani)….…….………..F Ziarat……………….....G Private pharmacy with out doctor....................H Private pharmacy with doctor.………………….I Mullah or Imam………J Elderly woman in village……..….............K Dais……………………L Other_____________M (SPECIFY)
Did Not Seek Treatment or advice………………A Community health worker.........................B Public health clinic…...C District or Provincial Hospital……………....D Private doctor/clinic....E Traditional healer (unani)….…….………..F Ziarat……………….....G Private pharmacy with out doctor....................H Private pharmacy with doctor.………………….I Mullah or Imam………J Elderly woman in village……..….............K Dais……………………L Other_____________M (SPECIFY)
821 Has (NAME) had diarrhea in the last 2 weeks?
No………………….…..0 (GO TO Q. 825 ) Yes……………...…......1 DK….…………………..8 (GO TO Q. 825 )
No………………….…..0 (GO TO Q. 825 ) Yes……………...…......1 DK….…………………..8 (GO TO Q. 825 )
No………………….…..0 (GO TO Q. 825 ) Yes……………...…......1 DK….…………………..8 (GO TO Q. 825 )
No………………….…..0 (GO TO Q. 825 ) Yes……………...…......1 DK….…………………..8 (GO TO Q. 825 )
No………………….…..0 (GO TO Q. 825 ) Yes……………...…......1 DK….…………………..8 (GO TO Q. 825 )
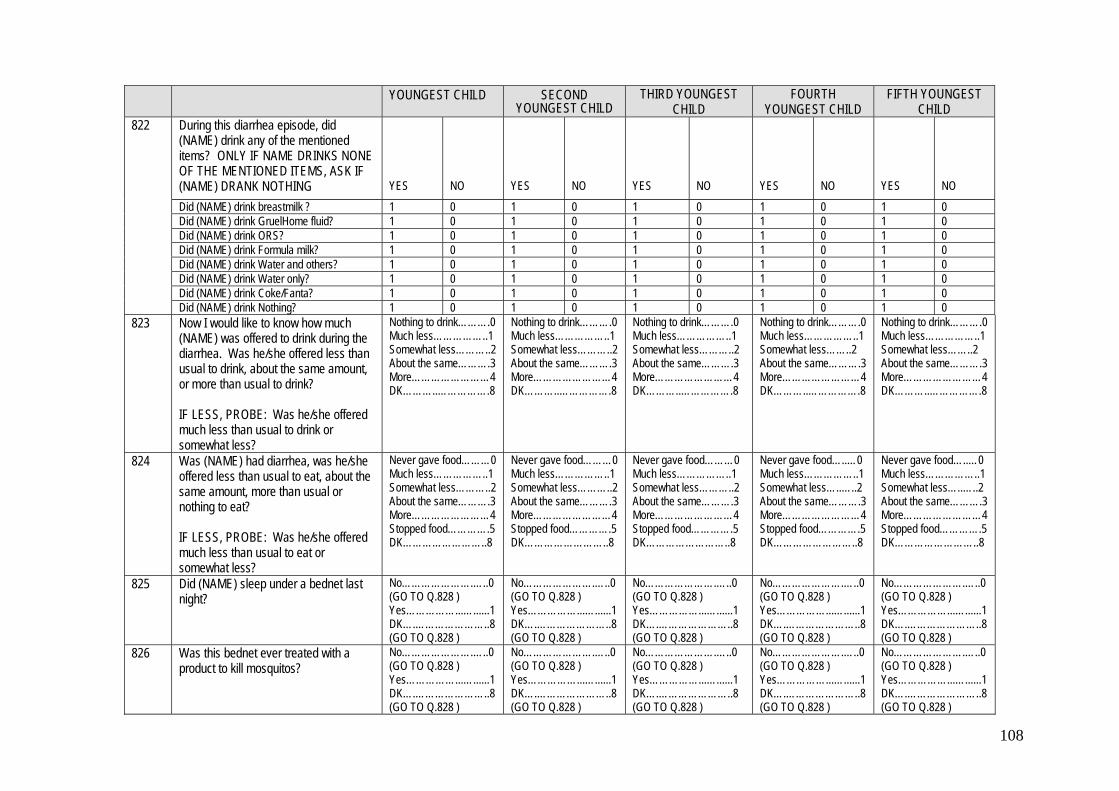
108
YOUNGEST CHILD SECOND
YOUNGEST CHILD THIRD YOUNGEST
CHILD FOURTH
YOUNGEST CHILD FIFTH YOUNGEST
CHILD 822 During this diarrhea episode, did
(NAME) drink any of the mentioned items? ONLY IF NAME DRINKS NONE OF THE MENTIONED ITEMS, ASK IF (NAME) DRANK NOTHING
YES
NO
YES
NO
YES
NO
YES
NO
YES
NO
Did (NAME) drink breastmilk ? 1 0 1 0 1 0 1 0 1 0 Did (NAME) drink GruelHome fluid? 1 0 1 0 1 0 1 0 1 0 Did (NAME) drink ORS? 1 0 1 0 1 0 1 0 1 0 Did (NAME) drink Formula milk? 1 0 1 0 1 0 1 0 1 0 Did (NAME) drink Water and others? 1 0 1 0 1 0 1 0 1 0 Did (NAME) drink Water only? 1 0 1 0 1 0 1 0 1 0 Did (NAME) drink Coke/Fanta? 1 0 1 0 1 0 1 0 1 0 Did (NAME) drink Nothing? 1 0 1 0 1 0 1 0 1 0
823 Now I would like to know how much (NAME) was offered to drink during the diarrhea. Was he/she offered less than usual to drink, about the same amount, or more than usual to drink? IF LESS, PROBE: Was he/she offered much less than usual to drink or somewhat less?
Nothing to drink……….0 Much less……………..1 Somewhat less………..2 About the same……….3 More……………………4 DK………..…………….8
Nothing to drink……….0 Much less……………..1 Somewhat less………..2 About the same……….3 More……………………4 DK………..…………….8
Nothing to drink……….0 Much less……………..1 Somewhat less………..2 About the same……….3 More……………………4 DK………..…………….8
Nothing to drink……….0 Much less……………..1 Somewhat less……..2 About the same……….3 More……………………4 DK………..…………….8
Nothing to drink……….0 Much less……………..1 Somewhat less……..2 About the same……….3 More……………………4 DK………..…………….8
824 Was (NAME) had diarrhea, was he/she offered less than usual to eat, about the same amount, more than usual or nothing to eat? IF LESS, PROBE: Was he/she offered much less than usual to eat or somewhat less?
Never gave food………0 Much less……………..1 Somewhat less………..2 About the same……….3 More……………………4 Stopped food………….5 DK……………………..8
Never gave food………0 Much less……………..1 Somewhat less………..2 About the same……….3 More……………………4 Stopped food………….5 DK……………………..8
Never gave food………0 Much less……………..1 Somewhat less………..2 About the same……….3 More……………………4 Stopped food………….5 DK……………………..8
Never gave food…..…0 Much less……………..1 Somewhat less…..…..2 About the same……….3 More……………………4 Stopped food………….5 DK……………………..8
Never gave food…..…0 Much less……………..1 Somewhat less…..…..2 About the same……….3 More……………………4 Stopped food………….5 DK……………………..8
825 Did (NAME) sleep under a bednet last night?
No………………….…..0 (GO TO Q.828 ) Yes……………...…......1 DK….…………………..8 (GO TO Q.828 )
No………………….…..0 (GO TO Q.828 ) Yes……………...…......1 DK….…………………..8 (GO TO Q.828 )
No………………….…..0 (GO TO Q.828 ) Yes……………...…......1 DK….…………………..8 (GO TO Q.828 )
No………………….…..0 (GO TO Q.828 ) Yes……………...…......1 DK….…………………..8 (GO TO Q.828 )
No………………….…..0 (GO TO Q.828 ) Yes……………...…......1 DK….…………………..8 (GO TO Q.828 )
826 Was this bednet ever treated with a product to kill mosquitos?
No………………….…..0 (GO TO Q.828 ) Yes……………...…......1 DK….…………………..8 (GO TO Q.828 )
No………………….…..0 (GO TO Q.828 ) Yes……………...…......1 DK….…………………..8 (GO TO Q.828 )
No………………….…..0 (GO TO Q.828 ) Yes……………...…......1 DK….…………………..8 (GO TO Q.828 )
No………………….…..0 (GO TO Q.828 ) Yes……………...…......1 DK….…………………..8 (GO TO Q.828 )
No………………….…..0 (GO TO Q.828 ) Yes……………...…......1 DK….…………………..8 (GO TO Q.828 )

109
YOUNGEST CHILD SECOND
YOUNGEST CHILD THIRD YOUNGEST
CHILD FOURTH
YOUNGEST CHILD FIFTH YOUNGEST
CHILD 827 When was the bednet last treated? Months ago __ __
More than 24 months ago ............................95 Not sure.....................98
Months ago __ __ More than 24 months ago ............................95 Not sure.....................98
Months ago __ __ More than 24 months ago ............................95 Not sure.....................98
Months ago __ __ More than 24 months ago ............................95 Not sure.....................98
Months ago __ __ More than 24 months ago ............................95 Not sure.....................98
828 CHECK FROM Q.105 IN HOUSEHOLD QUESTIONNAIRE IF THE CHILD IS LESS THAN 2 YRS
Less than 2 yrs ..….1 2 yrs and older …….2 (GO TO Q.835 )
Less than 2 yrs ..….1 2 yrs and older …….2 (GO TO Q.835 )
Less than 2 yrs ..….1 2 yrs and older …….2 (GO TO Q.835 )
Less than 2 yrs ..….1 2 yrs and older …….2 (GO TO Q.835 )
Less than 2 yrs ..….1 2 yrs and older …….2 (GO TO Q.835 )
FOLLOWING QUESTIONS TO BE ASKED ONLY CHILDREN LESS THAN 2 YRS OF AGE YOUNGEST CHILD SECOND
YOUNGEST CHILD THIRD YOUNGEST
CHILD FOURTH
YOUNGEST CHILD FIFTH YOUNGEST
CHILD 829 Did you ever breastfeed (NAME)? No………………….…..0
(GO TO Q.835 ) Yes……………...…......1
No………………….…..0 (GO TO Q.835 ) Yes……………...…......1
No………………….…..0 (GO TO Q.835 ) Yes……………...…......1
No………………….…..0 (GO TO Q.835 ) Yes……………...…......1
No………………….…..0 (GO TO Q.835 ) Yes……………...…......1
830 How long after birth did you first put (NAME) to the breast?
Immediately / within first hour after birth………...1 After the first hour…….2 Don’t remember/ Don’t know……………………8
Immediately / within first hour after birth………...1 After the first hour…….2 Don’t remember/ Don’t know……………………8
Immediately / within first hour after birth………...1 After the first hour…….2 Don’t remember/ Don’t know……………………8
Immediately / within first hour after birth………..1 After the first hour…….2 Don’t remember/ Don’t know…………………..8
Immediately / within first hour after birth………..1 After the first hour…….2 Don’t remember/ Don’t know…………………..8
831 Are you currently breastfeeding (NAME)?
No………………….…..0 Yes……………...…......1 (GO TO Q.833 )
No………………….…..0 Yes……………...…......1 (GO TO Q.833 )
No………………….…..0 Yes……………...…......1 (GO TO Q.833 )
No………………….…..0 Yes……………...…......1 (GO TO Q.833 )
No………………….…..0 Yes……………...…......1 (GO TO Q.833 )
832 For how long did you breastfeed (NAME)? IF LESS THAN ONE MONTH, RECORD “00” MONTHS.
Months _______
Months _______
Months _______
Months _______
Months _______
833 Since this time yesterday till now did (NAME) receive any of the following items? PROMPT EACH ITEM. RECORD ALL THAT APPLY MEDICINE = VITAMIN / MEDICINE / ORS
YES
NO
YES
NO
YES
NO
YES
NO
YES
NO
Medicine 1 0 1 0 1 0 1 0 1 0 Liquid Food 1 0 1 0 1 0 1 0 1 0 Solid Food 1 0 1 0 1 0 1 0 1 0 Breastmilk only
(GO TO Q.835) 1 0 1 0 1 0 1 0 1 0

110
834 If solid food is given to (NAME) since this time yesterday, how many times was it given?
No. of Times _______ DK…………………….98
No. of Times _______ DK…………………….98
No. of Times _______ DK…………………….98
No. of Times _______ DK…………………….98
No. of Times _______ DK…………………….98
YOUNGEST CHILD SECOND
YOUNGEST CHILD THIRD YOUNGEST
CHILD FOURTH
YOUNGEST CHILD FIFTH YOUNGEST
CHILD 835A Did you have any other child besides
this one who is less than 5 yrs old? No……………….…….0 Yes…………………....1 (IF “YES” GO TO Q. 802 OF SECOND YOUNGEST CHILD COLUMN. IF ‘NO’ GO TO Q.836)
No……………….…….0 Yes…………………....1 (IF “YES” GO TO Q. 802 OF THIRD YOUNGEST CHILD COLUMN. IF ‘NO’ GO TO Q.836)
No……………….…….0 Yes…………………....1 (IF “YES” GO TO Q. 802 OF FOURTH YOUNGEST CHILD COLUMN. IF ‘NO’ GO TO Q.836)
No……………….…….0 Yes…………………....1 (IF “YES” GO TO Q. 802 OF FIFTH YOUNGEST CHILD COLUMN. IF “NO” GO TO Q.836 )
No……………….…….0 Yes…………………....1 (IF “YES” GO TO Q. 835B. IF ‘NO’ GO TO Q.836)
835B How many more?
Number of additional children less than 5 yrs of age ____ ____ (GO TO Q.836)
836 Sometimes children have severe illnesses and should be taken immediately to a health facility. What types of symptoms would cause you to take your child to a health facility right away? IF ONE SYMPTOM GIVEN, PROMPT, “Any others?” RECORD ALL THAT ARE MENTIONED
Cough/Runny Nose…………………..………....…A Fever……..…………….........................................B Convulsion…..………..…………………………….C Unable to drink or breastfeed..……..….…………D Has difficult/fast breathing…................................E Watery or bloody diarrhea………….……………..F Other______________ ___________________ G (SPECIFY) NONE/DON’T KNOW……………………………….H
END: THANK YOU VERY MUCH FOR TAKING THE TIME TO
PARTICIPATE IN THIS INTERVIEW. THIS INFORMATION IS VERY USEFUL TO THE MINISTRY OF PUBLIC HEALTH TO
PROVIDE HEALTH SERVICES IN AFGHANISTAN.