s p a c e u t i l i z a t i o n a n a l y s i s a n d p l ... · enrollment projections and...
TRANSCRIPT

S p a c e U t i l i z a t i o n A n a l y s i s a n d P l a n n i n g
0 4 / 0 9 / 1 3

PROJECT NO.: 13002.001 S p a c e U t i l i z a t i o n A n a l y s i s a n d P l a n n i n g
Grand Forks, North Dakota SK. 43
PROJECT NO.: 13002.001 S p a c e U t i l i z a t i o n A n a l y s i s a n d P l a n n i n g
Grand Forks, North Dakota SK. 43
S p a c e U t i l i z a t i o n A n a l y s i s
General Purpose StatementClassrooms and Lab spaces designed to meet the teaching and learning needs of a
broad range of academic programs and to support the entire UND university community.
Space Code Types 111 - General Classroom 112 - Lecture Room 130 - Technology Enhanced Classroom 212 - Class Laboratory

PROJECT NO.: 13002.001 S p a c e U t i l i z a t i o n A n a l y s i s a n d P l a n n i n g
Grand Forks, North Dakota SK. 44
U N D C o r e H o u r s a n d O t h e r H o u r s
Core Hours - Core Academic Delivery Hours- Monday - Friday, 8am to 4pm - 8 Hours/Day, 40 Hours/Week
Other Hours- Hours outside of Core Hours that Room/Seats are plausibly used
- Monday - Friday, 6am to 8am- Monday - Friday, 4pm to 10pm
- Saturday, 8am to 8pm
Peak Hours- Hours inside of Core Hours that Room/Seats are Maximized
- - Monday - Thursday, 9am to 2pm

PROJECT NO.: 13002.001 S p a c e U t i l i z a t i o n A n a l y s i s a n d P l a n n i n g
Grand Forks, North Dakota SK. 45
Ta r g e t S e a t U t i l i z a t i o n C o m p a r i s o n
University of North Dakota 65%
University of Minnesota 65%
University of Tennessee-Chatanooga 60%
University of Vermont 59%
Ta r g e t R o o m U t i l i z a t i o n C o m p a r i s o n
University of North Dakota 80%
University of Minnesota 71%
MnSCU 68%
University of Tennessee-Chatanooga 67%
University of Vermont 60%

PROJECT NO.: 13002.001 S p a c e U t i l i z a t i o n A n a l y s i s a n d P l a n n i n g
Grand Forks, North Dakota SK. 46
U N D A c t u a l C o m b i n e d S e a t U t i l i z a t i o n v s . Ta r g e t U t i l i z a t i o n
University of North Dakota - Target 65%
University of North Dakota - Actual 50%
U N D A c t u a l C o m b i n e d R o o m U t i l i z a t i o n v s . Ta r g e t U t i l i z a t i o n
University of North Dakota - Target 80%
University of North Dakota - Actual 71%

PROJECT NO.: 13002.001 S p a c e U t i l i z a t i o n A n a l y s i s a n d P l a n n i n g
Grand Forks, North Dakota SK. 47
U N D A c t u a l S e a t U t i l i z a t i o n v s . Ta r g e t U t i l i z a t i o n
University of North Dakota - Target 65%
111 Codes - Actual 52%112 Codes - Actual 38%130 Codes - Actual 66%212 Codes - Actual 87%
U N D A c t u a l R o o m U t i l i z a t i o n v s . Ta r g e t U t i l i z a t i o n
University of North Dakota - Target 80%
111 Codes - Actual 73%112 Codes - Actual 82%130 Codes - Actual 85%212 Codes - Actual 46%

PROJECT NO.: 13002.001 S p a c e U t i l i z a t i o n A n a l y s i s a n d P l a n n i n g
Grand Forks, North Dakota SK. 48
SPACE UTILIZATION BY BUILDING & ROOM University of North DakotaSpace Utilization Analysis and Planning
Bldg Bldg Rm Space Core Hrs Core Hrs Core Hrs Otr Hrs Otr Hrs Otr Hrs Weekly Use Student Student Student %No. Name No. Code Avail/Wk Used/Wk Use % Avail/Wk Used/Wk Use % % of 40 Hrs Enrollment Capacity of Capacity117 NURSING 111 280 134 42% 320 39 12% 54% 1,474 3,059 48%117 NURSING 112 80 83 104% 80 3 4% 108% 868 2,400 36%117 NURSING 130 0 0 0% 0 0 0%117 NURSING 212 0 0 0% 0 0 0%117 NURSING 4 Code TOTAL 360 217 60% 400 42 11% 65% 2,342 5,459 43%
121 RYAN HALL 111 120 109 91% 120 73 61% 152% 1,190 2,130 56%121 RYAN HALL 112 0 0 0% 0 0 0%121 RYAN HALL 130 0 0 0% 0 0 0%121 RYAN HALL 212 0 0 0% 0 0 0%121 RYAN HALL 4 Code TOTAL 120 109 91% 120 73 61% 152% 1,190 2,130 56%
UND TOTAL 111 4,160 3,020 73% 4,200 597 14% 86% 68,020 131,166 52%UND TOTAL 112 760 623 82% 760 113 15% 97% 20,472 53,547 38%UND TOTAL 130 480 408 85% 480 20 4% 89% 10,040 15,125 66%UND TOTAL 212 920 421 46% 920 162 18% 63% 5,167 5,912 87%
UND GRAND TOTAL 111,112,130,212 6,320 4,472 71% 6,360 892 14% 84% 103,699 205,750 50%
HAY DOBBS P.A. Page 14 3/21/2013
U N D A c t u a l R o o m & S e a t U t i l i z a t i o n S u m m a r y

PROJECT NO.: 13002.001 S p a c e U t i l i z a t i o n A n a l y s i s a n d P l a n n i n g
Grand Forks, North Dakota SK. 49
UND has high utilization

Enrollment Projections and Utilization at 4% Growth
0
2,000
4,000
6,000
8,000
10,000
12,000
14,000
16,000
18,000
20,000
Enr
ollm
ent
0%
20%
40%
60%
80%
100%
120%
Actual Enrollment 10,277 10,711 10,710 10,498 10,376 10,085 10,129 10,440 11,139 11,522 11,953
.05% Growth 12,013 12,073 12,133 12,194 12,255 12,316 12,378 12,440 12,502 12,564
1.5% Growth 12,132 12,314 12,499 12,686 12,877 13,070 13,266 13,465 13,667 13,872
4% Growth 12,431 12,928 13,455 13,983 14,543 15,124 15,729 16,359 17,013 17,693
Room Utilization 71% 73.84% 76.80% 79.90% 83% 86.40% 89.30% 93.40% 97% 101.00 105.10
2002 2003 2004 2005 2006 2007 2008 2009 2010 2011 2012 2013 2014 2015 2016 2017 2018 2019 2020 2021 2022
PROJECT NO.: 13002.001S p a c e U t i l i z a t i o n A n a l y s i s a n d P l a n n i n g
Grand Forks, North Dakota SK. 50
C o m b i n e d R o o m U t i l i z a t i o n P r o j e c t i o n s - 4 % E n r o l l m e n t G r o w t h
AVERAGE Room Utilization
50%-85%
LOW Room Utilization
<50%
OVERCROWDED Room Utilization
>85%
Optimal Room Utilization 80%
Uti
lizat
ion
Enro
llmen
t201374%
201580%
Enrollment Projections and Utilization at 4% Growth
0
2,000
4,000
6,000
8,000
10,000
12,000
14,000
16,000
18,000
20,000 E
nrol
lmen
t
0%
20%
40%
60%
80%
100%
120%
Actual Enrollment 10,277 10,711 10,710 10,498 10,376 10,085 10,129 10,440 11,139 11,522 11,953
.05% Growth 12,013 12,073 12,133 12,194 12,255 12,316 12,378 12,440 12,502 12,564
1.5% Growth 12,132 12,314 12,499 12,686 12,877 13,070 13,266 13,465 13,667 13,872
4% Growth 12,431 12,928 13,455 13,983 14,543 15,124 15,729 16,359 17,013 17,693
Room Utilization 71% 73.84% 76.80% 79.90% 83% 86.40% 89.30% 93.40% 97% 101.00 105.10
2002 2003 2004 2005 2006 2007 2008 2009 2010 2011 2012 2013 2014 2015 2016 2017 2018 2019 2020 2021 2022

Enrollment Projections and Utilization at 4% Growth
0
2,000
4,000
6,000
8,000
10,000
12,000
14,000
16,000
18,000
20,000
Enr
ollm
ent
0%
10%
20%
30%
40%
50%
60%
70%
80%
Actual Enrollment 10,277 10,711 10,710 10,498 10,376 10,085 10,129 10,440 11,139 11,522 11,953
.05% Growth 12,013 12,073 12,133 12,194 12,255 12,316 12,378 12,440 12,502 12,564
1.5% Growth 12,132 12,314 12,499 12,686 12,877 13,070 13,266 13,465 13,667 13,872
4% Growth 12,431 12,928 13,455 13,983 14,543 15,124 15,729 16,359 17,013 17,693
Seat Utilization 50% 52.00% 54.10% 56% 58.50% 61% 63% 66% 68% 71% 74%
2002 2003 2004 2005 2006 2007 2008 2009 2010 2011 2012 2013 2014 2015 2016 2017 2018 2019 2020 2021 2022
Enrollment Projections and Utilization at 4% Growth
0
2,000
4,000
6,000
8,000
10,000
12,000
14,000
16,000
18,000
20,000 E
nrol
lmen
t
0%
20%
40%
60%
80%
100%
120%
Actual Enrollment 10,277 10,711 10,710 10,498 10,376 10,085 10,129 10,440 11,139 11,522 11,953
.05% Growth 12,013 12,073 12,133 12,194 12,255 12,316 12,378 12,440 12,502 12,564
1.5% Growth 12,132 12,314 12,499 12,686 12,877 13,070 13,266 13,465 13,667 13,872
4% Growth 12,431 12,928 13,455 13,983 14,543 15,124 15,729 16,359 17,013 17,693
Room Utilization 71% 73.84% 76.80% 79.90% 83% 86.40% 89.30% 93.40% 97% 101.00 105.10
2002 2003 2004 2005 2006 2007 2008 2009 2010 2011 2012 2013 2014 2015 2016 2017 2018 2019 2020 2021 2022
PROJECT NO.: 13002.001 S p a c e U t i l i z a t i o n A n a l y s i s a n d P l a n n i n g
Grand Forks, North Dakota SK. 51
C o m b i n e d S e a t U t i l i z a t i o n P r o j e c t i o n s - 4 % E n r o l l m e n t G r o w t h
AVERAGE Seat Utilization
45%-70%
LOW Seat Utilization
<45%
OVERCROWDED Seat Utilization
>70%
Uti
lizat
ion
Enro
llmen
t Optimal Seat Utilization 65%
201350%
2019 65%

PROJECT NO.: 13002.001 S p a c e U t i l i z a t i o n A n a l y s i s a n d P l a n n i n g
Grand Forks, North Dakota SK. 52
Enrollment Projections and Utilization at 1.5% Growth
0
2,000
4,000
6,000
8,000
10,000
12,000
14,000
16,000
18,000
20,000
Enr
ollm
ent
0%
20%
40%
60%
80%
100%
120%
Actual Enrollment 10,277 10,711 10,710 10,498 10,376 10,085 10,129 10,440 11,139 11,522 11,953
.05% Growth 12,013 12,073 12,133 12,194 12,255 12,316 12,378 12,440 12,502 12,564
1.5% Growth 12,132 12,314 12,499 12,686 12,877 13,070 13,266 13,465 13,667 13,872
4% Growth 12,431 12,928 13,455 13,983 14,543 15,124 15,729 16,359 17,013 17,693
Room Utilization 71% 72.10%73.20%74.20% 75% 76.50%77.60%78.80% 80% 81.20%82.40%
2002 2003 2004 2005 2006 2007 2008 2009 2010 2011 2012 2013 2014 2015 2016 2017 2018 2019 2020 2021 2022
PROJECT NO.: 13002.001 S p a c e U t i l i z a t i o n A n a l y s i s a n d P l a n n i n g
Grand Forks, North Dakota SK. 52
C o m b i n e d R o o m U t i l i z a t i o n P r o j e c t i o n s - 1 . 5 % E n r o l l m e n t G r o w t h
AVERAGE Room Utilization
50%-85%
LOW Room Utilization
<50%
OVERCROWDED Room Utilization
>85%
Optimal Room Utilization 80%
Uti
lizat
ion
Enro
llmen
t201371%
202080%
Enrollment Projections and Utilization at 1.5% Growth
0
2,000
4,000
6,000
8,000
10,000
12,000
14,000
16,000
18,000
20,000 E
nrol
lmen
t
0%
20%
40%
60%
80%
100%
120%
Actual Enrollment 10,277 10,711 10,710 10,498 10,376 10,085 10,129 10,440 11,139 11,522 11,953
.05% Growth 12,013 12,073 12,133 12,194 12,255 12,316 12,378 12,440 12,502 12,564
1.5% Growth 12,132 12,314 12,499 12,686 12,877 13,070 13,266 13,465 13,667 13,872
4% Growth 12,431 12,928 13,455 13,983 14,543 15,124 15,729 16,359 17,013 17,693
Room Utilization 71% 72.10%73.20%74.20% 75% 76.50%77.60%78.80% 80% 81.20%82.40%
2002 2003 2004 2005 2006 2007 2008 2009 2010 2011 2012 2013 2014 2015 2016 2017 2018 2019 2020 2021 2022
Enrollment Projections and Utilization at 1.5% Growth
0
2,000
4,000
6,000
8,000
10,000
12,000
14,000
16,000
18,000
20,000
Enr
ollm
ent
0%
10%
20%
30%
40%
50%
60%
70%
80%
Actual Enrollment 10,277 10,711 10,710 10,498 10,376 10,085 10,129 10,440 11,139 11,522 11,953
.05% Growth 12,013 12,073 12,133 12,194 12,255 12,316 12,378 12,440 12,502 12,564
1.5% Growth 12,132 12,314 12,499 12,686 12,877 13,070 13,266 13,465 13,667 13,872
4% Growth 12,431 12,928 13,455 13,983 14,543 15,124 15,729 16,359 17,013 17,693
Seat Utilization 50% 50.75%51.50% 52% 53.00% 54% 55% 56% 56% 57% 58%
2002 2003 2004 2005 2006 2007 2008 2009 2010 2011 2012 2013 2014 2015 2016 2017 2018 2019 2020 2021 2022
Enrollment Projections and Utilization at 1.5% Growth
0
2,000
4,000
6,000
8,000
10,000
12,000
14,000
16,000
18,000
20,000 E
nrol
lmen
t
0%
20%
40%
60%
80%
100%
120%
Actual Enrollment 10,277 10,711 10,710 10,498 10,376 10,085 10,129 10,440 11,139 11,522 11,953
.05% Growth 12,013 12,073 12,133 12,194 12,255 12,316 12,378 12,440 12,502 12,564
1.5% Growth 12,132 12,314 12,499 12,686 12,877 13,070 13,266 13,465 13,667 13,872
4% Growth 12,431 12,928 13,455 13,983 14,543 15,124 15,729 16,359 17,013 17,693
Room Utilization 71% 72.10%73.20%74.20% 75% 76.50%77.60%78.80% 80% 81.20%82.40%
2002 2003 2004 2005 2006 2007 2008 2009 2010 2011 2012 2013 2014 2015 2016 2017 2018 2019 2020 2021 2022
PROJECT NO.: 13002.001S p a c e U t i l i z a t i o n A n a l y s i s a n d P l a n n i n g
Grand Forks, North Dakota SK. 53
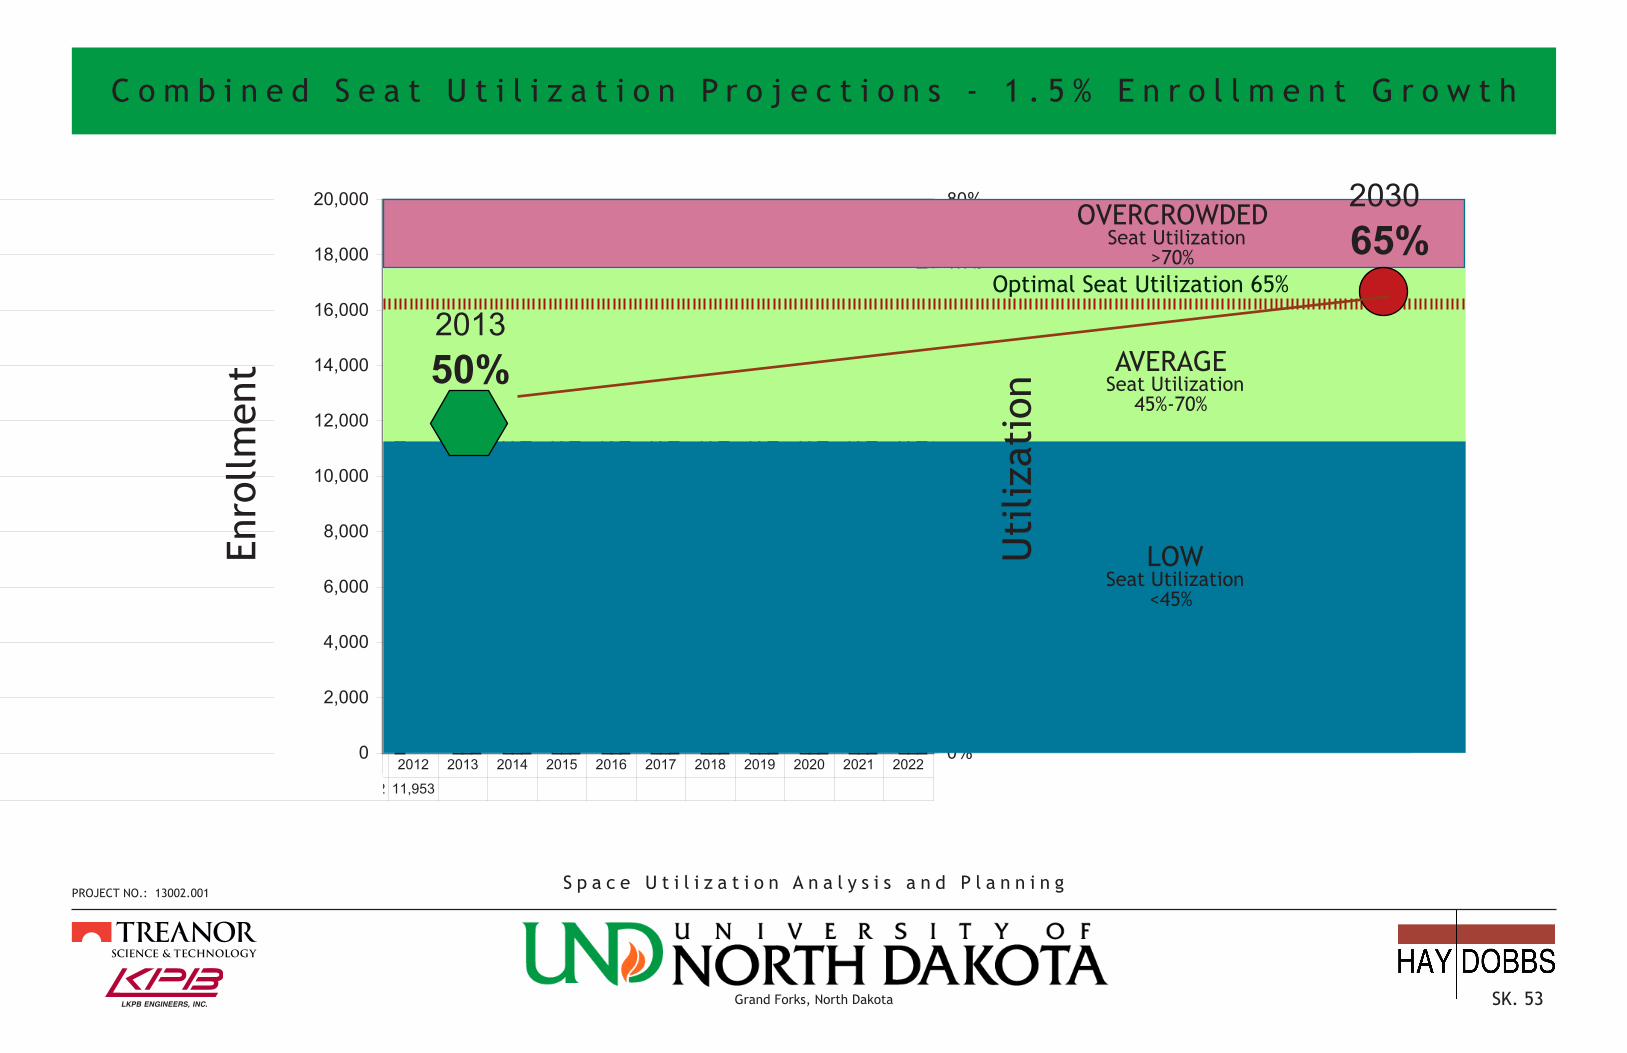
C o m b i n e d S e a t U t i l i z a t i o n P r o j e c t i o n s - 1 . 5 % E n r o l l m e n t G r o w t h
AVERAGE Seat Utilization
45%-70%
LOW Seat Utilization
<45%
OVERCROWDED Seat Utilization
>70%
Uti
lizat
ion
Enro
llmen
t Optimal Seat Utilization 65%
201350%
2030 65%

Enrollment Projections and Utilization at 1.5% Growth
0
2,000
4,000
6,000
8,000
10,000
12,000
14,000
16,000
18,000
20,000
Enr
ollm
ent
0%
20%
40%
60%
80%
100%
120%
Actual Enrollment 10,277 10,711 10,710 10,498 10,376 10,085 10,129 10,440 11,139 11,522 11,953
.05% Growth 12,013 12,073 12,133 12,194 12,255 12,316 12,378 12,440 12,502 12,564
1.5% Growth 12,132 12,314 12,499 12,686 12,877 13,070 13,266 13,465 13,667 13,872
4% Growth 12,431 12,928 13,455 13,983 14,543 15,124 15,729 16,359 17,013 17,693
Room Utilization 71% 72.10%73.20%74.20% 75% 76.50%77.60%78.80% 80% 81.20%82.40%
2002 2003 2004 2005 2006 2007 2008 2009 2010 2011 2012 2013 2014 2015 2016 2017 2018 2019 2020 2021 2022
Sheet1 Chart 1
Page 1
Enrollment Projections and Utilization at .05% Growth
0
2,000
4,000
6,000
8,000
10,000
12,000
14,000
16,000
18,000
20,000
Enr
ollm
ent
0
0.2
0.4
0.6
0.8
1
1.2
Actual Enrollment 10,277 10,711 10,710 10,498 10,376 10,085 10,129 10,440 11,139 11,522 11,953
.05% Growth 12,013 12,073 12,133 12,194 12,255 12,316 12,378 12,440 12,502 12,564
1.5% Growth 12,132 12,314 12,499 12,686 12,877 13,070 13,266 13,465 13,667 13,872
4% Growth 12,431 12,928 13,455 13,983 14,543 15,124 15,729 16,359 17,013 17,693
Room Utilization 71% 71.36% 71.70% 72.00% 72% 72.80% 73.20% 73.50% 74% 74.30% 74.60%
2002 2003 2004 2005 2006 2007 2008 2009 2010 2011 2012 2013 2014 2015 2016 2017 2018 2019 2020 2021 2022
PROJECT NO.: 13002.001 S p a c e U t i l i z a t i o n A n a l y s i s a n d P l a n n i n g
Grand Forks, North Dakota SK. 54
PROJECT NO.: 13002.001 S p a c e U t i l i z a t i o n A n a l y s i s a n d P l a n n i n g
Grand Forks, North Dakota SK. 54
C o m b i n e d R o o m U t i l i z a t i o n P r o j e c t i o n s - 0 . 5 % E n r o l l m e n t G r o w t h
AVERAGE Room Utilization
50%-85%
LOW Room Utilization
<50%
OVERCROWDED Room Utilization
>85%
Optimal Room Utilization 80%
Uti
lizat
ion
Enro
llmen
t
201371%
203780%
Enrollment Projections and Utilization at 1.5% Growth
0
2,000
4,000
6,000
8,000
10,000
12,000
14,000
16,000
18,000
20,000
Enr
ollm
ent
0%
20%
40%
60%
80%
100%
120%
Actual Enrollment 10,277 10,711 10,710 10,498 10,376 10,085 10,129 10,440 11,139 11,522 11,953
.05% Growth 12,013 12,073 12,133 12,194 12,255 12,316 12,378 12,440 12,502 12,564
1.5% Growth 12,132 12,314 12,499 12,686 12,877 13,070 13,266 13,465 13,667 13,872
4% Growth 12,431 12,928 13,455 13,983 14,543 15,124 15,729 16,359 17,013 17,693
Room Utilization 71% 72.10%73.20%74.20% 75% 76.50%77.60%78.80% 80% 81.20%82.40%
2002 2003 2004 2005 2006 2007 2008 2009 2010 2011 2012 2013 2014 2015 2016 2017 2018 2019 2020 2021 2022

Sheet1 Chart 15
Page 1
Enrollment Projections and Utilization at .05% Growth
0
2,000
4,000
6,000
8,000
10,000
12,000
14,000
16,000
18,000
20,000
Enr
ollm
ent
0%
10%
20%
30%
40%
50%
60%
70%
80%
Actual Enrollment 10,277 10,711 10,710 10,498 10,376 10,085 10,129 10,440 11,139 11,522 11,953
.05% Growth 12,013 12,073 12,133 12,194 12,255 12,316 12,378 12,440 12,502 12,564
1.5% Growth 12,132 12,314 12,499 12,686 12,877 13,070 13,266 13,465 13,667 13,872
4% Growth 12,431 12,928 13,455 13,983 14,543 15,124 15,729 16,359 17,013 17,693
Seat Utilization 50% 50.25%50.50% 51% 51.00% 51% 52% 52% 52% 52% 53%
2002 2003 2004 2005 2006 2007 2008 2009 2010 2011 2012 2013 2014 2015 2016 2017 2018 2019 2020 2021 2022
Enrollment Projections and Utilization at 1.5% Growth
0
2,000
4,000
6,000
8,000
10,000
12,000
14,000
16,000
18,000
20,000
Enr
ollm
ent
0%
20%
40%
60%
80%
100%
120%
Actual Enrollment 10,277 10,711 10,710 10,498 10,376 10,085 10,129 10,440 11,139 11,522 11,953
.05% Growth 12,013 12,073 12,133 12,194 12,255 12,316 12,378 12,440 12,502 12,564
1.5% Growth 12,132 12,314 12,499 12,686 12,877 13,070 13,266 13,465 13,667 13,872
4% Growth 12,431 12,928 13,455 13,983 14,543 15,124 15,729 16,359 17,013 17,693
Room Utilization 71% 72.10%73.20%74.20% 75% 76.50%77.60%78.80% 80% 81.20%82.40%
2002 2003 2004 2005 2006 2007 2008 2009 2010 2011 2012 2013 2014 2015 2016 2017 2018 2019 2020 2021 2022
PROJECT NO.: 13002.001 S p a c e U t i l i z a t i o n A n a l y s i s a n d P l a n n i n g
Grand Forks, North Dakota SK. 55
PROJECT NO.: 13002.001 S p a c e U t i l i z a t i o n A n a l y s i s a n d P l a n n i n g
Grand Forks, North Dakota SK. 55
C o m b i n e d S e a t U t i l i z a t i o n P r o j e c t i o n s - 0 . 5 % E n r o l l m e n t G r o w t h
AVERAGE Seat Utilization
45%-70%
LOW Seat Utilization
<45%
OVERCROWDED Seat Utilization
>70%
Uti
lizat
ion
Enro
llmen
t
Optimal Seat Utilization 65%
201350%
2050 65%

PROJECT NO.: 13002.001 S p a c e U t i l i z a t i o n A n a l y s i s a n d P l a n n i n g
Grand Forks, North Dakota SK. 56
T i m e f r a m e R e l a t e d t o G r o w t h a n d U t i l i z a t i o nEnrollment Projections and Utilization at 1.5% Growth
0
2,000
4,000
6,000
8,000
10,000
12,000
14,000
16,000
18,000
20,000
Enr
ollm
ent
0%
20%
40%
60%
80%
100%
120%
Actual Enrollment 10,277 10,711 10,710 10,498 10,376 10,085 10,129 10,440 11,139 11,522 11,953
.05% Growth 12,013 12,073 12,133 12,194 12,255 12,316 12,378 12,440 12,502 12,564
1.5% Growth 12,132 12,314 12,499 12,686 12,877 13,070 13,266 13,465 13,667 13,872
4% Growth 12,431 12,928 13,455 13,983 14,543 15,124 15,729 16,359 17,013 17,693
Room Utilization 71% 72.10%73.20%74.20% 75% 76.50%77.60%78.80% 80% 81.20%82.40%
2002 2003 2004 2005 2006 2007 2008 2009 2010 2011 2012 2013 2014 2015 2016 2017 2018 2019 2020 2021 2022
AVERAGE Room Utilization
50%-85%
LOW Room Utilization
<50%
OVERCROWDED Room Utilization
>85%
Optimal Room Utilization 80%
Uti
lizat
ion
Enro
llmen
t201371%
202080%
Enrollment Projections and Utilization at 1.5% Growth
0
2,000
4,000
6,000
8,000
10,000
12,000
14,000
16,000
18,000
20,000
Enr
ollm
ent
0%
20%
40%
60%
80%
100%
120%
Actual Enrollment 10,277 10,711 10,710 10,498 10,376 10,085 10,129 10,440 11,139 11,522 11,953
.05% Growth 12,013 12,073 12,133 12,194 12,255 12,316 12,378 12,440 12,502 12,564
1.5% Growth 12,132 12,314 12,499 12,686 12,877 13,070 13,266 13,465 13,667 13,872
4% Growth 12,431 12,928 13,455 13,983 14,543 15,124 15,729 16,359 17,013 17,693
Room Utilization 71% 72.10%73.20%74.20% 75% 76.50%77.60%78.80% 80% 81.20%82.40%
2002 2003 2004 2005 2006 2007 2008 2009 2010 2011 2012 2013 2014 2015 2016 2017 2018 2019 2020 2021 2022
P l a n n i n g D e s i g n C o n s t .

PROJECT NO.: 13002.001 S p a c e U t i l i z a t i o n A n a l y s i s a n d P l a n n i n g
Grand Forks, North Dakota SK. 57
P l a n n i n g f o r G r o w t h
Funding - Design - Build - Occupy
0 - ?? Years 1-2 Years 1-2 Years 1-3 Months
From Intent to Occupation can take 2 - 6 years, or more.

PROJECT NO.: 13002.001 S p a c e U t i l i z a t i o n A n a l y s i s a n d P l a n n i n g
Grand Forks, North Dakota SK. 58
UND needs more classrooms and labs
NOW!
PROJECT NO.: 13002.001 S p a c e U t i l i z a t i o n A n a l y s i s a n d P l a n n i n g
Grand Forks, North Dakota SK. 59
PROJECT NO.: 13002.001 S p a c e U t i l i z a t i o n A n a l y s i s a n d P l a n n i n g
Grand Forks, North Dakota SK. 59
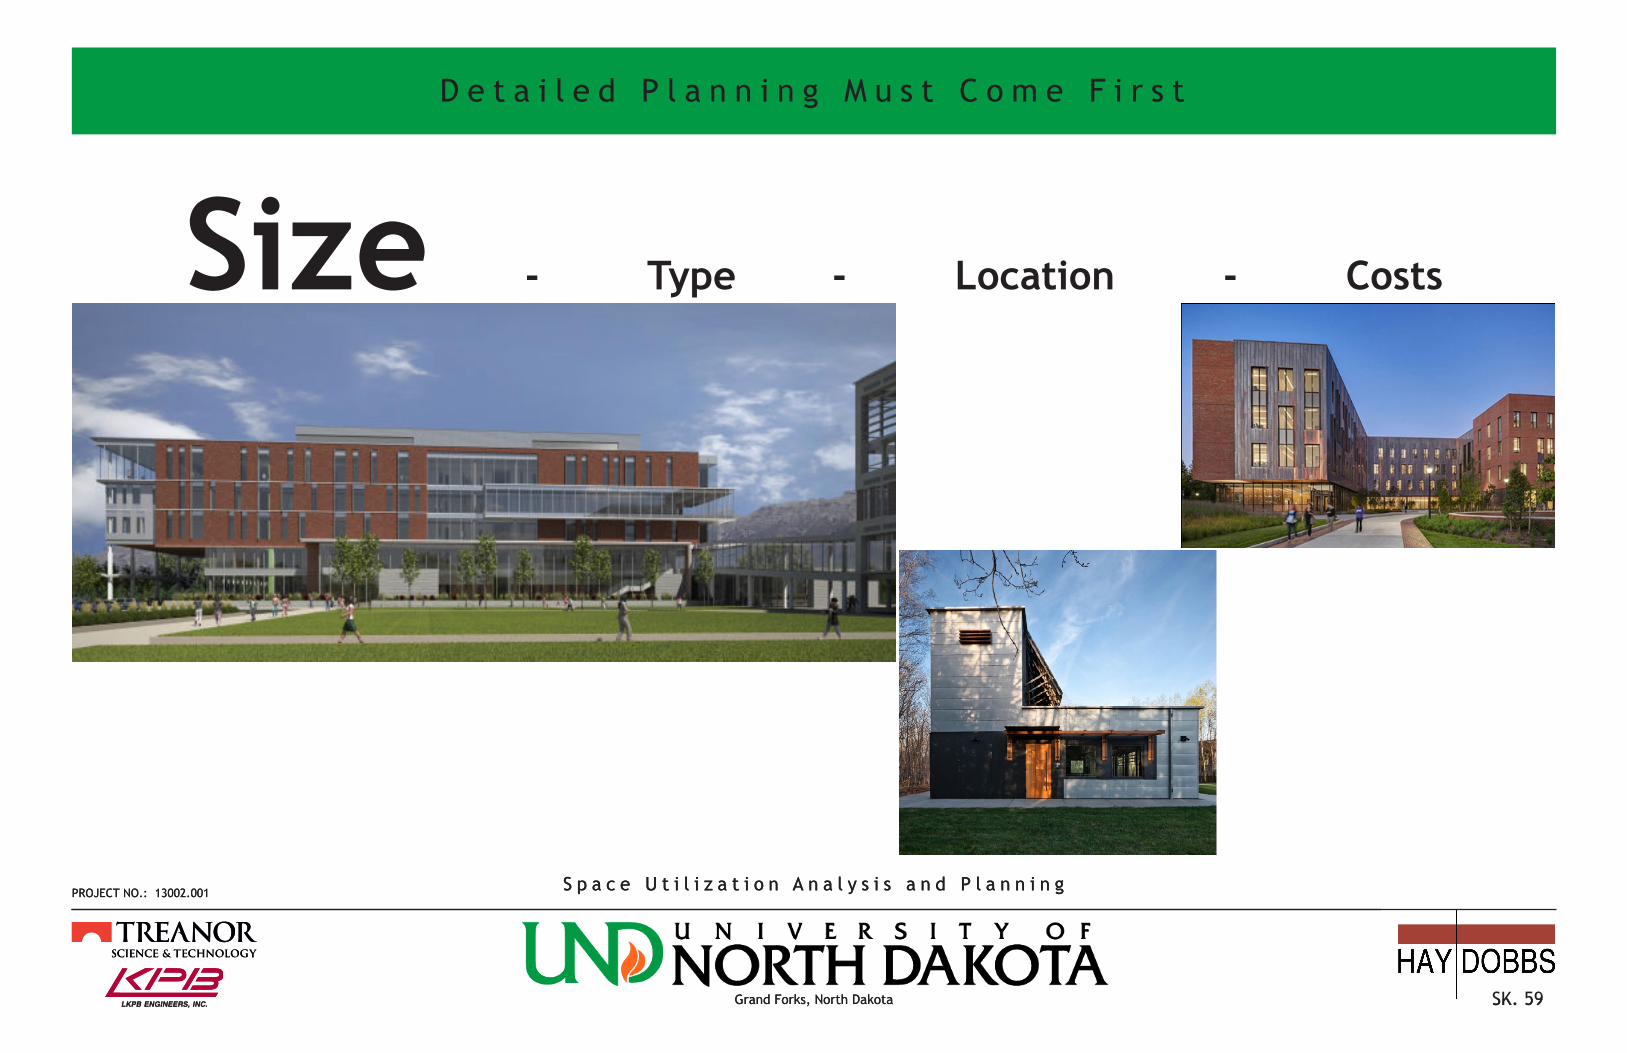
D e t a i l e d P l a n n i n g M u s t C o m e F i r s t
Size - Type - Location - Costs

PROJECT NO.: 13002.001 S p a c e U t i l i z a t i o n A n a l y s i s a n d P l a n n i n g
Grand Forks, North Dakota SK. 60
PROJECT NO.: 13002.001 S p a c e U t i l i z a t i o n A n a l y s i s a n d P l a n n i n g
Grand Forks, North Dakota SK. 60
PROJECT NO.: 13002.001 S p a c e U t i l i z a t i o n A n a l y s i s a n d P l a n n i n g
Grand Forks, North Dakota SK. 60
D e t a i l e d P l a n n i n g M u s t C o m e F i r s t
Size - Type - Location - Costs

PROJECT NO.: 13002.001 S p a c e U t i l i z a t i o n A n a l y s i s a n d P l a n n i n g
Grand Forks, North Dakota SK. 61
D e t a i l e d P l a n n i n g M u s t C o m e F i r s t
Size - Type - Location - Costs

PROJECT NO.: 13002.001 S p a c e U t i l i z a t i o n A n a l y s i s a n d P l a n n i n g
Grand Forks, North Dakota SK. 62
PROJECT NO.: 13002.001 S p a c e U t i l i z a t i o n A n a l y s i s a n d P l a n n i n g
Grand Forks, North Dakota SK. 62
PROJECT NO.: 13002.001 S p a c e U t i l i z a t i o n A n a l y s i s a n d P l a n n i n g
Grand Forks, North Dakota SK. 62
PROJECT NO.: 13002.001 S p a c e U t i l i z a t i o n A n a l y s i s a n d P l a n n i n g
Grand Forks, North Dakota SK. 62
D e t a i l e d P l a n n i n g M u s t C o m e F i r s t
Size - Type - Location - Costs

PROJECT NO.: 13002.001 S p a c e U t i l i z a t i o n A n a l y s i s a n d P l a n n i n g
Grand Forks, North Dakota SK. 63
PROJECT NO.: 13002.001 S p a c e U t i l i z a t i o n A n a l y s i s a n d P l a n n i n g
Grand Forks, North Dakota SK. 2
University Ave.
Sixth Ave. North
No.
42n
d St
.
Inte
rsta
te 2
9
Stan
ford
Roa
d
Demers Ave.
Gateway Drive
Stan
ford
Roa
d
University Ave.
Col
umbi
a R
oad
Ove
rpas
s
Prin
ceto
n St
.
Stat
e St
reet
Ham
line
St.
No.
Col
umbi
a R
oad
002004
005
011
016022 024
035
038
042049
050
063
064
071
080106
117
121
104
057
020
126
No. BuildingSpace Code Type 111 112 130 212
2 OKelly 12 0 2 14 Gillettte 2 0 0 05 Babcock 1 0 0 011 Gamble 9 5 0 016 Merrifield 24 0 0 020 Harrington 0 0 5 022 Education 10 3 0 024 Hyslop 0 3 0 035 Abbott 3 1 0 738 Witmer 6 2 4 342 Montgomery 1 0 0 049 Streibel 3 0 0 050 Odegard 8 1 0 057 Robertson-Sayre 0 0 2 063 Corwin-Larimore 2 0 1 064 Starcher 0 1 0 371 Clifford 1 0 0 080 Leonard 6 1 0 0104 Hughes 3 1 0 0106 Upson II 3 0 0 0117 Nursing 7 2 0 0121 Ryan Hall 3 0 0 0
Total/Space Code 111 112 130 212 104 20 14 14
Total # of Spaces 152Within 1/4 Mile Radius 136 90%
Total # of Buildings 22Within 1/4 Mile Radius 18 80%
Building Location
1/4 Mile Radius (10 minute walk)
C l a s s r o o m & L a b B u i l d i n g L o c a t i o n s

PROJECT NO.: 13002.001 S p a c e U t i l i z a t i o n A n a l y s i s a n d P l a n n i n g
Grand Forks, North Dakota SK. 64
PROJECT NO.: 13002.001 S p a c e U t i l i z a t i o n A n a l y s i s a n d P l a n n i n g
Grand Forks, North Dakota SK. 1
University Ave.
Sixth Ave. North
No.
42n
d St
.
Inte
rsta
te 2
9
Stan
ford
Roa
d
Demers Ave.
Gateway Drive
Stan
ford
Roa
d
University Ave.
Col
umbi
a R
oad
Ove
rpas
s
Prin
ceto
n St
.
Stat
e St
reet
Ham
line
St.
No.
Col
umbi
a R
oad
069
230
002004
005
006011
016022 024
035
038
042049
050
063
064
071
080106
117
121
104
057
020
126 059
118129
No. Building Space Code Type Square Footage 111 112 130 2125 Babcock 1 0 0 0 22,3606 Chandler 0 0 0 0 37,23559 Womens Center 0 0 0 0 2,99069 Dakota Hall 0 0 0 0 37,580118 Era Bell Thomp 0 0 0 0 2,280126 Ctr. Comm. Eng. 0 0 0 0 2,885129 Cambridge 0 0 0 0 13,082230 Strinden Center 0 0 0 0 11,551
Total Square Footage 129,963
Total/Space Code 111 112 130 212 1 0 0 0
Building Location
1/4 Mile Radius (10 minute walk)
B u i l d i n g s f o r F u t u r e C o n s i d e r a t i o n

PROJECT NO.: 13002.001 S p a c e U t i l i z a t i o n A n a l y s i s a n d P l a n n i n g
Grand Forks, North Dakota SK. 65
F a c t o r s i n D e t e r m i n i n g S i z e
• Current Needs - Baseline for determining future needs– Demand for new pedagogy and/or room types i.e. Active Learning vs. Traditional Classroom needs • Future Needs- Pace of growth, new program introductions, existing building demo/re-purposing, classroom types
• Type of Uses- Academic, Administrative, Student Support etc. - Lab, Classroom, Commons, Housing etc.- Traditional, Scale Up, Research, Hybrid etc.
• Location- Site access and constraints- Relationship to other buildings/programs
• Need for Swing Space- Space for accommodating functions displaced by renovation, demolition or re-purposing

PROJECT NO.: 13002.001 S p a c e U t i l i z a t i o n A n a l y s i s a n d P l a n n i n g
Grand Forks, North Dakota SK. 66
C l a s s r o o m / L a b S p a c e N e e d s R e l a t e d t o E n r o l l m e n t G r o w t h
• 2012 Enrollment Seat Utilization Room Utilization 11,953 50% 71%
• Future Enrollment +-14,800 >65% >80%
+- 3,000 Additional Students x 30sf/Student
= +- 90,000sf of additional classroom/lab space = +- 180,000sf of additional building space

PROJECT NO.: 13002.001 S p a c e U t i l i z a t i o n A n a l y s i s a n d P l a n n i n g
Grand Forks, North Dakota SK. 67
Discussion

PROJECT NO.: 13002.001 S p a c e U t i l i z a t i o n A n a l y s i s a n d P l a n n i n g
Grand Forks, North Dakota SK. 68
S p a c e M a n a g e m e n t P o l i c y R e c o m m e n d a t i o n s
• Centralize Scheduling of General Purpose Classrooms and Labs- Develop Common Pool of General Purpose Classrooms and Labs for cross-department/department use
• Identify Classrooms and Labs for Departmental Use and Scheduling- More specialized and proprietary spaces should come under the control of individual Departments • Establish Standardized Inventory of Room Types, Size and Configuration- General Classroom, Seminar Room, Lecture Hall, Auditorium, Active Learning
• Centralize Planning and Establish Standardized Inventory of Room Characteristics - Furniture - type, size, mobility; Technology; Equipment
• Establish Inventory of Collaboration and Learner Support Spaces- Ancillary, Prep, Storage, Study, Teaming, “War Rooms”/Project Rooms
• Develop Swing Space- Space for accommodating functions displaced by renovation, demolition or re-purposing
• Establish Room Use Protocols- Expectations of Faculty, Facilities Staff, Students for Room Set Up, Technology, Equipment, Security, Maintenance

PROJECT NO.: 13002.001 S p a c e U t i l i z a t i o n A n a l y s i s a n d P l a n n i n g
Grand Forks, North Dakota SK. 69
Discussion

PROJECT NO.: 13002.001 S p a c e U t i l i z a t i o n A n a l y s i s a n d P l a n n i n g
Grand Forks, North Dakota SK. 70
P r o j e c t S c h e d u l e
Proposed Meetings/Work-shops/Reviews with Advi-sory Committee (AC)
January February March April May June July31 7 14 21 28 4 11 18 25 4 11 18 25 1 8 15 22 29 6 13 20 27 3 10 17 24 1 8 15 22 29
Proposed Meetings/Work-shops with Steering Com-mittee (SC)
Proposed Reviews with Executive Council (EC)
Proposed Meetings/Con-ference Calls with Steering Committee (SC)
P r e l i m i n a r y P r o j e c t S c h e d u l e
Data Collection & Discovery on-going Discovery & Data Collectionki
ck-o
ff
Analysison-going Analysis/findings confirmation
Explorationon-going Exploration & standards
Refinementfinal graphics
Packaging Fina
l do
cum
ent
deli
very
March
5th
April
9th
May 14
th
June
11th
April
16th
TBD
?
June
18th
TBD
?
March
7th