s o c i a l a f f a i r s international migration report · pdf fileunited nations department...
TRANSCRIPT

E c o n o m i c &
International Migration Report 2015
United Nations
S o
c i a
l A f
f a
i r s


ST/ESA/SER.A/384 September 2016
Department of Economic and Social Affairs Population Division
International Migration Report 2015
United Nations


The Department of Economic and Social Affairs of the United Nations Secretariat is a vital interface between global policies in the economic, social and environmental spheres and
national action. The Department works in three main interlinked areas: (i) it compiles, generates and analyses a wide range of economic, social and environmental data and information on which States Members of the United Nations draw to review common problems
and take stock of policy options; (ii) it facilitates the negotiations of Member States in many intergovernmental bodies on joint courses of action to address ongoing or emerging global challenges; and (iii) it advises interested Governments on the ways and means of translating
policy frameworks developed in United Nations conferences and summits into programmes at the country level and, through technical assistance, helps build national capacities.
The Population Division of the Department of Economic and Social Affairs provides the international community with timely and accessible population data and analysis of population trends and development outcomes for all countries and areas of the world. To this end, the
Division undertakes regular studies of population size and characteristics and of all three components of population change (fertility, mortality and migration). Founded in 1946, the Population Division provides substantive support on population and development issues to the
United Nations General Assembly, the Economic and Social Council and the Commission on Population and Development. It also leads or participates in various interagency coordination mechanisms of the United Nations system. The work of the Division also contributes to
strengthening the capacity of Member States to monitor population trends and to address current and emerging population issues.
This report was prepared by Clare Menozzi, under the supervision of Bela Hovy. The estimates of the migrant stock were provided by Pablo Lattes and Clare Menozzi.
Note
The designations employed in this report and the material presented in it do not imply the expression of any opinions whatsoever on the part of the Secretariat of the United Nations concerning the legal status of any country, territory, city or area or of its authorities, or
concerning the delimitation of its frontiers or boundaries. This report is available in electronic format on the Division’s website at
www.unpopulation.org. For further information about this report, please contact the Office of the Director, Population Division, Department of Economic and Social Affairs, United Nations, New York, 10017, USA, by Fax: 1 212 963 2147 or by e mail at [email protected].
Suggested citation: United Nations, Department of Economic and Social Affairs, Population Division (2016).
International Migration Report 2015 (ST/ESA/SER.A/384). Official symbols of United Nations documents are composed of capital letters combined with
numbers, as illustrated in the above citation. Published by the United Nations
Copyright © United Nations, 2016 All rights reserved

< this page intentionally left blank >

United Nations Department of Economic and Social Affairs/Population Division iii International Migration Report 2015
PREFACE
In the area of international migration, the Population Division estimates the global number of international migrants at regular intervals, monitors levels, trends and policies of international migration, and collects and analyses information on the relationship between international migration and development. As part of these monitoring activities, the Migration Section within the Population Division maintains the United Nations Global Migration Database, which contains the most complete set of statistics on international migrants enumerated in countries or areas and classified by age, sex and country/area of birth or citizenship. The Population Division also convenes the interagency coordination meeting on international migration and organizes expert group meetings on migration-related topics. The Division participates on behalf of DESA in the interagency Global Migration Group (GMG). It also services the intergovernmental process on international migration and development at the General Assembly and acts as the focal point within the United Nations Secretariat for the State-led Global Forum on Migration and Development (GFMD). This report presents information on levels and trends in international migration for major areas, regions and countries of the world, and on the
ratification status of migration-related legal instruments. The data for the international migrant stock described in chapter I are taken from the publication Trends in International Migrant Stock:
The 2015 Revision, while the estimates on the total population in chapter I are based on World
Population Prospects: The 2015 Revision, DVD
Edition. The estimates on net migration and the projected population up to 2050 presented in chapter II are based on World Population Prospects: The
2015 Revision, DVD Edition. Chapter III provides an analysis of the status of ratification (by Member States) of the migration-related legal instruments of the United Nations and the International Labour Organization (ILO), based on information from the United Nations Treaty Section (http://treaties.un.org) and the NORMLEX Information System on International Labour Standards (http://www.ilo.org). For more information on the data and methodology used for calculating the various indicators used in this report, please see the above-mentioned publications. The present report has been issued without formal editing. Responsibility for this report rests with the Population Division. More information on the activities of the Population Division in the area of international migration can be found at www.unmigration.org.

< this page intentionally left blank >

United Nations Department of Economic and Social Affairs/Population Division v International Migration Report 2015
CONTENTS
Page
PREFACE ............................................................................................................................................... iii EXPLANATORY NOTES .......................................................................................................................... vii CLASSIFICATION OF COUNTRIES OR AREAS BY MAJOR AREAS AND REGION IN THE WORLD ................ ix
I. LEVELS AND TRENDS IN INTERNATIONAL MIGRATION ......................................................................... 1 II. NET INTERNATIONAL MIGRATION ........................................................................................................11 III. LEGAL INSTRUMENTS AND POLICIES ON INTERNATIONAL MIGRATION ...............................................19

< this page intentionally left blank >

United Nations Department of Economic and Social Affairs/Population Division vii International Migration Report 2015
EXPLANATORY NOTES
The following symbols are used in the tables shown in this report:
Two dots (..) indicate that data are not available or are not separately reported. Three dots (…) indicate that the treaty was not ratified. An em dash (—) indicates that the amount is nil or negligible. A hyphen (-) indicates that the item is not applicable. A minus sign (-) before a figure indicates a decrease. A full stop (.) is used to indicate decimals. Use of a hyphen (-) between years, for example, 1990-2000, signifies the full period from 1 July of the first year to 1 July of the second year.
Due to rounding, the numbers and percentages displayed in tables may not add up to the corresponding totals.
Following common practice, the “developed regions”, referred to also as the “global North” or simply the
“North”, are comprised of all countries or areas of Europe and Northern America, plus Australia, New Zealand and Japan. The term “developed countries” refers to countries in the developed regions.
The “developing regions”, or the “global South”, are comprised of all countries or areas of Africa, Asia
(excluding Japan) and Latin America and the Caribbean, as well as Melanesia, Micronesia and Polynesia. The term “developing countries” is used to designate countries in the developing regions.
The terms “developed” and “developing” describe the clear distinction between rich and poor countries or
regions that existed as recently as 1960, but which has since disappeared as many countries of the South have undergone rapid development. The terms continue to be used because the categories remain meaningful for some purposes; their use in this report does not imply any judgment as to the current developmental stage of a particular country or region.
Where appropriate, the term “country” may be used in reference to a territory or area.
The group of least developed countries, as defined by the Committee for Development Policy (CDP), a
subsidiary body of the United Nations Economic and Social Council, currently comprises 48 countries: Afghanistan, Angola, Bangladesh, Benin, Bhutan, Burkina Faso, Burundi, Cambodia, Central African Republic, Chad, Comoros, Democratic Republic of the Congo, Djibouti, Equatorial Guinea, Eritrea, Ethiopia, Gambia, Guinea, Guinea-Bissau, Haiti, Kiribati, Lao People's Democratic Republic, Lesotho, Liberia, Madagascar, Malawi, Mali, Mauritania, Mozambique, Myanmar, Nepal, Niger, Rwanda, Sao Tome and Principe, Senegal, Sierra Leone, Solomon Islands, Somalia, South Sudan, Sudan, Timor-Leste, Togo, Tuvalu, Uganda, United Republic of Tanzania, Vanuatu, Yemen, Zambia.
The designation sub-Saharan Africa refers to all countries in Africa except Algeria, Egypt, Libya, Morocco,
Tunisia and Western Sahara.
Countries and areas are grouped geographically into six major areas: Africa, Asia, Europe, Latin America and the Caribbean, Northern America and Oceania. These are further divided into 21geographical regions.
Country names and the composition of geographical areas follow those of “Standard country or area codes
for statistical use”, available at: http://unstats.un.org/unsd/methods/ m49/m49.htm.

viii United Nations Department of Economic and Social Affairs/Population Division International Migration Report 2015
EXPLANATORY NOTES (continued)
The following abbreviations have been used: DESA Department of Economic and Social Affairs GDP gross domestic product GFMD Global Forum on Migration and Development GMG Global Migration Group ILO International Labour Organization IMF International Monetary Fund IOM International Organization for Migration NGO Non-governmental Organization OECD Organisation for Economic Co-operation and Development UNGA United Nations General Assembly UNHCR United Nations High Commissioner for Refugees UNRWA United Nations Relief and Works Agency for Palestine Refugees in the Near East

United Nations Department of Economic and Social Affairs/Population Division ix International Migration Report 2015
CLASSIFICATION OF COUNTRIES OR AREAS BY MAJOR AREA AND REGION OF THE WORLD
AFRICA
Eastern Africa Middle Africa Northern Africa Western Africa Southern Africa
Burundi Angola Algeria Benin Botswana Comoros Cameroon Egypt Burkina Faso Lesotho Djibouti Central African Republic Libya Cabo Verde Namibia Eritrea Chad Morocco Côte d'Ivoire South Africa Ethiopia Congo Sudan Gambia Swaziland Kenya Democratic Republic Tunisia Ghana Madagascar of the Congo Western Sahara Guinea Malawi Equatorial Guinea Guinea-Bissau Mauritius1 Gabon Liberia Mayotte Sao Tome and Principe Mali Mozambique Mauritania Réunion Niger Rwanda Nigeria Seychelles Saint Helena2 Somalia Senegal South Sudan Sierra Leone Uganda Togo United Republic of Tanzania3 Zambia Zimbabwe
ASIA
Central Asia Eastern Asia South-Eastern Asia Southern Asia Western Asia
Kazakhstan China4 Brunei Darussalam Afghanistan Armenia Kyrgyzstan China, Hong Kong Special Cambodia Bangladesh Azerbaijan5 Tajikistan Administrative Indonesia Bhutan Bahrain Turkmenistan Region6 Lao People's Democratic India Cyprus7 Uzbekistan China, Macao Special Republic Iran (Islamic Republic of) Georgia8 Administrative Malaysia9 Maldives Iraq Region10 Myanmar Nepal Israel Democratic People's Philippines Pakistan Jordan Republic of Korea Singapore Sri Lanka Kuwait Japan Thailand Lebanon Mongolia Timor-Leste Oman Republic of Korea Viet Nam Qatar Saudi Arabia State of Palestine11 Syrian Arab Republic Turkey United Arab Emirates Yemen
1 Including Agalega, Rodrigues and Saint Brandon. 2 Including Ascension and Tristan da Cunha. 3 Including Zanzibar. 4 For statistical purposes, the data for China do not include Hong Kong and Macao, Special Administrative Regions (SAR) of China. 5 Including Nagorno-Karabakh. 6 As of 1 July 1997, Hong Kong became a Special Administrative Region (SAR) of China. 7 Including Northern-Cyprus. 8 Including Abkhazia and South Ossetia. 9 Including Sabah and Sarawak. 10 As of 20 December 1999, Macao became a Special Administrative Region (SAR) of China. 11 Including East Jerusalem. Refugees under UNRWA’s mandate are not counted as part of the migrant stock for the State of Palestine, as almost all of these individuals were born in the territory.

x United Nations Department of Economic and Social Affairs/Population Division International Migration Report 2015
CLASSIFICATION OF COUNTRIES OR AREAS BY MAJOR AREA AND REGION OF THE WORLD (continued)
EUROPE
Eastern Europe Northern Europe Southern Europe Western Europe
Belarus Channel Islands12 Albania Austria Bulgaria Denmark Andorra Belgium Czech Republic Estonia Bosnia and Herzegovina France Hungary Faeroe Islands Croatia Germany Poland Finland13 Gibraltar Liechtenstein Republic of Moldova14 Iceland Greece Luxembourg Romania Ireland Holy See15 Monaco Russian Federation Isle of Man Italy Netherlands Slovakia Latvia Malta Switzerland Ukraine Lithuania Montenegro Norway16 Portugal Sweden San Marino United Kingdom of Great Serbia17 Britain and Northern Ireland18 Slovenia Spain19 The former Yugoslav Republic of Macedonia20
LATIN AMERICA AND THE CARIBBEAN
Caribbean Central America South America
Anguilla Belize Argentina
Antigua and Barbuda Costa Rica Bolivia (Plurinational State of)
Aruba El Salvador Brazil
Bahamas Guatemala Chile
Barbados Honduras Colombia
Bonaire, Saba and Sint Eustatius
Mexico Nicaragua
Ecuador Falkland Islands (Malvinas)
British Virgin Islands Panama French Guiana Cayman Islands Guyana Cuba Paraguay Dominica Peru Curaçao Suriname
Dominican Republic Uruguay
Grenada Venezuela (Bolivarian Republic of) Guadeloupe21 Haiti
Jamaica
Martinique
Montserrat
Puerto Rico
Saint Kitts and Nevis
Saint Lucia
Saint Vincent and the Grenadines
12 Refers to Guernsey and Jersey. 13 Including Åland Islands. 14 Including Transnistria. 15 Refers to the Vatican City State. 16 Including Svalbard and Jan Mayen Islands. 17 Including Kosovo. 18 Also referred to as United Kingdom. 19 Including Canary Islands, Ceuta and Melilla. 20 Also referred to as TFYR Macedonia. 21 Including Saint-Barthélemy and Saint-Martin (French part).

United Nations Department of Economic and Social Affairs/Population Division xi International Migration Report 2015
CLASSIFICATION OF COUNTRIES OR AREAS BY MAJOR AREA AND REGION OF THE WORLD (continued)
LATIN AMERICA AND THE CARIBBEAN (continued)
Caribbean Central America South America
Sint Maarten (Dutch part) Trinidad and Tobago Turks and Caicos Islands United States Virgin Islands
NORTHERN AMERICA
Bermuda Canada Greenland Saint Pierre and Miquelon United States of America
OCEANIA
Australia and New Zealand Melanesia Micronesia Polynesia
Australia22 Fiji Guam American Samoa New Zealand New Caledonia Kiribati Cook Islands Papua New Guinea Marshall Islands French Polynesia Solomon Islands Micronesia (Federated States of) Niue Vanuatu Nauru Samoa Northern Mariana Islands Tokelau Palau Tonga Tuvalu Wallis and Futuna Islands
22 Including Christmas Island, Cocos (Keeling) Islands and Norfolk Island.

< this page intentionally left blank >

United Nations Department of Economic and Social Affairs/Population Division 1
International Migration Report 2015
I. LEVELS AND TRENDS IN INTERNATIONAL MIGRANT STOCK
A. INTERNATIONAL MIGRANTS BY
DEVELOPMENT GROUP
Globally, there were 244 million international
migrants in 2015.i Of these, nearly 58 per cent
lived in the developed regions, while the
developing regions hosted 42 per cent of the
world’s total. Of the 140 million international
migrants living in the global North in 2015,ii
85 million, or 61 per cent, originated from a
developing country, while 55 million, or 39 per
cent, were born in the North. Meanwhile,
90 million, or 87 per cent, of the 103 million
international migrants residing in the global South
in 2015 originated from other parts of the
developing world, while 13 million, or 13 per
cent, were born in the North.
Between 1990 and 2015, the number of
international migrants worldwide rose by over 91
million, or by 60 per cent. Much of this growth
occurred between 2000 and 2010, when some 4.9
million migrants were added annually, compared
to an average of 2.0 million from 1990 to 2000
and 4.4 million from 2010 to 2015 (table I.1).
Between 1990 and 2015, the developed regions
gained 58 million international migrants, or 64 per
cent, of the 91 million added worldwide, whereas
the developing regions added 33 million, or 36 per
cent. While the North gained the larger number of
international migrants between 1990 and 2015,
from 2010 to 2015 the average annual increase of
the migrant stock in the South exceeded that in the
North: 2.9 versus 1.2 per cent, respectively.
The increase in the number of international
migrants in the developed regions resulted from
the increase in the number of migrants from
countries of both the South and the North. Of the
58 million international migrants added in the
North between 1990 and 2015, 44 million, or 76
per cent, were born in the South. The remaining
14 million international migrants, or 24 per cent,
originated from a country in the North.
TABLE I.1: NUMBER AND AVERAGE ANNUAL CHANGE OF INTERNATIONAL MIGRANT STOCK
BY DEVELOPMENT GROUP AND MAJOR AREA, 1990-2015
International migrant stock (millions)
Average annual change in migrant stock (millions)
1990 2000 2010 2015 1990-2000 2000-2010 2010-2015 1990-2015
World 152.6 172.7 221.7 243.7 2.0 4.9 4.4 3.6
Developed regions 82.4 103.4 132.6 140.5 2.1 2.9 1.6 2.3
Developing regions 70.2 69.3 89.2 103.2 -0.1 2.0 2.8 1.3
Africa 15.7 14.8 16.8 20.6 -0.1 0.2 0.8 0.2
Asia 48.1 49.3 65.9 75.1 0.1 1.7 1.8 1.1
Europe 49.2 56.3 72.4 76.1 0.7 1.6 0.8 1.1
LAC 7.2 6.6 8.2 9.2 -0.1 0.2 0.2 0.1
NA 27.6 40.4 51.2 54.5 1.3 1.1 0.7 1.1
Oceania 4.7 5.4 7.1 8.1 0.1 0.2 0.2 0.1 Source: United Nations, Department of Economic and Social Affairs, Population Division (2015).
Note: LAC refers to Latin America and the Caribbean, while NA refers to Northern America.
Box I.1. Who is an international migrant?
For the purpose of estimating the
international migrant stock, international
migrants are equated either with the
foreign-born or with foreign citizens.
When data on place of birth are available,
they are generally given precedence.
Of the 232 countries or areas in Trends in
International Migrant Stock: The 2015
Revision, data on the foreign-born were
available for 188, or 81 per cent. Data on
foreign citizens were used for 44 countries
or areas, or 19 per cent of the total.

Chapter I. Levels and trends in international migrant stock
2 United Nations Department of Economic and Social Affairs/Population Division
International Migration Report 2015
Figure I.1: Numbers of international migrants by
development group of the countries or areas of
destination and origin, 1990-2015 (millions)
Source: United Nations, Department of Economic and Social Affairs, Population Division (2015).
By contrast, in the developing countries, the
growth of the migrant population resulted mainly
from an increase in the number of migrants from
the South. Between 1990 and 2015, the migrant
population originating from the South and living
in the South grew from 57 million to 90 million, a
57 per cent increase (figure I.1). Of the 33 million
foreign-born persons added during this period,
over 99 per cent were born in the developing
regions, while less than 1 per cent originated from
a country in the North.
Worldwide, international migrants accounted
for a relatively small share of the total population,
comprising about 3.3 per cent of the world
population in 2015, compared to 2.9 per cent in
1990. In the North, international migrants
constituted 11.2 per cent of the total population in
2015 compared to 1.7 per cent in the developing
regions. Between 1990 and 2015, international
migrants as a share of the total population grew in
the North but changed very little in the South.
B. INTERNATIONAL MIGRANTS BY MAJOR AREA
Europe and Asia combined hosted nearly two
thirds of all international migrants worldwide in
2015, with 76 million international migrants
living in Europe and 75 million in Asia. Northern
America hosted the third largest number of
international migrants in 2013 (54 million),
followed by Africa (21 million), Latin America
and the Caribbean (9 million), and Oceania (8
million) (table I.1).
Between 1990 and 2015, Asia, Europe and
Northern America recorded the largest gains in the
number of international migrants, adding roughly
27 million migrants each, equal to nearly 1.1
million additional migrants per year (figure I.2).
Of the 27 million international migrants added in
Asia during this period, 24 million, or 90 per cent,
were born in other countries of Asia. For Europe
and Northern America the pattern was more
TABLE I.2: NUMBER OF INTERNATIONAL MIGRANTS BY DEVELOPMENT GROUP
AND MAJOR AREA OF DESTINATION AND ORIGIN, 2015 (millions)
Destination
Origin
Developed regions
Developing regions Africa Asia Europe LAC NA Oceania Other World
Developed regions 55.2 85.3 12.0 40.3 50.4 29.7 2.5 1.6 4.1 140.5
Developing regions 13.0 90.2 20.6 59.5 9.2 6.1 1.9 0.2 5.7 103.2
Africa 1.4 19.2 16.4 1.2 1.0 0.0 0.1 0.0 1.9 20.6
Asia 8.8 66.3 4.1 59.4 6.9 0.4 0.5 0.1 3.6 75.1
Europe 42.0 34.2 9.2 20.2 39.9 4.6 1.0 0.4 0.8 76.1
LAC 2.8 6.4 0.1 0.3 1.3 5.9 1.3 0.0 0.3 9.2
NA 9.2 45.2 2.3 15.5 7.5 24.6 1.2 0.3 3.1 54.5
Oceania 4.0 4.1 0.5 3.0 3.0 0.2 0.2 1.1 0.1 8.1
World 68.2 175.5 32.6 99.8 59.6 35.8 4.3 1.8 9.8 243.7 Source: United Nations, Department of Economic and Social Affairs, Population Division (2015).
Note: LAC refers to Latin America and the Caribbean, while NA refers to Northern America.
0
10
20
30
40
50
60
70
80
90
1990 1995 2000 2005 2010 2015
Nu
mb
er o
f m
igra
nts
(m
illi
on
s)
South-SouthNorth-SouthSouth-NorthNorth-North

Chapter I. Levels and trends in international migrant stock
United Nations Department of Economic and Social Affairs/Population Division 3
International Migration Report 2015
diversified. Of the 27 million international
migrants gained by Europe during this period, 45
per cent were born in Europe, 25 per cent in Asia,
nearly 18 per cent in Africa and 13 per cent in
Latin America and the Caribbean. For Northern
America, nearly 15 million, or 54 per cent of the
27 million migrants gained between 1990 and
2015, were born in Latin America and the
Caribbean, while 9 million, or 35 per cent,
originated from Asia and nearly 2 million, or 6 per
cent, from Africa.
Figure I.2. Number of international migrants by
major area of destination, 1990-2015 (millions)
Source: United Nations, Department of Economic and Social
Affairs, Population Division (2015). Note: LAC refers to Latin America and the Caribbean, while NA refers to Northern America.
While all three major areas — Asia, Europe
and Northern America — experienced a large
growth in the number of international migrants
between 1990 and 2015, after 2000 Asia added
more international migrants than any other major
area (figure I.3). Asia gained an average of 1.7
million international migrants per annum between
2000 and 2010 and 1.8 million per annum
between 2010 and 2015, the largest gain amongst
all major areas. Europe added the second largest
number of international migrants between 2000
and 2015, with an average of 1.6 million migrants
added per annum from 2000 to 2010 and nearly
0.8 million from 2010 to 2015.
Northern America added the third largest
number of international migrants since the year
2000; however, the number of international
migrants added per year has continued to decline.
Between 2010 and 2015, the average annual
addition of international migrants to the
population of Northern America was slightly less
than half the level observed from 1990 to 2000,
falling from 1.3 million to 0.7 million. Moreover,
between 2010 and 2015, Northern America added
only half as many international migrants as did
Asia. Meanwhile, Africa, which experienced a
relatively small growth in the number of
international migrants between 1990 and 2010,
gained roughly the same number as did Europe
and Northern America from 2010 to 2015.
In 2015, Asia-to-Asia was the largest regional
migration corridor in the world, with some 59
million international migrants born in that region
residing in another country of Asia. From 2000 to
2010, the Asia-to-Asia corridor grew by an average
of 1.5 million international migrants per year, a
figure that increased to 1.6 million between 2010
and 2015 (figure I.4). Europe-to-Europe was the
second largest regional corridor in 2015, with
nearly 40 million international migrants born in
Europe living in another country of Europe.
However, between 2010 and 2015, the intensity
of migration along this regional corridor declined,
as the average annual increase in the Europe-to-
Europe migrant stock fell to 0.4 million compared
to 0.7 million between 2000 and 2010.
The corridor from Latin America and the
Caribbean to Northern America was the third
largest in 2015, with nearly 25 million
international migrants. However, the number of
international migrants added annually via this
corridor declined steadily, falling from an average
of 0.8 million between 1990 and 2000 to 0.3
million between 2010 and 2015. The latter period
marked the first time that more migrants were
added to the population of Northern America
coming from Asia than from Latin America and
the Caribbean. The Asia-to-Europe corridor was
the fourth largest in 2015, with 20 million
international migrants from Asia residing in
0 20 40 60 80 100
Oceania
LAC
Africa
NA
Asia
Europe
Number of migrants (millions)
2015 2010
2005 2000
1995 1990

Chapter I. Levels and trends in international migrant stock
4 United Nations Department of Economic and Social Affairs/Population Division
International Migration Report 2015
Europe; it also recorded a decline in the average
number of migrants added per year from 2010 to
2015 compared to the period between 2000 and
2010. The Africa-to-Africa corridor, with 16
million international migrants in 2015,
represented the fifth largest in the world; between
2010 and 2015, it gained a larger number of
migrants than any other regional corridor with the
exception of the Asia-to-Asia corridor.
Figure I.3. Average annual change in the number of international migrants
by major area of destination, 1990-2015 (millions)
Source: United Nations, Department of Economic and Social Affairs, Population Division (2015).
Figure I.4. Average annual change in the number of international migrants
along the six largest regional migration corridors, 1990-2015 (millions)
Source: United Nations, Department of Economic and Social Affairs, Population Division (2015).
Note: LAC refers to Latin America and the Caribbean, while NA refers to Northern America.
-0.2
0.0
0.2
0.4
0.6
0.8
1.0
1.2
1.4
1.6
1.8
2.0
Africa Asia Europe Latin America
and the
Caribbean
Northern
America
Oceania
Aver
age
ann
ual
ch
ange
(mil
lio
ns)
1990-2000
2000-2010
2010-2015
-0.2
0.0
0.2
0.4
0.6
0.8
1.0
1.2
1.4
1.6
1.8
Asia→ Asia Europe→ Europe LAC→ NA Asia→ Europe Africa→ Africa Asia→ NA
Aver
age
ann
ual
ch
ange
(mil
lio
ns)
1990-2000
2000-2010
2010-2015

Chapter I. Levels and trends in international migrant stock
United Nations Department of Economic and Social Affairs/Population Division 5
International Migration Report 2015
Between 1990 and 2015, the share of
international migrants in the total population grew
rapidly in Europe, Northern America and Oceania,
while it remained relatively small in Africa, Asia
and Latin America and the Caribbean. Oceania,
the major area with the highest share of migrants
as a component of the total population, saw this
figure climb from 17.5 per cent in 1990 to 20.6
per cent in 2015. In Northern America, the
proportion of international migrants reached 15.2
per cent of the total population in 2015, up from
9.8 per cent in 1990, while in Europe it rose from
6.8 per cent in 1990 to 10.3 per cent in 2015.
In 2015, Latin America and the Caribbean
had the lowest proportion of international
migrants in the total population (1.5 per cent),
followed by Asia and Africa (1.7 per cent each).
Both Africa and Latin America and the Caribbean
experienced a decline in the share of international
migrants in the total population between 1990 and
2015, implying that the overall population
increased more rapidly in those major areas than
the total migrant stock.
C. INTERNATIONAL MIGRANTS BY
COUNTRY OR AREA
In 2015, over 51 per cent of all international
migrants in the world were living in ten countries.
The largest number resided in the United States of
America, which hosted 47 million migrants in
2015, or 19 per cent of the world’s total (figure
I.5). Germany and the Russian Federation hosted
the second and third largest numbers (12 million
each), followed by Saudi Arabia (10 million), the
United Kingdom (nearly 9 million) and the United
Arab Emirates (8 million).
Between 1990 and 2015, the size of the
international migrant stock grew in 169 countries
or areas, while it declined in 63 others. The
United States of America experienced the largest
increase of the migrant stock between 1990 and
2015, adding a total of 23 million migrants, equal
to 0.9 million additional migrants per annum. The
United Arab Emirates recorded the second largest
gain during this period (7 million), followed by
Germany (6 million), and Saudi Arabia and Spain
(5 million each). Most countries with the largest
gains in the migrant stock between 1990 and 2015
witnessed a deceleration in the annual growth rate
of the migrant population between 2010 and 2015
compared to the period from 2000 to 2010.
Figure I.5. Ten countries hosting the largest number of
international migrants in 2015, 1990-2015 (millions)
Source: United Nations, Department of Economic and Social
Affairs, Population Division (2015). Note: Russia refers to the Russian Federation, UAE refers to
United Arab Emirates, UK refers to the United Kingdom of Britain
and Northern Ireland and USA refers to the United States of America.
Bilateral migration corridors shifted
significantly between 1990 and 2015. Between
1990 and 2000, six of the ten bilateral corridors
with the largest average annual increase in the
number of international migrants had a country in
the North as destination. The United States of
America was the destination of four of the top ten
bilateral migration corridors during this period,
with large numbers of international migrants
originating from Mexico, India, China and the
Philippines. Mexico-to-USA was the largest
0 10 20 30 40 50
Spain
Australia
France
Canada
UAE
UK
Saudi Arabia
Russia
Germany
USA
Number of migrants (millions)
2015 2010
2005 2000
1995 1990

Chapter I. Levels and trends in international migrant stock
6 United Nations Department of Economic and Social Affairs/Population Division
International Migration Report 2015
Figure I.6. Ten bilateral migration corridors with the largest average annual change
in the number of international migrants, 1990-2015 (thousands)
2010-2015
2000-2010
1990-2000
Source: United Nations, Department of Economic and Social Affairs, Population Division (2015). Note: Russia refers to the Russian Federation, Syria refers to the Syrian Arab Republic, UAE refers to United Arab Emirates, UK refers to the United Kingdom of Britain and Northern Ireland and USA refers to the United States of America.
0 100 200 300 400 500 600
India→ Saudi Arabia
Myanmar→ Thailand
State of Palestine→ Jordan
India→ Kuwait
Mexico→ USA
Syria→ Jordan
Sudan→ South Sudan
India→ UAE
Syria→ Lebanon
Syria→ Turkey
0 100 200 300 400 500 600
India→ Saudi Arabia
Bangladesh→ UAE
India→ USA
Romania→ Spain
Romania→ Italy
Myanmar→ Thailand
Iraq→ Syria
Poland→ Germany
India→ UAE
Mexico→ USA
0 100 200 300 400 500 600
Philippines→ USA
India→ UAE
Kazakhstan→ Germany
Myanmar→ Thailand
Malaysia→ Singapore
China→ USA
India→ USA
State of Palestine→ Jordan
Russia→ Germany
Mexico→ USA
Average annual change (millions)
Chapter I. Levels and trends in international migrant stock
United Nations Department of Economic and Social Affairs/Population Division 7
International Migration Report 2015
bilateral migration corridor in the world, with an
annual average of nearly 500,000 migrants born in
Mexico being added to the population of the
United States of America from 1990 to 2000
(figure I.6).
Two of the top ten bilateral migration
corridors between 1990 and 2000 had Germany as
the destination, while four corridors were between
countries or areas of Asia, namely between India
and the United Arab Emirates, between Malaysia
and Singapore, between Myanmar and Thailand,
and between the State of Palestine and Jordan.
The latter included a large number of refugees
falling under the mandate of the United Nations
Relief and Works Agency for Palestine Refugees
in the Near East (UNRWA).
During the period from 2000 to 2010, the top
ten bilateral migration corridors were equally split
between those having a country in the South or a
country in the North as the destination. Mexico-
USA continued to be the corridor with the largest
gain — on average, around 240,000 additional
migrants per year — though at much lower levels
than during the preceding decade. Between 2000
and 2010, some countries of Southern Europe,
namely Italy and Spain, became major
destinations of international migrants originating
from countries of Eastern Europe, in particular
from Romania. In addition, three of the top ten
corridors were between a country of Southern
Asia and an oil-producing country of Western
Asia: Bangladesh-UAE, India-Saudi Arabia, and
India-UAE. Refugees displaced by the war in Iraq
also accounted for large numbers of the migrants
added in Western Asia between 2000 and 2010.
By the period from 2010 to 2015, migration
patterns had changed significantly: only one of
the largest migration corridors in the world had a
country in the North as the destination, namely
Mexico-USA. The other nine corridors had a
country in the South as the destination. Eight of
these were between countries in Asia, while one
was between countries in Africa, namely from
Sudan to South Sudan. As in the period from
2000 to 2010, several of the destinations that
recorded the largest increase in the number of
international migrants were oil-producing
countries in Western Asia. In addition, the
conflict in the Syrian Arab Republic led to a large
increase in the number of refugees living in
neighbouring countries, in particular Jordan,
Lebanon and Turkey.
In 2015, international migrants accounted for
at least a quarter of the population in 43 countries
or areas. These included small island states in the
Caribbean, Micronesia or Polynesia as well
countries in Western Asia. By contrast, in many
countries of Africa, Eastern Asia, South America
and Southern Asia, migrants accounted for less
than 5 per cent of the total population.
D. INTERNATIONAL MIGRANTS BY SEX
In 2015, women comprised 48.2 per cent of
all international migrants worldwide. Yet there
were considerable differences in this percentage
across regions. In the North, women constituted
51.9 per cent of all migrants in 2015, while in the
South they accounted for 43.3 per cent. The
percentage of women among all migrants declined
from 46.4 in 1990 to 43.3 in 2015 in the
developing regions. In the North, however, the
share of women amongst international migrants
increased slightly, from 51.1 to 51.9 per cent
during the same period.
The decline in the percentage of women
among migrants in the South was primarily the
result of a rapid increase in the number of male
migrants in Asia between 2000 and 2015. During
this period, the increase in the number of male
migrants in Asia (62 per cent) far exceeded the
increase the number of female migrants (40 per
cent). The increase in the number of male
migrants in Asia was fuelled by the strong
demand for migrant workers in the oil-producing
countries of Western Asia.
Major areas with well-established histories of
immigration have hosted the highest percentages
of female migrants. In 2015, the percentage
female among all migrants was highest in Europe
(52.4 per cent), followed by Northern America
(51.2 per cent). The higher proportion of women
in these major areas was mainly the outcome of
the aging process, whereby migrants who had
arrived decades earlier were remaining to grow

Chapter I. Levels and trends in international migrant stock
8 United Nations Department of Economic and Social Affairs/Population Division
International Migration Report 2015
older in the host country, combined with the fact
that women, including female migrants, tend to
have longer life expectancies compared to their
male counterparts. By contrast, male migrants
significantly outnumbered female migrants in
Asia (58 per cent) and Africa (53.9 per cent),
where migration was typically of shorter duration
(figure I.7).
Figure I.7. Percentage of women among all international
migrants by major area of destination, 1990-2015
Source: United Nations, Department of Economic and Social
Affairs, Population Division (2015). Note: LAC refers to Latin America and the Caribbean, while NA refers to Northern America.
Between 1990 and 2015, the proportion of
women among all international migrants declined
in Asia and, to a lesser extent, in Africa. In Asia
the percentage of female migrants fell from 46 per
cent in 1990 to 42 per cent in 2015. By contrast,
in Europe and Oceania, the share of women
amongst all migrants rose. This increase was
primarily due to the ageing of the migrant
population residing in those areas.
In 2015, women constituted more than half of
all international migrants in 101 countries or
areas. Estonia, Latvia, Poland and the Republic of
Moldova were among the countries with the
highest shares. In 11 countries, all of them
located in Africa or Asia, women accounted for
less than a third of all international migrants.
Bangladesh, Oman and Qatar were among the
countries with the lowest proportions of female
migrants in 2015.
E. INTERNATIONAL MIGRANTS BY AGE AND SEX
In 2015, nearly three quarters of all
international migrants were between the ages of
20 and 64 (figure I.8). Of the 177 million
international migrants of working age, the
majority (59 per cent) resided in the developed
regions. This distribution had changed little since
the year 1990, when 57 per cent of working-age
migrants resided in the North. Amongst migrants
of working age, women represented a larger share
of migrants in the developed regions than in the
developing regions — 51 per cent versus 41 per
cent, respectively, in 2015.
Figure I.8. Number of international migrants by age
and by development group of the country or area
of destination, 2015 (millions)
Source: United Nations, Department of Economic and Social Affairs, Population Division (2015).
While the North hosted the largest number of
working-age migrants in 2015, the number of
migrants in the working ages grew faster in the
South than in the North between 2000 and 2015.
In the South, the number of migrants of working
age increased from 46 million in 2000 to 72
million in 2015, a 57 per cent increase, compared
0 10 20 30 40 50
Asia
Africa
LAC
Oceania
NA
Europe
Percentage female
201520102005200019951990
0
2
4
6
8
10
12
14
16
0-4
5-9
10-1
4
15-1
9
20-2
4
25-2
9
30-3
4
35-3
9
40-4
4
45-4
9
50-5
4
55-5
9
60-6
4
65-6
9
70-7
4
75+
Num
ber
of
mig
rants
(m
illi
ons)
Developed regions
Developing regions

Chapter I. Levels and trends in international migrant stock
United Nations Department of Economic and Social Affairs/Population Division 9
International Migration Report 2015
to the North, where it rose from 77 to 105 million,
a 36 per cent increase, over the same time period.
Women accounted for around half of the increase
in the North (53 per cent) compared to roughly a
third of the increase in the South (35 per cent).
Globally, 15 per cent of all international
migrants were under the age of 20 in 2015. The
proportion of young migrants was significantly
higher in the developing regions (22 per cent) than
in the developed regions (less than 10 per cent).
There were about three times as many migrants
under 5 years of age living in the South as in the
North. Between 1990 and 2015, the proportion of
young persons amongst all migrants worldwide
declined. The proportion of those under age 20
declined from 20 per cent in 1990 to 17 per cent
in 2000, and then further to 15 per cent in 2015.
Figure I.9. Percentage female among all international
migrants by age and development group of the
country or area of destination, 2015
Source: United Nations, Department of Economic and Social
Affairs, Population Division (2015).
Globally, there were 30 million international
migrants aged 65 or over in 2015. The majority
of older migrants lived in the developed regions,
with nearly 2.5 times as many migrants aged 65 or
above living in the North as in the South (figure
I.8). Between 1990 and 2015, the number of
international migrants in this age range grew
significantly in the North but changed only
slightly in the South. The North experienced an
increase of more than 10 million migrants aged 65
or over from 1990 to 2015. During the same
period, the number of older migrants in the global
South increased by around 1 million. The fact
that many developed countries had long been the
destination of international migrants, combined
with the greater propensity among migrants living
in the developing world to return to their countries
of origin, helps to explain the rising numbers of
older migrants residing in the developed regions
compared to the developing regions.
Globally, the proportion of older migrants
was higher for women (15 per cent) than for men
(11 per cent). In 2015, 56 per cent of international
migrants aged 65 or over were women. In the
developed regions, 58 per cent of all migrants
aged 65 or over were women, compared to 52 per
cent in the developing regions.
___________________
NOTES
i The estimates of the migrant stock were prepared by the
Population Division of the Department of Economic and
Social Affairs of the United Nations Secretariat. The data
presented here refer to the international migrant stock defined
as a mid-year estimate of the number of people living in a
country or area other than the one in which they were born or,
in the absence of such data, the number of people of foreign
citizenship. Most statistics used to estimate the international
migrant stock were obtained from population censuses,
population registers and nationally representative household
surveys. The following should be cited when referring to the
data in this report: United Nations, Department of Economic
and Social Affairs, Population Division. Trends in
International Migrant Stock: The 2015 Revision (United
Nations database, POP/DB/MIG/Stock/Rev.2015). See:
www. unmigration.org.
ii The global North refers to countries or regions typically
classified as “developed”, while the global South refers to
those classified as “developing”. The developed regions
include Europe and Northern America plus Australia, New
Zealand and Japan; the developing regions include the
remainder of the world. The use of these terms does not
imply any judgment about the current developmental stage of
a particular country or area. See Explanatory Notes for
additional information.
20
30
40
50
60
70
80
0-4
5-9
10-1
4 1
5-1
92
0-2
42
5-2
93
0-3
43
5-3
94
0-4
44
5-4
95
0-5
45
5-5
96
0-6
46
5-6
97
0-7
47
5+
Per
centa
ge
fem
ale
World
Developed regions
Developing regions

< this page intentionally left blank >

United Nations Department of Economic and Social Affairs/Population Division 11
International Migration Report 2015
II. NET INTERNATIONAL MIGRATION
A. GLOBAL TRENDS
From 1950 to 2015, the developed regions
gained population due to positive net migration
while the developing regions lost population as a
result of negative net migration. Between 1950
and 2010, the magnitude of the net inflow of
migrants to the developed regions increased
steadily, reaching an average of 3.2 million per
year between 2000 and 2010, up from less than
0.3 million per annum from 1950 to 1970. After
2010, however, the size of the net inflow of
persons to the developed regions declined for the
first time in five decades, falling to 2.3 million per
year between 2010 and 2015.
Much of the recent decline in the net inflow
of migrants to the developed regions was due to a
reduction in net migration to Europe, which
declined by over half, falling from 1.7 million per
annum between 2000 and 2010 to 0.8 million
between 2010 and 2015 (figure II.1). The level of
net migration to Northern America and to Oceania
was stable between 2000 and 2015.
Both Asia and Latin America and the
Caribbean have experienced a recent decline in
the net outflow of migrants. For Asia as a whole,
annual net emigration fell from 1.9 million
between 2000 and 2010 to 1.3 million between
2010 and 2015, while net emigration from Latin
America and the Caribbean dropped by half, from
0.8 to 0.4 million per annum. Conversely, the net
outflow from Africa increased from 0.3 million
per annum between 2000 and 2010 to 0.6 million
between 2010 and 2015.
Figure II.1. Average annual net migration by major area,
from 1950-1970 to 2010-2015 (millions)
Source: United Nations, Department of Economic and Social
Affairs, Population Division (2015). World Population Prospects: The 2015 Revision, DVD Edition. Note: LAC refers to Latin America and the Caribbean, while
NA refers to Northern America.
These regional trends mask substantial
variations at the country level. Between 2000 and
2010, amongst the 232 countries or areas
comprising the total population of the world, 95
gained population from net immigration while 134
lost population due to net emigration. By
-0.2 -0.4 -0.2 -0.3 -0.60.1
-0.3
-1.5-1.9 -1.3
-0.2
0.40.9
1.7
0.8
-0.2-0.6
-0.8
-0.8
-0.4
0.4
0.8
1.5
1.2
1.2
0.1
0.1
0.1
0.2
0.2
-4
-3
-2
-1
0
1
2
3
4
1950-1970 1970-1990 1990-2000 2000-2010 2010-2015
Net
mig
rati
on
(m
illi
on
s)
Africa Asia Europe LAC NA Oceania
Box II.1. Net migration:
Definition and related terminology
Net migration, for a given country and time
period, refers to the difference between the
number of immigrants and the number of
emigrants. If more people immigrate than
emigrate, the country gains population due
to positive net migration, or
net immigration; when more people
emigrate than immigrate, the country loses
population through negative net migration,
or net emigration.
The data on net migration presented here
do not include information on the country
or region of origin or destination. For
regions or groups of countries, the level of
net migration reflects only movements
from or to countries located outside the
region or group. For the world as a whole,
the level of net migration is zero.

Chapter II. Net international migration
12 United Nations Department of Economic and Social Affairs/Population Division
International Migration Report 2015
TABLE II.1: NUMBER OF COUNTRIES OR AREAS WITH POSITIVE OR NEGATIVE NET MIGRATION
DURING 2000-2010 AND 2010-2015, AND THOSE WITH A CHANGE IN THE DIRECTION OF NET MIGRATION
BETWEEN 2000-2010 AND 2010-2015, BY DEVELOPMENT GROUP AND MAJOR AREA
Number of countries or areas with:
Development group and major area
Positive net migration
(Net immigration)
Negative net migration
(Net emigration)
Change in the direction
of net migration between 2000-2010 and 2010-2015
2000-2010 2010-2015 2000-2010 2010-2015 From positive
to negative
From negative
to positive
World................................................. 95 89 134 137 15 8
Developed regions ......................... 41 33 15 23 8 —
Developing regions ........................ 54 56 119 114 7 8
Africa................................................. 16 11 42 46 7 2
Asia ................................................... 21 23 28 26 — 2
Europe ............................................... 36 28 12 20 8 —
Latin America and the Caribbean ...... 16 19 31 28 — 2
Northern America .............................. 2 2 3 3 — —
Oceania .............................................. 4 6 18 14 — 2
Source: United Nations, Department of Economic and Social Affairs, Population Division (2015). World Population Prospects: The 2015
Revision, DVD Edition.
Note: Countries or areas estimated to have zero net migration in 2000-2010 or 2010-2015 were excluded from these tabulations.
the period from 2010 to 2015, the number of
countries or areas gaining population due to
positive net migration had fallen to 89, while the
number of countries or areas losing population
due to negative net migration had risen to 137
(table II.1).
In the developed regions, the majority of
countries or areas experienced positive net
migration. However, that number decreased from
41 between 2000 and 2010 to 33 in the period
from 2010 to 2015. In the developing regions,
while the majority of countries or areas
experienced negative net migration in both time
intervals, the number doing so declined from 119
between 2000 and 2010 to 114 in the period from
2010 to 2015, while the number of countries
gaining population due to net immigration
increased slightly, from 54 to 56.
Comparing the same two time periods, the
number of countries recording net inflows of
migrants increased in Asia, Latin America and the
Caribbean and Oceania, decreased in Africa and
Europe, and remained the same in Northern
America. Among countries gaining population
from positive net migration both between 2000
and 2010 and between 2010 and 2015 were the
traditional countries of immigration — Australia,
Canada, New Zealand and the United States of
America — and a few countries that started to
experience increasing levels of immigration
between 2000 and 2010, such as Italy and the
Russian Federation. Countries in the developing
regions that were recruiting migrant labourers on
a large scale, such as Qatar, Singapore and the
United Arab Emirates, were also amongst the
countries experiencing positive net migration in
both time periods.
Among the group of countries experiencing
net emigration between 2000 and 2015 were
traditional countries of emigration, such as
Bangladesh, China, India, Mexico and the
Philippines. Many of these countries had long-
standing ties with traditional countries of
immigration, such as Canada, the United
Kingdom and the United States of America, while
others had newly established ties with countries in
South-Eastern or Western Asia that were
recruiting foreign workers.
Eight countries or areas, all in the developing
regions, transitioned from being a net emigration
country between 2000 and 2010 to being a net
immigration country between 2010 and 2015. For
some of these countries, such as Iraq or Turkey,
the shift was due in part to an influx of refugees
from neighbouring countries during the latter
period.
Chapter II. Net international migration
United Nations Department of Economic and Social Affairs/Population Division 13
International Migration Report 2015
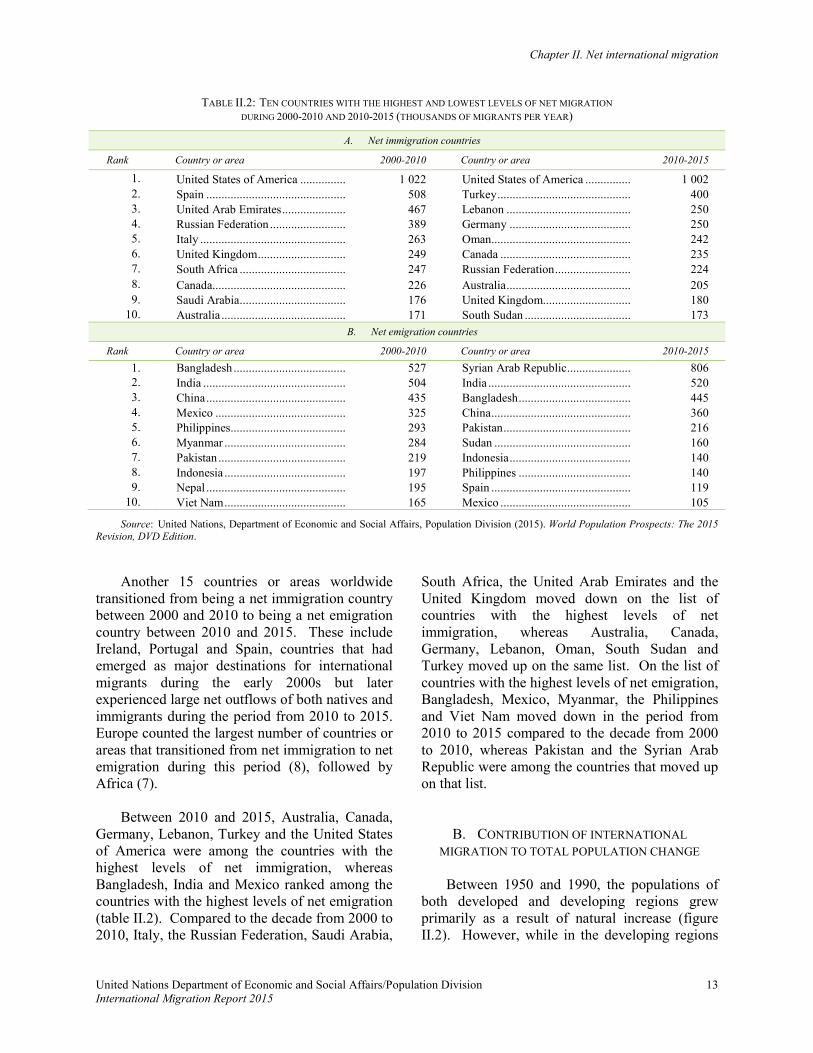
TABLE II.2: TEN COUNTRIES WITH THE HIGHEST AND LOWEST LEVELS OF NET MIGRATION
DURING 2000-2010 AND 2010-2015 (THOUSANDS OF MIGRANTS PER YEAR)
A. Net immigration countries
Rank Country or area 2000-2010 Country or area 2010-2015
1. United States of America ............... 1 022 United States of America ............... 1 002
2. Spain .............................................. 508 Turkey ............................................ 400
3. United Arab Emirates ..................... 467 Lebanon ......................................... 250
4. Russian Federation ......................... 389 Germany ........................................ 250
5. Italy ................................................ 263 Oman.............................................. 242
6. United Kingdom ............................. 249 Canada ........................................... 235
7. South Africa ................................... 247 Russian Federation ......................... 224
8. Canada............................................ 226 Australia ......................................... 205
9. Saudi Arabia ................................... 176 United Kingdom............................. 180
10. Australia ......................................... 171 South Sudan ................................... 173
B. Net emigration countries
Rank Country or area 2000-2010 Country or area 2010-2015
1. Bangladesh ..................................... 527 Syrian Arab Republic ..................... 806
2. India ............................................... 504 India ............................................... 520
3. China .............................................. 435 Bangladesh ..................................... 445
4. Mexico ........................................... 325 China .............................................. 360
5. Philippines ...................................... 293 Pakistan .......................................... 216
6. Myanmar ........................................ 284 Sudan ............................................. 160
7. Pakistan .......................................... 219 Indonesia ........................................ 140
8. Indonesia ........................................ 197 Philippines ..................................... 140
9. Nepal .............................................. 195 Spain .............................................. 119
10. Viet Nam ........................................ 165 Mexico ........................................... 105
Source: United Nations, Department of Economic and Social Affairs, Population Division (2015). World Population Prospects: The 2015
Revision, DVD Edition.
Another 15 countries or areas worldwide
transitioned from being a net immigration country
between 2000 and 2010 to being a net emigration
country between 2010 and 2015. These include
Ireland, Portugal and Spain, countries that had
emerged as major destinations for international
migrants during the early 2000s but later
experienced large net outflows of both natives and
immigrants during the period from 2010 to 2015.
Europe counted the largest number of countries or
areas that transitioned from net immigration to net
emigration during this period (8), followed by
Africa (7).
Between 2010 and 2015, Australia, Canada,
Germany, Lebanon, Turkey and the United States
of America were among the countries with the
highest levels of net immigration, whereas
Bangladesh, India and Mexico ranked among the
countries with the highest levels of net emigration
(table II.2). Compared to the decade from 2000 to
2010, Italy, the Russian Federation, Saudi Arabia,
South Africa, the United Arab Emirates and the
United Kingdom moved down on the list of
countries with the highest levels of net
immigration, whereas Australia, Canada,
Germany, Lebanon, Oman, South Sudan and
Turkey moved up on the same list. On the list of
countries with the highest levels of net emigration,
Bangladesh, Mexico, Myanmar, the Philippines
and Viet Nam moved down in the period from
2010 to 2015 compared to the decade from 2000
to 2010, whereas Pakistan and the Syrian Arab
Republic were among the countries that moved up
on that list.
B. CONTRIBUTION OF INTERNATIONAL
MIGRATION TO TOTAL POPULATION CHANGE
Between 1950 and 1990, the populations of
both developed and developing regions grew
primarily as a result of natural increase (figure
II.2). However, while in the developing regions

Chapter II. Net international migration
14 United Nations Department of Economic and Social Affairs/Population Division
International Migration Report 2015
the net change in population size rose from 391
million between 1950 and 1960 to 800 million
between 1980 and 1990, in the developed regions
it fell from 102 to 63 million over the same time
period.
By the decade from 1990 to 2000, net
migration had overtaken natural increase as the
primary driver of population growth in the
developed regions. Meanwhile, the population of
the developing regions continued to grow due to a
surplus of births over deaths, albeit at lower rates
than during the previous four decades. Moreover,
the impact of net emigration on overall population
change in the developing regions remained
relatively small.
In the developed regions, net immigration has
been the main driver of population growth since
the decade from 2000 to 2010, and is expected to
be the sole driver of growth in the developed
regions as a whole starting in the decade from
2020 to 2030. From 2000 to 2030, population
growth in the developing regions is expected to
slow down due to a decline in natural increase
caused by a drop in the birth rate, with net
emigration continuing to play a minor role in
overall population change.
By the decade from 2040 to 2050, population
growth in the developed regions is projected to be
negative, with positive net migration no longer
able to compensate for the excess of deaths over
births. For the developing regions in this period,
population growth is projected to continue due to
natural increase, albeit at declining rates, with
negative net migration still having a relatively
small effect.
Figure II.2. Contribution of natural increase and net migration to total population change
by development group, from 1950-1960 to 2040-2050 (millions of persons per decade)
Source: United Nations, Department of Economic and Social Affairs, Population Division (2015). World Population Prospects: The 2015 Revision, DVD Edition.
-40
-20
0
20
40
60
80
100
120
1950-1960 1980-1990 2010-2020 2040-2050
Millions Developed regions
-200
0
200
400
600
800
1,000
1950-1960 1980-1990 2010-2020 2040-2050
Millions Developing regions
Net change Net migration Natural increase
Box II.2. Net migration
and population change
A population grows or declines over time
due to natural increase, the number of births
minus the number of deaths, and net
migration, the number of immigrants minus
the number of emigrants. Migration affects
population size by the addition of
immigrants and the subtraction of emigrants.
Migration can also affect the age distribution
of a population and its levels of mortality
and fertility.

Chapter II. Net international migration
United Nations Department of Economic and Social Affairs/Population Division 15
International Migration Report 2015
Figure II.3. Contribution of natural increase and net migration to total population change
by major area, from 1950-1960 to 2040-2050 (millions of persons per decade)
Source: United Nations, Department of Economic and Social Affairs, Population Division (2015). World Population Prospects: The 2015
Revision, DVD Edition.
-100
0
100
200
300
400
500
600
700
1950-1960 1980-1990 2010-2020 2040-2050
Millions Africa
-100
0
100
200
300
400
500
600
700
1950-1960 1980-1990 2010-2020 2040-2050
Millions Asia
-40
-20
0
20
40
60
80
100
1950-1960 1980-1990 2010-2020 2040-2050
Millions Europe
-40
-20
0
20
40
60
80
100
1950-1960 1980-1990 2010-2020 2040-2050
Millions Latin America and
the Caribbean
0
10
20
30
40
1950-
1960
1960-
1970
1970-
1980
1980-
1990
1990-
2000
2000-
2010
2010-
2020
2020-
2030
2030-
2040
2040-
2050
Millions Northern America
0
2
4
6
8
10
1950-
1960
1960-
1970
1970-
1980
1980-
1990
1990-
2000
2000-
2010
2010-
2020
2020-
2030
2030-
2040
2040-
2050
Millions Oceania
Net change Net migration Natural increase

Chapter II. Net international migration
16 United Nations Department of Economic and Social Affairs/Population Division
International Migration Report 2015
TABLE II.3: PROJECTED POPULATION IN 2050 ACCORDING TO THE MEDIUM VARIANT AND
THE ZERO-NET-MIGRATION SCENARIO, BY DEVELOPMENT GROUP AND MAJOR AREA
Development group and major area
Population in 2050 (millions) Difference between medium variant and
zero-net-migration
scenario (percentage) Medium variant
Zero-net-migration scenario
World .................................................................................... 9 725 9 725 —
Developed regions ............................................................ 1 286 1 178 -8
Developing regions ........................................................... 8 439 8 548 1
Africa .................................................................................... 2 478 2 503 1
Asia ....................................................................................... 5 267 5 333 1
Europe................................................................................... 707 666 -6
Latin America and the Caribbean ......................................... 784 799 2
Northern America ................................................................. 433 376 -13
Oceania ................................................................................. 57 49 -13
Source: United Nations, Department of Economic and Social Affairs, Population Division (2015). World Population Prospects: The 2015
Revision, DVD Edition.
From 1950 to 2010, the populations of Africa,
Asia and Latin America and the Caribbean grew
due to natural increase, although at differing rates
(figure II.3). In these three regions, negative net
migration was more than offset by natural
increase, which will remain the major driver of
future population trends in these major areas over
the next several decades.
In Europe and Northern America, and to a
lesser extent Oceania, positive net migration has
become an increasingly important component of
population growth. Starting in the period between
1990 and 2000, the number of deaths has
exceeded the number of births in Europe but has
been offset by positive net migration, a situation
that is projected to continue until around 2020.
After 2020, the surplus of deaths over births is
projected to be large enough for Europe to
experience a reduction in population size, despite
continued positive net migration. Starting in the
decade from 2030 to 2040, net migration is
projected to overtake natural increase as the main
driver of population growth in Northern America.
For Oceania, although natural increase will
remain the dominant component of population
growth, the contribution of net migration as a
component of total growth is expected to increase
over the next several decades.
Comparing the projected size of the
population in 2050 based on the medium variant
and the zero-net-migration scenario provides
some insight into the relative impact of
Box II.3. Estimating and
projecting net migration
The data used in this chapter are from the
latest population estimates and projections
produced by the United Nations Population
Division. The estimates of net migration for
each country were produced to be consistent
with past trends of fertility and mortality
and with changes in the size of the
population and its distribution by age and
sex. The projected levels of net migration
were generally kept constant until 2045-
2050, with the exception of circumstances
such as large recent fluctuations in
migration numbers, refugee flows, or
temporary labour flows. Estimates refer to
the period from 1950 to 2015 and
projections from 2015 to 2050.
Given the volatility of international
migration flows, it is impossible to project
with great confidence the future levels and
trends of net migration and their impact on
the size and characteristics of the
population. Nonetheless, a comparison
based on different migration scenarios can
assist in assessing the likely impact of
international migration on future
populations.

Chapter II. Net international migration
United Nations Department of Economic and Social Affairs/Population Division 17
International Migration Report 2015
international migration on population change
during the period from 2015 to 2050 (table II.3).
Under the zero-net-migration scenario, the
developed regions would have a population size in
2050 that is about 8 per cent smaller than they
would have had if current migration trends
continued. In contrast, with the same assumption,
the developing regions are projected to record a
population size in 2050 that is about one per cent
larger than what is currently projected.
The zero-net-migration scenario would have
the greatest impact on population change in
Northern America and Oceania. In both regions,
without positive net migration, the total
population would be 13 per cent smaller by 2050.
In Europe, the difference in total population size
between the medium variant and the zero-net-
migration scenario would be just six per cent in
2050. For Africa, Asia, and Latin America and
the Caribbean, the difference in the population
size projected for 2050 between the medium
variant and the zero-net-migration scenario is two
per cent or less.
C. IMPACT OF INTERNATIONAL MIGRATION ON
THE AGE STRUCTURE OF THE POPULATION
Because international migrants tend to
comprise larger proportions of working-age
persons compared to the overall population,
positive net migration can contribute to reducing
the old-age dependency ratio. The old-age
dependency ratio, commonly used to assess the
demographic component of potential changes in
the costs of social and economic support for older
persons, is calculated by dividing the size of the
population aged 65 years or older by that of the
working-age population, aged 15 to 64. In
general, the higher this ratio, the more dependent
persons each potential worker needs to support.
Table II.4 presents old-age dependency ratios
based on the projected size of the population
according to the medium variant and the zero-net-
migration scenario.
Based on the medium variant, the old-age
dependency ratio in the developed regions is
projected to increase from 27 to 46. In other
words, for every 100 working-age adults, there
were 27 older persons in 2015, and this number is
projected to grow to 46 older persons in 2050, an
increase of 71 per cent. Assuming zero net
migration over this interval, the old-age
dependency ratio in the developed regions is
projected to increase further to 50 persons aged 65
or over per 100 working-age adults in 2050, an 87
per cent rise compared to 2015.
In Asia, based on the medium variant, there
are projected to be 28 older persons for every 100
persons of working age in 2050, compared to 11
older persons in 2015, an increase of 157 per cent.
TABLE II.4: OLD-AGE DEPENDENCY RATIO AS ESTIMATED IN 2015 AND PROJECTED IN 2050 ACCORDING TO THE MEDIUM VARIANT
AND THE ZERO-NET-MIGRATION SCENARIO, BY DEVELOPMENT GROUP AND MAJOR AREA
Development group and major area
Old-age dependency
ratio in
2015
Old-age dependency ratio in 2050 Change between 2015 and 2050
Medium variant
Zero-net-
migration scenario
Based on
medium variant (percentage)
Based on zero-net-migration
scenario
(percentage)
World ................................................ 13 26 26 103 103
Developed regions ........................ 27 46 50 71 87
Developing regions ....................... 10 23 23 135 134
Africa ................................................ 6 10 9 51 50
Asia ................................................... 11 28 28 157 156
Europe............................................... 26 48 51 83 94
Latin America and the Caribbean ..... 11 31 30 170 166
Northern America ............................. 22 38 43 68 91
Oceania ............................................. 18 30 34 60 82
Source: United Nations, Department of Economic and Social Affairs, Population Division (2015). World Population Prospects: The 2015 Revision, DVD Edition.

Chapter II. Net international migration
18 United Nations Department of Economic and Social Affairs/Population Division
International Migration Report 2015
Likewise, during the period from 2015 to 2050,
old-age dependency ratios are projected to
increase from 26 to 48 in Europe (83 per cent
increase), from 22 to 38 in Northern America (68
per cent), from 11 to 31 in Latin America and the
Caribbean (170 per cent), and from 18 to 30 in
Oceania (60 per cent). Only Africa is projected to
have an old-age dependency ratio below 10 older
persons for every 100 persons of working age by
2050, with the ratio nevertheless increasing by
about 50 per cent between 2015 and 2050.
In sum, while international migration is
expected to have a noticeable impact on
dependency ratios, it is unlikely to reverse the
long-term trend toward population ageing. Even
assuming a continuation of current migration
patterns, as in the medium variant, all major areas
are projected to have significantly higher old-age
dependency ratios in 2050 than in 2015. In many
parts of the world, the old-age dependency ratio
would be even higher in the absence of net
migration. For example, assuming zero net
migration from 2015 onward, it is projected that
the old-age dependency ratio in 2050 would be 51
(zero net migration) rather than 48 (medium
variant) in Europe, 43 instead of 38 in Northern
America and 34 in place of 30 in Oceania.

United Nations Department of Economic and Social Affairs/Population Division 19
International Migration Report 2015
III. LEGAL INSTRUMENTS ON INTERNATIONAL MIGRATION
The international normative framework on
international migration includes instruments
pertaining to the human rights of all migrants, the
rights of migrant workers and the protection of
refugees, as well as instruments designed to
combat migrant smuggling and human trafficking.
These instruments have been ratified in varying
degrees by Member States. As of 6 October 2015,
instruments designed to protect refugees or to
combat migrant smuggling and human trafficking
had been ratified by more than three quarters of
Member States, whereas instruments protecting
the rights of migrant workers had been ratified by
at most one quarter of all Member States
(figure III.1).
A. REFUGEES
The 1951 Convention and the 1967 Protocol,
both relating to the Status of Refugees, are the
central elements in the international regime of
refugee protection. The 1951 Convention defined
the term “refugee”,i enumerated the rights of
refugees and established the legal obligation of
States to protect refugees. The Convention
prohibited the expulsion or forcible return of
persons accorded refugee status: no refugee
should be returned in any manner to a country or
territory in which his or her life or freedom would
be threatened—principle of “non-refoulement”.
Figure III.1. Status of ratification of legal instruments related to international migration, 1950-2015
Sources: United Nations Treaty Collection; see http://treaties.un.org (as of 6 October 2015) and NORMLEX Information System on International Labour Standards; see http://www.ilo.org/ (as of 6 October 2015).
Note: Does not include ratifications by the European Union.
0
25
50
75
100
125
150
175
1950 1955 1960 1965 1970 1975 1980 1985 1990 1995 2000 2005 2010 2015
Number of
States Parties
1951 Refugee Convention 1967 Refugee Protocol
1990 Migrant Workers Convention 2000 Human Trafficking Protocol
2000 Migrant Smuggling Protocol 1949 ILO Migration for Employment
Convention (No. 97)1975 ILO Migrant Workers
Convention (No. 143)
2013 ILO Domestic Workers
Convention (No. 189)

Chapter III. Legal instruments on international migration
20 United Nations Department of Economic and Social Affairs/Population Division
International Migration Report 2015
TABLE III.1: STATUS OF RATIFICATION OF INTERNATIONAL LEGAL INSTRUMENTS RELATED TO INTERNATIONAL MIGRATION
Instrument
Year of
entry
into
force
Parties to
international instruments
Number Percentage1
Refugees
1951 Convention relating to the Status of Refugees2 ................................................................. 1954 145 74
1967 Protocol relating to the Status of Refugees2 ...................................................................... 1967 146 75
Migrant workers
1949 ILO Convention concerning Migration for Employment (Revised 1949) (No. 97) .............. 1952 49 26
1975 ILO Convention concerning Migrations in Abusive Conditions and the Promotion of Equality
of Opportunity and Treatment of Migrant Workers (Supplementary Provisions) (No. 143) .............. 1978 23 12
1990 International Convention on the Protection of the Rights of All Migrant Workers and
Members of Their Families ........................................................................................................ 2003 48 25
2011 ILO Convention concerning Decent Work for Domestic Workers (No. 189) .................... 2013 22 12
Smuggling and trafficking
2000 Protocol to Prevent, Suppress and Punish Trafficking in Persons, Especially Women and
Children2 .................................................................................................................................... 2003 167 86
2000 Protocol against the Smuggling of Migrants by Land, Sea and Air2 ................................. 2004 140 72
Sources: United Nations Treaty Collection; see http://treaties.un.org (as of 6 October 2015) and NORMLEX Information System on International Labour Standards; see http://www.ilo.org/ (as of 6 October 2015).
Notes:
1 Of 186 Member States of the International Labour Organization, or of 193 Member States of the United Nations plus 2 non-member observer States. 2 Does not include ratifications by the European Union.
The 1967 Protocol extended the application
of the 1951 Convention to persons who became
refugees after 1 January 1951, without any
geographic limitation. By October 2015, the
1951 Convention and its 1967 Protocol had been
ratified by 145 and 146 United Nations Member
States, respectively, with 143 States Parties
having acceded to both instruments. The 148
States that had ratified either the 1951
Convention or the 1967 Protocol hosted,
collectively, 9.6 million refugees in 2015, or
slightly less than half of the global refugee
population.
B. MIGRANT WORKERS
The International Labour Organization
(ILO) has adopted three legally-binding
instruments that are directly relevant for the
protection of migrant workers: the Migration for
Employment Convention (Revised), 1949
(No. 97), the Convention concerning Migrations
in Abusive Conditions and the Promotion of
Equality of Opportunity and Treatment of
Migrant Workers (Supplementary Provisions),
1975 (No. 143), and the Convention concerning
Decent Work for Domestic Workers, 2011
(No. 189).ii All three instruments have
complementary non-binding recommendations.
The 1949 Convention (No. 97) covers
recruitment and promotes standards regarding
the working conditions of migrant workers. It
established the principle of equal treatment of
migrant workers and nationals with regard to
laws, regulations and administrative practices
concerning living and working conditions,
remuneration, social security, employment taxes
and access to justice.
The 1975 Convention (No. 143) was the
first multilateral attempt to address irregular
migration and to call for sanctions against

Chapter III. Legal instruments on international migration
United Nations Department of Economic and Social Affairs/Population Division 21
International Migration Report 2015
traffickers of human beings. It emphasized that
Member States are obliged to respect the basic
human rights of all migrant workers, including
irregular migrants. It also provided that lawfully
present migrant workers and their families
should not only be entitled to equal treatment but
also to equality of opportunity, e.g., equal access
to employment and occupation, the right to join
trade unions, cultural rights, and individual and
collective freedoms.
The 2011 Convention (No. 189), which
entered into force in 2013, was the first
multilateral instrument to establish global labour
standards for domestic workers, guaranteeing
them the same basic rights as other workers.
The convention established that domestic
workers, regardless of their migration status,
have the same basic labour rights as other
workers, including reasonable hours of work, a
limit on payment in-kind and clear information
on the terms and conditions of employment.
Employers of domestic workers must respect the
fundamental principles and rights at work,
including freedom of association and the right to
collective bargaining.
As of 6 October 2015, 49 ILO Member
States had ratified ILO Convention No. 97; 23
Member States had ratified Convention No. 143;
and 22 Member States had ratified Convention
No. 189. In total, only three of ILO’s 186
Member States—Italy, the Philippines and
Portugal—had ratified all three instruments.
These three countries represent fewer than two
per cent of ILO Member States and hosted fewer
than three per cent of all international migrants
worldwide (6.8 million) in 2015.
The 1990 International Convention on the
Protection of the Rights of All Migrants
Workers and Members of Their Families is the
third, and most comprehensive, international
treaty on migrant rights. It established
international definitions for categories of
migrant workers and formalized the
responsibility of States in upholding the rights of
migrant workers and members of their families.
The Office of the High Commissioner for
Human Rights monitors the implementation of
this convention and works to further its
ratification.
As of October 2015, 48 Member States had
ratified the 1990 Convention. Collectively, they
hosted 18 million international migrants in 2015,
about seven per cent of the global total. None of
the States Parties to the Convention were major
migrant-receiving countries, and only five of
them hosted more than one million international
migrants.
Overall, 93 countries had ratified at least
one of the four instruments regarding migrant
workers. Together they hosted 35 per cent of the
global population of international migrants in
2015, or around 85 million migrants.
C. SMUGGLING AND TRAFFICKING
The two protocols seeking to stem irregular
migration concern human trafficking and
migrant smuggling, supplementing the United
Nations Convention against Transnational
Organized Crime. The 2000 Protocol to
Prevent, Suppress and Punish Trafficking in
Persons, Especially Women and Children took
effect in 2003 and, as of 6 October 2015, had
been ratified by 167 United Nations Member
States. The Protocol defined human trafficking
as the acquisition of people by improper means,
such as force, fraud or deception, with the aim of
exploiting them. The Protocol aimed to prevent
and combat trafficking in persons, to protect and
assist victims of such trafficking, in particular
women and children, to prosecute perpetrators of
such crimes and to promote cooperation among
States Parties.
The 2000 Protocol against the Smuggling of
Migrants by Land, Sea and Air took effect in
2004 and had been ratified by 140 United
Nations Member States as of 6 October 2015.
As set out in the Protocol, smuggling of
migrants involves the procurement, for sake of
financial or other material benefit, of the illegal
entry of a person into a State of which the person
is not a national or permanent resident. The
Protocol has proven to be an effective tool for

Chapter III. Legal instruments on international migration
22 United Nations Department of Economic and Social Affairs/Population Division
International Migration Report 2015
TABLE III.2: RATES OF RATIFICATION BY STATES PARTIES FOR LEGAL INSTRUMENTS RELATED TO
INTERNATIONAL MIGRATION, BY DEVELOPMENT GROUP AND MAJOR AREA (percentage)
States Parties to United Nations instruments1
States Parties to ILO instrument,2
1951 Refugee
Convention
1967 Refugee
Protocol
1990
Migrant Workers
Convention
2000
Human Trafficking
Protocol3
2000
Migrant Smuggling
Protocol3
1949
Migration
for Employment
No. 097
1975
Migrant Workers
No. 143
2011
Domestic Workers
No. 189
World ................................ 74 75 25 86 72 26 12 12
Developed regions ........... 94 96 4 94 90 38 24 16
Developing regions .......... 68 68 32 83 66 23 9 11
Africa ............................ 89 89 35 91 74 19 13 4
Asia ............................... 40 40 21 75 50 16 9 2
Europe........................... 95 95 5 95 91 40 28 18
LAC .............................. 82 82 52 100 91 45 3 36
Northern America ......... 50 100 0 100 100 0 0 0
Oceania ......................... 57 57 0 36 29 8 0 0
Sources: United Nations Treaty Collection; see http://treaties.un.org (as of 6 October 2015) and NORMLEX Information System on International Labour Standards; see http://www.ilo.org/ (as of 6 October 2015). Notes: LAC refers to Latin America and the Caribbean.
1 Of the 193 Member States of the United Nations plus 2 non-member observer States. 2 Of 186 Member States of the International Labour Organization. 3 Does not include ratifications by the European Union.
combating and preventing the smuggling of
“human cargo”. It reaffirmed that migration in
and of itself is not a crime, and that migrants
may be victims in need of protection. The
United Nations Office on Drugs and Crime
(UNODC) assists Member States in
implementing the two protocols. The rapid
increase in the ratification of the human
trafficking and the migrant smuggling protocols
may reflect a growing concern among Member
States about the involvement of organized crime
in irregular migration.
As of October 2015, the extent of
ratification for the above-mentioned conventions
and protocols differed greatly by development
group and major area (table III.2). For the 1951
Convention and its 1967 Protocol, both relating
to the status of refugees, the rate of ratification is
low in Asia (40 per cent) and in Oceania (57 per
cent), while the remaining areas show
ratification rates above 80 per cent for at least
one of the two instruments. Ratification rates of
the protocols relating to human trafficking and
migrant smuggling are highest for Member
States in Northern America (100 per cent for
both), Latin America and the Caribbean (100
and 91 per cent, respectively) and Europe (95
and 91 per cent, respectively). The rate of
ratification of the two protocols was higher
amongst countries of the developed regions than
amongst countries of the developing regions.
Overall, the four instruments relating to
migrant rights show lower ratification rates
compared to the other migration-related
instruments in all regions. Latin America and
the Caribbean had the highest percentage of
countries having ratified at least one migrant
rights instrument, whereas countries in Northern
America have not ratified any of these
instruments.
___________________
NOTES
i The 1951 Refugee Convention defined a refugee as
someone who “owing to a well-founded fear of being
persecuted for reasons of race, religion, nationality,
membership of a particular social group or political
opinion, is outside the country of his nationality, and is
unable to, or owing to such fear, is unwilling to avail
himself of the protection of that country”. ii It should be noted that many domestic workers are
migrants, particularly migrant women.