s alfa c orp p resentation iii c hile e quity o ne on o ne c onference – l ondon, m ay 2013
TRANSCRIPT
SALFACORP PRESENTATION
III CHILE EQUITY ONE ON ONE CONFERENCE – LONDON, MAY 2013
www.salfacorp.com

CONTENTS 01 - WHO WE ARE02 - INDUSTRY OVERVIEW03 - OUR BUSINESS UNITS & RESULTS04 - TOPICS OF INTEREST05 – FINAL COMMENTS
2

WHO WE ARE01
3

A Company with vast experience in the engineering, construction and real estate sectors
4
More than 83 years of history and leadership
One of the most important conglomerates in Latin America
Growing international presence in markets with potential growth
Leading market position in Engineering & Construction Salfa Ingeniería y
Construcción S.A. (“ICSA”)
Well positioned in mining services
Specialized technologies
Long term & regional relationships with customers
Leading position in Real Estate Development Aconcagua S.A. (“Aconcagua”)
Good Diversification by product and geographic location
Vertically integrated manufacture of houses
Long position in Land
Strong brand recognition and reputation
30,000+ employees
Publicly traded since 2004; member of the IPSA Index (groups the 40 largest
traded companies in Chile’s exchange)
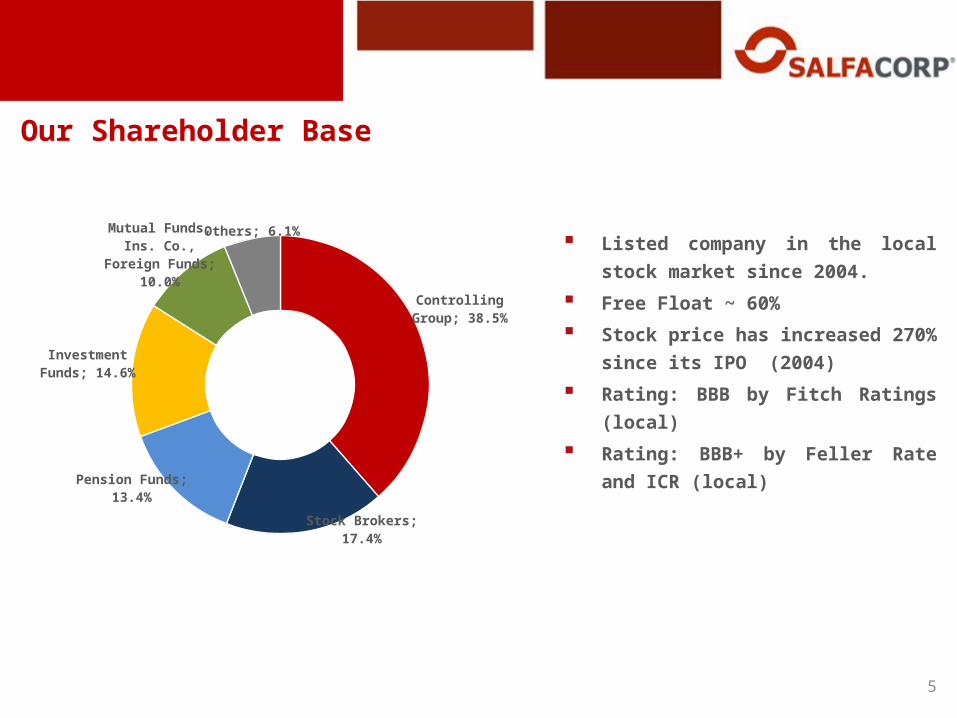
Our Shareholder Base
5
Listed company in the local
stock market since 2004.
Free Float ~ 60%
Stock price has increased 270%
since its IPO (2004)
Rating: BBB by Fitch Ratings
(local)
Rating: BBB+ by Feller Rate
and ICR (local)
Controlling Group; 38.5%
Stock Brokers; 17.4%
Pension Funds; 13.4%
Investment Funds; 14.6%
Mutual Funds, Ins. Co., Foreign Funds;
10.0%
Others; 6.1%

62004 2006 2007 2008 2011
100%
100%
80%
100%
100%
40%80%
66,7%
100%Merger with
ConsolidationSALFA PERÚ
Significant organic growth Growth over the last 5 years through mergers and
acquisitions in complementary businesses International expansion: Peru, Colombia, Panama 2012 focused on consolidating these acquisitions
and generate synergies Revenues increased 472% between 2004-2012
Timeline of Growth
DES&SAL
70%DES&SAL
100%
90%

Among the main construction companies in Latam (USD million)
7
Main E&C and Real Estate Companies in Chile
OD
EBRE
CHT
Andr
ade
Guti
erre
z
ICA
Cam
argo
Cor
rea
OAS
Salfa
corp
Gra
ña M
onte
ro
Besa
lco
Soco
vesa
EISA
Sidg
o Ko
pper
s
Inge
vec
PAZ
Clar
o Vi
cuña
14.922
4.337 3.9373.146
2.5692.214
1.239 804 690 447 443 262 238 178
Source: Bloomberg; Superintendencia de Valores y Seguros; company reports
Revenues for Camargo Correa are as of Dec-2011.

Operations in countries with good economic perspectives
8
Operations in countries with low risk in the Region
Source: Fitch Ratings; based on foreign debt
Source: International Monetary Fund as of Dec-2012
5,9%
5,4%
4,9%
4,6%
6,6%
4,0%
4,0%
4,5%
6,9%
6,2%
6,2%
6,1%
10,8
%
10,6
%
8,9%
7,2%
2011 2012 2013e 2014e
Chile
Colombia
Peru
Panama
GDP as of Dec-2012 (USD Million) GDP Growth Forecast
Salfa
Corp
Salfa
Corp
Salfa
Corp
Salfa
Corp
268.177
199.003
366.020
36.253
Chile Peru Colombia Panama
A+
BBB BBB BBBBBB- BBB- BBB-
BB-B+
B-
CC
Source: International Monetary Fund as of Dec-2012

INDUSTRYOVERVIEW IN CHILE
02 9

Chile’s GDP grew 5,6% in 2012, year over year.
Construction GDP grew by nearly 8% in 2012, year over year.
Construction activity correlated to GDP growth.
Markets where we operate: Engineering & Constructionand Real Estate
Evolution of GDP Construction (Chile) Monthly Construction Activity Index (Chile)
80
85
90
95
100
105
110
115
120
125
Dic
-07
Jun-
08
Dic
-08
Jun-
09
Dic
-09
Jun-
10
Dic
-10
Jun-
11
Dic
-11
Jun-
12
Dic
-12
Variation (%)IM
ACO
N
IMACON Var. % Monthly Var. % 12 months
(*) Source: Central Bank of Chile and Cámara Chilena de la Construcción10
-10,0%
-5,0%
0,0%
5,0%
10,0%
15,0%
1Q-2
009
2Q-2
009
3Q-2
009
4Q-2
009
1Q-2
010
2Q-2
010
3Q-2
010
4Q-2
010
1Q-2
011
2Q-2
011
3Q-2
011
4Q-2
011
1Q-2
012
2Q-2
012
3Q-2
012
4Q-2
012
GDP Construction GDP

Investments in Construction are concentrated in the Mining and Energy industries.
Markets where we operate: Engineering & Construction and Real Estate (Cont.)
Construction Investments per Economic Sector (Chile) *
US$ 110,888 million
Mining59,4%
Energy22,9%
Real Est. Non-household
6,5%Infrastructure
2,7%Industrial
2,8%
Others5,7%
Growth of Construction Investments (Chile) *
54.2
15
77.4
96
89.8
40
97.2
11
95.3
75
110.
888
0
20.000
40.000
60.000
80.000
100.000
120.000
2007 2008 2009 2010 2011 2012
US$
mill
ions
CAGR: 15.4%
(*) Source: Cámara Chilena de la Construcción 11

Markets where we operate: Engineering & Construction and Real Estate (Cont.)
Household Sales in Santiago Market Share in Chile (USD million) (*)
(*) Estimated market calculated as SalfaCorp’s consolidated revenues in Chile over Total Investment in Construction.
Source: Cámara Chilena de la Construcción
0
5
10
15
20
25
30
35
0
10.000
20.000
30.000
40.000
50.000
60.000
Dic
-07
Mar
-08
Jun-
08
Sep-
08
Dic
-08
Mar
-09
Jun-
09
Sep-
09
Dic
-09
Mar
-10
Jun-
10
Sep-
10
Dic
-10
Mar
-11
Jun-
11
Sep-
11
Dic
-11
Mar
-12
Jun-
12
Sep-
12
Dic
-12
months in stock
hous
ehol
d sa
les
and
stoc
k (u
nits
)
Household sales (LTM)Household supplyMonths in stock 76
4
954
1.12
2
1.51
4
1.60
9
2.08
0
3,8%4,5%
5,1%5,8%
6,7%
6,8%
0,0%
1,0%
2,0%
3,0%
4,0%
5,0%
6,0%
7,0%
8,0%
-
200
400
600
800
1.000
1.200
1.400
1.600
1.800
2.000
2.200
2007 2008 2009 2010 2011 2012
12
Household sales and stock in Santiago represents more than 50% of the market nationwide.

OUR BUSINESS
UNITS
03 13

Salfa Ingeniería y Construcción S.A.
(Engineering & Construction) GROWTH AND PROFITABILITY
FOCUS ON SEGMENTS WITH POTENTIAL
DEMAND GROWTH:
MINING & ENERGY
LARGE PROJECTS
POSITION IN REGIONAL MARKETS WITH
POTENTIAL GROWTH
COMMERCIAL
SPECIALIZED SERVICES WITH VALUE ADDED
AND HIGHER MARGINS:
UNDERGROUND MINING
DRILLING & BLASTING
LONG TERM CONTRACTS
SUSTAINABILITY
CONTROL OF RISKS & PROCEDURES
COST CONTROL
SUPPORTING SYSTEMS (SAP)
DEVELOPMENT OF HUMAN RESOURCES &
COMPETENCIES
Strategic Drivers for each Business Unit
14
Aconcagua S.A.
(Real Estate)
GROWTH AND PROFITABILITY
RELEVANT POSITION NATIONWIDE
“DECOMMODITIZATION” OF SUPPLY THROUGH
INNOVATION
DIFFERENT MECHANISMS OF
ASSOCIATIONS/PARTNERSHIPS
INTEGRATED MANUFACTURING UNITS ALLOWS
BETTER CONTROL OF SUPPLY CHAIN
COMMERCIAL
BETTER UNDERSTANDING OF FINAL CUSTOMER
DIFFERENTIATION: LAGOONS, THERMAL
EFFICIENCY, ETC.
SEGMENTS OF HIGHER VALUE: HOUSING AND
OFFICES
TAKING OPPORTUNITIES ABROAD… GAINING
EXPERIENCE
SUSTAINABILITY
LAND BANK FOR APP. 10 OF LONG TERM
DEVELOPMENT.
SUPPORTING SYSTEMS (SAP)
DEVELOPMENT OF HUMAN RESOURCES &
COMPETENCIES

ENGINEERING &
CONSTRUCTION
BUSINESS UNIT:
“ICSA”
03.1
15

ICSA’s Business Structure
SALFA INGENIERÍA Y CONSTRUCCIÓN S.A.
CHILE PERU PANAMACOLOMBIA
Assembly Works
Civil Works
Assembly Works
Civil Works
Assembly Works
Underground Mining
Industrial Maintenance
Ground Movement
Infrastructure
Drilling & Blasting
Ports Ports
16
AS OF DEC-31-12 SALFA ICSA
REVENUES MM$ 749,265 (MMUS$ 1,561)
EBITDA MM$ 39,850(MMUS$ 83)
ASSETS MM$ 458.403 (MMUS$ 955)
# EMPLOYEES 22.585
INTERNATIONALOPERATIONS
Financial Summary

ICSA consolidating its international presence
17
GDP: +10.6%Backlog: USD 24 mRevenues: USD 39 m
GDP: +4.0%Backlog: USD 15 mRevenues: USD 2 m
GDP: +6.2%Backlog: USD 87 mRevenues: USD 98 m
GDP: +5.4%Backlog: USD 1.2 bnRevenues: USD 1.6 bn
ICSA only consolidates entities in Peru.
Figures of entities in Colombia and Panama of Dec-2012 represent 100% of their
business

Backlog at Dec-2012 practically at the same level as of Dec-2011 (in USD), but mix has
improved
Reduction of Backlog in Units with less value contribution
Backlog ICSA – US$ 1,300 million
1Q-11 2Q-11 3Q-11 4Q-11 1Q-12 2Q-12 3Q-12 4Q-12
89
6.7
1,0
59
.7
1,3
50
.1
1,3
02
.3
1,6
34
.3
1,8
05
.0
1,6
20
.0
1,3
00
.0
Backlog of Contracted Projects
Assembly Works37.0%
Civil Works11.0%
Mining Services45.0%
Interna-tional7.0%
Backlog per Line of Business
(*) Estimado en base al tipo de cambio de cierre de cada período.
• Near MM$412 (US$ 860m) of backlog to be
executed during 2013;
• Close to MM$200 (US$ 420m) for 2014
onwards.
• Backlog of US$ 1,300 million reflects the
strategy to reduce lines of business with
lower margins and focus in more profitable
projects and segments. 18
-
50.000
100.000
150.000
200.000
250.000
300.000
350.000
400.000
450.000
2013 2014 2015+
Assembly Works Mining Services Civil Works
Others International

ICSA – Breakdown of Revenues per Line of Business
Revenues per Line of Business * (Dec-12)
Assembly Works43%
Mining Services
24%Construction19%
International6%
Others7%
19
(*) Mining Services include Earth Movement, Underground Mining and Drilling & Blasting.Construction includes Civil Works and Sothern Zone lines of business.International revenues include only subsidiaries abroad which consolidate (Peru)
Revenues per Line ofBusiness
Dec-2012$ million
Dec-2011$ million
Chg. %
Assembly Works 322.160 226.159 42,4%
Mining Services 180.883 99.054 82,6%
Construction 145.350 235.519 -38,3%
International 46.893 65.729 -28,7%
Others 53.978 44.120 22,3%
Total 749.265 670.581 11,7%
Revenues with good diversification.
Assembly Works and Mining Services drivers of growth.
Highly specialized lines of business with greater value contribution.

20
ICSA: Results as of Dec-12 (in CLP million)
Revenues
ProfitEBITDA / Mg %
Gross Profit / Mg %
3.3%
5.3%
4.7%6.3%
448.
001
590.
867
670.
581
749.
265
Dec-09 Dec-10 Dec-11 Dec-12
46.2
25
50.0
64
47.9
82
57.1
07
Dec-09 Dec-10 Dec-11 Dec-12
28.0
49
28.0
01
21.8
03
39.8
50
Dec-09 Dec-10 Dec-11 Dec-12
20.4
27
15.8
65
3.06
9
10.5
02
Dec-09 Dec-10 Dec-11 Dec-12
7.2%
7.6%8.5%
10.3%
CAGR: -20%CAGR: +12%
CAGR: +19%CAGR: +7%

ICSA: Key Financial Ratios as of Dec-12
21
Liquidity
ROENet Financial Leverage
Leverage
1,891,60 1,54 1,57
Dec-09 Dec-10 Dec-11 Dec-12
1,83 1,822,06 2,16
Dec-09 Dec-10 Dec-11 Dec-12
7.42%
28.57%
19.84%
2.27%
Dec-09 Dec-10 Dec-11 Dec-12
0,35
0,57 0,66
0,91
Dec-09 Dec-10 Dec-11 Dec-12

ICSA: Some of our projects
22
Civil Works; Costanera Center Project, Cencosud
Underground Mining; ADITS Construction, CODELCO
Marine Works; Port Expansion, Puerto de Lirquén
Assembly Works; Acid plant; Ministro Hales Project

REAL ESTATE BUSINESS
UNIT:“ACONCAGUA
”23
03.2

Aconcagua’s Business Structure
24
ACONCAGUA S.A.
100% OwnershipReal Estate
Development
Real Estate Associations with Partners
Real Estate (Inmobiliaria
Aconcagua S.A.)
Home Building(Novatec S.A.)
Other Units (Newall, Vertical,
Noval)
International Division
Financial Summary
AS OF DEC-31-12 ACONCAGUA S.A
REVENUES MM$ 329,927 (MMUS$ 687)
EBITDA MM$ 20,897(MMUS$ 43)
ASSETS MM$ 468,114 (MMUS$ 975)
# EMPLOYEES 10.418
INTERNATIONALOPERATION Miami JV startup

Growth in Pre-sales and Deliveries
Pre-sales Combined (1)
UF millions (3)
Deliveries Combined (2)
UF millions
25
2010 2011 1T - 2012 2T -2012 3T-2012 4T-2012 2012 0.0
2.0
4.0
6.0
8.0
10.0
12.0
14.0
16.0
9.0
12.1
3.34.1 3.6 3.6
14.6
2010 2011 1T - 2012 2T - 2012 3T - 2012 4T- 2012 2012 0.0
2.0
4.0
6.0
8.0
10.0
12.0
8.3 8.4
2.4 1.9 2.1
4.7
11.1
Δ+21% Dec-12 / Dec-11
Δ+32% Dec-12 / Dec-11
(1) Includes pre-sales in Chile and abroad, from businesses which consolidate and do not consolidate. Miami represents app. UF 1 million(2) Only includes projects of Inmobiliaria Aconcagua in Chile.(3) 1UF = USD 48 as of Dec-2012. UF is local currency indexed to inflation; housing prices are denominated in this currency.

Evolution & Seasonality of the Real Estate Business
26
$ million
• Seasonality marked during 4Q of each year• Account Receivables + Inventory correlated with ST debt real estate cash cycle
-
50.000
100.000
150.000
200.000
250.000
300.000
1Q-1
0
2Q-1
0
3Q-1
0
4Q-1
0
1Q-1
1
2Q-1
1
3Q-1
1
4Q-1
1
1Q-1
2
2Q-1
2
3Q-1
2
4Q-1
2
Revenues Acc Rec Inventory Total Fin. Debt

Breakdown of Revenues per Business Segment
Revenues per Segment (Dec-12)
27
Houses29%
Apartments9%
Land16%
Construction43%
Other revenues
3%
Revenues with good diversification.
Construction Revenues reaching a maturity level.
Good land sales, consistent with attractive conditions of the industry and the
large land bank of Aconcagua.
Revenues by ProductDec-2012
M$Dec-2011
M$Var. %
Households 125.152.434 113.343.209 10,4%Land 53.126.854 13.005.681 308,5%Construction 142.384.591 117.312.576 21,4%Other revenues 9.263.007 3.317.366 179,2%Total Revenues 329.926.886 246.978.832 33,6%

In the case of Aconcagua 2009-2012
28
Taking advantage of the opportunities given the upside of the market.
2012’s Margin del 2012 considers a higher cost of land sales as a result of the application of IFRS 3 – Business Combination.
Taking advantage of the opportunities given the upside of the market.
2012’s Margin del 2012 considers a higher cost of land sales as a result of the application of IFRS 3 – Business Combination.
Land Revenues – Comparatives with the market
Good market conditions boosted sales of land during 2012 from all players of the industry.
Good market conditions boosted sales of land during 2012 from all players of the industry.
(*) Source: Superintendencia de Valores y Seguros; Companies’ Financial Statements
$ million Δ%Aconcagua 53.126 13.005 40.121 308,5%Socovesa (*) 45.984 14.747 31.237 211,8%Paz (*) 5.124 1.089 4.035 370,5%Manquehue (*) 37.217 13.652 23.565 172,6%Total 141.451 42.493 98.958 232,9%
$ million 20112012Variation
$ million 2009 2010 2011 2012Land Revenues 11.126 10.416 13.006 53.126 Costs of land 12.015 7.155 9.573 50.081 Gross Mg (889) 3.261 3.433 3.045
Land Rev. Asociations 63 2.010 12.777 2.195 Cost of land Asociations 64 1.993 6.340 1.787 Gross Mg (1) 17 6.437 408

Aconcagua manages approximately 1,700 has. of land for future real estate developments.
Book value as of Dec-2012, reached $ 77 billion vs. a fair value of $ 116 billion as of the same date.
Current volume of land is an important element of Aconcagua’s strategy and strengthens its sustainability for the long term.
As part of its financial strategy, Aconcagua maintains control of its lands with options, agreements and ownership of land.
Land Bank Solid position for long term development
By Geographic Zone
29
Central30%
Northern28%
Southern42%

Aconcagua: Results as of Dec-12 (in CLP million)
30
Revenues Gross Profit / Margin %
EBITDA / Margin % Profit
170.
628
187.
655
246.
979
329.
927
Dec-09 Dec-10 Dec-11 Dec-12
26.8
48
35.1
12
34.9
45
37.0
12
Dec-09 Dec-10 Dec-11 Dec-12
14.1%11.2%
18.7%
15.7%
6.35
2
14.1
22
17.1
49
20.8
97
Dec-09 Dec-10 Dec-11 Dec-12
73 5.88
2
10.6
61
14.5
71
Dec-09 Dec-10 Dec-11 Dec-12
CAGR: +11%
CAGR: +484%CAGR: +49%6.9%
6.3%
7.5%3.7%
CAGR: +25%

31
Liquidity
ROENet Financial Leverage
Leverage
Aconcagua: Key Financial Ratios as of Dec-12
1,75
3,74
2,51
1,25
Dec-09 Dec-10 Dec-11 Dec-12
2,96
2,26 2,533,09
Dec-09 Dec-10 Dec-11 Dec-12
0,09%
7,73%
12,76%
15,55%
Dec-09 Dec-10 Dec-11 Dec-12
2,00 1,78 1,702,18
Dec-09 Dec-10 Dec-11 Dec-12

32
Aconcagua: Some of our projects
Live Costanera Building, Metropolitan Region
Deloitte Building, Metropolitan Building Laguna del Mar Project, La Serena, 4th Region
Punta Águila Project, Metropolitan Region

SALFACORPCONSOLIDAT
EDFINANCIALS
33
03.3

SalfaCorp: Balance Sheet as of Dec-2012
34
$ Million %
Current assets 562.111 453.668 108.443 23,9%Cash and cash equivalents 31.989 45.271 (13.282) -29,3%Trade and other current receivables 257.553 184.592 72.961 39,5%Current related parties receivables 36.603 38.346 (1.743) -4,5%Inventories 208.521 160.829 47.693 29,7%Others 27.445 24.631 2.814 11,4%
Non-current assets 411.305 346.051 65.253 18,9%Non-current inventories 54.370 21.005 33.365 158,8%Non-current related parties receivables 27.357 29.593 (2.236) -7,6%Investments in related companies 35.233 32.564 2.670 8,2%Intangible assets other than goodwill 69.686 54.749 14.937 27,3%Goodwill 24.093 35.202 (11.110) -31,6%Property, plant and equipment 80.202 74.313 5.889 7,9%Investment property 77.467 60.669 16.798 27,7%Non-current tax assets 8.271 6.985 1.286 18,4%Deferred tax assets 28.830 27.501 1.329 4,8%Others 5.797 3.471 2.326 67,0%
Total assets 973.416 799.720 173.696 21,7%
Current liabilities 403.094 239.456 163.638 68,3%Other current financial liabilities
Financing of land 10.175 0 10.175 - Other financing 175.189 20.883 154.307 738,9%
Trade and other current payables 143.815 137.275 6.540 4,8%Current tax liabilities 21.009 17.862 3.147 17,6%Other current non-financial liabilities 49.302 55.105 (5.803) -10,5%Others 3.604 8.331 (4.727) -56,7%
Non-current liabilities 265.261 287.015 (21.754) -7,6%Other non-current financial liabilities
Financing of land 31.558 17.787 13.771 77,4%Other financing 190.007 241.856 (51.849) -21,4%
Other accounts payable 1.733 2.078 (345) -16,6%Deferred tax liabilities 21.176 16.631 4.545 27,3%Others 20.787 8.662 12.125 140,0%
Equity attributable to parent company 281.599 265.741 15.858 6,0%Non-controlling interests 23.461 7.507 15.954 212,5%Total equity 305.061 273.249 31.812 11,6%Total equity and liabilities 973.416 799.720 173.696 21,7%
Balance Sheet$ Million of each period
Dec-12 Dec-11 Change

SalfaCorp: P&L as of Dec-2012
35
$ Mill %
Revenues 1.062.636 901.465 161.171 17,9%Gross profit 92.776 85.522 7.254 8,5%
% of revenues 8,7% 9,5%Other income 15.795 746 15.050 2018,0%Selling & administrative expenses (62.087) (53.669) (8.419) 15,7%
% of revenues -5,8% -6,0%Operating profit 46.484 32.600 13.884 42,6%
% of revenues 4,4% 3,6%
Non-operating profit (18.628) (11.783) (6.845) 58,1%Other gains (losses) (62) 1.643 (1.705) -103,8%Finance costs net of Finance income (14.203) (12.638) (1.565) 12,4%Share of profit (loss) of associates and joint 492 3.733 (3.241) -86,8%Exchange rate differences (742) 441 (1.183) -268,2%Gains (losses) from readjustable units (4.113) (4.963) 850 -17,1%
Income tax expense (2.139) (3.487) 1.347 -38,6%
Profit (loss), Parent Company 23.182 15.933 7.250 45,5%% of revenues 2,2% 1,8%
EBITDA 59.776 41.027 18.749 45,7%% of revenues 5,6% 4,6%
EBITDA Adjusted 60.268 44.760 15.508 34,6%% of revenues 5,7% 5,0%
ChangeDec-12 Dec-11
P&L Statement($ million of each period)

36
SalfaCorp: Consolidated Financials as of Dec-12 (in CLP million)
Revenues
ProfitEBITDA
Gross Profit / Mg
+46%
+18% +9%
+46%
901.465
1.062.636
Dec-11 Dec-12
85.522
92.776
Dec-11 Dec-12
9,5% 8,7%
41.027
59.776
Dec-11 Dec-12
4,6% 5.6%
15.933
23.182
Dec-11 Dec-12

37
Liquidity
ROENet Financial Leverage
Leverage
SalfaCorp: Key Consolidated Ratios as of Dec-12
1,89
1,39
Dec-11 Dec-12
1,932,19
Dec-11 Dec-12
0,86
1,23
Dec-11 Dec-12
6,00%
8,23%
Dec-11 Dec-12

TOPICS OF INTERST04
38

39
ICSASubsidiary
Sector Engineering & Construction Real Estate
Main Elements
• Highly specialized labor force• Focus on specialized construction• Lower number of customers: B2B• Dependent on productive investment,
mainly mining, energy, forestry and industrial
• Development of real estate projects• Search for value-added products• High number of customers: B2C• Dependent on level of interest rates,
employment, access to mortgages and economic growth
Use of capital Low High
Level of Debt Low High
Recent Events … Company is evaluating the division of SalfaCorp into two separate and publicly traded business units

Division of SalfaCorp - Rationale
40
FOCUS
Profitability in each business Higher management control of
the business. Strategic & Operational.
Specialization in each business: Management and Board
of Directors. Business Model. TI systems to support
management.
FINANCING
Different needs of financial resources.
Different capital structure E&C less leveraged. Real estate more working capital
intensive and higher leveraged in order to be profitable.
Different groups of investors.
GROWTH
Both Business Units are in a stage of growth.
They have reached such an operational scale in order to operate independently.
Different business strategies, thus Investment Plans.
Each company could capitalize growth opportunities in a better approach.
Aconcagua has its own Construction unit (Novatec) in the Real Estate business since 2 years ago Operating synergies between Real Estate and Novatec have already been achieved.
Management is currently working as two independent companies There are two Executive Vice-presidents in charge of these companies Each structure operates independently There are no synergy losses The cost of this division is not significant
FINAL COMMENTS
05 41

Final Comments
SalfaCorp, a company with a leading position in the Engineering & Construction
and Real Estate sectors in Chile.
Both Business Units have a diversified source of revenues.
In a good position for year 2013 and those to come.
ICSA:
Focus on Profitability lines of business with better margins – Assembly
Works and Mining Services. Reduction of lines with lower returns.
Good Backlog Longer contracts and more focused.
Positioned to continue international growth
Aconcagua:
Differentiation Strategy successfully continues its course.
Solid land bank position for long term development.
Good Backlog value added projects.
42

SALFACORP PRESENTATION
III CHILE EQUITY ONE ON ONE CONFERENCE – LONDON, MAY 2013
www.salfacorp.com