s 2019 to 2.1 per cent in 2021 - treasury.gov.za budget/2019/review/chapter 2.pdf · chapter 2:...
TRANSCRIPT

11
2 Economic overview
In brief • GDP growth has been revised down since the 2018 Medium Term Budget Policy Statement (MTBPS) due to a fragile
recovery in employment and investment, and a less supportive global trade environment. Real GDP growth in 2019 is expected to reach 1.5 per cent, improving moderately to 2.1 per cent in 2021.
• Gradual improvements in business and consumer confidence, and more effective public infrastructure spending, will be partially offset by slower global growth. While there has been progress on economic reforms, more effective implementation is needed.
• Government’s efforts to stabilise state-owned companies – including the reconfiguration of Eskom – and infrastructure reforms are expected to support faster growth and investment in the years ahead.
• Measures to relieve policy uncertainty and blockages have begun to yield results that will support investment in mining, telecommunications and tourism.
• To achieve higher, more inclusive growth and create jobs, South Africa needs to strengthen the capability of the state and enact comprehensive structural reforms.
Overview outh Africa’s GDP growth forecast for 2019 has been revised to 1.5 per cent, from an estimated 1.7 per cent at the time of the 2018 MTBPS. The weaker outlook projects a slow improvement in
production and employment following poor investment growth in 2018, and a moderation in global trade and investment. The medium-term outlook is subdued, with GDP growth projected to reach 2.1 per cent in 2021, supported by a gradual improvement in confidence, more effective public infrastructure spending, and a better commodity price outlook than previously assumed.
Following a decade of economic weakness, there are positive signs that the economy has begun to gain lost ground. The policy inertia and uncertainty that have constrained investment and confidence have begun to lift. The reconfiguration of Eskom is a major step in the broad reform of state-owned companies. Several commissions are probing allegations of widespread corruption in the public and private sectors. The President’s investment drive has yielded pledges of R300 billion in investment.
Economic growth expected to rise slowly from 1.5 per cent in 2019 to 2.1 per cent in 2021 S
Separating Eskom is major step in broad reform of state-owned companies

2019 BUDGET REVIEW
12
Over the next three years, general government infrastructure investment is projected at R526 billion. Interventions are already under way to improve the efficiency of this pipeline. In addition, government will contribute R100 billion to a blended-finance infrastructure fund over the next decade in the form of new spending, reprioritisation and guarantees. The fund will allow the public and private sectors to work together to finance sustainable social and economic infrastructure projects.
Government is acting decisively to mitigate the risks that Eskom poses to the economy and the public finances. The restructuring of the electricity sector and state support for Eskom’s balance sheet are central to a transparent and credible reform of the utility’s business model. Over the long term, this will support the transition to a more sustainable and resilient economy. The President’s economic stimulus and recovery plan, announced in September 2018, aims to restore policy certainty and boost confidence in the near term. Efforts to implement the growth-enhancing reforms outlined in the plan have made some headway.
Update on the President’s economic stimulus and recovery plan • Telecommunications spectrum: Licensing for high-demand spectrum will take place this year, with the process
expected to be completed in 2020/21. • Visa amendments: Gazetted amendments to the Immigration Act (2002) will waive the requirement of an unabridged
birth certificate for children traveling from certain countries. Revised requirements for business visas clarify the documentation and accreditations required. An e-visa system will be launched with New Zealand as the pilot case. It will then be rolled out to other countries. The scarce skills list will be updated by March 2019.
• Mining policy: Government issued a new Mining Charter. The Minister of Mineral Resources has signalled that controversial amendments to the Mineral and Petroleum Resources Development Act (2002) are no longer in keeping with the policy intent. Separate legislation for the regulation of oil and gas is being developed and consultations with various stakeholders are under way.
• Administered price review: The Department of Energy has invited the public to comment on the basic fuel price review until 31 March 2019. Stakeholder consultations are under way to identify ways to improve the efficiency and reduce the costs of ports and rail, making the country’s exports more competitive.
• Procurement: The Public Procurement Bill is being finalised. It will consolidate various procurement laws into one national legislative framework. Provisions in the bill will encourage participation from black-, youth- and women-owned businesses in state procurement.
• Measures to safeguard industry: Government imposed a 35.3 per cent tariff on frozen bone-in chicken imports from Europe, as allowed by the terms of South Africa’s Economic Partnership Agreement with the European Union.
Raising the economic growth rate, and achieving inclusive and shared growth, requires a range of short-term interventions and long-term reforms, along with improved capacity to implement them.
South Africa’s macroeconomic policy framework provides a strong platform for the success of these measures. Macroeconomic policy promotes low and stable inflation, a flexible exchange rate, and a sustainable fiscal framework. In combination, these policy commitments reduce uncertainty and risk in investment decisions, and support business and consumer confidence. The Constitution entrenches the rule of law – including a commitment to secure property rights. It commits South Africa to transparent public finances accompanied by expenditure controls, and a central bank that executes its functions independently to protect the value of the currency in the interest of balanced and sustainable economic growth.
Government will contribute R100 billion to infrastructure fund over next decade
Eskom reforms will support longer-term transition to sustainable, resilient economy
Policy promoting low inflation, flexible exchange rate and sustainable fiscal framework supports investment

CHAPTER 2: ECONOMIC OVERVIEW
13
Implementing reforms to boost growth Increasing the long-term growth rate to sharply reduce unemployment and raise the revenues needed for social and economic development requires far-reaching structural reforms. A wide range of policies considered by government offer clear benefits that would boost economic activity and reduce exclusion. Yet policy inertia, poor implementation capacity and inadequate prioritisation continue to hinder the achievement of key developmental goals. These factors have also eroded the country’s global competitiveness.
Reversing the competitive slide A country’s economic competitiveness measures its ability to efficiently produce and trade goods and services. This is strongly linked to its ability to raise living standards over time. In recent years, policy inertia and a deterioration in the relationship between government and the private sector have reduced South Africa’s global competitiveness. South Africa has fallen from 44th (2007) to 67th (2018) on the Global Competitiveness Index. And between 2008 and 2018, South Africa’s ranking fell from 35th to 82nd in the World Bank’s Ease of Doing Business report. Over the same period, countries such as Kenya and Rwanda have been able to make significant gains in competitiveness by implementing rapid reforms. Kenya’s rollout of e-visas has considerably boosted tourism. Rwanda has enacted regulatory changes, enabling investments in broadband that improve quality, reduce costs and expand access.
Figure 2.1 Global Competitiveness Index
Source: Global Competitiveness Reports
South Africa’s slide in competitiveness reflects both a failure to implement key reforms domestically, and the speed at which peer nations have implemented their own reforms. The deterioration is also in response to corporate scandals, auditing firm failures, widespread corruption in both the public and private sectors, and the perceived erosion of government’s commitment to macroeconomic stability. Government aims to reverse this slide urgently, and move to the top 50 countries in the Ease of Doing Business rankings within the next three years.
Bold structural changes required Breaking from the pattern of anaemic economic growth and achieving the vision outlined in the National Development Plan (NDP) requires government to implement bold reforms.
South Africa’s low savings rate means that export-led growth is critical for earning revenue to fund investment and redistribution. There are various areas where the South African economy enjoys a clear competitive advantage. These include high-value manufacturing exports (motor vehicles), agricultural exports (fresh fruits and nuts) and tourism. Many of these sectors, such as horticulture and tourism, are also labour-intensive.

2019 BUDGET REVIEW
14
The country’s special economic zones can be used more effectively in support of these sectors.
However, faster export growth on its own is unlikely to result in a large increase in employment given the changing nature of the global economy, which has become increasingly skills-intensive. Under these conditions, government needs to implement effective strategies to create opportunities for large numbers of unemployed workers, prioritise interventions in skills development and education, and promote policies that facilitate skilled immigration. These interventions would increase GDP, raise per capita income and boost tax revenues.
Getting public education right – a central element of the NDP – is at the heart of improving the country’s economic potential. Government is prioritising reading comprehension through an early grade reading strategy and tackling infrastructure backlogs that negatively affect learning in basic education. In higher education and training, the focus is on expanding access to universities and technical and vocational colleges, and improving student performance.
More determined implementation of integrated development plans to promote densification, greater investment in public transport and housing programmes, and more mixed-income developments can reshape cities as engines of economic growth.
Crucially, the NDP emphasises the need for a capable state, including well-functioning state-owned companies, to anchor sustainable, inclusive and shared growth. Many of the problems experienced at state-owned companies can be addressed by introducing more competition, strengthening independent regulatory authorities and introducing strategic equity partners. Complementary efforts to reorganise the state will enhance the capacity of government to implement reforms that can raise living standards for all.
Global outlook The global economy continues to grow, but signs of slowing growth have emerged. The International Monetary Fund (IMF) has lowered its projection for global growth to 3.5 per cent in 2019 and 3.6 per cent in 2020, from a prior estimate of 3.7 per cent in both years.
Over the past six months, GDP growth projections for the United States, China and Europe have been revised down. Trade tensions between the US and China have contributed to weaker confidence and growth outlooks, and lower crude prices have reversed recent optimism about prospects for oil-exporting economies. World trade is expected to expand by 4 per cent over the medium term, down from 5.3 per cent in 2017.
In developed economies, growth is returning to lower long-term averages. The potential for tariff increases and retaliation among large economies still poses a risk to global trade. Nevertheless, US demand remains strong, oil prices have eased and monetary policy tightening is becoming less aggressive, which will offer some support to medium-term global growth.
In developing countries, growth is expected to decline from 4.6 per cent in 2018 to 4.5 per cent in 2019, mainly due to lower oil prices and trade risks, before rising to 4.9 per cent in 2020. The weak performance of sub-
Priority should be given to creating opportunities for unemployed workers, and boosting education and skills
Capable state, including effective state-owned companies, is needed for inclusive growth
Global economic growth projected at 3.5 per cent in 2019 and 3.6 per cent in 2020
Monetary policy tightening in developed economies is becoming less aggressive

CHAPTER 2: ECONOMIC OVERVIEW
15
Saharan Africa’s two largest economies – Nigeria and South Africa – continues to weigh on the region. The IMF projects Nigeria to grow by 2 per cent this year and 2.2 per cent in 2020. Economic growth for most economies in the region, including Kenya and Rwanda, is expected to exceed 4 per cent over the next five years.
Developing countries remain vulnerable to swings in investor sentiment. Financial market conditions, which stabilised in the middle of last year, have become more volatile since the end of 2018. Short-term uncertainty has added to concerns about trade tensions and slower global growth.
Commodity prices
Commodity price movements were volatile in 2018. Although robust global growth supported higher energy prices, rising US tariffs and weaker demand for industrial metals led to lower iron ore and platinum prices.
Figure 2.2 Commodity price trends
Source: Bloomberg
Table 2.1 Economic growth in selected countriesRegion/country 2010-2017 2018 2019 2020 2021-2023
Percentage Post-crisisWorld 3.8 3.7 3.5 3.6 3.6 Advanced economies 2.0 2.3 2.0 1.7 1.6 United States 2.2 2.9 2.5 1.8 1.5 Euro area 1.3 1.8 1.6 1.7 1.5 United Kingdom 2.0 1.4 1.5 1.6 1.6 Japan 1.5 0.9 1.1 0.5 0.5 Developing countries 5.3 4.6 4.5 4.9 4.9 China 8.0 6.6 6.2 6.2 5.8 India 7.3 7.3 7.5 7.7 7.7 Brazil 1.4 1.3 2.5 2.2 2.2 Russia 1.8 1.7 1.6 1.7 1.4 Mexico 3.1 2.1 2.1 2.2 2.9 Sub-Saharan Africa 4.3 2.9 3.5 3.6 4.0 South Africa1 2.0 0.7 1.5 1.7 2.4
1. National Treasury forecastSource: IMF World Economic Outlook, January 2019 and IMF World Economic Outlook database
Average GDP forecast
2019 BUDGET REVIEW
16
From the third quarter of 2018, concerns over weaker growth and expectations of supportive US monetary policy bolstered gold prices, even as oil prices declined. The improvement in Chinese growth in the second half of 2018 supported a recovery in the iron ore price.
While recent increases in iron ore and gold prices, and lower oil prices, support an improvement in South Africa’s terms of trade, global demand for industrial and safe-haven commodities remains uncertain.
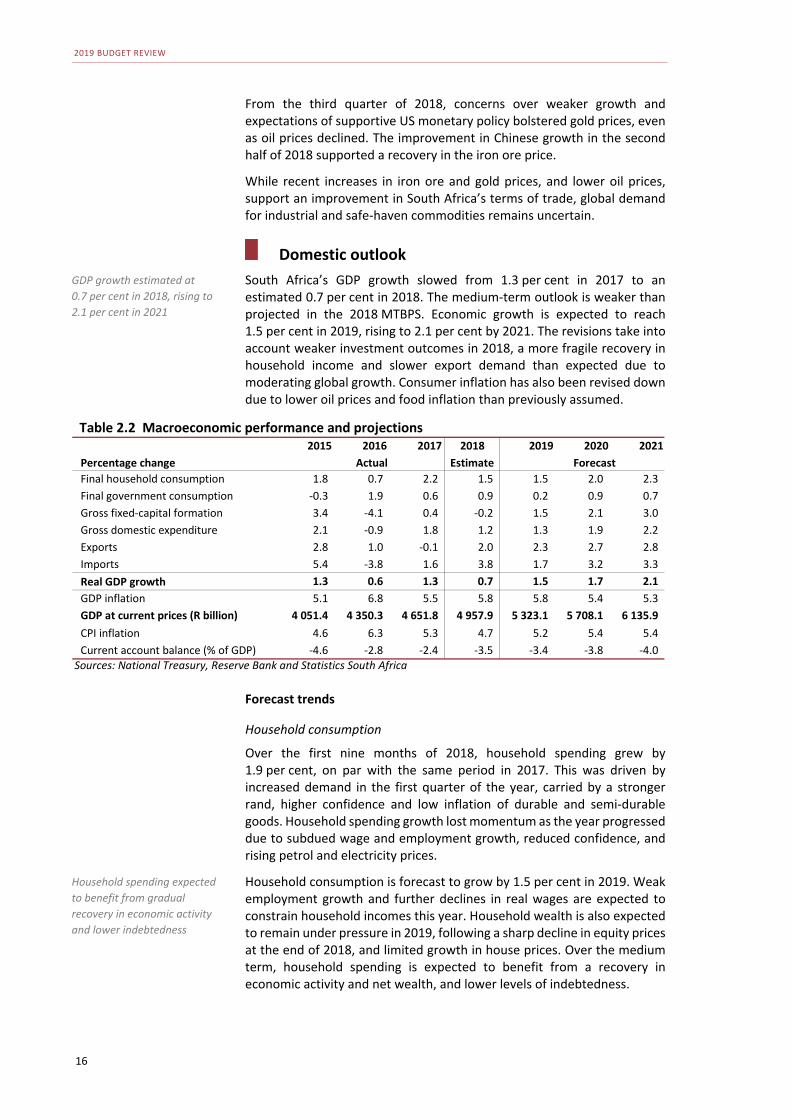
Domestic outlook South Africa’s GDP growth slowed from 1.3 per cent in 2017 to an estimated 0.7 per cent in 2018. The medium-term outlook is weaker than projected in the 2018 MTBPS. Economic growth is expected to reach 1.5 per cent in 2019, rising to 2.1 per cent by 2021. The revisions take into account weaker investment outcomes in 2018, a more fragile recovery in household income and slower export demand than expected due to moderating global growth. Consumer inflation has also been revised down due to lower oil prices and food inflation than previously assumed.
Forecast trends
Household consumption
Over the first nine months of 2018, household spending grew by 1.9 per cent, on par with the same period in 2017. This was driven by increased demand in the first quarter of the year, carried by a stronger rand, higher confidence and low inflation of durable and semi-durable goods. Household spending growth lost momentum as the year progressed due to subdued wage and employment growth, reduced confidence, and rising petrol and electricity prices.
Household consumption is forecast to grow by 1.5 per cent in 2019. Weak employment growth and further declines in real wages are expected to constrain household incomes this year. Household wealth is also expected to remain under pressure in 2019, following a sharp decline in equity prices at the end of 2018, and limited growth in house prices. Over the medium term, household spending is expected to benefit from a recovery in economic activity and net wealth, and lower levels of indebtedness.
Table 2.2 Macroeconomic performance and projections2015 2016 2017 2018 2019 2020 2021
Percentage change Estimate ForecastFinal household consumption 1.8 0.7 2.2 1.5 1.5 2.0 2.3 Final government consumption -0.3 1.9 0.6 0.9 0.2 0.9 0.7 Gross fixed-capital formation 3.4 -4.1 0.4 -0.2 1.5 2.1 3.0 Gross domestic expenditure 2.1 -0.9 1.8 1.2 1.3 1.9 2.2 Exports 2.8 1.0 -0.1 2.0 2.3 2.7 2.8 Imports 5.4 -3.8 1.6 3.8 1.7 3.2 3.3 Real GDP growth 1.3 0.6 1.3 0.7 1.5 1.7 2.1 GDP inflation 5.1 6.8 5.5 5.8 5.8 5.4 5.3 GDP at current prices (R billion) 4 051.4 4 350.3 4 651.8 4 957.9 5 323.1 5 708.1 6 135.9 CPI inflation 4.6 6.3 5.3 4.7 5.2 5.4 5.4 Current account balance (% of GDP) -4.6 -2.8 -2.4 -3.5 -3.4 -3.8 -4.0
Sources: National Treasury, Reserve Bank and Statistics South Africa
Actual
GDP growth estimated at 0.7 per cent in 2018, rising to 2.1 per cent in 2021
Household spending expected to benefit from gradual recovery in economic activity and lower indebtedness

CHAPTER 2: ECONOMIC OVERVIEW
17
Investment
Investment growth remains subdued. Investment fell by 0.3 per cent year-on-year in the first three quarters of 2018, following a 0.7 per cent expansion in the same period in 2017. Investment by private businesses and general government declined.
Figure 2.3 Composition of investment growth*
*First three quarters Source: Statistics South Africa As a percentage of GDP, investment has persistently declined, reaching a 13-year low of 17.7 per cent in the third quarter of 2018. The combination of low growth in employment, investment and productivity continues to restrain economic growth.
Investment growth is projected to rise from 1.5 per cent in 2019 to 3 per cent in 2021 as confidence gradually increases, worn-out capital is replaced and the state improves its ability to execute capital projects. However, concerns about electricity supply and slower global growth pose risks to the near-term outlook.
The Investment Summit affirmed that South Africa remains an attractive investment destination, with R300 billion in investments pledged across a variety of sectors. Efforts by the President’s investment envoys yielded another $28 billion in investment pledges.
Exchange rate
Developing-country currencies depreciated sharply during 2018 due to higher risk aversion, trade tensions and rising US interest rates. The JP Morgan Emerging Markets Currency Index fell by 11.1 per cent over the year. The rand performed in line with these trends, depreciating by 13.3 per cent against the US dollar and 9.8 per cent against the euro. Risk aversion and volatility remain high, although the rand has partially recovered. Between September 2018 and January 2019, the rand appreciated by 11.5 per cent against the US dollar.
Despite the weaker nominal exchange rate, South Africa’s inflation remains higher than that of trading partners. The real effective exchange rate
Investment by private business and general government have declined
R300 billion in investments pledged at Investment Summit across a range of sectors
Rand’s depreciation against dollar and euro during 2018 was in line with global trend

2019 BUDGET REVIEW
18
appreciated by 2.4 per cent over the first 11 months of 2018, signalling a loss of export competitiveness.
Balance of payments
The current account deficit as a percentage of GDP widened to 3.8 per cent in the first three quarters of 2018, compared with a deficit of 2.3 per cent over the same period in 2017. Over the medium term, the deficit is expected to widen from 3.4 per cent of GDP in 2019 to 4 per cent in 2021. The trade surplus declined from an average of 1.5 per cent of GDP in the first nine months of 2017 to 0.3 per cent over the same period in 2018. South Africa’s terms of trade deteriorated by 2 per cent over the period.
Figure 2.4 Composition of current account balance
Source: Reserve Bank
The balance on the financial account increased to 3.5 per cent of GDP in the first three quarters of 2018, up from 1.5 per cent in the same period in 2017. For the first time since 2013, net foreign direct investment rose over the three-quarter period, as foreign parent companies increased their holdings of South African subsidiaries, and as foreign acquisitions by South African firms slowed. Inward foreign direct investment rose by R70 billion in the first three quarters of 2018. Net portfolio investment fell by 31 per cent in the first three quarters of 2018.
Inflation
Headline inflation slowed from 5.3 per cent in 2017 to 4.7 per cent in 2018, as lower food and services inflation offset high petrol inflation in the second half of the year. Fuel inflation rose to 20.1 per cent in the second half of 2018 due to higher oil prices, putting upward pressure on public transport and freight costs. As a result of these large fuel price increases, the Department of Energy is reviewing the basic fuel price formula.
Consumer price index (CPI) inflation is expected to reach 5.2 per cent in 2019 in response to rising food inflation associated with higher fuel and agricultural input prices. Electricity inflation is also expected to increase. The National Treasury assumes an annual adjustment of 10 per cent in electricity prices in each of the next three years, effective from July 2019.
Current account deficit as percentage of GDP widened in 2018 due to lower trade surplus
Net foreign direct investment rose, while net portfolio investment fell, during 2018
Inflation remains well within 3-6 per cent target range, but fuel prices have risen sharply
CPI inflation expected to reach 5.2 per cent in 2019 as food inflation rises

CHAPTER 2: ECONOMIC OVERVIEW
19
Core inflation – which excludes the impact of food, electricity and fuel prices – remains stable at about 5 per cent over the medium term.
Figure 2.5 Trends in administered price inflation
Source: Statistics South Africa
Employment
Private-sector employment growth has been slowing since 2011. Job creation remains stagnant. The unemployment rate declined marginally from an average of 27.5 per cent in 2017 to 27.1 per cent in 2018. However, this is largely the result of a 16.8 per cent growth in the number of discouraged work seekers, who are not counted in the unemployment rate. The labour market obstructs easy entry into employment, particularly for young people.
Figure 2.6 Growth in formal non-agricultural employment*
*First nine months Source: Statistics South Africa
Net employment rose by 225 000 in 2018, mostly due to an increase in the informal non-agricultural sector. Private-sector employment growth was flat over the first three quarters of 2018. Lower industrial employment has
Job creation remains stagnant and unemployment rate averaged 27.1 per cent in 2018

2019 BUDGET REVIEW
20
been partially offset by stronger growth in services. Employment in gold mining has fallen during seven of the last eight quarters ending September 2018. Mining employment is expected to remain under pressure, with several companies announcing restructuring or mine closures.
The national minimum wage and other legislative amendments have come into effect, providing much-needed certainty in the labour market. Through the National Economic Development and Labour Council, business and labour have committed to support job creation and retention. Exemptions and shifts in working hours are expected to limit the job losses from upward wage adjustments as a result of the national minimum wage.
Declining renewables prices point toward long-term shifts in electricity generation In the context of rising electricity tariffs, and the falling cost of renewables, it is increasingly cost-effective for households and businesses to switch to renewable energy sources. The estimated average portfolio cost for all technologies under the Renewable Energy Independent Power Producer Programme, for example, was initially R2.79/kilowatt-hour (kWh). Today, the cost has fallen to R0.92/kWh, which is similar to Eskom’s average tariff. The figures below chart the declining average unit price of electricity since 2012 across the first four bid windows for independent power producers, as well as the projected future cost of Eskom-generated power. It compares those prices with the levelised cost of electricity for Eskom’s new Medupi and Kusile power stations, new baseload coal stations, and the utility’s current average tariff. The levelised cost is the net present value of the unit-cost of electricity over the lifetime of a generating asset. While this is an imperfect measure to compare price, it is a key investment planning indicator. This suggests that, relative to coal-generated power (both in terms of Eskom’s current build programme as well as new baseload coal), renewables are becoming increasingly cost-competitive.
Figure 2.7 REIPPP* price trends
Figure 2.8 Eskom estimated price trends
*Renewable Energy Independent Power Producer Programme Source: Independent Power Producer office and Council for Scientific and Industrial Research (2016, 2018). All prices as of April 2017. Recent research suggests that South Africa may soon reach a tipping point at which, due to the combination of rising electricity tariffs and falling costs of other generation technologies, many industrial, commercial, and household customers could soon leave the national electricity grid.1 This would threaten the financial sustainability of many municipalities, which rely on electricity sales as a major source of revenue. For Eskom, it would accelerate a vicious cycle, where it would have to share costs among a steadily declining pool of customers. 1 Goliger & McMillan, 2018, and Goliger & Cassim, 2018, both available at sa-tied.wider.unu.edu
Risks to the growth outlook There are pronounced risks to the economic outlook. The main risks concern Eskom. Failure to fully implement the reconfiguration of Eskom could lead to a negative market reaction that would prompt capital outflows, with greater pressure on the rand. It would also perpetuate weak investor confidence and reduce economic growth.
CHAPTER 2: ECONOMIC OVERVIEW
21
Other near-term risks to growth include load-shedding, higher electricity prices than assumed in the forecast, prolonged industrial action in the mining sector, and adverse weather conditions, which could undermine agricultural production. Weaker-than-expected growth in China, which is South Africa’s largest trading partner, could negatively affect the price and demand for South Africa’s export commodities. In addition to slower growth and trade frictions, key catalysts for market volatility in 2019 include the terms of Brexit and potential banking sector risks in Europe.
Economic assumptions The economic projection is a forecast underpinned by various assumptions. Updated assumptions appear in Table 2.3.
Major revisions since the 2018 MTBPS include a lower oil price assumption, and higher gold, coal and iron ore prices. A weaker growth outlook in developing economies, and perceptions of higher risk – including elevated contingent liability risks in South Africa – result in a higher risk premium assumption over the medium term. Short-term food inflation has been revised down.
Table 2.3 Assumptions used in the economic forecast2016 2017 2018 2019 2020 2021
Percentage change EstimateGlobal demand1 4.1 4.2 4.4 4.3 4.4 4.3 International commodity prices2
Brent crude oil (US$ per barrel) 44.2 54.8 71.0 61.6 63.1 63.7 Gold (US$ per ounce) 1 247.9 1 257.7 1 269.6 1 300.7 1 336.6 1 367.6Platinum (US$ per ounce) 988.3 950.4 880.6 813.8 826.6 834.0 Coal (US$ per ton) 64.4 78.9 96.3 97.1 99.5 100.4 Iron ore (US$ per ton) 58.6 70.6 66.4 69.0 65.2 64.7
Food inflation 10.5 6.9 3.7 5.1 6.0 6.0 Electricity inflation 9.2 4.7 5.3 9.0 10.0 10.0 Sovereign risk premium (percentage point)
3.2 2.7 3.0 3.2 3.1 3.0
Real public corporation investment -0.7 -1.3 -0.1 -0.3 1.1 2.2 1. Combined growth index of South Africa's top 15 trading partners (IMF World Economic Outlook, January 2019)2. Bloomberg futures prices between 24 December 2018 and 21 January 2019Source: National Treasury
Actual Forecast
Weaker-than-expected growth in China, which would affect export commodities, is a risk to economic outlook
Revisions to assumptions since October 2018 include a lower oil price, and higher gold, coal and iron ore prices

2019 BUDGET REVIEW
22
Alternative scenarios The National Treasury has modelled four alternative scenarios quantifying some of the risks to the baseline forecast.
Figure 2.9 GDP growth scenarios
Source: National Treasury
• In Scenario A, short-term reforms outlined in the 2018 Budget are implemented quickly and effectively, and long-term reforms that reduce barriers to entry begin to take shape. Reforms lower the cost of doing business and facilitate market access, boosting confidence, investment and competitiveness. The risk premium eases by 35 basis points, and long-term government bond yields fall by nearly one percentage point. Structural reforms and lower risk aversion towards South Africa supports growth of 2.1 per cent in 2019 and 2.9 per cent by 2021.
• Scenario B assumes that some policy decisions are made but implementation is slow. Policy certainty leads to higher confidence and a lower risk premium, which eases by an average of 15 basis points. Borrowing costs decline by an average of 35 basis points over the medium term. GDP growth reaches 1.7 per cent in 2019, accelerating to 2.4 per cent in 2021.
• In Scenario C, Eskom’s average energy availability factor falls to between 65 and 70 per cent for 18 months, leading to demand restrictions and extended load-shedding. This negatively affects output in energy-intensive sectors, and productivity generally. Eskom addresses supply constraints and integrates power procured from independent producers, leading to a recovery from late 2020. GDP growth weakens to 0.2 per cent in 2019, driven by a 3.5 per cent decline in exports. As electricity capacity is restored, GDP growth recovers to 1.9 per cent in 2021.
• In Scenario D, persistently weak growth, widening fiscal deficits and an inability to stabilise Eskom’s finances and improve its performance lead to a fiscal crisis and a local currency downgrade. Risk aversion towards South Africa rises sharply, with the risk premium rising by 210 basis points and long-term government bond yields rising by an average of 180 basis points. The weaker exchange rate contributes to an increase in inflation, which breaches the target range in 2019 and 2020. GDP falls by 1.2 per cent in 2019 and 0.2 per cent in 2020.
Sector performance
Mining In the first three quarters of 2018, real value added in the mining sector contracted by 1.4 per cent compared with the same period in 2017, lowering overall GDP growth by 0.1 percentage points.
Policy and regulatory uncertainty have contributed to the sector’s weak performance in recent years. The President’s economic stimulus and recovery plan has resolved much of this uncertainty. As a result of government’s efforts, relations between the industry and the Department of Mineral Resources have improved, fuelling hope of greater investment. At the Investment Summit in October 2018, mining commitments amounted to about R100 billion.
Mining commitments of R100 billion at Investment Summit

CHAPTER 2: ECONOMIC OVERVIEW
23
The mining sector is expected to remain under pressure over the medium term, largely as a result of low commodity prices.
Agriculture In the first three quarters of 2018, real value added in the agriculture, forestry and fishing sector contracted by 3.2 per cent compared with the same period in 2017. The contractions reflect more subdued activity following record production of maize and soybeans in the second half of 2017.
Exports of certain agricultural products have grown appreciably in recent years, particularly in new Asian markets. Trade promotion, market access and water interventions are crucial to attract investment in key crops such as apples, table grapes, citrus, avocados, macadamia and pecan nuts, and beef, which hold significant export potential. Industry and government are working together to expand export market access.
Manufacturing Real value added in manufacturing increased by 0.9 per cent in the first three quarters of 2018 compared with the same period in 2017. An upturn during the third quarter was driven by food and beverages, and motor vehicles and parts. Trade performance also improved. Exports, led by base metals and vehicles, grew by 8.2 per cent in 2018 compared with 2017.
While sentiment in the sector was marginally up towards the end of 2018, the Absa Purchasing Managers’ Index remains below the neutral 50-point mark, indicating that manufacturers remain under pressure.
Financial and business services Growth in real value added by the finance, insurance, real-estate and business services sector edged up to 2.2 per cent in the first three quarters of 2018 compared with 1.8 per cent in the same period of 2017. The sector’s contribution to GDP growth increased slightly from 0.4 percentage points in 2017 to 0.5 percentage points in the first three quarters of 2018.
Construction Value added in the construction sector fell by 1.2 per cent in the first three quarters of 2018 compared with the same period in 2017. Construction
Table 2.4 Sector performancePercentage change 2013 2014 2015 2016 2017 20181
Agriculture, forestry and fishing 4.5 6.8 -6.4 -10.2 17.7 -3.2Mining and quarrying 4.0 -1.7 3.1 -4.2 4.6 -1.4Manufacturing 1.0 0.3 -0.4 0.9 -0.2 0.9 Electricity, gas and water -0.6 -1.0 -1.7 -2.3 0.2 0.9 Construction 4.6 3.5 1.8 1.1 -0.3 -1.2Trade, catering and accommodation 2.0 1.4 1.9 1.7 -0.6 0.4 Transport, storage and communication 2.9 3.5 1.4 0.8 1.5 0.9 Finance, real estate and business services 2.6 2.7 2.6 2.3 1.9 2.2 General government services 3.2 3.2 1.0 1.4 0.3 0.8 Personal services 2.6 1.8 1.0 1.5 1.2 1.0 GDP 2.5 1.8 1.3 0.6 1.3 0.8
1. First three quartersSource: Statistics South Africa
Industry and government working to expand export market access and promote trade
Contribution to growth from financial and business services edged up in 2018

2019 BUDGET REVIEW
24
activity and employment has weakened due to declining investment in civil construction and residential buildings. The lack of demand continues to stifle confidence, particularly in the civil construction sector.
Transport and telecommunications Growth in transport services weakened from 1.4 per cent over the first three quarters of 2017 to 0.9 per cent in the same period of 2018. Growth was dampened by derailments on the iron ore line, a decline in overseas tourist arrivals and aircraft movements, and a national bus strike.
Conclusion Economic growth is expected to improve moderately over the medium term. Government has taken steps to restore policy certainty and confidence. To achieve significantly higher, more inclusive economic growth, create jobs and raise living standards, a range of structural reforms is needed. State capacity also needs to be strengthened.
Structural reforms and capable state required to raise economic growth rates over long term