s 2015-20 fa a : a- a dŵ cˆ · delivery incentives 114 . ... overview . this appendix sets out...
TRANSCRIPT

December 2014
Setting price controls for 2015-20
Final price control determination notice:
company-specific appendix – Dŵr Cymru
Final price control determination notice: company-specific appendix – Dŵr Cymru
1
Contents
Overview 2
A1 Final determination – at a glance 7
A2 Wholesale water 13
A3 Wholesale wastewater 31
A4 Household retail 48
A5 Non-household retail 59
A6 Appointee financeability and affordability 68
Annex 1: Wholesale costs 82
Annex 2: Household retail revenue modification 87
Annex 3: Reconciling 2010-15 performance 95
Annex 4: Outcomes, performance commitments and outcome
delivery incentives 114

Final price control determination notice: company-specific appendix – Dŵr Cymru
2
Overview
This appendix sets out the details of the final determination of price controls that are specific to
Dŵr Cymru. As set out in ‘Policy chapter A1 – introduction’ (‘policy chapter A1’), the final
determination protects customers in accordance with our statutory duties (summarised in policy
chapter A1) and ‘Setting price controls for 2015-20 – final methodology and expectations for
companies’ business plans’ (our ‘final methodology statement’). We have also had regard to
relevant guidance from the Welsh Government, and the principles of best regulatory practice to
be transparent, accountable, proportionate, consistent and targeted.
We published ‘Draft price control determination notice: company-specific appendix – Dŵr
Cymru’ (the ‘draft determination’ for Dŵr Cymru) on 30 May 2014, one of two ‘early
determinations’ ahead of the August deadline. This meant that, compared to the other non-
enhanced companies, the company benefited because it has had greater certainty and been
able to focus on delivering its plan.
But Dŵr Cymru is not an enhanced company. This means its final determination is subject to
any adjustments we considered necessary in light of any additional evidence available to us. In
this respect, Dŵr Cymru has been treated in the same way as the other non-enhanced
companies – we call this ‘equivalence of treatment’ between companies that are not given
‘enhanced’ status.
The customer challenge group (CCG) played an important role in both the development of the
company’s original plan and the company’s revised proposals in response to our challenges
and published guidance.
Since the first submission of its business plan in December 2013, Dŵr Cymru’s proposals have
evolved to take into account the outcome of our risk-based review (RBR), ‘Setting price controls
for 2015-20 – risk and reward guidance’ (our ‘risk and reward guidance’), our draft determination
and other relevant policy consultations. Its revised business plan, which sought to close the
gaps we identified during the RBR, included reduced totex proposals for both water and
wastewater; contained sufficient evidence for us to support a doubtful debt adjustment to the
cost to serve retail household customers; and accepted our risk and reward guidance.
There were only a limited number of areas where we considered it necessary to intervene to
protect the interests of consumers in the draft determination. In August we signalled that we
would update Dŵr Cymru’s draft determination to include amended performance commitments.
This reflected the findings of our comparative assessments of outcome performance
commitments and delivery incentives common to companies across the sector.
The company’s representation on the draft determination focused mainly on interventions on:

Final price control determination notice: company-specific appendix – Dŵr Cymru
3
some of its outcomes, with a focus on interruptions to supply (where the company
disagreed with our draft determination intervention but proposed performance levels that
were a significant improvement on its original levels) and customer acceptability of
drinking water;
adjustments to costs within the retail controls;
an adjustment to recognise poor performance in 2010-15; and
arguing against a reduction to the allowed return below the level assumed in the draft
determination.
We also received representations from the CCG, the Consumer Council for Water (CCWater)
and Natural Resources Wales (NRW). Each was broadly supportive of our determination, but
raised some specific concerns, for example, in relation to our assessment of some outcomes
(the CCG and NRW) and the adjustments to retail costs for doubtful debts (CCWater).
In reaching the final determination we have considered carefully the representations we
received on the draft determination (which was based upon the latest business plan submitted
to us) and taken account of the most up-to-date information available where appropriate. As a
result, this has led to changes which we consider are in the interests of customers and in line
with our other statutory duties, including the following.
Introducing a reward for its water supply interruptions, though Dŵr Cymru will still need to
significantly improve over the period to reach upper quartile performance and then earn
this reward.
Reducing the size of the downwards adjustment (or shortfall) we made to reflect some
aspects of performance in 2010-15.
Making an adjustment to the company’s average cost to serve (ACTS) to reflect its bad
debt management costs (which was in addition to the draft determination adjustment we
made for doubtful debt costs).
Following further updated information, the introduction of an efficiency challenge for non-
household retail costs.
In line with all non-enhanced companies, reducing allowed return to 3.6% for the
wholesale business to reflect the significant movement in the cost of new debt since the
publication of our risk and reward guidance in January 2014.
We summarise our final determination for Dŵr Cymru in section A1: ‘Final determination – at a
glance’.

Final price control determination notice: company-specific appendix – Dŵr Cymru
4
The remainder of this document sets out our final determination in more detail1 and is then
structured according to the binding price controls we are setting for the wholesale and retail
elements of the appointee (the whole regulated business):
wholesale water;
wholesale wastewater;
household retail; and
non-household retail.
As we explained in our final methodology statement, these separate controls are binding,
confirmed through the modifications already made to the price setting elements of companies’
licence conditions. This means that the companies cannot recover more revenue than allowed
under each specific price control and cannot transfer costs between the controls. The revenue
allowance for each price control is determined by the costs specific to that particular price
control. This provides the companies with more effective incentives.
Our approach to the final determination for Dŵr Cymru reflects the policy position of the Welsh
government and the fact that those customers in Wales using less than 50 Ml of water a year
will not be able to choose their supplier during the next five years. Most non-household
customers will not benefit from the protection to service levels and prices that a competitive
market will provide to equivalent customers in England. We will continue to need service and
price protection as well as different remuneration to investors for risks. Our final determinations
for companies operating wholly or mainly in Wales therefore include a non-household service
incentive mechanism (SIM) and a non-household cost efficiency challenge (if appropriate) to
provide protection for customers. They also take into account the lower level of risk these
companies are exposed to when determining remuneration to investors.
To support these separate, binding controls, throughout this document we also provide
details on:
the responses that we have received to our draft determinations and any consequential
adjustments that we have made;
the outcomes for the company to deliver and associated outcome delivery incentive
(ODI);
the efficient costs that we consider the company can achieve;
the adjustments we are making to the wholesale water and wastewater price controls to
reflect the company’s performance in 2010-15;
1 Figures stated in this document (including wholesale costs and bill information) are in 2012-13 prices; retail data
is stated in nominal prices. This is consistent throughout this final determination unless otherwise stated.

Final price control determination notice: company-specific appendix – Dŵr Cymru
5
the allowed return for the wholesale water and wastewater controls, and the retail
household and non-household net margins;
the return on regulatory equity (RoRE) range;
the financial ratios under the notional capital structure;
the uncertainty mechanisms that form part of each price control; and
where appropriate, the assumptions we have made to arrive at the allowed revenue for
each price control.
Implementing these price controls
Dŵr Cymru must deliver its obligations as required by the Water Industry Act 1991, other
relevant legislation and its Instrument of Appointment (“licence”). This price control
determination has been made under the terms of Dŵr Cymru’s licence and the Water Industry
Act 1991. We consider that Dŵr Cymru must act in an economic and efficient manner in
delivering all of its obligations.
Policy chapter A1 sets out the milestones leading up to 1 April 2015 that will ensure effective
business plan delivery. These cover menu choices, charges approval, reporting and assurance
requirements during 2015-20, and PR14 reconciliation.
In IN 14/15: ‘2014 price review – timetable for setting charges for 2015-16 and making menu
choices’ we set out the requirement for companies to notify us of their menu choices by 16
January 2015. We will make any adjustment to the company’s allowed revenues that result from
its menu choice as part of the price review in 2019 (PR19). A company’s menu choice will be
influenced by our decisions in this final determination. We confirm in annex 4 of this document a
commitment that the ODIs will be recalibrated in the true up calculations, based on a sharing
rate that is consistent with the company’s menu choice. To facilitate this, we expect the
company to publish its ODIs with the cost sharing rate that is implied by its menu choice on 16
January 2015. This will allow inclusion of the recalibrated ODIs within the framework for
reporting and assurance from 1 April 2015, which we will publish on 9 February 2015. We
require companies’ Boards to provide assurance that the recalibrated ODIs conform with the
final determination and are consistent with their menu choice. Any modifications should be
confined to correctly adjusting the incentive rates for the difference between the FD assumption
on the cost sharing rate and the rate associated with their final menu choice.
This price determination sets out the allowed revenues that Dŵr Cymru can recover from its
customers in the period 2015-20. Dŵr Cymru is responsible for converting the allowed revenues
into charges. In IN 14/17: ‘Approval of charges 2015-16 – our approach, process and
information requirements for large and small companies’ and the accompanying policy
document, we set out the timeline and process for charging approval. Companies are required
to provide us with their charges schemes, associated assurances, and the other information
requirements, and to provide any new appointees in their area with their charges schemes by

Final price control determination notice: company-specific appendix – Dŵr Cymru
6
16 January 2015. By 2 February 2015 each company is required to publish their charges
schemes.

Final price control determination notice: company-specific appendix – Dŵr Cymru
7
A1 Final determination – at a glance
This chapter provides a summary of the final determination for Dŵr Cymru. It summarises what
the final determination will mean for customers, with respect to the average bills they will pay
and the outcomes that the company will deliver in return. For the company, it covers its allowed
costs and revenues, return on regulatory equity and financeability ratios. We also summarise
the interventions we have made to the company’s revised plan in order to protect the interests
of customers.
Combined average household bill (£)
The chart below shows the average bills proposed in the company’s December plan, the
average bills in our final determination and the level of current bills (2014-15). All bills are shown
without the impact of inflation and are indicative as final bills will depend on the growth in the
number of customers, changes in their usage and the specific charges that the company sets
each year within the overall price controls that we have determined.
Our final determination means that average bills in 2019-20 will be £396, which is 5% lower than
current average bill levels (of £416).
The difference between the company’s December plan and our final determination is the result
of the company’s acceptance of our risk and reward guidance, other revisions to its plan and the
interventions we have made in its plan. This represents a cumulative saving of £19 for the
average customer over the 2015-20 period.

Final price control determination notice: company-specific appendix – Dŵr Cymru
8
Figure A1.1 Average bills
Note: The comparative bills from ‘company December plan’ is based on the data submitted in its business plan but projected using our financial model, thereby ensuring consistency with the final determination projection. As a consequence the company’s proposed bills illustrated above may not necessarily be the same as those described in the revised business plan.
The outcomes committed to by Dŵr Cymru
Dŵr Cymru has committed to delivering outcomes which reflect its customers’ views. These are
supported by 28 associated performance commitments which identify the company’s committed
level of performance under each outcome. For 15 of these performance commitments the
company is subject to associated financial ODIs whereby it will incur a penalty for performance
worse than its commitments, but for some can earn a reward for performance better than its
commitments during the period from 2015 to 2020.
The table below sets out Dŵr Cymru’s outcomes. These outcomes reflect the priorities of
customers set out in research and engagement with the CCG. We have undertaken a
comparative assessment of outcomes where it was possible to draw comparisons across the
sector and, where necessary, we have intervened to challenge companies to deliver an upper
quartile level of performance. Details of the types of incentives and level of performance
commitments associated with these outcomes are set out in annex 4.
Wholesale water Wholesale wastewater
Safe drinking water
Protecting our environment
Responding to climate change
Excellent customer service
Affordable prices
Asset stewardship
Protecting our Environment
Responding to Climate Change
Excellent Customer Service
Affordable prices
Asset stewardship
416
411
407
403
399
396
380
385
390
395
400
405
410
415
420
425
2014-15 2015-16 2016-17 2017-18 2018-19 2019-20
Final determination average bill Company December plan

Final price control determination notice: company-specific appendix – Dŵr Cymru
9
Household retail Non-household retail
Excellent customer service
Affordable prices
Excellent customer service
Affordable prices
Allowed costs and revenue for Dŵr Cymru
The table below shows the wholesale totex we have allowed over the period from 2015 to 2020.
The final determination allows Dŵr Cymru to receive revenues of £3,343m. This combines
allowed revenues for the wholesale and household retail controls. For non-household retail, we
have also set average revenue controls per customer for each of the customer types proposed
by the company. The £44.1 million of non-household revenue shown in the table below is
indicative as it does not assume any gains or losses from competition or the company charging
customers at levels different to the relevant default tariffs.
Under our ‘equivalence of treatment’ principle, the company is subject to our reduction in the
allowed return to reflect the reduction in the cost of new debt since January. The company is
also subject to changes in our cost allowances for wholesale and retail. Changes in these areas
are reflected in table below.
Wholesale Water Wastewater
Totex 2015-20 total (£m) 1,234.2 1,358.1
Allowed weighted average cost of capital (%) 3.60% 3.60%
Allowed wholesale revenue 2015-20 (£m) 1,321.1 1,749.0
Retail Household Non-
household
Cost allowance – 2015-20 total (£m) 242.9
Margin (%) 1.00% 1.23%
Retail allowed revenue (£m) 272.6 44.1
Note: Wholesale figures in 2012-13 prices as revenue will be affected by inflation and retail figures in nominal prices as revenue will not be affected by inflation – this is consistent throughout this final determination unless otherwise stated.
RoRE ranges – appointee
Dŵr Cymru has estimated the range of returns on regulatory equity (RoRE) that it could earn
dependent on its performance and external risk factors over the price control period. The RoRE
range reflects the company’s views and is based on an efficient company with the notional
capital structure2. We have identified the RoRE impact separately for outcome delivery
incentives (ODIs), total expenditure (totex) performance, financing and the service incentive
2 The notional capital structure is the capital structure that reflects Ofwat’s assumption of an appropriate level of
gearing to use in determining the allowed weighted average cost of capital (WACC).

Final price control determination notice: company-specific appendix – Dŵr Cymru
10
mechanism (SIM). We note that Dŵr Cymru’s actual returns may differ from notional returns due
to differences between notional and actual capital structure and notional and actual cost of debt
and level of cost efficiency compared to allowed totex and household retail average cost to
serve.
Figure A1.2 RoRE range
Source: Our calculations based on information from Dŵr Cymru
Note: Numbers presented based on calibration of the ODIs against an assumed menu choice of a 50% sharing factor
Our calculation of notional financeability ratios
Ofwat has a statutory duty to secure that a company is able to finance the proper carrying out of
its functions. We interpret this financing duty as requiring that we ensure that an efficient
company with a notional capital structure is able to finance its functions. A company’s actual
capital structure is a choice for the company and it bears the risk associated with its choices. An
efficient company is assumed to be able to deliver its plans based on the expenditure allowance
in our final determination.
0.7%
1.9%
0.2%
1.4%
0.5%0.1%
1.5%
0.7%
Base case5.6%
0.0%
1.0%
2.0%
3.0%
4.0%
5.0%
6.0%
7.0%
8.0%
9.0%
Final Determination
RoRE range - whole company
FinancingoutperformanceTotex outperformance
SIM outperformance
ODI outperformance
ODI underperformance
SIM underperformance
Final price control determination notice: company-specific appendix – Dŵr Cymru
11
Ahead of our draft determination we sought additional assurance from Dŵr Cymru that its plan
was financeable on the basis of a notional and an actual structure. The company provided this
assurance.
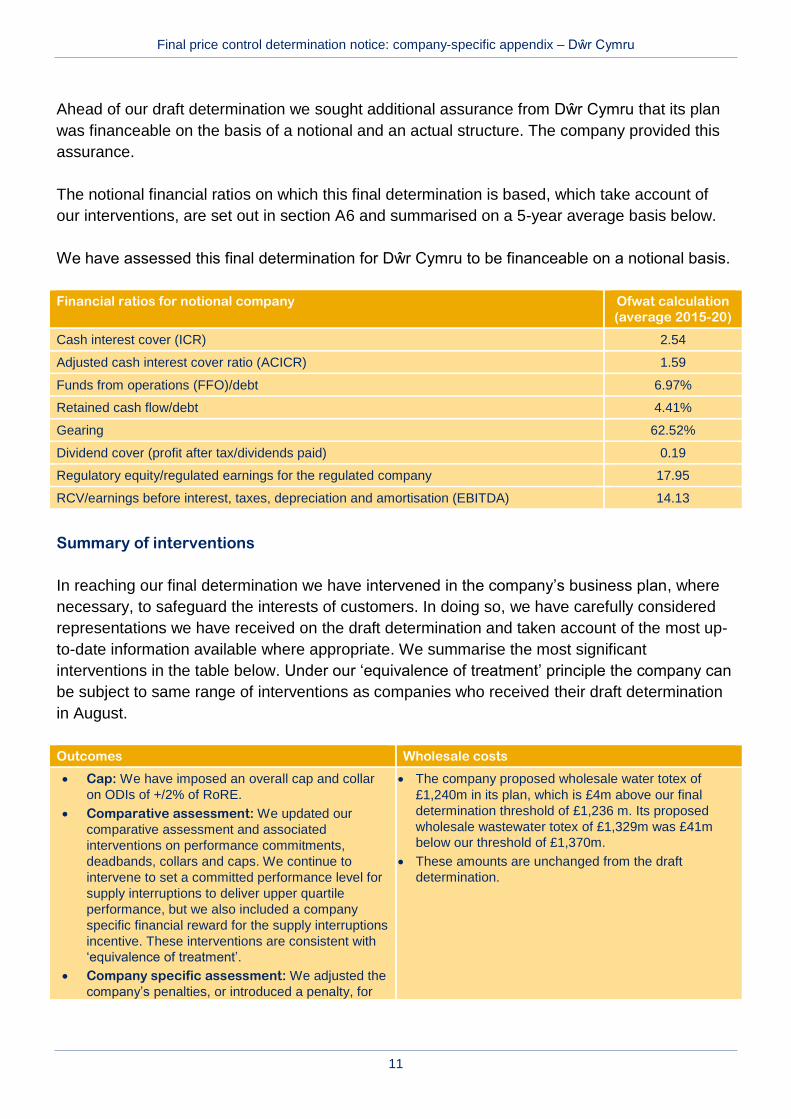
The notional financial ratios on which this final determination is based, which take account of
our interventions, are set out in section A6 and summarised on a 5-year average basis below.
We have assessed this final determination for Dŵr Cymru to be financeable on a notional basis.
Financial ratios for notional company Ofwat calculation
(average 2015-20)
Cash interest cover (ICR) 2.54
Adjusted cash interest cover ratio (ACICR) 1.59
Funds from operations (FFO)/debt 6.97%
Retained cash flow/debt 4.41%
Gearing 62.52%
Dividend cover (profit after tax/dividends paid) 0.19
Regulatory equity/regulated earnings for the regulated company 17.95
RCV/earnings before interest, taxes, depreciation and amortisation (EBITDA) 14.13
Summary of interventions
In reaching our final determination we have intervened in the company’s business plan, where
necessary, to safeguard the interests of customers. In doing so, we have carefully considered
representations we have received on the draft determination and taken account of the most up-
to-date information available where appropriate. We summarise the most significant
interventions in the table below. Under our ‘equivalence of treatment’ principle the company can
be subject to same range of interventions as companies who received their draft determination
in August.
Outcomes Wholesale costs
Cap: We have imposed an overall cap and collar
on ODIs of +/2% of RoRE.
Comparative assessment: We updated our
comparative assessment and associated
interventions on performance commitments,
deadbands, collars and caps. We continue to
intervene to set a committed performance level for
supply interruptions to deliver upper quartile
performance, but we also included a company
specific financial reward for the supply interruptions
incentive. These interventions are consistent with
‘equivalence of treatment’.
Company specific assessment: We adjusted the
company’s penalties, or introduced a penalty, for
The company proposed wholesale water totex of
£1,240m in its plan, which is £4m above our final
determination threshold of £1,236 m. Its proposed
wholesale wastewater totex of £1,329m was £41m
below our threshold of £1,370m.
These amounts are unchanged from the draft
determination.

Final price control determination notice: company-specific appendix – Dŵr Cymru
12
three performance commitments, but also
accepted a proposed reward for one. We included
transferred assets for two wastewater
commitments.
Retail Reconciling 2010-15 performance
We did not accept the company’s proposed input
price pressure adjustment for 2013-15, but we
have used the 2013-14 price base for setting
household and non-household retail price controls.
Based on additional evidence submitted by the
company, we made an adjustment to the
company’s household retail cost to serve to reflect
the debt management costs the company faces.
But, we reduced the value of the proposed
adjustment by £0.3m.
We accepted the company’s proposed re-
allocation of costs between metered and
unmetered and household and non-household, but
not its proposed reallocation of costs and margins
within non-household retail.
We applied an efficiency challenge to non-
household retail costs.
We changed the company’s proposed revenue
adjustments by £0.4m (in the company’s favour)
and its proposed regulatory capital value (RCV)
adjustment by £23.9 m (in customers’ favour)
We have applied a £12.6m serviceability shortfall
to wholesale water for unplanned interruptions to
supply.
Risk and reward Financeability and affordability
Based on the latest market evidence for the cost of
new debt we have reduced the company's allowed
return from 3.7% to 3.6%.This intervention is
consistent with ‘equivalence of treatment’.
We did not intervene in this area, but corrected two
modelling errors contained in the draft
determination.

Final price control determination notice: company-specific appendix – Dŵr Cymru
13
A2 Wholesale water
A2.1 Consideration of representations on our draft
determinations
In policy chapter A1, we provide a list of the respondents to the draft determinations
published in April, May and August of this year. We have fully considered all of the
responses received, and where appropriate, we have made either consequential
adjustments to our price control methodology or company-specific interventions.
Our general policies relevant to the wholesale water control are set out in the
following policy chapters that accompany our final determination. These include our
responses to representations on sector-wide issues.
‘Policy chapter A2 – outcomes’ (‘policy chapter A2’).
‘Policy chapter A3 – wholesale water and wastewater costs and revenues’
(‘policy chapter A3’).
‘Policy chapter A4 – reconciling performance for 2010-15’ (‘policy chapter
A4’).
‘Policy chapter A7 – risk and reward’ (‘policy chapter A7’).
‘Policy chapter A8 – financeability and affordability’ (the ‘policy chapter A8’).
Table A2.1 lists the representations we have received that are specific to Dŵr
Cymru’s wholesale water control and sets out where to find more information on our
responses in this document.
Table A2.1 Representations specific to the wholesale water control of Dŵr Cymru
Area Company-specific
representations
Detailed commentary in
this company-specific
appendix
Outcomes, performance
commitments and
incentives
Dŵr Cymru
CCG
CCWater
Annex 4
Outcome delivery and
reporting
None Annex 4
Calculating allowed
wholesale water
expenditure
None Section A2.3.1 and
Annex 1

Final price control determination notice: company-specific appendix – Dŵr Cymru
14
Area Company-specific
representations
Detailed commentary in
this company-specific
appendix
Calculation of revenues:
pay as you go (PAYG)
and RCV run-off
None Section A2.3.2 and A6.5
Cost of capital Dŵr Cymru
CCWater
Section A2.3.3
Reconciling 2010-15
performance
Dŵr Cymru Annex 3
Uncertainty mechanisms None Section A2.4
A2.2 Company outcomes, performance commitments and
delivery incentives
A2.2.1 Outcomes, performance commitments and incentives
In policy chapter A2, we discuss our approach to outcomes for the wholesale and
retail controls. Dŵr Cymru has developed and committed to delivering outcomes
which reflect its customers’ views. These are supported by specific performance
commitments and associated incentives (ODIs) whereby the company can be
rewarded or penalised for its performance during the period from 2015 to 2020.
The company’s outcomes have been developed with input from its CCG. The CCG’s
role was to challenge how well the company’s outcomes, performance commitments
and delivery incentives reflect the views and priorities of customers, both now and in
the future, as well as environmental priorities.
Consistent with the draft determination our assessment of the specific performance
commitments proposed by each non- enhanced company for wholesale water has
focused on:
comparative assessments where it was possible to compare performance
commitments and incentives across the sector and so challenge companies to
deliver an upper quartile level of performance so that companies are focused
on delivering benefits for customers and the environment;

Final price control determination notice: company-specific appendix – Dŵr Cymru
15
a company specific assessment to ensure that the performance commitments
proposed by each company are challenging, appropriately incentivised and
supported by customer engagement; and
the overall cap and collar we are applying on ODIs for 2015-20 that limits total
rewards and penalties.
We summarise the outcomes, performance commitments and ODIs for the
wholesale water control for Dŵr Cymru in table A2.2 below.
For some performance commitments and incentives types, we have intervened to
change the underlying performance level or incentives. Where we have intervened
we have done so to ensure that companies are subject to effective incentives that
protect customers against under-delivery and where merited, reward companies for
outperformance. We summarise our interventions in table A2.2 and set out whether
they are the result of our comparative assessments or company specific
assessment.
Under our ‘equivalence of treatment’ principle, the company is subject to:
the overall cap and collar we are applying on ODIs for 2015-20 that limits total
rewards and penalties; and
changes we have made to outcomes following detailed comparisons of similar
outcome proposals put forward by companies (that is, our comparative
assessments).
The cap and collar will apply in line with the approach set out in policy chapter A2.
Full detail of the wholesale water outcomes, performance commitments and
incentives, and our consideration of relevant responses, is provided in annex 4.

Final price control determination notice: company-specific appendix – Dŵr Cymru
16
Table A2.2 Wholesale water outcomes, performance commitments and incentives
Company proposal Intervention
Outcome Performance commitment Incentive type
Safe drinking water Safety of drinking water – % of
compliant samples
Financial – reward and penalty Comparative assessment – We
confirm our interventions at draft
determination to adopt a more
demanding performance
commitment level; change the
performance measurement period
to annual; change the penalty to a
unit rate and remove the
proposed rewards. Our revised
assessment of upper quartile
levels and deadbands has led to
minor changes as set out in
annex 4.

Final price control determination notice: company-specific appendix – Dŵr Cymru
17
Company proposal Intervention
Outcome Performance commitment Incentive type
Customer acceptability (drinking
water) – contacts per 1,000
population
Reputational Comparative assessment – We
confirm our interventions at draft
determination to introduce a more
demanding performance
commitment level, a penalty (and
associated deadbands and
collars) and change the
performance measurement period
to annual. Our revised
assessment of upper quartile
levels and deadbands has led to
minor changes as set out in
annex 4. We have also accepted
the company’s case for adding a
reward to this incentive.

Final price control determination notice: company-specific appendix – Dŵr Cymru
18
Company proposal Intervention
Outcome Performance commitment Incentive type
Reliability of supply – minutes lost
per customer per year
Reputational Comparative assessment – We
confirm our interventions at draft
determination to introduce a more
demanding performance
commitment level and a penalty
(and associated deadbands and
collars). Our revised assessment
of upper quartile levels and
deadbands has led to minor
changes as set out in annex 4.
We have also accepted the
company’s proposed penalty rate
and introduced a company
specific reward – this is in
response to a company specific
factor that Dŵr Cymru set out in
its representation.
Protecting our environment Abstraction of water for use – %
compliance with abstraction
licences
Reputational No intervention
Responding to climate change Carbon footprint – GWh of
renewable energy generated
Reputational No intervention

Final price control determination notice: company-specific appendix – Dŵr Cymru
19
Company proposal Intervention
Outcome Performance commitment Incentive type
Excellent customer service SIM Financial – reward and penalty No intervention
‘At risk’ customer services –
number of customers who have
experienced poor service
Reputational No intervention
Earning the trust of customers –
% of customers surveyed that say
they trust the company
Reputational No intervention
Affordable prices Affordable bills – annual increase Reputational No intervention
Asset stewardship Asset serviceability Financial –penalty only No intervention
Leakage Financial –penalty only Company specific assessment:
We confirm our draft
determination intervention to
change the penalty to a unit rate
and increase the maximum
penalty. We have also accepted
the company’s case for adding a
reward to this incentive.

Final price control determination notice: company-specific appendix – Dŵr Cymru
20
Company proposal Intervention
Outcome Performance commitment Incentive type
Asset resilience – % of critical
assets not meeting standards
Financial – penalty only Company specific assessment:
We confirm our draft
determination to change the
maximum annual penalty, penalty
rate to variable. We have also
changed the penalty to a variable
one and not accepted the
company’s proposed reward.

Final price control determination notice: company-specific appendix – Dŵr Cymru
21
A2.2.2 Outcome delivery and reporting
Dŵr Cymru’s proposed approach to the measurement, reporting and governance of
outcomes and our assessment of this approach is summarised in annex 4.
A2.3 Calculating the wholesale water price control
A2.3.1 Calculating allowed wholesale water expenditure
The cost of delivering wholesale water and wastewater services is a major driver of
customer bills, comprising more than 90% of the value chain. In order to protect the
interests of customers, we have determined the efficient level of costs for the
company to deliver the outcomes that matter to customers both today and tomorrow
and to allow it to meet its statutory obligations.
Our approach to determining efficient wholesale expenditure is set out in policy
chapter A3.
Following representations, the company’s proposed wholesale water totex is £1,240
million over 2015-20 (versus £1,257 million in its December plan). This is 0.3%
above the final determination threshold (post additions) of £1,236million.
The wholesale water allowed expenditure for Dŵr Cymru is detailed in table A2.3
below. We provide a further breakdown of some of the calculations in annex 1.
Further information about our assessment of each claim is set out in the populated
version of the final determination cost threshold models.
Table A2.3 Wholesale water allowed expenditure (£ million)
2015-16 2016-17 2017-18 2018-19 2019-20 Total
2015-20
Final determination
cost threshold
1,236.2
Costs excluded from
menu 8.8 8.8 8.8 8.8 8.8 44.0
Menu cost baseline1 246.5 243.0 239.2 233.9 229.7 1,192.2
Company’s view of
menu costs2 1,197.6

Final price control determination notice: company-specific appendix – Dŵr Cymru
22
2015-16 2016-17 2017-18 2018-19 2019-20 Total
2015-20
Implied menu choice 100.4
Allowed expenditure
from menu 246.7 243.2 239.5 234.1 230.0 1,193.6
Costs excluded from
menu 8.8 8.8 8.8 8.8 8.8 44.0
Total allowed
expenditure3 255.5 252.0 248.3 242.9 238.8 1,237.6
Less pension deficit
repair allowance 0.7 0.7 0.7 0.7 0.7 3.3
Totex for input to
PAYG 254.9 251.4 247.6 242.3 238.1 1,234.2
Notes: 1. Menu baseline is equal to the final determination threshold less pension deficit recovery costs, third party costs and market opening costs related to 2014-15 (see annex 1). 2. Based on company plan totex (reflecting its representation on its draft determination) minus costs for items excluded from the menu. The company will make a final menu choice by 16 January 2016 and any difference between this and the implied menu choice will be reconciled as part of PR19. 3. Includes pension deficit recovery costs.
A2.3.2 Calculation of revenues: PAYG and RCV run-off
In section A6.5 we discuss financeability at an appointee (whole regulated company)
level.
Table A2.4 shows the PAYG rates and the amount of totex recovered for wholesale
water, which we have used as the basis for this final determination. The ‘Resulting
PAYG (£m)’ is the amount of money recovered from customers in the short term.
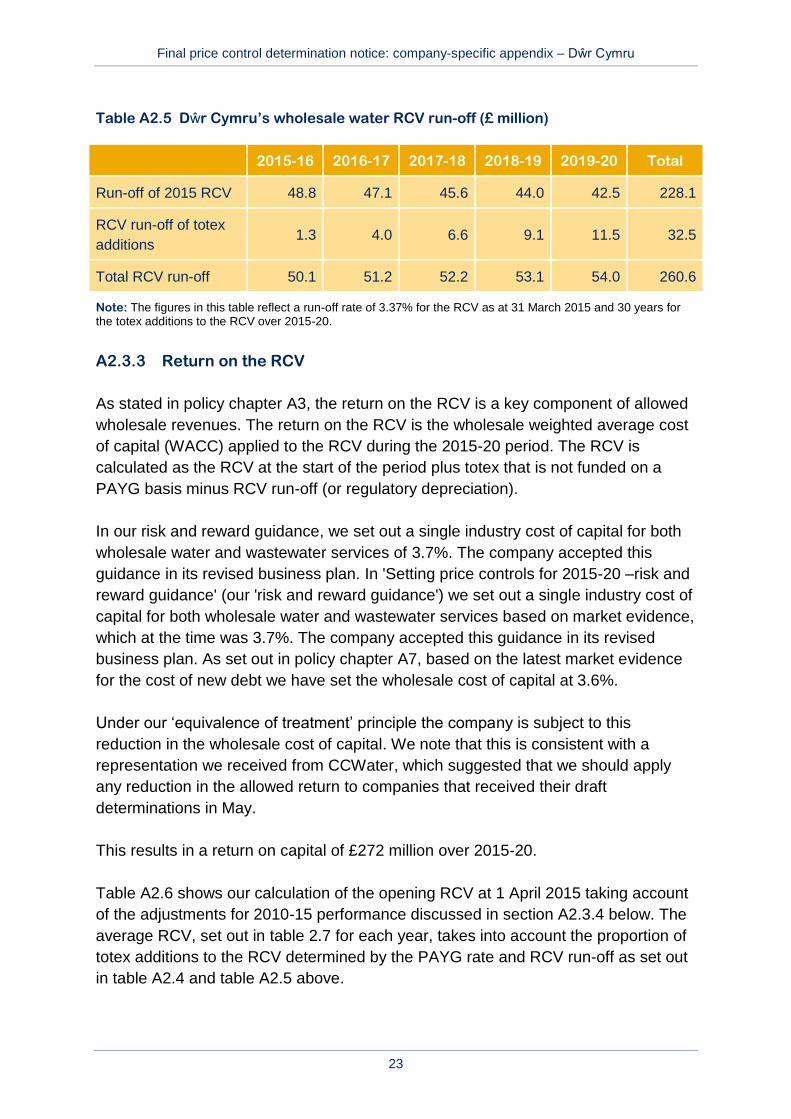
Table A2.5 shows the RCV run-off amounts included within the wholesale water
charge. This is the amount of money recovered in the long term through the
company’s RCV.
Table A2.4 Dŵr Cymru’s wholesale water PAYG rates
2015-16 2016-17 2017-18 2018-19 2019-20 Total
Totex (£m) 254.9 251.4 247.6 242.3 238.1 1,234.2
PAYG (%) 68.7% 68.9% 69.3% 70.3% 71.0% 69.6%
Resulting PAYG (£m) 175.0 173.2 171.6 170.2 169.1 859.2
Final price control determination notice: company-specific appendix – Dŵr Cymru
23
Table A2.5 Dŵr Cymru’s wholesale water RCV run-off (£ million)
2015-16 2016-17 2017-18 2018-19 2019-20 Total
Run-off of 2015 RCV 48.8 47.1 45.6 44.0 42.5 228.1
RCV run-off of totex
additions 1.3 4.0 6.6 9.1 11.5 32.5
Total RCV run-off 50.1 51.2 52.2 53.1 54.0 260.6
Note: The figures in this table reflect a run-off rate of 3.37% for the RCV as at 31 March 2015 and 30 years for the totex additions to the RCV over 2015-20.
A2.3.3 Return on the RCV
As stated in policy chapter A3, the return on the RCV is a key component of allowed
wholesale revenues. The return on the RCV is the wholesale weighted average cost
of capital (WACC) applied to the RCV during the 2015-20 period. The RCV is
calculated as the RCV at the start of the period plus totex that is not funded on a
PAYG basis minus RCV run-off (or regulatory depreciation).
In our risk and reward guidance, we set out a single industry cost of capital for both
wholesale water and wastewater services of 3.7%. The company accepted this
guidance in its revised business plan. In 'Setting price controls for 2015-20 –risk and
reward guidance' (our 'risk and reward guidance') we set out a single industry cost of
capital for both wholesale water and wastewater services based on market evidence,
which at the time was 3.7%. The company accepted this guidance in its revised
business plan. As set out in policy chapter A7, based on the latest market evidence
for the cost of new debt we have set the wholesale cost of capital at 3.6%.
Under our ‘equivalence of treatment’ principle the company is subject to this
reduction in the wholesale cost of capital. We note that this is consistent with a
representation we received from CCWater, which suggested that we should apply
any reduction in the allowed return to companies that received their draft
determinations in May.
This results in a return on capital of £272 million over 2015-20.
Table A2.6 shows our calculation of the opening RCV at 1 April 2015 taking account
of the adjustments for 2010-15 performance discussed in section A2.3.4 below. The
average RCV, set out in table 2.7 for each year, takes into account the proportion of
totex additions to the RCV determined by the PAYG rate and RCV run-off as set out
in table A2.4 and table A2.5 above.

Final price control determination notice: company-specific appendix – Dŵr Cymru
24
Table A2.6 Dŵr Cymru’s wholesale water opening RCV (£ million)
2014-15
Closing RCV 31 March 2015 1,288.6
Land sales1 0.3
Adjustment for actual expenditure 2009-102 13.7
Adjustment for actual expenditure 2010-153 164.2
Net adjustment from logging up and logging down3,4 -6.3
Adjustment for shortfalls3,4 0.0
Adjustment for serviceability shortfalls5 -12.6
Other adjustments6 0.0
Opening RCV 1 April 2015 1.447.8
Notes: 1. Land sales adjustment is set out in table AA3.18. 2. 2009-10 actual expenditure adjustment is set out in table AA3.18. 3. A component of the capital expenditure incentive scheme (CIS) adjustment as set out in table AA3.16. 4. The net adjustment from the change protocol is set out in table AA3.7. 5. The serviceability shortfall adjustment is set out in table AA3.11. 6. Other RCV adjustments are set out in table AA3.18.
Table A2.7 Dŵr Cymru’s wholesale water return on RCV (£ million)
2015-16 2016-17 2017-18 2018-19 2019-20
Opening RCV 1,447.8 1,477.6 1,504.6 1,528.4 1,547.3
RCV additions (from
totex) 79.9 78.1 76.0 72.0 69.0
Less RCV run-off 50.1 51.2 52.2 53.1 54.0
Closing RCV 1,477.6 1,504.6 1,528.4 1,547.3 1,562.3
Average RCV (year
average) 1,462.7 1,491.1 1,516.5 1,537.8 1,554.8
Return on capital 52.7 53.7 54.6 55.4 56.0
A2.3.4 Reconciling 2010-15 performance
When we last set price controls in 2009 (PR09), we included a number of incentive
mechanisms designed to encourage companies to improve and deliver services

Final price control determination notice: company-specific appendix – Dŵr Cymru
25
more efficiently, and to manage uncertainty. Consistent with the broad approach set
out at the time of the final determinations in 2009 we have made adjustments at this
price review (PR14) to 2015 to 2020 revenues and the RCV to take account of
company performance in the 2010 to 2015 period.
Our approach to reconciling 2010-15 performance is set out in policy chapter A4.
The company proposed adjustments to the opening RCV and allowed revenue for
the wholesale water services to reconcile performance in 2010-15. We have
intervened and, as a result, the revenue adjustments for wholesale water have
changed from -£30.7 million to -£30.8 million. We summarise these interventions in
table A2.8 below. The main changes we have made in the final determination in
reconciling the company’s 2010-15 performance result from our reduction in the
serviceability shortfall for unplanned interruptions and the change in capital
expenditure incentive scheme (CIS) methodology in relation to using the post-tax
cost of capital as the discount rate when calculating future revenue adjustments. The
impact on the opening RCV of 2010-15 adjustments is shown in table A2.6 and we
discuss our interventions in this area further in annex 3.
When making this final determination we do not have the full information on
companies’ performance in 2014-15. We set out in ‘Setting price controls for 2015-
20 – further information on reconciling 2010-15 performance’ that we would reconcile
for the revenue correction mechanism (RCM), change protocol and serviceability in
2015, and in 2016 for CIS, when we have the company’s actual performance for
2014-15. In carrying out this reconciliation we will take a proportionate approach (for
example, applying materiality thresholds where appropriate) to making adjustments
for company’s actual performance and implement these changes at the next
wholesale price control review in 2019.

Final price control determination notice: company-specific appendix – Dŵr Cymru
26
Table A2.8 Dŵr Cymru’s wholesale water revenue adjustments to reflect 2010-15 performance (£ million)
Area of intervention Intervention Total revenue adjustment
2010-15 (post intervention)
Company view Draft
determination
Final
determination
SIM We have included our view of the company’s SIM
reward, which we have calculated as 0.2%. Our
intervention increased revenue by £1.4 million.
1.6 3.0 3.0
RCM We have intervened in the following areas:
used the company’s May 2014 tables;
corrected data inconsistencies related to the
number of households billed;
used our view of FD09 assumptions; and
corrected inconsistencies between outturn
financial year average RPI in the company’s
submission.
Combined, our interventions reduced revenue by
£0.6 million compared with the company’s revised
business plan.
18.2 17.6 17.6
Opex incentive allowance
(OIA)
There are no interventions in this area. 0.0 0.0 0.0
Capital expenditure
incentive scheme (CIS)
As for all companies, we have used the post-tax
basis of the PR09 cost of capital for the discount rate
when calculating the future value of the revenue
-50.5 -52.9 -51.3

Final price control determination notice: company-specific appendix – Dŵr Cymru
27
Area of intervention Intervention Total revenue adjustment
2010-15 (post intervention)
Company view Draft
determination
Final
determination
adjustment in the 2010-15 period.
In carrying out our assessment, we have included
our view of the applicable change protocol amounts
and used the inflation assumptions from table A9.
Combined, our interventions reduced revenue by
£0.8 million compared with the company’s revised
business plan.
Other adjustments There are no interventions in this area. 0.0 0.0 0.0

Final price control determination notice: company-specific appendix – Dŵr Cymru
28
A2.3.5 Calculation of allowed revenue
We set out the calculation of the allowed revenue for Dŵr Cymru’s wholesale water
control in table 2.9.
Overall, Dŵr Cymru’s wholesale water revenue allowance will be £263.0 million in
2015-16, increasing by 0.9% to £265.4 million in 2019-20.
Table A2.9 Dŵr Cymru’s wholesale water allowed revenue (£ million)
2015-16 2016-17 2017-18 2018-19 2019-20 Total
Totex 254.9 251.4 247.6 242.3 238.1 1,234.2
PAYG rate
(%) 68.7% 68.9% 69.3% 70.3% 71.0%
Totex
additions to
the RCV
79.9 78.1 76.0 72.0 69.0 375.0
RCV (year
average) 1,462.7 1,491.1 1,516.5 1,537.8 1,554.8
Wholesale allowed revenue build up:
PAYG1 175.6 173.9 172.3 170.9 169.8 862.5
Return on
capital 52.7 53.7 54.6 55.4 56.0 272.3
RCV run-off 50.1 51.2 52.2 53.1 54.0 260.6
Tax2 0.0 0.0 0.0 0.0 0.0 0.0
Income from
other
sources3,4
-15.2 -15.2 -15.2 -15.2 -15.3 -76.2
Reconciling
2010-15
performance
-6.2 -6.2 -6.2 -6.2 -6.2 -30.8
Ex ante
additional
menu
income
-0.1 -0.1 -0.1 -0.1 -0.1 -0.7
Wholesale allowed revenue adjustments:

Final price control determination notice: company-specific appendix – Dŵr Cymru
29
2015-16 2016-17 2017-18 2018-19 2019-20 Total
Capital
contributions
from
connection
charges and
revenue
from
infrastructure
charges
6.1 6.4 6.7 6.9 7.2 33.4
Final
allowed
revenues
263.0 263.6 264.2 264.8 265.4 1,321.1
Notes: 1. PAYG includes the PAYG calculated from totex and the pension deficit repair allowance. 2. Including tax on adjustments for reconciling 2010-15 performance and ex-ante additional menu income. 3. We have adjusted other income values to remove the deferred income element relating to IFRIC18, as this is an accounting adjustment. 4. Our assessment of income from other sources is discussed in section A3.3 in policy chapter A3.
A2.4 Uncertainty mechanisms
We have set the company’s allowed revenues for the 2015-20 period. All companies
face uncertainty about future costs and revenues this is reflected in the rate of return
and the established framework in the licence.
We outline our approach to incremental uncertainty mechanisms in policy chapter
A7, where we set out our response to the representations made by stakeholders in
support of sector wide uncertainty mechanisms.
We have allowed all companies an uncertainty mechanism for business rates as the
revaluation of business rates in 2017 is a material risk that is largely outside the
control of companies. This mechanism allows a proportion of the costs to be passed
through to customers, reflecting the fact that companies have more control than
customers in managing the risk.
In table A2.10 below, we set out Dŵr Cymru’s proposed wholesale water uncertainty
mechanisms and our final assessment of these proposals.

Final price control determination notice: company-specific appendix – Dŵr Cymru
30
Table A2.10 Dŵr Cymru’s proposals for wholesale water uncertainty mechanisms
Assessment at draft determination Our final assessment
In the draft determination we adjusted the
company’s proposed sharing rate for its
proposed uncertainty mechanism on water
business rates from 80:20 to 75:25
(customer:company).
For our final determination we confirm the
uncertainty mechanism included in our draft
determination.
The specific text of this Notified Item is in the
annex to the final determination letter. The
rationale for its inclusion in the final
determination is set out in policy chapter A7.
Natural Resources Wales saw a change
mechanism as necessary to permit the
management of present and future statutory
obligations. It will be working with the
company to develop a suitable mechanism.
No change to the draft determination
position. This is because the company has
not proposed an uncertainty mechanism for
new statutory requirements; we have not
allowed such a mechanism for other
companies in our draft determinations; and
Natural Resources Wales has not provided
new evidence why the uncertainty
mechanism meets our criteria of materiality,
controllability, company specific protection
and consumer interests.
This does not affect the company’s
responsibility to meet all statutory
obligations. The final determination provides
funding for the company for the 2015-20
period and it is the company’s responsibility
to manage any uncertainty. We note that
there are a range of existing mechanisms
available to companies to manage
uncertainty, including:
totex sharing menu;
interim determination of K (IDoK’s); and
substantial favourable effects and
substantial adverse effects clauses in
Condition B of the licence.

Final price control determination notice: company-specific appendix – Dŵr Cymru
31
A3 Wholesale wastewater
A3.1 Consideration of representations on our draft
determinations
In policy chapter A1, we provide a list of the respondents to the draft determinations
published in April, May and August of this year. We have fully considered all of the
responses received, and where appropriate, we have made either consequential
adjustments to our industry-wide approach or company-specific interventions.
Our general policies relevant to the wholesale wastewater control are set out in the
following policy chapters that accompany our final determination. These include our
responses to representations on sector-wide issues.
Policy chapter A2.
Policy chapter A3.
Policy chapter A4.
Policy chapter A7.
Policy chapter A8.
Table A3.1 lists the representations we have received that are specific to Dŵr
Cymru’s wholesale wastewater control and sets out where to find more information
on our responses in this document.
Table A3.1 Representations specific to the wholesale wastewater control of Dŵr
Cymru
Area Company-specific
representations
Detailed commentary in this
company-specific appendix
Outcomes,
performance
commitments and
incentives
Dŵr Cymru
CCG
CCWater
(NRW)
Annex 4
Outcome delivery
and reporting
None Annex 4
Calculating allowed
wholesale water
expenditure
None Section 3.3.1 and Annex 1

Final price control determination notice: company-specific appendix – Dŵr Cymru
32
Area Company-specific
representations
Detailed commentary in this
company-specific appendix
Calculation of
revenues: PAYG
and RCV run-off
None Section A3.3.2 and A6.5
Cost of capital Dŵr Cymru
CCWater
Section A3.3.3
Reconciling 2010-
15 performance
Dŵr Cymru Annex 3
Uncertainty
mechanisms
None Section A3.4
A3.2 Outcomes, performance commitments and incentives
In policy chapter A2, we discuss our approach to outcomes for the wholesale and
retail controls.
The company’s outcomes have been developed with input from its CCG. The CCG’s
role was to challenge how well the company’s outcomes, performance commitments
and delivery incentives reflect the views and priorities of customers, both now and in
the future, as well as environmental priorities.
Similar to the wholesale water control, our assessment of the specific performance
commitments proposed by each non-enhanced company for wholesale wastewater
has focused on a comparative assessment of outcomes, a company specific
assessment and the overall cap and collar.
We summarise the outcomes, performance commitments and ODIs for the
wholesale wastewater control for Dŵr Cymru in table A3.2 below.
For some performance commitments and incentives types we have intervened to
change the underlying performance level or incentives. Where we have intervened
we have done so to ensure that companies are subject to effective incentives that
protect customers against under-delivery and where merited, reward companies for
outperformance. We summarise our interventions in table A3.2 and set out whether
they are the result of our comparative assessments or company specific
assessment.
Under our ‘equivalence of treatment’ principle, the company is subject to:

Final price control determination notice: company-specific appendix – Dŵr Cymru
33
the overall cap and collar we are applying on ODIs for 2015-20 that limits total
rewards and penalties; and
changes we have made to outcomes following detailed comparisons of similar
outcome proposals put forward by companies (that is: our comparative
assessment).
The cap and collar will apply in line with the approach set out in policy chapter A2.
Full detail of the wholesale wastewater outcomes, performance commitments and
incentives, and our consideration of relevant representations, is provided in annex 4.

Final price control determination notice: company-specific appendix – Dŵr Cymru
34
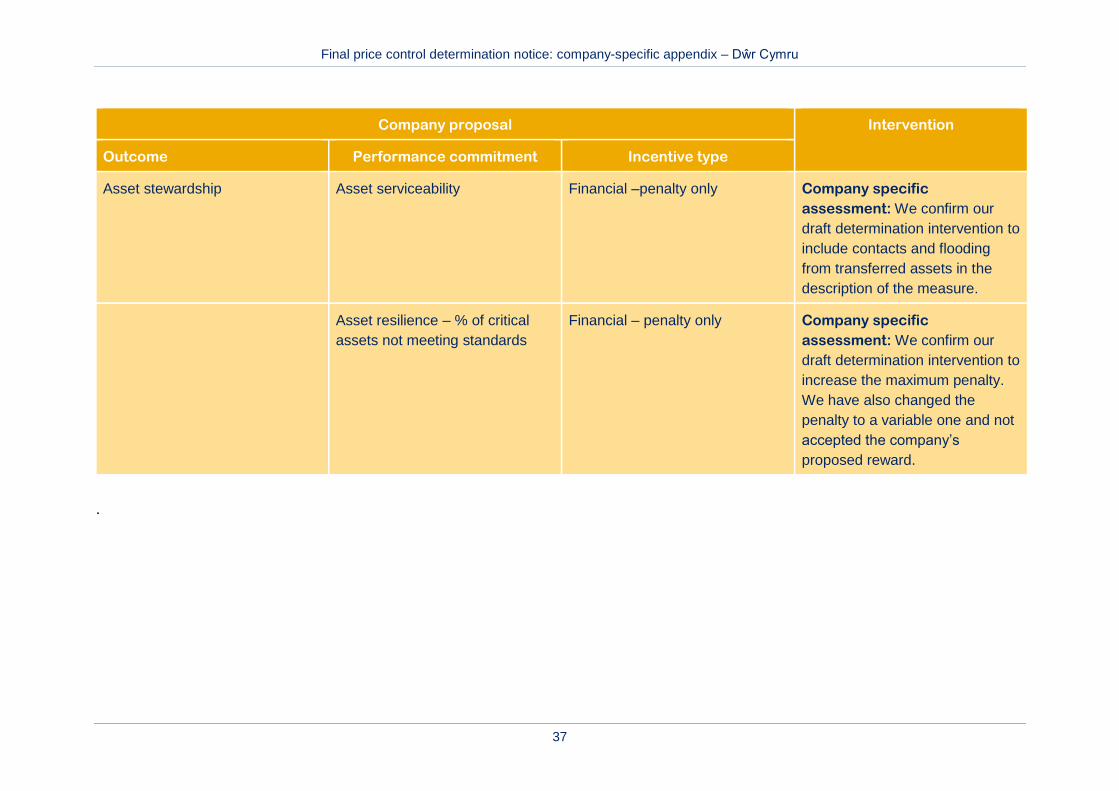
Table A3.2 Wholesale wastewater outcomes, performance commitments and incentives
Company proposal Intervention
Outcome Performance commitment Incentive type
Protecting our environment Treating Used Water – %
compliance of WWTW
Reputational Company specific
assessment: We have
increased the performance
commitment level to 100%
compliance
Preventing pollution – number of
incidents
Financial – reward and penalty Comparative assessment: We
confirm our interventions at draft
determination to change the
performance commitment level
(and associated caps, collars and
deadbands) and the
measurement period to annual.
Our revised assessment of upper
quartile levels and deadbands
has led to minor changes as set
out in annex 4. We have also
accepted the company’s case for
adding a reward to this incentive,
though this does not apply to
category 1 or 2 incidents.

Final price control determination notice: company-specific appendix – Dŵr Cymru
35
Company proposal Intervention
Outcome Performance commitment Incentive type
Responding to climate change Adapting to climate change – no
of properties covered by surface
water removal schemes
Reputational Company specific
assessment: We confirm our
draft determination to introduce a
penalty (and associated caps,
collars and deadbands). We have
also corrected an error in the
penalty collar.
Carbon footprint – GWh of
renewable energy generated
Reputational No intervention
Best in class customer service SIM Financial – reward and penalty No intervention
‘At risk’ customer services –
number of customers who have
experienced poor service
Reputational Company specific
assessment: We confirm our
draft determination intervention to
include contacts and flooding
from transferred assets in the
description of the measure.

Final price control determination notice: company-specific appendix – Dŵr Cymru
36
Company proposal Intervention
Outcome Performance commitment Incentive type
Sewer flooding – properties
flooded in the year
Financial – reward and penalty Comparative assessment: We
confirm our draft determination
intervention to measure
performance annually and reduce
the reward rate, but we have
accepted the company’s
proposed performance profile
(the company is currently
performing at the upper quartile
level in this area). Our revised
assessment of upper quartile
levels and deadbands has led to
minor changes as set out in
annex 4.
Earning the Trust of Customers
– % of customers surveyed that
say they trust the company
Reputational No intervention
Affordable prices Affordable bills – annual increase Reputational No intervention
Final price control determination notice: company-specific appendix – Dŵr Cymru
37
Company proposal Intervention
Outcome Performance commitment Incentive type
Asset stewardship Asset serviceability Financial –penalty only Company specific
assessment: We confirm our
draft determination intervention to
include contacts and flooding
from transferred assets in the
description of the measure.
Asset resilience – % of critical
assets not meeting standards
Financial – penalty only Company specific
assessment: We confirm our
draft determination intervention to
increase the maximum penalty.
We have also changed the
penalty to a variable one and not
accepted the company’s
proposed reward.
.

Final price control determination notice: company-specific appendix – Dŵr Cymru
38
A3.3 Calculating the wholesale wastewater price control
A3.3.1 Calculating allowed wholesale wastewater expenditure
Our approach to calculating allowed wholesale expenditure is set out in policy
chapter A3.
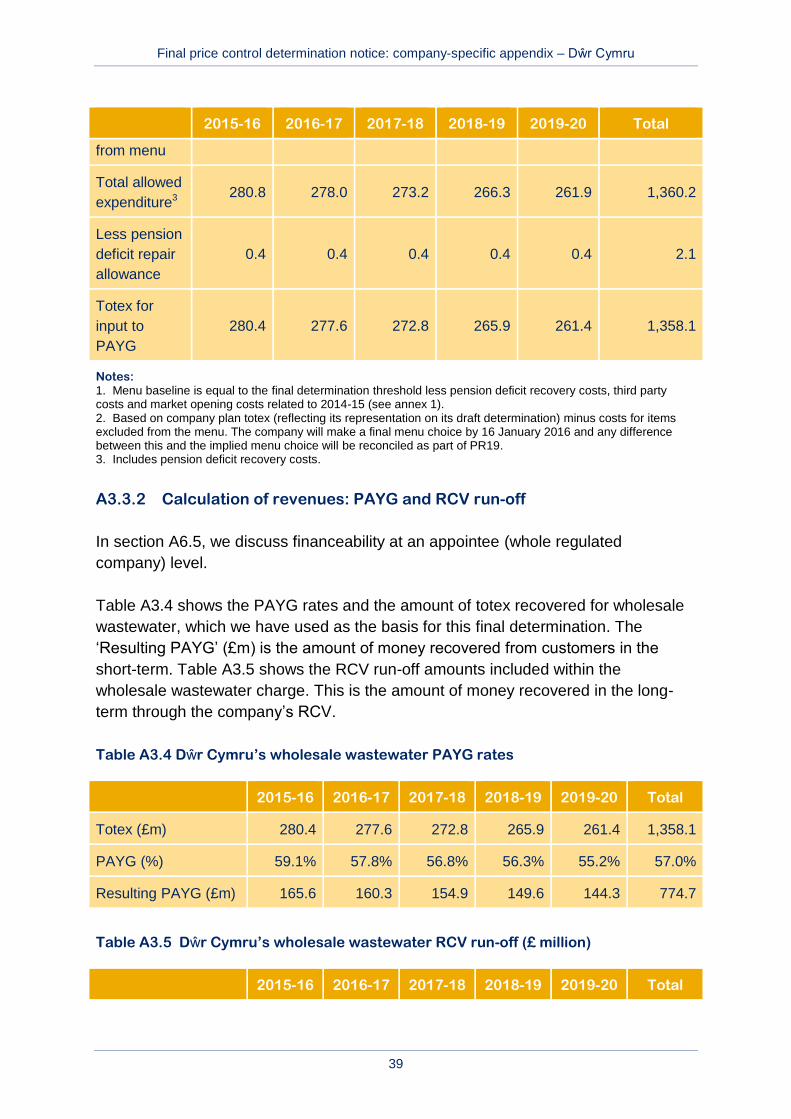
Following representations, the company proposed wholesale wastewater totex of
£1,329 million over 2015-20 (versus £1,338 million in its December plan). This is
£41m (3%) below the final determination threshold (post additions) of £1,370 million.
The wholesale wastewater allowed expenditure for Dŵr Cymru is detailed in table
A3.3 below. A further breakdown of some of the calculations is provided in annex 1.
Further information about our assessment of each claim is set out in the populated
version of the final determination cost threshold models.
Table A3.3 Wholesale wastewater allowed expenditure (£ million)
2015-16 2016-17 2017-18 2018-19 2019-20 Total
Final
determination
cost
threshold
1,370.3
Costs
excluded
from menu
0.4 0.4 0.4 0.4 0.4 2.1
Menu cost
baseline1 282.5 279.6 274.8 267.9 263.4 1,368.2
Company’s
view of menu
costs2
1,327.7
Implied menu
choice 97.0
Allowed
expenditure
from menu
280.4 277.6 272.8 265.9 261.4 1,358.1
Costs
excluded 0.4 0.4 0.4 0.4 0.4 2.1
Final price control determination notice: company-specific appendix – Dŵr Cymru
39
2015-16 2016-17 2017-18 2018-19 2019-20 Total
from menu
Total allowed
expenditure3 280.8 278.0 273.2 266.3 261.9 1,360.2
Less pension
deficit repair
allowance
0.4 0.4 0.4 0.4 0.4 2.1
Totex for
input to
PAYG
280.4 277.6 272.8 265.9 261.4 1,358.1
Notes: 1. Menu baseline is equal to the final determination threshold less pension deficit recovery costs, third party costs and market opening costs related to 2014-15 (see annex 1). 2. Based on company plan totex (reflecting its representation on its draft determination) minus costs for items excluded from the menu. The company will make a final menu choice by 16 January 2016 and any difference between this and the implied menu choice will be reconciled as part of PR19. 3. Includes pension deficit recovery costs.
A3.3.2 Calculation of revenues: PAYG and RCV run-off
In section A6.5, we discuss financeability at an appointee (whole regulated
company) level.
Table A3.4 shows the PAYG rates and the amount of totex recovered for wholesale
wastewater, which we have used as the basis for this final determination. The
‘Resulting PAYG’ (£m) is the amount of money recovered from customers in the
short-term. Table A3.5 shows the RCV run-off amounts included within the
wholesale wastewater charge. This is the amount of money recovered in the long-
term through the company’s RCV.
Table A3.4 Dŵr Cymru’s wholesale wastewater PAYG rates
2015-16 2016-17 2017-18 2018-19 2019-20 Total
Totex (£m) 280.4 277.6 272.8 265.9 261.4 1,358.1
PAYG (%) 59.1% 57.8% 56.8% 56.3% 55.2% 57.0%
Resulting PAYG (£m) 165.6 160.3 154.9 149.6 144.3 774.7
Table A3.5 Dŵr Cymru’s wholesale wastewater RCV run-off (£ million)
2015-16 2016-17 2017-18 2018-19 2019-20 Total

Final price control determination notice: company-specific appendix – Dŵr Cymru
40
2015-16 2016-17 2017-18 2018-19 2019-20 Total
Run-off of 2015 RCV 71.2 69.6 68.0 66.5 65.0 340.2
RCV run-off of totex
additions 1.3 3.9 6.6 9.2 11.8 32.8
Total RCV run-off 72.5 73.5 74.6 75.7 76.8 373.1
Note: The figures in this table reflect a run-off rate of 2.26% for the RCV as at 31 March 2015 and 44 years for the totex additions to the RCV over 2015-20.
A3.3.3 Return on the RCV
As discussed in section A2.3.3, we have used a cost of capital of 3.6% in this final
determination.
Under our ‘equivalence of treatment’ principle the company is subject to this
reduction in the wholesale cost of capital. We note that this is consistent with a
representation we received from CCWater, which suggested that we should apply
any reduction in the allowed return to companies that received their draft
determinations in May.
A wholesale cost of capital of 3.6% results in a return on capital of £586.2 million
over 2015-20.
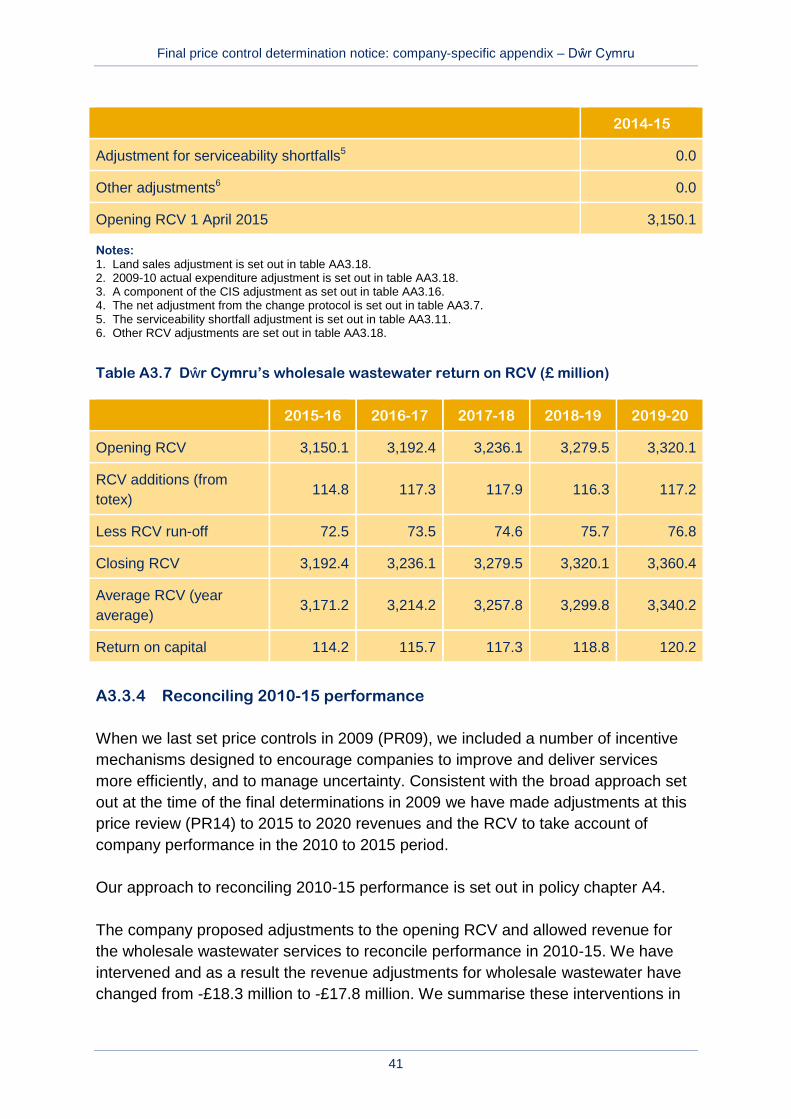
Table A3.6 shows our calculation of the opening RCV at 1 April 2015 taking account
of the adjustments for 2010-15 performance discussed in section A3.2.4 below. The
average RCV, set out in table A3.7 below for each year, takes into account the
proportion of totex additions to the RCV determined by the PAYG rate and RCV run-
off as set out in table A3.4 and table A3.5 above.
Table A3.6 Dŵr Cymru’s wholesale wastewater opening RCV (£ million)
2014-15
Closing RCV 31 March 2015 2,989.4
Land sales1 0.7
Adjustment for actual expenditure 2009-102 39.6
Adjustment for actual expenditure 2010-153 70.5
Net adjustment from logging up and logging down3,4 50.0
Adjustment for shortfalls3,4 0.0
Final price control determination notice: company-specific appendix – Dŵr Cymru
41
2014-15
Adjustment for serviceability shortfalls5 0.0
Other adjustments6 0.0
Opening RCV 1 April 2015 3,150.1
Notes: 1. Land sales adjustment is set out in table AA3.18. 2. 2009-10 actual expenditure adjustment is set out in table AA3.18. 3. A component of the CIS adjustment as set out in table AA3.16. 4. The net adjustment from the change protocol is set out in table AA3.7. 5. The serviceability shortfall adjustment is set out in table AA3.11. 6. Other RCV adjustments are set out in table AA3.18.
Table A3.7 Dŵr Cymru’s wholesale wastewater return on RCV (£ million)
2015-16 2016-17 2017-18 2018-19 2019-20
Opening RCV 3,150.1 3,192.4 3,236.1 3,279.5 3,320.1
RCV additions (from
totex) 114.8 117.3 117.9 116.3 117.2
Less RCV run-off 72.5 73.5 74.6 75.7 76.8
Closing RCV 3,192.4 3,236.1 3,279.5 3,320.1 3,360.4
Average RCV (year
average) 3,171.2 3,214.2 3,257.8 3,299.8 3,340.2
Return on capital 114.2 115.7 117.3 118.8 120.2
A3.3.4 Reconciling 2010-15 performance
When we last set price controls in 2009 (PR09), we included a number of incentive
mechanisms designed to encourage companies to improve and deliver services
more efficiently, and to manage uncertainty. Consistent with the broad approach set
out at the time of the final determinations in 2009 we have made adjustments at this
price review (PR14) to 2015 to 2020 revenues and the RCV to take account of
company performance in the 2010 to 2015 period.
Our approach to reconciling 2010-15 performance is set out in policy chapter A4.
The company proposed adjustments to the opening RCV and allowed revenue for
the wholesale wastewater services to reconcile performance in 2010-15. We have
intervened and as a result the revenue adjustments for wholesale wastewater have
changed from -£18.3 million to -£17.8 million. We summarise these interventions in

Final price control determination notice: company-specific appendix – Dŵr Cymru
42
table A3.8 below, and quantify the resulting adjustments within this final
determination. The impact on the opening RCV of 2010-15 adjustments is shown in
table A3.6 above and we discuss our interventions in this area further in annex 3.
The main change we have made in the final determination in reconciling the
company’s 2010-15 performance results from the change in CIS methodology in
relation to using the post-tax cost of capital as the discount rate when calculating
future revenue adjustments.
When making this final determination we do not have the full information on
companies’ performance in 2014-15. We set out in ‘Setting price controls for 2015-20
– further information on reconciling 2010-15 performance’ that we would reconcile for
the RCM, change protocol and serviceability in 2015, and in 2016 for CIS, when we
have the company’s actual performance for 2014-15. In carrying out this
reconciliation we will take a proportionate approach (for example, applying
materiality thresholds where appropriate) to making adjustments for company’s
actual performance and implement these changes at the next wholesale price control
review in 2019.

Final price control determination notice: company-specific appendix – Dŵr Cymru
43
Table A3.8 Dŵr Cymru’s wholesale wastewater revenue adjustments to reflect 2010-15 performance (£ million)
Area of intervention Intervention Total revenue adjustment
2010-15 (post intervention)
Company view Draft
determination
Final
determination
SIM We have included our view of the company’s SIM
reward, which we have calculated as 0.2%. Our
intervention increased revenue by £1.9 million.
2.0 3.9 3.9
RCM We have intervened in the following areas:
used the company’s May 2014 tables;
corrected data inconsistencies related to the
number of households billed;
used our view of FD09 assumptions; and
corrected inconsistencies between outturn
financial year average RPI in the company’s
submission.
Combined, our interventions reduced revenue by
£1.2 million compared to the company’s revised
business plan.
16.7 15.6 15.5
OIA There are no interventions in this area. 0.0 0.0 0.0
CIS As for all companies, we have used the post-tax
basis of the PR09 cost of capital for the discount
rate when calculating the future value of the revenue
-37.0 -38.3 -37.2

Final price control determination notice: company-specific appendix – Dŵr Cymru
44
Area of intervention Intervention Total revenue adjustment
2010-15 (post intervention)
Company view Draft
determination
Final
determination
adjustment in the 2010-15 period.
In carrying out our assessment, we have included
our view of the applicable change protocol amounts
and used the inflation assumptions from table A9.
Combined, our interventions reduced revenue by
£0.3 million compared to the company’s revised
business plan.
Other adjustments There are no interventions in this area. 0.0 0.0 0.0

Final price control determination notice: company-specific appendix – Dŵr Cymru
45
A3.3.5 Calculation of allowed revenue
The calculation of the allowed revenue for Dŵr Cymru’s wholesale wastewater
control is shown in table A3.9.
Overall, Dŵr Cymru’s wholesale wastewater revenue allowance will be £354.9
million in 2015-16, decreasing by 2.9% to £344.7 million in 2019-20.
Table A3.9 Dŵr Cymru’s wholesale wastewater allowed revenue (£ million)
2015-16 2016-17 2017-18 2018-19 2019-20 Total
Totex 280.4 277.6 272.8 265.9 261.4 1,358.1
PAYG rate 59.1% 57.8% 56.8% 56.3% 55.2%
Totex
additions to
the RCV
114.8 117.3 117.9 116.3 117.2 583.4
RCV (year
average) 3,171.2 3,214.2 3,257.8 3,299.8 3,340.2
Wholesale allowed revenue build up:
PAYG1 166.1 160.7 155.3 150.0 144.7 776.8
Return on
capital 114.2 115.7 117.3 118.8 120.2 586.2
RCV run-off 72.5 73.5 74.6 75.7 76.8 373.1
Tax2 0.0 0.0 0.0 0.0 0.0 0.0
Income from
other
sources3,4
-0.1 -0.1 -0.1 -0.1 -0.1 -0.7
Reconciling
2010-15
performance
-3.6 -3.6 -3.6 -3.6 -3.6 -17.8
Ex ante
additional
menu
income
1.0 1.0 1.0 1.0 1.0 5.0

Final price control determination notice: company-specific appendix – Dŵr Cymru
46
2015-16 2016-17 2017-18 2018-19 2019-20 Total
Wholesale allowed revenue adjustments:
Capital
contributions
from
connection
charges and
revenue
from
infrastructure
charges
4.9 5.1 5.3 5.5 5.7 26.5
Final
allowed
revenues
354.9 352.3 349.8 347.3 344.7 1,749.0
Notes: 1. PAYG includes the PAYG calculated from totex and the pension deficit repair allowance. 2. Including tax on adjustments for reconciling 2010-15 performance and ex ante additional menu income. 3. We have adjusted other income values to remove the deferred income element relating to IFRIC18, as this is an accounting adjustment. 4. Our assessment of income from other sources is discussed in section A3.3 in policy chapter A3.
A3.4 Uncertainty mechanisms
We have set the company’s allowed revenues for the 2015-20 period. All companies
face uncertainty about future costs and revenues this is reflected in the rate of return
and the established framework in the licence.
We outline our approach to incremental uncertainty mechanisms in policy chapter
A7, where we set out our response to the representations made by stakeholders in
support of sector wide uncertainty mechanisms.
For the wholesale wastewater control we are not allowing additional uncertainty
mechanisms within this framework.
In table A3.10 below, we set out Dŵr Cymru’s proposed wholesale wastewater
uncertainty mechanisms and our assessment of these proposals.
Table A3.10 Dŵr Cymru’s proposals for wholesale wastewater uncertainty
mechanisms
Assessment at draft determination Our assessment

Final price control determination notice: company-specific appendix – Dŵr Cymru
47
Assessment at draft determination Our assessment
In the draft determination we did not accept
the company’s proposed uncertainty
mechanism on wastewater business rates.
No change to draft determination position
given that we have already not accepted the
mechanism and the company has not
objected.
Natural Resources Wales saw a change
mechanism as necessary to permit the
management of present and future statutory
obligations. It will be working with the
company to develop a suitable mechanism.
No change to the draft determination
position. This is because the company has
not proposed an uncertainty mechanism for
new statutory requirements; we have not
allowed such a mechanism for other
companies in our draft determinations; and
Natural Resources Wales has not provided
new evidence why the uncertainty
mechanism meets our criteria of materiality,
controllability, company specific protection
and consumer interests.
This does not affect the company’s
responsibility to meet all statutory
obligations. The final determination provides
funding for the company for the 2015-20
period and it is the company’s responsibility
to manage any uncertainty. We note that
there are a range of existing mechanisms
available to companies to manage
uncertainty, including:
totex sharing menu;
interim determination of K (IDoK’s); and
substantial favourable effects and
substantial adverse effects clauses in
Condition B of the licence.

Final price control determination notice: company-specific appendix – Dŵr Cymru
48
A4 Household retail
A4.1 Consideration of representations on our draft
determinations
In policy chapter A1, we provide a list of the respondents to the draft determinations
published in April, May and August of this year. We have fully considered all of the
responses received, and where appropriate, we have made either consequential
adjustments to our industry-wide approach or company-specific interventions.
Our general policies relevant to the household retail control are set out in the
following policy chapters that accompany our final determination. These include our
responses to representations on sector-wide issues.
Policy chapter A2
‘Policy chapter A5 – household retail costs and revenues’ (‘policy chapter
A5’).
Policy chapter A7.
Table A4.1 lists the representations we have received that are specific to Dŵr
Cymru’s household retail control and sets out where to find more information on our
responses in this document.
Table A4.1 Representations specific to the household retail control of Dŵr Cymru
Area Company-specific
representations
Detailed commentary in this
company-specific appendix
Outcomes,
performance
commitments and
incentives
Dŵr Cymru
CCG
CCWater
Annex 4
Outcome delivery
and reporting
None Annex 4
ACTS calculation Dŵr Cymru Section A4.3
Allocation of costs Dŵr Cymru Section A4.3.1
Adjustments Dŵr Cymru
CCG
CCWater
Section A4.3.2 and annex 2

Final price control determination notice: company-specific appendix – Dŵr Cymru
49
Area Company-specific
representations
Detailed commentary in this
company-specific appendix
New costs None Section A4.3.3
Uncertainty
mechanisms
None Section A4.5
A4.2 Outcomes, performance commitments and incentives
In policy chapter A2, we discuss our approach to outcomes for the wholesale and
retail controls.
The company’s outcomes have been developed with input from its CCG. The CCG’s
role was to challenge how well the company’s outcomes, performance commitments
and delivery incentives reflect the views and priorities of customers, both now and in
the future, as well as environmental priorities.
Our assessment of the specific performance commitments proposed by each
company for household retail has focused on a company specific assessment to
ensure that the performance proposed by each company is challenging,
appropriately incentivised and supported by customer engagement.
For some performance commitments and incentives types, we have intervened to
change the underlying performance level or incentives. Where we have intervened
we have done so to ensure that companies are subject to effective incentives that
protect customers against under-delivery and where merited, reward companies for
outperformance. We summarise any interventions in table A4.2.
Full detail of the household retail outcomes, performance commitments and
incentives, and our consideration of relevant responses, is provided in annex 4..

Final price control determination notice: company-specific appendix – Dŵr Cymru
50
Table A4.2 Household retail outcomes, performance commitments and incentives
Company proposal Intervention
Outcome Performance commitment Incentive type
Best in class customer service SIM1 Financial – reward and penalty No intervention
Earning the trust of customers Reputational No intervention
Affordable prices Affordable bills Reputational No intervention
Help for disadvantaged
customers
Reputational No intervention
Note:
1. We have required all companies to include a performance commitment based on the SIM.

Final price control determination notice: company-specific appendix – Dŵr Cymru
51
A4.3 Costs
Our assessment of the industry ACTS, and therefore Dŵr Cymru’s retail costs, has
changed since we made our May draft determination. The change reflects the
additional retail cost information that we have received from companies receiving
their draft determinations in August and our assessment of those costs. It also
reflects changes following representations from all companies. We have updated our
view of costs under the ‘equivalence of treatment’ principle.
Our approach to the household retail control is set out in policy chapter A5. As set
out in policy chapter A5, we have adjusted companies’ costs to align to the 2013-14
base year – this is consistent with the position the company proposed in its
representation. Historic costs are therefore presented in 2013-14 prices, and all
future costs and revenues in nominal prices.
We set out our final household retail adjustments, the modification factors for
household retail allowed revenue and the assumed number of customers we have
used to calculate the total revenues in annex 2.
Dŵr Cymru made representations on how the ACTS is calculated. In particular the
company represented on:
the calculation of the efficiency challenge for the additional cost to serve
metered customers; and
the use of an un-weighted average to calculate the ACTS.
The company’s representations are discussed alongside representations made by
other companies in policy chapter A5. We have taken these representations into
consideration and present our conclusions on whether changes to the ACTS
methodology are needed in policy chapter A5.
A4.3.1 Allocation of costs
In table A4.3 below, we summarise our assessment of Dŵr Cymru’s cost allocation
methodology.

Final price control determination notice: company-specific appendix – Dŵr Cymru
52
Table A4.3 Our assessment of Dŵr Cymru’s cost allocation methodology
Area assessed Assessment
No potential material misallocations Pass
Adequate assurance provided Pass
Reconciliation to regulatory accounts and December business plan provided Pass
On 29 August 2014 we wrote to the company, asking it to undertake a cross check of
its allocation of doubtful debt based on outstanding debt against an allocation based
on write-offs. We had identified this issue as part of our industry wide review of cost
allocation submissions in June 2014.
In response, Dŵr Cymru completed this cross check and, as a consequence,
proposed reallocating its doubtful debts based on write-offs. We have accepted the
company’s allocation based on debt write offs. This is because we agree that this is
a more suitable proxy cost driver for the allocation of doubtful debts than the
movement in outstanding debt, in the absence of the direct attribution which our
guidance prescribes.
However, we note that from 2015-16 all companies will need to have the systems in
place to be able to directly attribute their annual doubtful debt charge between
household and non-household on a customer-type specific basis. We will confirm
this in the regulatory accounting guidelines for 2015-16, which we will publish early in
2015 following consideration of responses to other matters covered in our recent
consultation on regulatory reporting. We are satisfied that the company has
addressed the outstanding action. Therefore we have used the company’s cost
allocation between retail and wholesale and between household and non-household
retail to set our final determination.
The impact of the reallocation of doubtful debts is to increase non-household retail
operating costs and decrease household retail operating costs by £1.714 million for
2013-14 (£8.571 million for 2015-20).
The company has also made a representation on the allocation of its costs between
base costs and the additional costs to serve metered customers. The company has
proposed a reallocation that moves costs into the additional cost to serve metered
customers from base cost to serve. The company has provided external assurance
of these allocations.

Final price control determination notice: company-specific appendix – Dŵr Cymru
53
We are accepting the company’s reallocated costs. The company’s original
submission only included the costs of reading meters in the additional costs to serve
metered customers. As the new allocations include, for example, costs associated
with issuing more frequent bills, we consider the revised allocations to more
accurately reflect the true additional cost to serve metered customers.
A4.3.2 Adjustments
In its revised business plan, submitted in May 2014, Dŵr Cymru sought adjustments
to the ACTS for:
pension deficit repair costs;
doubtful debt and debt management driven by deprivation and bill size; and
input price pressure.
Pension deficit repair costs
In the final determination we have included an adjustment to the ACTS for all
companies to reflect the pension deficit recovery costs that our modelling shows is
appropriate for household retail as set out in IN 13/17 ‘Treatment of companies’
pension deficit repair costs at the 2014 price review’.
Doubtful debt and debt management driven by deprivation and bill size
As doubtful debt and debt management costs are both driven by deprivation and bill
size, we consider these to be two parts of one adjustment. However, as only some
evidence is common to both parts of the adjustment and this evidence was provided
at different times, our assessment of the evidence is presented separately for each
part of the adjustment.
In the final determination for Dŵr Cymru we have included an adjustment to the
ACTS for:
doubtful debt, but at lower value than that proposed by the company (our final
assessment is unchanged from the draft determination); and
debt management, but at lower value than that proposed by the company (our
final assessment represents a change from our draft determination and
reflects the provision of additional evidence as part of the company’s
representation).
Input price pressure

Final price control determination notice: company-specific appendix – Dŵr Cymru
54
In the final determination we have not accepted the company’s proposal for an ACTS
adjustment for input price pressure. We do not consider the evidence the company
provided on management practices is sufficient and convincing to demonstrate that
future cost increases are outside of efficient management control, that is affected in
a materially different way to other companies, or that it could not absorb further input
price pressures through efficiency gains.
Table A4.4 outlines our assessment of Dŵr Cymru’s proposed ACTS adjustments.
The value of the adjustments we have accepted in our final determination is
summarised in table A4.5. Further details on our assessment, and our response to
representations we received on our draft determination that are specific to this
aspect of the company’s household retail control determination, are set out in annex
2.
Table A4.4 Dŵr Cymru’s proposals for ACTS adjustments
Adjustment assessment criteria
Adjustment Value
(£m over
2015-20)
Materiality Beyond
efficient
management
control
Impact
company in
materially
different way
Value of
adjustment
appropriate
Doubtful debt
and debt
management
driven by
deprivation and
bill size –
doubtful debt
38.9 Pass Pass Pass Pass
Doubtful debt
and debt
management
driven by
deprivation and
bill size – debt
management
6.2
Pass (as part
of doubtful
debt
adjustment)
Pass Pass Pass
Input price
pressure 14.8 Pass Fail
Efficiency
benchmarking
evidence:
Fail
n/a

Final price control determination notice: company-specific appendix – Dŵr Cymru
55
Adjustment assessment criteria
Adjustment Value
(£m over
2015-20)
Materiality Beyond
efficient
management
control
Impact
company in
materially
different way
Value of
adjustment
appropriate
Upper quartile:
Fail
Note:
For household retail materiality is defined as being 2.25% of household retail opex plus depreciation over 2015-20.
Table A4.5 Household retail adjustments (£ million, nominal prices)
2015-16 2016-17 2017-18 2018-19 2019-20 Total
Adjustments included in final determination
Doubtful Debt 8.597 8.168 7.759 7.371 7.002 38.898
Debt management
1.300 1.235 1.173 1.115 1.059 5.881
input price pressure
0.000 0.000 0.000 0.000 0.000 0.000
Pension deficit repair costs
0.105 0.105 0.105 0.105 0.105 0.524
Adjustments included in final determination
10.002 9.508 9.037 8.590 8.166 45.303
A4.3.3 New costs
Dŵr Cymru did not propose material household retail new costs.
Table A4.6 New household retail costs (£/customer)
Value
Modification made to 2013-14 cost to serve for ACTS calculation 0.00
Note: There will be no automatic indexation for retail price controls to RPI.

Final price control determination notice: company-specific appendix – Dŵr Cymru
56
A4.4 Calculating the allowed revenues
As set out in policy chapter A5, total allowed household retail revenues are
calculated taking account of our assessment of the cost to serve per customer (after
the impact of our efficiency challenge), the projected customer numbers in the
company’s revised business plan and the household retail net margin.
The company proposed net margins of 1%. This is in line with our risk and reward
guidance and our further consideration of margins following representations on draft
determinations. We have therefore accepted the company’s proposals.
The table below shows the household retail net margin over 2015-20.
Table A4.7 Household retail net margins (%)
2015-16 2016-17 2017-18 2018-19 2019-20
Household retail net margin 1.0% 1.0% 1.0% 1.0% 1.0%
Table A4.8 below sets out the components of the allowed household retail revenue.
Table A4.8 Components of the allowed household retail revenue (nominal prices)
2013-14 2015-16 2016-17 2017-18 2018-19 2019-20
Company cost to serve (£/customer)
Unmetered single
service customers
24.4
Unmetered water and
wastewater
customers
31.8
Metered water only
customers
32.8
Metered wastewater
only customers
32.8
Metered water and
wastewater
customers
40.1
Industry ACTS (£/customer)

Final price control determination notice: company-specific appendix – Dŵr Cymru
57
2013-14 2015-16 2016-17 2017-18 2018-19 2019-20
Unmetered single
service customers
21.47
Unmetered water and
wastewater
customers
27.91
Metered water only
customers
27.26
Metered wastewater
only customers
25.54
Metered water and
wastewater
customers
34.26
Allowed cost to serve1 (£/customer)
Unmetered single
service customers
27.5 26.5 25.6 24.6 24.3
Unmetered water and
wastewater
customers
35.7 34.4 33.2 32.0 31.6
Metered water only
customers
35.1 33.5 32.0 30.4 30.1
Metered wastewater
only customers
34.7 32.7 30.7 28.7 28.4
Metered water and
wastewater
customers
43.4 41.7 40.1 38.3 37.9
Total allowed (£m)
Cost to serve
(excluding net
margin)
51.4 49.8 48.3 46.7 46.6
Forecast household
wholesale charge
(including forecast
RPI2)3
562.7 577.9 593.4 608.4 625.1
Household retail 57.0 55.6 54.3 52.8 52.8

Final price control determination notice: company-specific appendix – Dŵr Cymru
58
2013-14 2015-16 2016-17 2017-18 2018-19 2019-20
revenue (including an
allowance for the net
margin)4
Notes: There will be no automatic indexation for retail price controls to RPI. 1. Allowed cost to serve includes pension deficit repair costs. 2. The household wholesale charge includes forecast RPI so that the total household retail revenue can be displayed on the same price base as other retail costs. 3. The allocation of allowed wholesale revenue to different wholesale charges will be at the company’s discretion, subject to charging rules and licence conditions, however, our assumed allocation of wholesale revenue is binding for the purposes of determining the allowance for the net margin which is one component of allowed household retail revenue. 4. This number is indicative as allowed revenue will depend upon actual customer numbers.
A4.5 Uncertainty mechanisms
We outline our approach to uncertainty mechanisms in policy chapter A7.
Dŵr Cymru did not propose any household retail uncertainty mechanisms beyond
those that will already form part of the regulatory framework for 2015-20.
Final price control determination notice: company-specific appendix – Dŵr Cymru
59
A5 Non-household retail
In ‘Policy chapter A6 – non-household retail costs and revenues’ (‘policy chapter
A6’), we outline our overall approach to the non-household retail price control.
In this chapter, we provide details of Dŵr Cymru’s non-household retail price control.
In line with Welsh Government policy, non-household customers of companies
operating wholly or mainly in Wales using less than 50 mega-litres (Ml) of water per
year are not expected to be able to choose their supplier during the next five years.
As such, we have taken a different approach to companies operating wholly or
mainly in Wales to protect non-household customers. This includes setting a specific
efficiency challenge and a non-household SIM that applies to Dŵr Cymru.
A5.1 Consideration of representations on our draft
determinations
In policy chapter A1, we provide a list of the respondents to the draft determinations
published in April, May and August of this year. We have fully considered all of the
responses received, and where appropriate, we have made either consequential
adjustments to our industry-wide approach or company-specific interventions.
Our general policies relevant to the non-household control are set out in policy
chapter A6. This includes our responses to representations on sector-wide issues.
Table A5.1 lists the representations we have received that are specific to Dŵr
Cymru’s non-household retail control and sets out where to find more information on
our responses in this document.
We did not formally make our draft determination of Dŵr Cymru’s non-household
control until August. We therefore received the representations on this element of its
draft determination in October, at the same time as all other companies. These
included representations on the form of the non-household control, an issue we
invited views on after we made our May draft determination.

Final price control determination notice: company-specific appendix – Dŵr Cymru
60
Table A5.1 Representations specific to the non-household retail control of Dŵr
Cymru
Area Company-specific
representations
Detailed commentary in
this company-specific
appendix
Net margins Dŵr Cymru Section A5.3
Cost proposals Dŵr Cymru Section A5.4
Form of control Dŵr Cymru
CCG
Section A5.5
A5.2 Indicative non-household retail total revenue
Table A5.2 below shows the indicative total of non-household allowed revenue. The
table is indicative, as it does not assume any gains or losses from competition (for
those customers using above 50Ml a year) or impacts from the company charging
customers at levels different to the relevant default tariffs for the projected customers
in each customer type. Furthermore, the controls for each customer type that we
have set will only apply for two years; there will be a review in 2016. Years 2017-18
to 2019-20 below are shown for illustrative purposes only.
Table A5.2 Indicative non-household retail total revenue price control including
net margins (£ million, nominal prices)
2015-16 2016-17 2017-18 2018-19 2019-20
Indicative non-household
retail total revenue price
control including net margins
9.6 9.1 8.7 8.3 8.3
Note: There will be no automatic indexation for retail price controls to RPI. The non-household wholesale charge includes forecast RPI so that the total non-household retail revenue can be displayed in the same price base as other retail costs. Figures exclude retail services to developers and revenues associated with miscellaneous charges.
A5.3 Net margins
The company proposed net margins that aggregated to 2.5% for contestable
customers, and 1.0% for non-contestable customers. However, as part of its

Final price control determination notice: company-specific appendix – Dŵr Cymru
61
representations, the company reviewed net margin and cost allocation approaches
between customer types and proposed new allocations.
The new allocations (when combined) resulted in significant increases in the
revenues proposed to be recovered from the company’s non-contestable customers,
and decreases for its contestable customers.
We queried the company whether:
the change in allocations were discussed with, and assured or signed-off by,
the company’s Board;
any external assurance had been gained on the changes in allocations; and
the company had engaged with its customers regarding the change.
The company confirmed that its Board had approved its representation letter, and
that a ‘near-final’ version of the letter had been sent to its CCG members. However,
the representation letter makes no specific reference to the significant proposed
increases for non-contestable customers.
With regard to the cost allocations, the company confirmed that PwC had reviewed
the allocation of costs between households and non-households. However, the issue
in question is the allocation between different non-household customer types.
Also in its response to our query, the company also highlighted that it had identified
an error in its new allocations.
Given the large increase in proposed revenue to be recovered from non-contestable
customers, without adequate assurance, we have not accepted the company’s
updated allocations. We have therefore used the net margins the company proposed
as part of its revised business plan in the final determination.
A5.4 Cost proposals
As stated above, the company proposed updated cost allocations between non-
household customer types and we did not accept this update. As set out in section
A4.3.1, the company has reallocated some costs from household retail to non-
household retail. We have accepted this reallocation and taken account of it by
adjusting the costs to be recovered from the average revenue controls equivalently
across the company’s different non-household customer types, rather than using the
company’s proposed updated allocations.

Final price control determination notice: company-specific appendix – Dŵr Cymru
62
As set out in the policy chapter A6, we have adjusted companies’ costs to align to
the 2013-14 base year. Historical costs are therefore presented in 2013-14 prices,
and all future costs and revenues in nominal prices. All cost figures (unless
otherwise specified) are five-year totals. As set out in policy chapter A6, we expect
our decisions on the total level of non-household retail costs now will still apply for
years 2017-18 to 2019-20 – the 2016 review will focus on the allocations between
different non-household customer types.
In IN 13/17: ‘Treatment of companies’ pension deficit repair costs at the 2014 price
review’ we explained how we would treat the costs associated with water companies
reducing the deficits in their defined benefit pension schemes at the 2014 price
review. Where companies’ proposals have differed from our calculations we have
over-written their proposals in line with our overall approach. This resulted in the
company’s proposals being adjusted from £0.052 million over the control period, to
£0.084 million.
In total, this resulted in the company’s proposed costs being adjusted from £38.266
million over the control period to £38.297 million (pre-efficiency challenge).
A5.5 Efficiency challenge
In our final methodology statement, we confirmed that we would set an up-front non-
household efficiency challenge for companies operating wholly or mainly in Wales,
by comparing their cost allocations for given customer types with equivalent costs in
England.
In setting the benchmark for the company, we have compared costs across the
industry for five different customer types:
water unmeasured;
water measured (<50 Ml);
sewerage unmeasured;
sewerage measured; and
trade effluent.
The implied efficiency challenge from each customer type is weighted by the number
of customers the company has by each customer type to arrive at the overall
efficiency challenge.
In our draft determination, this implied an efficiency challenge for Dŵr Cymru of less
than its own proposed forecast. We therefore chose not to apply the efficiency

Final price control determination notice: company-specific appendix – Dŵr Cymru
63
challenge, instead accepting the company’s proposals as it offered a better outcome
for customers.
As part of its representations, the company provided us with updated cost allocations
between household and non-household retail – our assessment of this allocation is
set out in section 4.3.1. In total, this increased the amount of costs allocated to non-
household retail by £8.571 million.
This makes the company look less efficient for non-household retail than its previous
submission. Applying the same methodology as we did for the draft determination
results in a cost challenge of 24% by 2018-19 (from pre-efficient 2015-16 levels).
This is comparable to the size of the efficiency challenge applied to the company’s
household retail costs. The company did not provide any representations on our
methodology for applying the non-household retail efficiency challenge.
Like the household control, we are applying a three-year glide-path to efficiencies,
with the efficient level of spend only needing to be fully reached by 2018-19. In total,
our adjustments and efficiency challenge resulted in the company’s proposed costs
being adjusted from £38.266 million over the control period to £33.682 million.
A5.6 Form of control
Our final determination on the form of control is set out in policy chapter A6. In that
document we confirm the basic form of control set out in our final methodology
statement, but with a two-year initial duration and with a review carried out in 2016.
A5.7 Average revenue controls
The allowed average retail cost component (£) and the allowed net margin (%) for
each customer type are shown in the table below for Dŵr Cymru.
The average retail revenue per customer – £ (r) – has also been shown. For the
avoidance of doubt, it is the average cost component and the allowed net margin
that make up the non-household retail control. The average retail revenue per
customer is shown only to help comparisons to be drawn.
Table A5.3 Non-household retail average controls per customer
Customer type Units 2015-16 2016-17 2017-18 2018-19 2019-20

Final price control determination notice: company-specific appendix – Dŵr Cymru
64
Customer type Units 2015-16 2016-17 2017-18 2018-19 2019-20
Raw Water < 50Ml
(Measured)
£ 34.09 31.82 29.55 27.27 27.27
% 1.0% 1.0% 1.0% 1.0% 1.0%
£ (r) 40.63 38.83 36.76 34.71 34.96
Partially Treated
Water < 50Ml
(Measured)
£ 46.90 43.77 40.64 37.51 37.51
% 1.0% 1.0% 1.0% 1.0% 1.0%
£ (r) 60.12 57.65 54.95 52.30 52.79
Potable Water < 50Ml
(Non-household)
£ 40.01 37.36 34.71 32.06 32.07
% 1.0% 1.0% 1.0% 1.0% 1.0%
£ (r) 46.38 43.81 41.30 38.77 38.89
Potable Water < 50Ml
(Non-household)
£ 19.69 18.84 17.94 16.98 17.41
% 1.0% 1.0% 1.0% 1.0% 1.0%
£ (r) 22.61 21.86 21.04 20.15 20.67
Raw Treated Water >
50Ml (Measured)
£ 9,781.01 9,495.94 9,323.54 9,332.97 9,219.78
% 2.5% 2.5% 2.5% 2.5% 2.5%
£ (r) 21,476.20 21,402.84 21,561.71 21,890.49 22,018.80
Partial Water > 50Ml
(Measured)
£ 14,500.81 14,076.12 13,819.28 13,828.98 13,655.83
% 2.5% 2.5% 2.5% 2.5% 2.5%
£ (r) 31,875.22 31,760.10 31,992.26 32,470.36 32,647.16
Water Large User
50Ml-99Ml
(Measured)
£ 2,372.71 2,303.30 2,262.43 2,260.42 2,233.54
% 2.5% 2.5% 2.5% 2.5% 2.5%
£ (r) 4,907.19 4,880.32 4,910.82 4,975.88 4,994.17
Water Large User
100Ml-249Ml
(Measured)
£ 3,318.69 3,220.82 3,163.44 3,162.40 3,122.10
% 2.5% 2.5% 2.5% 2.5% 2.5%
£ (r) 7,019.35 6,984.08 7,031.29 7,128.63 7,154.82
Water Large User
250Ml-499Ml
(Measured)
£ 6,710.59 6,511.43 6,393.84 6,395.86 6,310.59
% 2.5% 2.5% 2.5% 2.5% 2.5%
£ (r) 14,518.58 14,458.30 14,564.12 14,779.48 14,845.03

Final price control determination notice: company-specific appendix – Dŵr Cymru
65
Customer type Units 2015-16 2016-17 2017-18 2018-19 2019-20
Water Large User
500Ml-1000Ml
(Measured)
£ 10,415.45 10,124.37 9,947.68 9,969.36 9,868.02
% 2.5% 2.5% 2.5% 2.5% 2.5%
£ (r) 22,522.16 22,462.27 22,636.58 23,003.78 23,174.69
Water Large User
>1000 (Measured)
£ 18,694.04 18,161.03 17,838.57 17,871.61 17,672.52
% 2.5% 2.5% 2.5% 2.5% 2.5%
£ (r) 40,930.86 40,814.80 41,132.26 41,789.99 42,075.67
Special Agreement
Register – Customer
Reference
WSHNONPOT8
£ 1,638.46 1,596.19 1,569.26 1,568.56 1,553.97
% 2.5% 2.5% 2.5% 2.5% 2.5%
£ (r) 3,297.44 3,288.35 3,309.18 3,353.62 3,372.17
Special Agreement
Register – Customer
Reference
WSHNONPOT9
£ 37,728.58 36,690.27 36,035.73 36,073.67 35,599.45
% 2.5% 2.5% 2.5% 2.5% 2.5%
£ (r) 83,573.11 83,454.13 84,121.38 85,409.10 85,848.93
Special Agreement
Register – Customer
Reference
WSHPOT1
£ 1,526.05 1,489.59 1,465.76 1,467.44 1,452.68
% 2.5% 2.5% 2.5% 2.5% 2.5%
£ (r) 3,102.02 3,098.76 3,120.84 3,165.69 3,182.31
Sewerage Measured
<100Ml
£ 41.94 39.17 36.39 33.62 33.64
% 1.0% 1.0% 1.0% 1.0% 1.0%
£ (r) 50.70 48.11 45.53 42.93 43.13
Sewerage Un-
Measured <100Ml
£ 18.29 17.54 16.72 15.85 16.28
% 1.0% 1.0% 1.0% 1.0% 1.0%
£ (r) 22.26 21.60 20.89 20.10 20.64
Sewerage Measured
>100Ml
£ 4,524.86 4,223.04 3,921.21 3,619.39 3,619.39
% 1.0% 1.0% 1.0% 1.0% 1.0%
£ (r) 7,247.29 7,012.47 6,776.40 6,539.67 6,596.32
Sewerage Trade
Effluent <100Ml
£ 207.83 193.96 180.10 166.24 166.24
% 1.0% 1.0% 1.0% 1.0% 1.0%
£ (r) 323.05 311.57 300.18 288.62 290.40

Final price control determination notice: company-specific appendix – Dŵr Cymru
66
Customer type Units 2015-16 2016-17 2017-18 2018-19 2019-20
Sewerage Trade
Effluent >100Ml
£ 3,989.72 3,723.59 3,457.47 3,191.34 3,191.34
% 1.0% 1.0% 1.0% 1.0% 1.0%
£ (r) 6,392.58 6,176.41 5,962.32 5,744.36 5,781.58
Outfall Tariff £ 1,405.29 1,311.55 1,217.81 1,124.08 1,124.08
% 1.0% 1.0% 1.0% 1.0% 1.0%
£ (r) 2,169.09 2,091.12 2,013.79 1,935.25 1,947.05
A5.8 Company outcomes, performance commitments and
delivery incentives
In policy chapter A2, we discuss our approach to outcomes.
We summarise the outcomes, performance commitments and ODIs for the non-
household retail control for Dŵr Cymru in table A5.4 below. This includes the non-
household SIM (Wales) that applies to companies operating wholly or mainly in
Wales, such as Dŵr Cymru. This additional protection is being put in place as the
scope for retail competition in Wales is more limited than in England, and so some of
these customers will not benefit directly from the protection afforded by competition.
Our assessment of the specific performance commitments proposed by the company
for non-household retail has focused on a company specific assessment to ensure
that the performance proposed by each company is challenging, appropriately
incentivised and supported by customer engagement.
For some performance commitments and incentives types, we have intervened to
change the underlying performance level or incentives. Where we have intervened
we have done so to ensure that companies are subject to effective incentives that
protect customers against under-delivery and where merited, reward companies for
outperformance. We summarise any interventions in table A5.4.
Full detail of the non-household retail outcomes, performance commitments and
incentives, and our consideration of relevant representations, is provided in annex 4.

Final price control determination notice: company-specific appendix – Dŵr Cymru
67
Table A5.4 Non-household retail outcomes, performance commitments and
incentives
Company proposal Intervention
Outcome Performance
commitment
Incentive type
Best in class
customer service
SIM1 Financial – reward
and penalty
No intervention
Business customer
satisfaction
Financial – penalty
only
Company specific
assessment: We
confirm our draft
determination
intervention to
replace the one off
penalty with a
graduated one.
Earning the trust of
customers – % of
customers surveyed
that say they trust
the company
Reputational No intervention
Affordable prices Affordable bills –
annual increase
Reputational No intervention
Note:
1 We have required Dŵr Cymru to include a performance commitment based on the non-household (SIM).

Final price control determination notice: company-specific appendix – Dŵr Cymru
68
A6 Appointee financeability and affordability
In this section we discuss at an appointee level:
bills and K factors;
return on regulatory equity;
financeability; and
affordability.
However, we first consider the responses to our draft determinations that are specific
to Dŵr Cymru in these areas below.
A6.1 Consideration of representations on our draft
determinations
In policy chapter A1, we provide a list of the respondents to the draft determinations
published in April, May and August of this year. We have fully considered all of the
responses received, and where appropriate, we have made either consequential
adjustments to our industry-wide approach or company-specific interventions.
Our general policies relevant at appointee level are set out in the following policy
chapters that accompany our final determination. These include our responses to
representations on sector-wide issues.
Policy chapter A7.
Policy chapter A8.
Table A6.1 lists the representations we have received that are specific to Dŵr Cymru
at an appointee level and sets out where to find more information on our responses
in this document.

Final price control determination notice: company-specific appendix – Dŵr Cymru
69
Table A6.1 Representations specific to issues at an appointee level for Dŵr Cymru
Area Company-specific
representations
Detailed commentary in this
company-specific appendix
Bills and K factors None Section A6.2
Appointee level
uncertainty and
gain share
mechanisms
CCWater Section A6.3
Return on
regulatory equity
range
None Section A6.4
Financeability Dŵr Cymru Section A6.5
Affordability CCWater Section A6.6
Financial modelling Dŵr Cymru Section A6.7
A6.2 Bills and K factors
Table A6. below sets out the allowed revenues we have assumed in our final
determination for Dŵr Cymru to deliver for its customers on its:
statutory duties; and
associated performance commitments.
It also sets out the average customer bills on the basis of the final determination.
Table A6.2 Dŵr Cymru’s final determination – K factors, allowed revenues and
customer bills1
2015-16 2016-17 2017-18 2018-19 2019-20 Total
Wholesale
water –
allowed
revenues
(£m)2
263.0 263.6 264.2 264.8 265.4 1,321.1
Wholesale
water – 0.0% 0.8% 0.3% 0.0% 0.0% -

Final price control determination notice: company-specific appendix – Dŵr Cymru
70
2015-16 2016-17 2017-18 2018-19 2019-20 Total
K (%)
Wholesale
wastewater
– allowed
revenues
(£m)2
354.9 352.3 349.8 347.3 344.7 1,749.0
Wholesale
wastewater
– K (%)
0.0% -0.1% -0.6% -0.9% -0.9% -
Retail
household
allowed
revenue
(£m)
57.0 55.6 54.3 52.8 52.8 272.6
Retail non-
household
expected
revenue
(£m)
9.6 9.1 8.7 8.3 8.3 44.1
Average
household
bill – water
(£)
181 180 179 177 177 -
Average
household
bill –
wastewater
(£)
253 250 246 243 240 -
Average
household
bill –
combined
(£)3, 4
411 407 403 399 396 -
Notes: 1. Wholesale figures in 2012-13 prices as revenue will be affected by inflation and retail figures in nominal prices as revenue will not be affected by inflation. 2. The allowed revenue for our final determination is based on an implied menu choice. The company will have the opportunity to make its own menu choice, which will impact on its allowed revenues and customers’ bills from 2020. Customer bills in the regulatory period from 2020 will also be affected by Dŵr Cymru’s performance in the forthcoming regulatory period in relation to costs and the regulatory incentives in place for performance delivery and revenue projection performance.
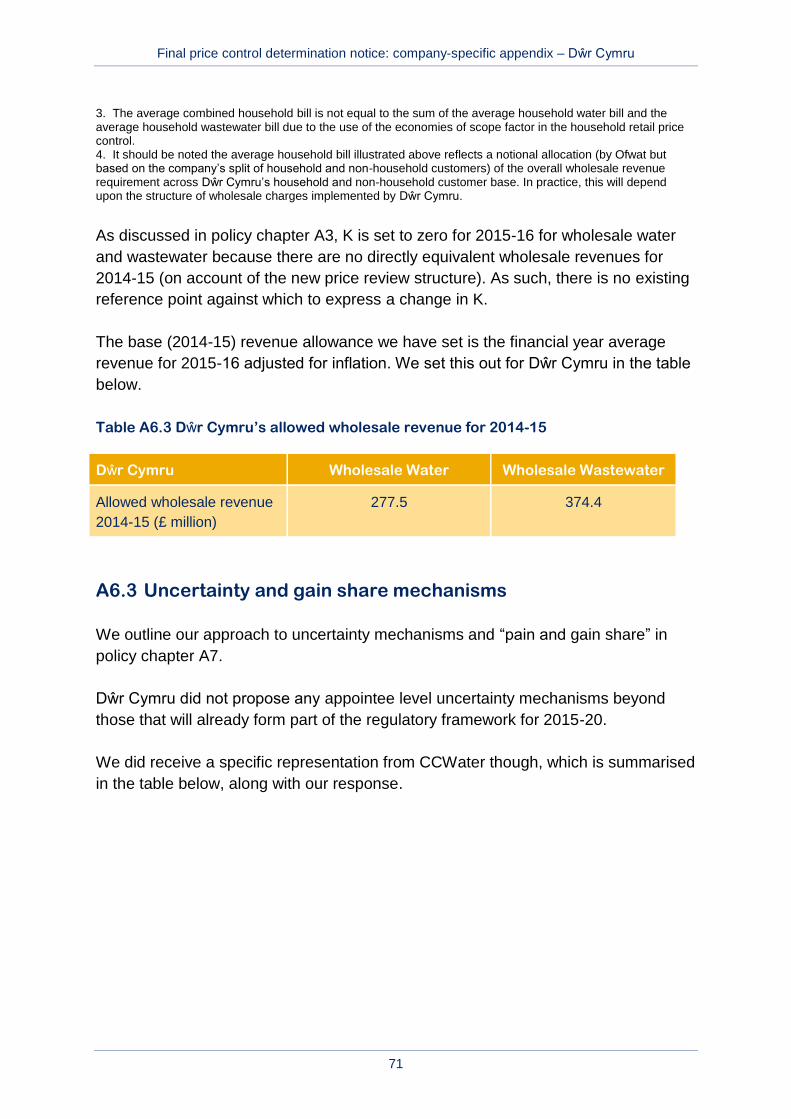
Final price control determination notice: company-specific appendix – Dŵr Cymru
71
3. The average combined household bill is not equal to the sum of the average household water bill and the average household wastewater bill due to the use of the economies of scope factor in the household retail price control. 4. It should be noted the average household bill illustrated above reflects a notional allocation (by Ofwat but based on the company’s split of household and non-household customers) of the overall wholesale revenue requirement across Dŵr Cymru’s household and non-household customer base. In practice, this will depend upon the structure of wholesale charges implemented by Dŵr Cymru.
As discussed in policy chapter A3, K is set to zero for 2015-16 for wholesale water
and wastewater because there are no directly equivalent wholesale revenues for
2014-15 (on account of the new price review structure). As such, there is no existing
reference point against which to express a change in K.
The base (2014-15) revenue allowance we have set is the financial year average
revenue for 2015-16 adjusted for inflation. We set this out for Dŵr Cymru in the table
below.
Table A6.3 Dŵr Cymru’s allowed wholesale revenue for 2014-15
Dŵr Cymru Wholesale Water Wholesale Wastewater
Allowed wholesale revenue
2014-15 (£ million)
277.5 374.4
A6.3 Uncertainty and gain share mechanisms
We outline our approach to uncertainty mechanisms and “pain and gain share” in
policy chapter A7.
Dŵr Cymru did not propose any appointee level uncertainty mechanisms beyond
those that will already form part of the regulatory framework for 2015-20.
We did receive a specific representation from CCWater though, which is summarised
in the table below, along with our response.

Final price control determination notice: company-specific appendix – Dŵr Cymru
72
Table A6.4 Representations specific to the appointee uncertainty and gain share
mechanisms for Dŵr Cymru
Respondent Summary of comment Ofwat response
CCWater CCWater considered the ownership
model of Dŵr Cymru allowed for gain
sharing with customers.
Ofwat recognises that the ownership
structure of Dŵr Cymru can facilitate
gain sharing with customers. It is
also the case that other ownership
structures provide these
opportunities.
A6.4 Return on regulatory equity range
Dŵr Cymru has estimated the range of returns on regulatory equity (RoRE) that it
could earn dependent on its performance and external risk factors over the price
control period. The RoRE range reflects the company’s views and is based on an
efficient company with the notional capital structure3. We have identified the RoRE
impact separately for outcome delivery incentives (ODIs), total expenditure (totex)
performance, financing and the service incentive mechanism (SIM). We note that
Dŵr Cymru’s actual returns may differ from notional returns due to differences
between notional and actual capital structure and notional and actual cost of debt
and level of cost efficiency compared to allowed totex and household retail average
cost to serve.
Table A6.5 Whole company RoRE range
Lower bound (%)
– appointee
Upper bound (%)
– appointee
Overall -4.2% +2.7%
ODIs -1.4% +0.5%
Totex -1.9% +1.5%
Financing -0.7% +0.7%
SIM -0.2% +0.1%
3 The notional capital structure is the capital structure that reflects Ofwat’s assumption of an
appropriate level of gearing to use in determining the allowed weighted average cost of capital (WACC).

Final price control determination notice: company-specific appendix – Dŵr Cymru
73
Lower bound (%)
– appointee
Upper bound (%)
– appointee
Commentary:
The whole company RoRE range is from 1.4% to 8.4%, with a base case of 5.6% and
overall impacts from -4.2% to +2.7%.
The totex risk range from -1.9% to +1.5% is marginally wider than the range in the draft
determination of -1.8% to +1.4% to reflect the final position on uncertainty mechanisms. The
overall impacts are broadly in line with other companies.
The ODI risk range proposed by Dŵr Cymru in response to the draft determination was from
-2.4% to +0.4%. This is wider than the -1.5% to +0.2% in the draft determination and reflects
the company’s representations, particularly on customer acceptability of drinking water and
supply interruptions. We have adjusted this to -1.4% to +0.5% to take account of the
interventions discussed in annex 4. The adjustment includes the effect of capping, which
affects the downside case of the water element (which limits the downside on water ODIs
from 3.5% to 2%). This limits the overall appointee ODI impact to -1.4% (prior to capping the
overall ODI range is -1.9% to +0.5%).
Financing risk impacts from -0.7% to +0.7% are unchanged from the draft determination.
The SIM risk range of -0.2% to +0.1% is also unchanged from the draft determination.
The composition of the RoRE range for Dŵr Cymru at an appointee level is shown in
Figure A6.1 below.

Final price control determination notice: company-specific appendix – Dŵr Cymru
74
Figure A6.1 Dŵr Cymru’s RoRE range – appointee
Source: Our calculations based on information from Dŵr Cymru
Note: Numbers presented based on calibration of the ODIs against an assumed menu choice of a 50% sharing factor
A6.5 Financeability
Ofwat has a statutory duty to secure that a company is able to finance the proper
carrying out of its functions. We interpret this financing duty as requiring that we
ensure that an efficient company with a notional capital structure is able to finance its
functions. A company’s actual capital structure is a choice for the company and it
bears the risk associated with its choices. An efficient company is assumed to be
able to deliver its plans based on the expenditure allowance in our final
determination.
We set out our approach to assessing financeability in policy chapter A8. Consistent
with our PR14 methodology, we have asked companies to provide board assurance
on their financeability and to set out their target credit ratings and financial ratios for
the notional company. As part of our assessment, we consider the evidence of
0.7%
1.9%
0.2%
1.4%
0.5%0.1%
1.5%
0.7%
Base case5.6%
0.0%
1.0%
2.0%
3.0%
4.0%
5.0%
6.0%
7.0%
8.0%
9.0%
Final Determination
RoRE range - whole company
FinancingoutperformanceTotex outperformance
SIM outperformance
ODI outperformance
ODI underperformance
SIM underperformance

Final price control determination notice: company-specific appendix – Dŵr Cymru
75
financeability provided by companies and model their business plan and our draft
and final determination financial ratios.
In table A6.6, we set out the notional financeability ratios associated with Dŵr
Cymru’s 2 May revised business plan, draft determination and final determination.
Table A6.6 Company and Ofwat financial ratio calculations based on the company
business plan and financial ratios based on our final determination
Financial ratios for
notional company
Financial ratio
calculations based on
the company business
plan (average 2015-20)
Financial ratio calculations
based on Ofwat calculations
(average 2015-20)
Company
calculation
Ofwat
calculation
Draft
determination
Final
determination
Cash interest cover (ICR) 2.74 2.50 2.49 2.54
Adjusted cash interest
cover ratio (ACICR) 1.76 1.57 1.57 1.59
Funds from
operations(FFO)/debt 7.87% 7.01% 7.00% 6.97%
Retained cash flow/debt 6.83% 4.44% 4.43% 4.41%
Gearing 60.49% 62.26% 62.30% 62.52%
Dividend cover (profit after
tax/dividends paid) 0.91 0.21 0.19 0.19
Regulatory equity/regulated
earnings for the regulated
company1
17.01 18.02 18.06 17.95
RCV/EBITDA 13.57 13.95 13.95 14.13
Commentary:
Dŵr Cymru holds a rating of A3/A and this is the target rating for the actual company over
the 2015-20 period. It is targeting an investment grade rating for the notional company. Dŵr
Cymru considered its revised business plan is financeable on both an actual and notional
basis.
We have estimated similar notional ratios as the company when adjusting for differing
assumptions under a notional structure for example, Dŵr Cymru has assumed a lower
dividend schedule, which results in reducing gearing, and assumed a higher level of index
linked debt than we assume for a notional company (45% compared to 33%). The dividend

Final price control determination notice: company-specific appendix – Dŵr Cymru
76
Financial ratios for
notional company
Financial ratio
calculations based on
the company business
plan (average 2015-20)
Financial ratio calculations
based on Ofwat calculations
(average 2015-20)
Company
calculation
Ofwat
calculation
Draft
determination
Final
determination
cover ratio is also affected by differences in operating profit calculations.
At draft determination we noted there were some differences between some of the financial
ratios for Dŵr Cymru based on the notional company compared with typical credit rating
thresholds. The adjusted interest cover ratio was consistent with stronger investment grade
ratios while the funds from operations (FFO)/debt ratio and interest cover ratio were weaker.
The ratios are broadly stable over the 2015-20 period.
Given the level of the FFO/Debt ratio, prior to publication of the draft determination, Dŵr
Cymru provided additional assurance that the plan was financeable on a notional basis. We
noted that, if required, the company has scope to use menu choices to increase the level of
revenue in period. We considered that the draft determination was financeable.
While we have reduced the cost of capital, the notional financial ratios are similar to those for
the draft determination, where Dŵr Cymru provided assurance that it was financeable.
Further the impact of the reduction of WACC on notional financeability is very small, as
evidenced by the change in ratios since draft determination and therefore we can still place
some weight on Dŵr Cymru assurance of financeability. We therefore consider that the final
determination is financeable.
In its representation, Dŵr Cymru considered that a further reduction in the cost of capital is
not justified and noted that any reduction would require its Board to revisit its views on
financeability. As we set out above, we consider that the company is financeable with the
reduction in the cost of capital given the very modest change in key financial ratios. We
would consider that the Board of Dŵr Cymru should consider financeability as part of its
decision on whether to accept the final determination.
Note:
1. The regulatory equity/regulatory earnings ratio is now defined on the basis of earnings after real interest and tax; previously, this has been defined on the basis of nominal interest for the early draft determinations. The use of real interest is more consistent with this measure as an economic measure of equity returns.
As explained in policy chapter A8, companies have been allowed to use new tools in
the form of PAYG rates (the proportion of totex recovered in the period 2015-20) and
RCV run-off rates (depreciation of the RCV). Both PAYG and RCV run-off rates can
be adjusted to change the proportion of costs recovered within the 2015-20 period
and the amount added to the RCV and recovered over a longer period.
Table A6.7 sets out the PAYG and RCV run-off rates which shows whether revenue
has been brought forward compared to the December plan and the impact that this
has on RCV growth and longer term affordability and financeability. The PAYG rate

Final price control determination notice: company-specific appendix – Dŵr Cymru
77
and RCV run-off rates have not changed since the company submitted its revised
plan in May.
Table A6.7 Impact of changes in cost recovery rates on RCV growth
PAYG rate RCV run-off RCV growth
(%) –
1 Apr 2015 to
31 Mar 2020
Company December plan 43.9% 5.2% 9.8%
Company May plan 63.3% 2.8% 6.8%
Draft determination 63.3% 2.8% 7.2%
Final determination 63.3% 2.8% 7.1%
A6.6 Affordability
We set out our approach to assessing affordability in policy chapter A8.
Table A6.8 sets out the change in household bill profile between the company’s
December and May business plans and the draft and final determination.
Table A6.8 Household bill profile
2014-15 2015-16 2016-17 2017-18 2018-19 2019-20
Company December
plan
419 415 411 407 403 399
Company May plan 419 411 409 403 397 393
Ofwat calculation for
May plan
416 413 411 407 403 400
Ofwat calculation for
draft determination –
pre-reprofiling
416 409 407 403 398 396
Ofwat calculations for
draft determination
416 409 407 403 398 396
Ofwat calculations
for final
determination
416 411 407 403 399 396

Final price control determination notice: company-specific appendix – Dŵr Cymru
78
Companies have not necessarily used the same method of calculating household
bills as Ofwat – for example, we have included economies of scope for household
retail when calculating combined water and sewerage bills. So the Ofwat calculations
are not directly comparable to the company plans (lines 1 and 2 of table A6.8).
The final determination leads to a reduction in bills in 2015-20. The company did not
make any representations on bill profiling. We have reprofiled to smooth bills,
consistent with the company’s plan.
The following text sets out the reasons why this final determination is assessed as
affordable. It describes key changes in relation to Dŵr Cymru’s December business
plan that we also assessed as affordable.
A6.6.1 Acceptability
Dŵr Cymru conducted customer research to support its original December 2013
business plan submission. Its research found 94% of customers supported a plan
that had an associated bill of £399 in 2019-20. It is reasonable to assume that the
proposed additional reduction of £6 put forward in the company’s resubmitted
business plan will remain acceptable to the majority of the company’s customers.
The company states that its revised plan means that the average household bill will
be £26 lower than in 2014-15 in real terms. We received one representation from a
third party on acceptability.
Table A6.9 Representations specific to Dŵr Cymru’s affordability measures
Respondent Summary of comment Ofwat response
CCWater1 CCWater conducted research on
the acceptability of the draft
determination to customers.
CCWater did not seek to produce
comparable results to the
company. The CCWater research
suggests 58% of customers find
the draft determination acceptable
after they have been provided with
information on bills, inflation and
what the water company will
deliver.
We note that the CCWater research
was not intended to be comparable. It
has produced a significant difference to
the research that the company
undertook on its revised business plan,
which was that 95% found the plan
acceptable. The company's plan was
been developed with input from its
CCG. The CCG's role was to help
ensure the business plan reflected the
views and priorities of customers. We
have reviewed the company’s
acceptability research, which included
reviewing the transparency and
accuracy of the bill and inflation

Final price control determination notice: company-specific appendix – Dŵr Cymru
79
Respondent Summary of comment Ofwat response
information. We consider that the
acceptability that the company reported
is sufficiently robust. We also consider
that the CCWater survey results
indicate the importance of continued
engagement with customers.
Note:
1. CCWater acceptability results sourced from final version of ‘Customers’ views on Ofwat’s draft determinations for process and service 2015-20’ October 2014.
A6.6.2 Identification of affordability issues and appropriate support measures
Dŵr Cymru has a comprehensive range of affordability measures in place, and
outlines in its business plan how it is proposing to both increase the coverage of
some these schemes and to introduce new initiatives. The key measures are
summarised in the following table:
Table A6.10 Key affordability measures
Measure Current coverage (no.
of customers)
Forecast
2019-20 coverage
WaterSure New 20,000
Water direct 11,400 8,900
Flexible payment plans Offered but not reported Offered but not reported
Debt advice – 3rd party 200 2,400
Win-win tariff (Welsh water assist) 38,200 Transitions to social tariff
Write-off scheme 3,300 6,000
Water efficiency advice/audits Available but not
reported
10,000
Social tariff New 80,000-100,000
Water collect – registered social landlord
discount
10,000 12,000
A6.6.3 Longer-term affordability
The company has explicitly considered future affordability in its consideration of
intergenerational equity issues arising from setting PAYG rates and RCV run off. The
company has not altered PAYG and RCV run off rates from its revised business
plan. Longer term, the company forecasts the maintenance of the average PAYG
rate and the RCV run off rate in 2020-25 as set out in its December business plan
submission.

Final price control determination notice: company-specific appendix – Dŵr Cymru
80
Consistent with our original assessment there is therefore sufficient and convincing
evidence that the company’s use of cost recovery tools will not adversely affect
current or future affordability. There are no changes to the rates in 2020-25 and the
company states there is no expectation that bills will need to rise in real terms in that
period.
A6.6.4 Longer-term affordability – ODIs
There is some evidence that the company’s proposals for maximum ODI rewards will
not have a negative impact on overall affordability in the longer term. Results of
customer research showed that a proposal for a real term price decrease of £5 for
‘High’ performance and £47 for ‘low’ performance against an alternative of a fixed
price decrease of £26 that did not vary with performance was supported by the
majority (57%) of customers. 31% preferred the option of a fixed decrease. The
company’s peer reviewer was supportive of the research and noted that the variable
option was supported for rational reasons.
Therefore, there is sufficient evidence that the company’s revised proposals on ODIs
will not have a significant impact on affordability in the longer term when taken in the
context of the downward pressure on bills from the reduction in the allowed return as
even ‘high’ performance result in real term bill reductions.
A6.7 Financial modelling
In response to company-specific representations, we have made some adjustments
to our financial model. The representations, and our response, are set out in table
A6.11.

Final price control determination notice: company-specific appendix – Dŵr Cymru
81
Table A6.11 Representations specific to Dŵr Cymru for financial modelling
Respondent Summary of comment Ofwat response
Dŵr Cymru After analysing our financial model,
the company considered that in the
draft determination:
capital income had been netted
off twice from the wholesale
revenue requirements due to the
company’s incorrect
interpretation of the business
plan tables (£24m impact over
2015-20);
wholesale water totex was
overstated by £1.5 million due to
an incorrect sign in the financial
model; and
the wholesale WACC in the
financial model was incorrectly
stated as 3.6975% instead of
3.70%.
We accept that Dŵr Cymru has
made an error in business table
submissions and have adjusted
accordingly.
We accept that water totex was
overstated as the model uses an
incorrect sign for netting off
capital income for 2015-16 and
have amended the model
accordingly.
Based on updated market
evidence we have reset the
wholesale WACC to 3.6%. The
model has been adjusted
accordingly

Final price control determination notice: company-specific appendix – Dŵr Cymru
82
Annex 1 Wholesale costs
Establishing final determination thresholds
Under our ‘equivalence of treatment’ principle the company could have been subject
to updates to our views on wholesale costs – though we note that we have not
changed our view of costs for the final determination.
Our approach to establishing final determination thresholds is outlined in policy
chapter A3.
In the tables below, we provide some information on the company-specific numbers
that support these calculations.
Further information about our assessment of each claim is set out in the populated
version of final determination cost threshold models.

Final price control determination notice: company-specific appendix – Dŵr Cymru
83
Table AA1.1 Movement from basic cost threshold to final determination threshold for wholesale water totex (£ million)
Basic cost
threshold
Policy additions1 Unmodelled costs
adjustment
Deep dives Final determination
threshold
Deep dives fully or
partially not added2
1,091.0 127.2 18.0 None 1,236.2 None
Notes: 1. See table AA1.2 below. 2. Deep dives are net of implicit allowances. A value of zero means deep dives are wholly covered by IAs.
Table AA1.2 Policy additions to the wholesale water basic cost threshold (£ million)
Business rates Pension deficit payments Third party costs Open market costs Net v gross adjustments Total
83.2 3.3 40.7 0.0 0.0 127.2
Table AA1.3 Comparison of company wholesale water totex with the final determination threshold and 2010-15 totex (£ million)
Plan1 Final determination threshold Gap2 2010-15 vs plan
1,240.2 1,236.2 4.0 -101.8
Note: 1. Where the company’s business plan total has been adjusted by the company as part of its representations on its draft determination, this is reflected here. 2. This gap will not equal the deep dives fully or partially not added in Table AA1.1 if the company’s claims for special treatment in the costs thresholds are not equal to the gap.

Final price control determination notice: company-specific appendix – Dŵr Cymru
84
Table AA1.4 Summary of wholesale water deep dive assessments (£ million)
Company proposal Assessment Final determination allowance
Claim Amount
sought
Implicit
allowance
Need Cost-benefit
analysis
Robust costs Assessment Amount
allowed
Deep dives
None - - - - - - -
Unmodelled cost
assessment1.
Making ecological
improvements at
abstractions
(Habitats Directive,
SSSI, BAPs)
32.2 2.8 Pass Pass Pass Partial Pass 9.8
Investment at two
WTWs to improve
final water quality at
Bryn Cowlyd, and
Tynywaun,
38.0 13.4 Pass Pass Pass Partial Pass 8.2
Note:
1. For the water service the unmodelled adjustment to the basic cost threshold is triangulated and is therefore one third of the amount allowed.

Final price control determination notice: company-specific appendix – Dŵr Cymru
85
Table AA1.5 Movement from basic cost threshold to final determination threshold for wholesale wastewater totex (£ million)
Basic cost
threshold
Policy
additions1
Unmodelled
costs
adjustment
Private sewage
pumping
stations
NEP5 Update to
private
sewer
model delta
Deep dive Final
determination
threshold
Deep dives
fully or
partially not
added
1210.7 58.8 12.8 22.7 65.0 0.3 None 1,370.3 14.9
Notes: 1. See Table AA1.6 below. 2. Deep dives are net of implicit allowances. A value of zero means deep dives are wholly covered by IAs.
Table AA1.6 Policy additions to the wholesale wastewater basic cost threshold (£ million)
Business rates Pension deficit payments Third party costs Open market costs Net v gross adjustments Total
56.7 2.1 0.0 0.0 0.0 58.8
Table AA1.7 Comparison of company wholesale wastewater totex with the final determination threshold and 2010-15 totex (£
million)
Plan1 Final determination threshold Gap2 2010-15 vs plan
1,329.0 1,370.3 -41.4 104.3

Final price control determination notice: company-specific appendix – Dŵr Cymru
86
Note: 1. Where the company’s business plan total has been adjusted by the company as part of its representations on its draft determination, this is reflected here. 2. This gap will not equal the deep dives fully or partially not added in Table AA1.5 if the company’s claims for special treatment in the costs thresholds are not equal to the gap.
Table AA1.8 Summary of wholesale wastewater deep dive assessments (£ million)
Company proposal Assessment Final determination allowance
Claim Amount
sought
Implicit
allowance
Need Cost-benefit
analysis
Robust costs Assessment Amount
allowed
Deep dives
NEP 5 65.0 0.0 Pass Pass Pass Pass 65.0
Private sewage
pumping stations
36.8 0.0 Fail Fail Fail Fail 22.71
Unmodelled cost
assessment
Llanelli/ Gowerton 24.9 18.2 Pass Pass Fail Fail 0.0
NEP –
Investigations
(S3011)
16.4 3.6 Pass - Pass Pass 12.8
NEP Conservation
Drivers (S3004)
13.7 5.5 Pass - Fail Fail 0.0
Note: 1.This is the Ofwat modelled allowance as per table AA1.5. There is no allowance for the company claim for additional private sewage pumping station expenditure.

Final price control determination notice: company-specific appendix – Dŵr Cymru
87
Annex 2 Household retail
Details on our assessment of proposed adjustments to the ACTS
Our approach to setting the industry ACTS is outlined in policy chapter A5.
Below we provide information on our assessment of the company-specific
adjustments to the ACTS.
Doubtful debt and debt management driven by deprivation and bill size
Doubtful debt – summary
In its revised business plan, Dŵr Cymru sought an adjustment for doubtful
debt and debt management costs driven by deprivation and bill size of £48.2
million over 2015-20, of which £42.0 million related to doubtful debt.
We accepted the company’s proposal for doubtful debt in the draft
determination, but at a lower value of £38.9m.
Our position is unchanged at final determination.
Doubtful debt – our final assessment
Materiality
The company’s proposed adjustment of £42.0 million is material when considered in
combination with debt management costs of £6.2 million, at 16.3% of household
retail operating expenditure plus depreciation over 2015-20 – this materiality figure
includes the value of the proposed debt management costs adjustment.
Beyond efficient management control
As we concluded at draft determination, it is still the case that Dŵr Cymru provided
sufficient and convincing evidence of its management practices in relation to doubtful
debt and that these were in line with a qualitative review of good practice in the
management of bad debt costs. We therefore consider these costs to be beyond
efficient management control.
Impact company in materially different way
Final price control determination notice: company-specific appendix – Dŵr Cymru
88
In its revised business plan the company provided an econometric model4 as
evidence of the nature of the relationship between deprivation and doubtful debt and,
specifically, the scale of the impact of deprivation on doubtful debt compared with
other drivers of doubtful debt costs.
This resulted in a total adjustment value of £48.2 million over the period 2015-20, of
which £42.0 million related to doubtful debts and £6.2 million related to debt
management costs. No additional evidence was provided to support the value for the
adjustment for debt management costs and so this £6.2 million was not allowed in
the draft determination. Dŵr Cymru provided further evidence to support the debt
management part of its adjustment in its representation and this is considered in the
following section.
Our assessment of Dŵr Cymru’s evidence on its doubtful debt adjustment included
an independent review of the underlying econometric evidence for the requested
adjustment5. Our consultants replicated and reviewed Dŵr Cymru’s modelling
approaches to check their robustness and calculations. As a result of this additional
analysis, we asked Dŵr Cymru to address a number of specific queries and
statistical shortcomings that we had identified in relation to its econometric analysis.
This resulted in Dŵr Cymru undertaking some additional, alternative modelling
analysis to cross-check and verify the value of the proposed adjustment.
As a result of this additional analysis, we concluded that Dŵr Cymru’s alternative
modelling approach had addressed the queries and statistical shortcomings we
identified and that Dŵr Cymru had provided us with sufficient and convincing
evidence that it is impacted in a materially different way to other companies.
Our assessment for the final determination is unchanged from the draft
determination.
Value of proposed adjustment
The value of this adjustment we have accepted over the period 2015-20 is £38.9
million, compared to the £42.0 million (excluding debt management costs) that Dŵr
Cymru had sought in its resubmitted business plan. The £3.1 million difference
between the adjustment value of £42.0 million and the £38.9 million allowed is due to
4 ‘Impact on doubtful debt as a result of changes in deprivation and bill levels over 2015–20’ – figures
in this report are in 2010-11 constant prices not 2012-13 prices 5 ‘PwC review of Dŵr Cymru’s doubtful debt cost models’ – figures in this report are in 2010-11
constant prices not 2012-13 prices

Final price control determination notice: company-specific appendix – Dŵr Cymru
89
us accepting a value for the adjustment based on the updated modelling that Dŵr
Cymru submitted on 16 May 2014, after it submitted its revised business plan.
Debt management – summary
In its revised business plan, Dŵr Cymru sought an adjustment for debt
management of £6.2 million over 2015-20 as part of its broader adjustment for
costs driven by deprivation and bill size.
We did not accept the company’s proposal in the draft determination.
In our final determination, we have accepted the company’s proposed
adjustment, but at a lower value of £5.9 million. Our final assessment reflects
the provision of additional evidence as part of the company’s representation.
Debt management – our final assessment
Materiality
The company’s proposed adjustment of £6.2 million is material when considered in
conjunction with the doubtful debt adjustment, at 16.3% of household retail operating
expenditure plus depreciation over 2015-20.
Beyond efficient management control
As we concluded at draft determination, it is still the case that the evidence on
management practices for both doubtful debt and debt management is sufficiently
convincing. Combined with the new debt management model the company
submitted as part of its representation, the company has provided sufficient and
convincing evidence that these debt management costs are beyond efficient
management control.
Impact company in materially different way
Dŵr Cymru has the third highest debt management costs per customer (around 50%
above industry average). The company also has the third highest bills and the fourth
highest deprivation (Dŵr Cymru’s consultant’s measure). Dŵr Cymru’s new
econometric models, which use industry data and which it submitted as part of its
representation, provide sufficiently robust evidence that deprivation and average bills
affect its debt management costs in a materially different way to other companies.

Final price control determination notice: company-specific appendix – Dŵr Cymru
90
Value of proposed adjustment
We accept the company’s proposal for an ACTS adjustment for debt management
but with a reduced value of £5.9 million. Dŵr Cymru’s modelling supports the size of
the adjustment in the starting year, and it has also applied a significant efficiency
challenge to the adjustment of 5% nominal reduction per year. The reduction of £0.3
million is to correct for a modelling error where the smearing adjustment6 has not
been applied.
The modelling and efficiency evidence Dŵr Cymru has submitted on debt
management is of a similar quality to that which we accepted for its doubtful debt
adjustment.
Input price pressure – summary
In its revised business plan, Dŵr Cymru sought an adjustment for input price
pressure of £14.8 million over 2015-20.
We did not accept the company’s proposal in the draft determination.
Our position is unchanged for the final determination, and we have not
accepted the adjustment for final determination.
Input price pressure – our final assessment
Materiality
The company’s proposed adjustment of £14.8 million is material, at 5.2% of
household retail operating expenditure plus depreciation over 2015-20.
Beyond efficient management control
We do not consider that the evidence provided on management practices is
sufficient and convincing to demonstrate that future cost increases are outside of
efficient management control.
6 The smearing transformation is a mathematical adjustment applied to avoid bias when transforming
a logarithmic term to a numeric value.

Final price control determination notice: company-specific appendix – Dŵr Cymru
91
Impact company in materially different way
The company did not provide convincing evidence on relative efficiency, including
benchmarking. In addition, our assessment for ACTS shows that the company is not
upper quartile efficient for unmetered retail costs.
Therefore the company has not demonstrated that it is affected in a materially
different way to other companies as the company has not demonstrated that it is
efficient relative to other companies in the industry and could not absorb further input
price pressures through efficiency gains.
Value of proposed adjustment
As Dŵr Cymru has not justified an adjustment being made, we have not assessed
the justification for the value of the adjustment.
We considered three representations specific to the proposed ACTS adjustments,
which are set out in table AA2.1 below.
Table AA2.1 Representations specific to the household retail adjustments for Dŵr
Cymru
Respondent Summary of comment Ofwat response
Dŵr Cymru The company provided further evidence to
support its adjustment claim for debt
management costs driven by deprivation.
We have accepted the
company’s proposed
adjustment for debt
management costs but at a
reduced value – see above
for more details.
CCG The CCG considered that economic and
social factors were relevant to debt
management costs and the ACTS.
We have accepted the
company’s proposed
adjustment for debt
management costs at a
reduced value – see above
for more details.

Final price control determination notice: company-specific appendix – Dŵr Cymru
92
Respondent Summary of comment Ofwat response
CCWater CCWater questioned whether the doubtful
debt adjustment was justifiable.
We considered in our draft
determination that the
company has provided strong
evidence in this area and the
information submitted by
CCWater has not changed
this. – see above for more
details.
Table AA2.2 Household retail adjustments (£ million, nominal prices)
2015-16 2016-17 2017-18 2018-19 2019-20 Total
Adjustments proposed in Dŵr Cymru's May business plan
Doubtful Debt 9.285 8.821 8.380 7.961 7.563 42.010
Debt management
1.368 1.300 1.235 1.173 1.115 6.191
Input price pressure
2.958 2.958 2.958 2.958 2.958 14.792
Pension deficit repair costs
0.190 0.190 0.190 0.000 0.000 0.571
Adjustments included in business plan
13.802 13.270 12.764 12.093 11.636 63.564
Adjustments included in draft determination
Doubtful Debt 8.597 8.168 7.759 7.371 7.002 38.898
Debt management
0.000 0.000 0.000 0.000 0.000 0.000
Input price pressure
0.000 0.000 0.000 0.000 0.000 0.000
Pension deficit repair costs
0.105 0.105 0.105 0.105 0.105 0.524
Adjustments included in draft determination
8.702 8.273 7.864 7.476 7.107 39.422
Adjustments proposed in Dŵr Cymru's representations
Doubtful Debt 9.285 8.821 8.380 7.961 7.563 42.010
Debt management
1.368 1.300 1.235 1.173 1.115 6.191
input price pressure
2.958 2.958 2.958 2.958 2.958 14.790

Final price control determination notice: company-specific appendix – Dŵr Cymru
93
2015-16 2016-17 2017-18 2018-19 2019-20 Total
Pension deficit repair costs
0.190 0.190 0.190 0.000 0.000 0.571
Adjustments included in business plan
13.802 13.269 12.763 12.092 11.636 63.562
Adjustments included in final determination
Doubtful Debt 8.597 8.168 7.759 7.371 7.002 38.898
Debt management
1.300 1.235 1.173 1.115 1.059 5.881
input price pressure
0.000 0.000 0.000 0.000 0.000 0.000
Pension deficit repair costs
0.105 0.105 0.105 0.105 0.105 0.524
Adjustments included in final determination
10.002 9.508 9.037 8.590 8.166 45.303
Household retail revenue modification
We outline our approach to revenue modification in policy chapter A5.
Table AA2.3 sets out the amount per customer, by customer type, that allowed
revenues will be modified by if outturn customer numbers differ from forecast
customer numbers and table AA2.4 sets out the baseline number of customers.
Table AA2.3 Household retail allowed revenue modification factors by class of
customer (£/customer)
Revenue modification
per:
2015-16 2016-17 2017-18 2018-19 2019-20
Unmetered water only
customer 30.47 29.56 28.70 27.80 27.60
Unmetered wastewater
only customer 30.47 29.56 28.70 27.80 27.60
Unmetered water and
wastewater customer 39.61 38.42 37.31 36.14 35.88
Metered only water 38.98 37.44 35.92 34.34 34.17

Final price control determination notice: company-specific appendix – Dŵr Cymru
94
Revenue modification
per:
2015-16 2016-17 2017-18 2018-19 2019-20
customer
Metered wastewater only
customer 38.52 36.47 34.47 32.40 32.22
Metered water and
wastewater customer 48.13 46.54 44.99 43.31 42.97
Note: There will be no automatic indexation for retail price controls to RPI.
Table AA2.4 Assumed number of customers for household retail total revenues
(000s)
Number of customers 2015-16 2016-17 2017-18 2018-19 2019-20
Unmetered water only 53.2 52.8 52.4 52.0 51.6
Unmetered wastewater
only
58.3 57.9 57.5 57.1 56.7
Unmetered water and
wastewater
688.9 671.8 655.1 638.8 623.0
Metered water only 26.1 27.0 27.8 28.7 29.6
Metered wastewater only 67.2 68.0 68.9 69.7 70.6
Metered water and
wastewater
472.6 495.4 518.1 540.7 563.3

Final price control determination notice: company-specific appendix – Dŵr Cymru
95
Annex 3 Reconciling 2010-15 performance
When we last set price controls in 2009 (PR09), we included a number of incentive
mechanisms designed to encourage companies to improve and deliver services
more efficiently, and to manage uncertainty. Consistent with the approach set out at
the time of the final determinations in 2009 we have made adjustments at this price
review (PR14) to 2015 to 2020 revenues to take account of company performance in
the 2010 to 2015 period.
We set out our methodology for calculating the adjustments to 2015-20 wholesale
price controls resulting from the company’s actual performance during the 2010-15
period in policy chapter A4.
In this annex, we set out the final determination adjustments to 2015-20 price
controls for Dŵr Cymru resulting from the company’s actual performance during the
2010-15 period.
As part of the final determination of the 2010-15 adjustments we have undertaken
detailed calculations within our models for the RCM, OIA, CIS and serviceability
shortfalls. While we provide an explanation of our interventions within this annex,
each model contains the detail of the specific calculation.
We make a “midnight adjustment” to the closing RCV from the previous period
(ending on 31 March 2015) to obtain the opening RCV for the next period (starting
on 1 April 2015). Our detailed calculations are contained within the RCV midnight
adjustment model published alongside this final determination.
In this annex we provide an overview – comparing the company’s view of the
required revenue adjustments included in its revised business plan for each of the
incentive tools for water and wastewater services, with our own view. We then
consider each adjustment mechanism in turn.
However, we first consider the responses to Dŵr Cymru’s draft determination in
these areas.
Consideration of representations on our draft determinations
In policy chapter A1, we provide a list of the non-confidential respondents to the draft
determinations published in April, May and August of this year. We have fully
considered all of the responses received, and where appropriate, we have made

Final price control determination notice: company-specific appendix – Dŵr Cymru
96
either consequential adjustments to our industry-wide approach or company-specific
interventions.
Where representations have addressed issues that are common to a number of
companies, these comments, and any consequential changes to our approach, are
discussed in policy chapter A4. Representations that are specific to reconciling 2010-
15 performance for Dŵr Cymru, and any consequential impact on our final
determination, are summarised in the table below.
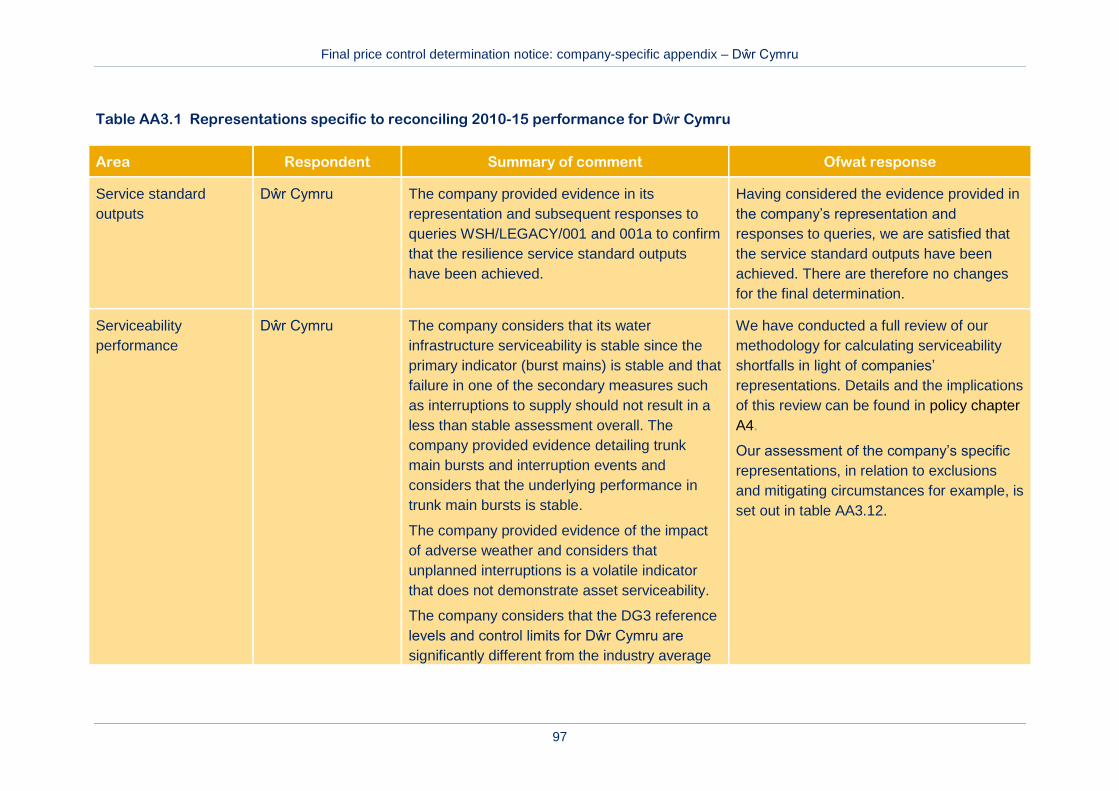
Final price control determination notice: company-specific appendix – Dŵr Cymru
97
Table AA3.1 Representations specific to reconciling 2010-15 performance for Dŵr Cymru
Area Respondent Summary of comment Ofwat response
Service standard
outputs
Dŵr Cymru The company provided evidence in its
representation and subsequent responses to
queries WSH/LEGACY/001 and 001a to confirm
that the resilience service standard outputs
have been achieved.
Having considered the evidence provided in
the company’s representation and
responses to queries, we are satisfied that
the service standard outputs have been
achieved. There are therefore no changes
for the final determination.
Serviceability
performance
Dŵr Cymru The company considers that its water
infrastructure serviceability is stable since the
primary indicator (burst mains) is stable and that
failure in one of the secondary measures such
as interruptions to supply should not result in a
less than stable assessment overall. The
company provided evidence detailing trunk
main bursts and interruption events and
considers that the underlying performance in
trunk main bursts is stable.
The company provided evidence of the impact
of adverse weather and considers that
unplanned interruptions is a volatile indicator
that does not demonstrate asset serviceability.
The company considers that the DG3 reference
levels and control limits for Dŵr Cymru are
significantly different from the industry average
We have conducted a full review of our
methodology for calculating serviceability
shortfalls in light of companies’
representations. Details and the implications
of this review can be found in policy chapter
A4.
Our assessment of the company’s specific
representations, in relation to exclusions
and mitigating circumstances for example, is
set out in table AA3.12.

Final price control determination notice: company-specific appendix – Dŵr Cymru
98
Area Respondent Summary of comment Ofwat response
and represent a more significant challenge to
the limits set for other companies.
The company explains there have been
reporting and performance difficulties
associated with the interruptions to supply
serviceability indicator and proposes a shortfall
of £7.5 million.
CIS There are no representations in this area. As explained in policy chapter A4, we have
corrected a minor error in the CIS model for
all companies with respect to the discount
rate used when calculating the future value
of the revenue adjustment in the 2010-15
period. This minor change had no material
impact of the final revenue adjustments.

Final price control determination notice: company-specific appendix – Dŵr Cymru
99
Area Respondent Summary of comment Ofwat response
Other adjustments Dŵr Cymru 2009-10 adjustment for actual expenditure in the opening RCV adjustment (water)
The company made a case for increasing the
2009-10 adjustment to the RCV for the capex
associated with cryptosporidium and THM
schemes.
2009-10 adjustment for actual expenditure in the opening RCV adjustment (wastewater)
The company does not believe there should be
a Current Cost Depreciation (CCD) adjustment
in the calculation. The company has not
amended the RCV feeder model. The company
states there is a £2 million understatement for
2010-15 anaerobic digestion maintenance
brought forward into 2009-10.
2009-10 adjustment for actual expenditure in the opening RCV adjustment (water)
We consider these specific schemes arose
due to inadequate maintenance. We do not
accept that any change should be made as
this would be a reopening of the PR09
determination.
2009-10 adjustment for actual expenditure in the opening RCV adjustment (wastewater)
The CCD adjustment is a continuation of the
previous approach to capex outperformance
and we do not accept that any change
should be made as this would be a
reopening of the PR09 determination.

Final price control determination notice: company-specific appendix – Dŵr Cymru
100
Summary of 2010-15 adjustments
All companies were required to consider in their business plans their own
adjustments for PR09 reconciliation. Table AA3.2 below sets out for each of the
incentive tools for water and wastewater services:
the company’s view of the required revenue adjustments included in its
revised business plan; and
our own view.
Our view reflects our understanding of the company’s performance using these
incentives, based on information provided in its revised business plan, subsequent
query responses and representations on our draft determinations. The table also
shows other adjustments, such as those relating to tax resulting from the company’s
actual performance during the 2010-15 period.
Table AA3.1 notes the comments that we have received that are specific to this
aspect of the wholesale water and wastewater controls of Dŵr Cymru and outlines
how our interventions have been influenced by our consideration of these responses.
The changes we have made in the final determination, compared to our draft
determination, are due to changes in our serviceability shortfall and CIS
methodologies, which we discuss in more detail in policy chapter A4.
Table AA3.2 Revenue adjustments 2015-20 (£ million)
Water service Wastewater service
Company
view
Ofwat view Company
view
Ofwat view
SIM 1.610 2.978 1.975 3.866
RCM 18.225 17.594 16.715 15.514
OIA 0.000 0.000 0.000 0.000
CIS -50.540 -51.344 -36.950 -37.223
Tax refinancing benefit
clawback 0.000 0.000 0.000 0.000
Other tax adjustments 0.000 0.000 0.000 0.000
Equity injection clawback 0.000 0.000 0.000 0.000

Final price control determination notice: company-specific appendix – Dŵr Cymru
101
Water service Wastewater service
Company
view
Ofwat view Company
view
Ofwat view
Other adjustments 0.000 0.000 0.000 0.000
Total wholesale legacy
adjustments -30.705 -30.772 -18.260 -17.842
Notes: For the CIS mechanism, there is a corresponding adjustment to the RCV made at 1 April 2015 (part of the ‘midnight’ adjustments’). The impact on the RCV for both water and wastewater can be seen in table AA3.16. This adjustment is net of any logging up, logging down or shortfalls. A full reconciliation showing all of the midnight adjustments to the RCV, including the impact of logging up, logging down and shortfalls, can be seen in table A2.6 and table A3.6. Totals may not add up due to rounding.
Adjustments by 2010-15 incentive mechanism
Service incentive mechanism
We provide our view of each company’s SIM reward/penalty in policy chapter A4.
Table AA3.3 provides the company’s view and our view of the annualised rewards or
penalties from the company’s SIM performance. These are unchanged from the draft
determination.
Table AA3.3 SIM annualised rewards (£ million)
2015-16 2016-17 2017-18 2018-19 2019-20 Total
Water Company
view
0.322 0.322 0.322 0.322 0.322 1.610
Ofwat view 0.596 0.596 0.596 0.596 0.596 2.978
Wastewater Company
view
0.395 0.395 0.395 0.395 0.395 1.975
Ofwat view 0.773 0.773 0.773 0.773 0.773 3.866
Table AA3.4 Interventions on proposed 2010-15 SIM adjustments
Area of
intervention
What we did Why we did it

Final price control determination notice: company-specific appendix – Dŵr Cymru
102
Area of
intervention
What we did Why we did it
Methodology Our final determination includes
our view of the company’s SIM
reward, which we have
calculated as 0.2%. The reward
is unchanged from the draft
determination.
To compare the company’s
actual SIM performance in 2011-
12, 2012-13 and 2013-14, to the
industry three-year average
performance during 2011-14.
The 2013-14 information was not
available at the time companies
submitted their business plans.
Revenue correction mechanism
We set out our view of the company’s RCM annualised adjustment amounts in table
AA3.5 below. Table AA3.6 summarises our interventions in relation to Dŵr Cymru’s
proposed RCM adjustments.
For the RCM, we apply the vanilla wholesale WACC (real; pre-tax cost of debt, post-
tax cost of equity) as the PR14 discount rate. For the final determination, the
updated PR14 discount rate is 3.6%. This explains the movement in the RCM from
the draft determination.
Table AA3.5 RCM annualised adjustments for 2015-20 (£ million)
2015-16 2016-17 2017-18 2018-19 2019-20 Total
Water Company
view 3.645 3.645 3.645 3.645 3.645 18.225
Ofwat
view 3.519 3.519 3.519 3.519 3.519 17.594
Wastewater Company
view 3.343 3.343 3.343 3.343 3.343 16.715
Ofwat
view 3.103 3.103 3.103 3.103 3.103 15.514

Final price control determination notice: company-specific appendix – Dŵr Cymru
103
Table AA3.6 Interventions on proposed 2010-15 RCM adjustments
Area of
intervention
What we did Why we did it
Revised RCM
business plan tables
There were anomalies between
the company’s resubmitted data
set, commentary and RCM
model. We applied the
company’s resubmitted May
2014 tables in our final
determination.
Following a query, the company
resubmitted these tables to
ensure alignment with its
populated RCM model. However,
the supporting commentary
“Section 2 of ‘SD5 – Further
Information on Reconciling 2010-
15 Performance” had not been
updated.
Number of
households billed
We used the data the company
submitted in business plan table
R3 to calculate our view of the
RCM adjustment.
There were inconsistencies with
the number of households billed
in 2013-14 and 2014-15 between
business plan table R3 and the
company’s populated RCM
spreadsheet.
Our assumptions for the final
determination apply the data
from table R3.
FD09 assumptions –
Measured Non-
household's revenue
for the Measured
Non-household
group immediately
above and below the
250ML threshold
We included our view of the
FD09 assumptions for the inputs
to the RCM model.
Our view of the company’s
revenue assumptions for the
measured non-household group
immediately below and above
the 250 Ml tariff basket threshold
originate from the company’s
FD09 revenue forecasts that
come from the tariff basket
model, which we used for PR09.
There were differences between
the company's and our view of
the FD09 assumptions used in
the populated RCM model.
The company applied different
assumptions for 'FD09 Measured
Non-household's revenue for the
Measured Non-household group
immediately above and below
the 250ML threshold' compared
with our view of its FD09
assumptions.
Our assumptions for the final
determination include the FD09
revenue forecasts as contained
in the PR09 tariff basket model in
accordance with our published
methodology ‘Setting price
controls for 2015-20 – further
information on reconciling 2010-

Final price control determination notice: company-specific appendix – Dŵr Cymru
104
Area of
intervention
What we did Why we did it
15 performance’.
Outturn financial year
average RPI
We applied the data that the
company submitted in business
plan table A9 to calculate our
view of the RCM adjustment.
There were inconsistencies with
the outturn financial year
average RPI between table A9
and the RCM spreadsheet.
Our assumptions for the final
determination apply the data
from table A9.
Operating expenditure incentive allowance
We are not making an adjustment for the OIA. The company has not sought an OIA
claim in this area (this position is unchanged from the draft determination).
Change protocol (logging up, logging down and shortfalls)
Table AA3.7 and table AA3.8 below summarise Dŵr Cymru’s view and our baseline
view of total adjustments to:
capex included in the CIS reconciliation; and
the FD09 opex assumptions used in the calculation of the opex incentive
revenue allowances.
Table AA3.9 summarises our interventions in relation to Dŵr Cymru’s proposed
change protocol adjustments.
There are no changes from our draft determination.

Final price control determination notice: company-specific appendix – Dŵr Cymru
105
Table AA3.7 Summary of post-efficiency capex for logging up, logging down and
shortfalls included in the CIS reconciliation (£ million)
2009-10 to
2014-15 – post-
efficiency capex
Water service Wastewater
service
Total service
Company
view
Ofwat
view
Company
view
Ofwat
view
Company
view
Ofwat
view
Logging up (two-
sided)
0.000 0.000 50.924 49.965 50.924 49.965
Logging down
(two-sided)
0.000 -6.255 0.000 0.000 0.000 -6.255
Shortfalls (one-
sided)
-6.255 0.000 0.000 0.000 -6.255 0.000
Note: We exclude shortfalls for serviceability from the CIS reconciliation, but instead make direct adjustments to the RCV in 2015-16. We do this to allow the actual capex the company incurred in seeking to maintain serviceability, to be reflected in the rewards or penalties earned through the scheme. But to also ensure customers are not required to pay for the regulatory output the company has failed to deliver.
Table AA3.8 Summary of post-efficiency opex for logging up, logging down and
shortfalls included in the OIA calculation (£ million)
2009-10 to 2014-15 –
post-efficiency opex
Water service Wastewater
service
Total service
Company
view
Ofwat
view
Company
view
Ofwat
view
Company
view
Ofwat
view
Logging up 0.000 0.000 19.860 18.892 19.860 18.892
Logging down 0.000 0.000 0.000 0.000 0.000 0.000
Shortfalls 0.000 0.000 0.000 0.000 0.000 0.000
Shortfalls for
serviceability 0.000 0.000 0.000 0.000 0.000 0.000

Final price control determination notice: company-specific appendix – Dŵr Cymru
106
Table AA3.9 Interventions on proposed 2010-15 change protocol adjustments
Area of intervention What we did Why we did it
Meter maintenance shortfall We accepted the company’s pre-efficiency
adjustments for this claim, but have treated this claim
as a logging down item rather than a shortfall. For
inclusion in our CIS reconciliation, we have applied the
profile of FD09 non-infrastructure enhancement
efficiencies to the annual adjustments.
We considered this to be a logging down item as it
relates to activity that is no longer needed – a situation
that could not have been known when we set prices at
PR09.
Welsh Government
mandatory build standards
We did not accept this claim. The cost was less than 2% of the wastewater service
turnover and so we considered this claim to be trivial.
Adoption of private sewers –
opex
We accepted the company’s pre-efficiency values, but
applied the profile of FD09 enhancement efficiencies
rather than FD09 base efficiencies.
At the private sewers workshop on 21 May 2012 we
committed to treat private sewers capex to 2020 as
‘enhancement’ to reduce bill impacts in the short term.
As we have applied enhancement efficiency to the
company’s logging up capex, for consistency, we have
applied enhancement efficiency to the associated
opex.
We have not intervened for the following claim: Habitats NEP (Logging up – sewerage service).

Final price control determination notice: company-specific appendix – Dŵr Cymru
107
Service standard outputs
Service standards are regulatory outputs which we set out in the 2009 final
determination (FD09) supplementary reports7. Where companies have not reported
progress on these service standards before submitting business plans, we expected
them to do so within the price review process.
We sent queries WSH/LEGACY/001 and 001a to Dŵr Cymru to understand its
progress on these outputs. We have considered the evidence the company provided
and consider that these outputs are either achieved or will be complete by the end of
March 2015, as such, we have not applied a shortfall and have not intervened.
Serviceability performance
Table AA3.10 below summarises our serviceability assessments for Dŵr Cymru and
table AA3.11 quantifies the value and impact of any serviceability shortfall on the
RCV. Table AA3.12 summarises our interventions in relation to Dŵr Cymru’s
proposed adjustments for serviceability.
The changes we have made in the final determination compared to our draft
determination, are due to changes in our serviceability shortfall methodology set out
in policy chapter A4.
Table AA3.10 Serviceability assessments for 2010-15
2010-11 2011-12 2012-13 2013-14 2014-15
Water
infrastructure
Company view Stable Stable Stable Stable Stable
Ofwat view Stable Marginal Marginal Marginal Marginal
Water non-
infrastructure
Company view Stable Stable Stable Stable Stable
Ofwat view Stable Stable Stable Stable Stable
7 In the final determination supplementary reports we said: “Both the project activity (as proposed in
your final business plan) and the service standard are the defined output. You must demonstrate delivery of the stated service standard output through the June return. We recognise that companies may decide to prioritise activity differently in order to achieve the service output in a more efficient manner. All material changes to the project activity must be reported and explained through your June return.”

Final price control determination notice: company-specific appendix – Dŵr Cymru
108
2010-11 2011-12 2012-13 2013-14 2014-15
Wastewater
infrastructure
Company view Stable Stable Stable Stable Stable
Ofwat view Stable Stable Stable Stable Stable
Wastewater
non-
infrastructure
Company view Stable Stable Stable Stable Stable
Ofwat view Stable Marginal Stable Stable Stable
Note:
Assessments are based on actual and forecast performance submitted in the company’s revised business plan. Assessments for 2014-15 are based on forecast data and are subject to review once actual performance data becomes available.
Table AA3.11 Impact of serviceability shortfalls on the RCV (£ million)
2009-10 to 2014-15 Water Wastewater Total
Amount subtracted from
RCV
Company view
(representation)
-7.2 0.0 -7.2
Ofwat view -12.6 0.0 -12.6
Table AA3.12 Interventions on proposed 2010-15 serviceability adjustments
Area of
intervention
What we did Why we did it
Unplanned
interruptions to
supply exceeding 12
hours
For the purposes of the final
determination we have applied a
shortfall for deteriorating
performance for this indicator.
In accordance with our amended
shortfall calculation methodology
(see policy chapter A4), the
shortfall applied for the years
2011-12, 2012-13, 2013-14 and
2014-15 has been capped at 1
standard deviation. We have
also applied a multiplication
factor of 0.75 to the final shortfall
value to mitigate the impact of
the volatile nature of this
indicator. The company
proposed a shortfall of £7.2
million (post efficiency), however
The company has had three
breaches of the upper control
limit in 2011-12, 2012-13 and
2013-14. The 2014-15 forecast is
also above the upper control
limit. We have considered the
company's representation and its
proposal for a reduced shortfall
of £7.2 million (post efficiency).
We consider this value does not
sufficiently represent the scale of
failure. We have also excluded
from the performance an incident
that took place in 2014 resulting
in 1,891 properties being
interrupted for more than 12
hours – we agree with the
company that the incident could
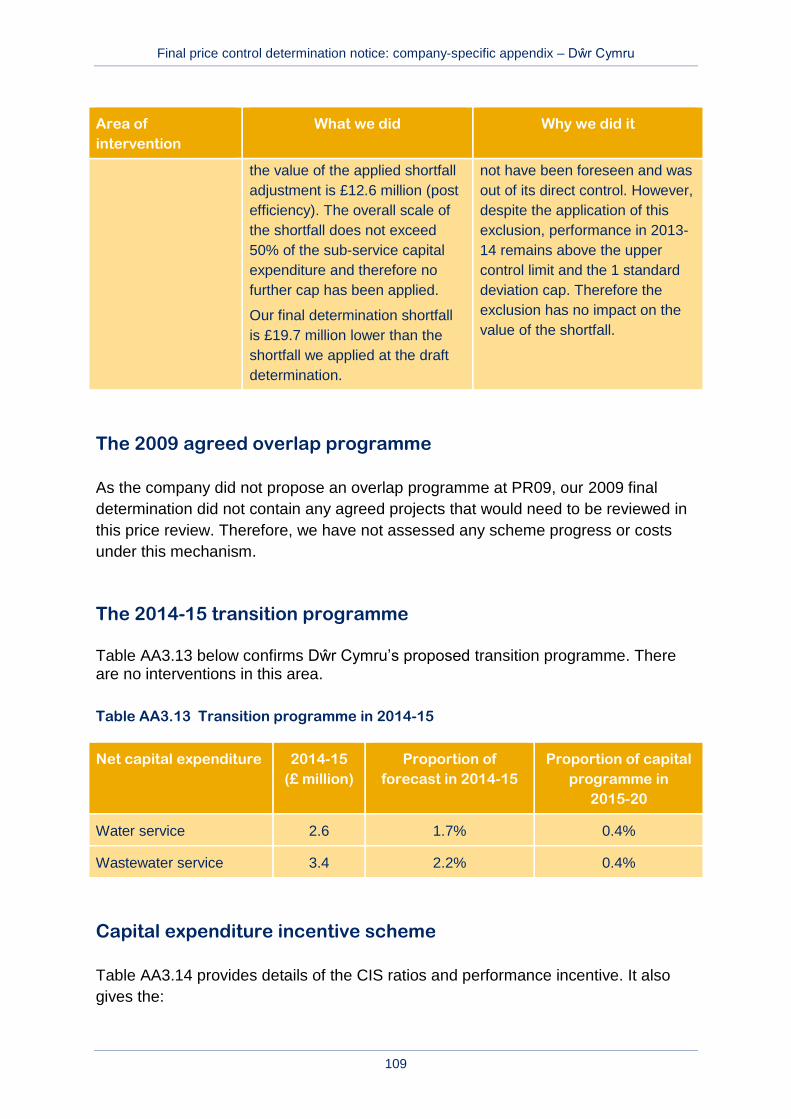
Final price control determination notice: company-specific appendix – Dŵr Cymru
109
Area of
intervention
What we did Why we did it
the value of the applied shortfall
adjustment is £12.6 million (post
efficiency). The overall scale of
the shortfall does not exceed
50% of the sub-service capital
expenditure and therefore no
further cap has been applied.
Our final determination shortfall
is £19.7 million lower than the
shortfall we applied at the draft
determination.
not have been foreseen and was
out of its direct control. However,
despite the application of this
exclusion, performance in 2013-
14 remains above the upper
control limit and the 1 standard
deviation cap. Therefore the
exclusion has no impact on the
value of the shortfall.
The 2009 agreed overlap programme
As the company did not propose an overlap programme at PR09, our 2009 final
determination did not contain any agreed projects that would need to be reviewed in
this price review. Therefore, we have not assessed any scheme progress or costs
under this mechanism.
The 2014-15 transition programme
Table AA3.13 below confirms Dŵr Cymru’s proposed transition programme. There are no interventions in this area.
Table AA3.13 Transition programme in 2014-15
Net capital expenditure 2014-15
(£ million)
Proportion of
forecast in 2014-15
Proportion of capital
programme in
2015-20
Water service 2.6 1.7% 0.4%
Wastewater service 3.4 2.2% 0.4%
Capital expenditure incentive scheme
Table AA3.14 provides details of the CIS ratios and performance incentive. It also
gives the:

Final price control determination notice: company-specific appendix – Dŵr Cymru
110
monetary amounts of the CIS performance reward or penalty;
true-up adjustment to 2015-20 allowed revenues; and
adjustment to the opening RCV.
Table AA3.15 then sets out the profiled values of the revenue adjustments in each
year 2015-20, table AA3.16 shows the components of the opening RCV which are
included in the CIS adjustment, and table AA3.17 summarises our interventions in
relation to Dŵr Cymru’s proposals.
There are no representations in this area from Dŵr Cymru. The only change from our
draft determination relates to use of the post-tax cost of capital as the discount rate
when calculating the future value of revenue adjustments. This change in our
methodology has increased the final determination revenue by £2.5m.
Table AA3.14 CIS true-up adjustments
Water
service
Wastewater
service
Total
service
Restated FD09 CIS bid ratio1 Company view 105.861 105.357 N/a
Ofwat view 105.860 105.499 N/a
Out-turn CIS ratio Company view 138.004 119.609 N/a
Ofwat view 137.342 119.193 N/a
Incentive reward/penalty (%)2 Company view -10.279 -5.466 N/a
Ofwat view -10.100 -5.330 N/a
Reward/penalty (£m) Company view -55.044 -33.582 -88.625
Ofwat view -54.338 -32.856 -87.193
Adjustments to 2015-20
revenue (£m)3
Company view -47.058 -34.405 -81.463
Ofwat view -47.898 -34.724 -82.622
CIS adjustment to RCV (£m)4 Company view 157.956 120.443 278.400
Ofwat view 157.931 120.421 278.352
Notes: 1. The restated FD09 CIS bid ratio takes account of the adjustments for the change protocol (table AA3.5) 2. The reward/(penalty) is adjusted for the additional income included in the 2010-15 determination and the financing cost on the difference between actual spend and capital expenditure assumed in the 2010-15 determination to derive the value of the adjustment to 2015-20 revenue. 3. The adjustment to 2015-20 revenue values shown in this table assume a single year adjustment in the first year, and do not include the NPV profiling used for the final determination.

Final price control determination notice: company-specific appendix – Dŵr Cymru
111
4. In table AA3.16 we show how the components of this agree to those shown in table A2.6 and table A3.6.
Table AA3.15 Profiled revenue adjustments from the CIS reconciliation (£ million)
2015-16 2016-17 2017-18 2018-19 2019-20 Total
Water Company
view -10.108 -10.108 -10.108 -10.108 -10.108 -50.540
Ofwat view -10.269 -10.269 -10.269 -10.269 -10.269 -51.344
Wastewater Company
view -7.390 -7.390 -7.390 -7.390 -7.390 -36.950
Ofwat view -7.445 -7.445 -7.445 -7.445 -7.445 -37.223
Table AA3.16 CIS components of the opening RCV adjustment (£ million)
Water service Wastewater
service
Adjustment for actual expenditure 2010-15 164.186 70.456
Net adjustment from logging up and logging down -6.255 49.965
Adjustment for shortfalls 0.000 0.000
RCV adjustment 157.931 120.421
Table AA3.17 Interventions on proposed CIS adjustments
Area of intervention What we did Why we did it
Methodology We have used the post-tax
basis of the PR09 cost of capital
for the discount rate when
calculating the future value of
the revenue adjustment in the
2010-15 period.
As explained in policy chapter A4,
to address these issues we have
changed the CIS model.
The company used the PR09 pre-
tax cost of debt as the discount
rate when calculating the future
value of the revenue adjustment.
Change protocol
adjustments
In carrying out our assessment,
we have included our view of
the applicable change protocol
amounts for water and
wastewater.
We have applied our published
methodology.

Final price control determination notice: company-specific appendix – Dŵr Cymru
112
Area of intervention What we did Why we did it
Data inconsistencies In carrying out our assessment,
we have used the values from
business plan tables A9.
We identified minor
inconsistencies between the
revised business tables and the
company’s populated CIS model
on the RPI and COPI financial
year values for 2013-14 and
2014-15.
Other adjustments
We have not made any revenue adjustments in our final determination for:
tax refinancing benefit clawback;
other tax adjustments;
equity injection clawback; and
other adjustments.
There are no changes from our draft determination and there are no interventions in
this area.
Table AA3.18 and table AA3.19 below confirm the assumptions included in this final
determination with respect to other adjustments to the opening RCV.
There is a minor change from our draft determination in relation to our adjustment for
actual expenditure in 2009-10.
Table AA3.18 Other adjustments to the opening RCV (£ million)
Water service Wastewater service
Company
view
Ofwat
view
Company
view
Ofwat
view
Land sales 0.500 0.283 1.100 0.655
2009-10 adjustment 22.600 13.725 41.200 39.570
Other adjustments 0.000 0.000 0.000 0.000

Final price control determination notice: company-specific appendix – Dŵr Cymru
113
Table AA3.19 Interventions on proposed adjustments to the opening RCV
Area of intervention What we did Why we did it
Land sales We calculated land sales using
the business plan sales figures
in our RCV midnight adjustment
model.
This provided a consistent
approach with all companies.
2009-10 adjustment We calculated the 2009-10
adjustment using the capex
figures from the June return.
This provided a consistent
approach with all companies.

Final price control determination notice: company-specific appendix – Dŵr Cymru
114
Annex 4 Outcomes, performance commitments and
outcome delivery incentives
We set out our methodology for performance commitments and outcome delivery
incentives (ODIs) in policy chapter A2.
In this annex we provide an overview of the performance commitments and ODIs for
Dŵr Cymru. We then set out in detail these performance commitments and ODIs for
the company’s wholesale water, wholesale wastewater, household retail and non-
household retail outcomes, presented in that order.
The company has used a cost-sharing rate of 50% to calibrate the reward and
penalty rates included in this annex. Companies are required to notify us of their
menu choices by 16 January 2015. This might result in the company having a cost-
sharing rate higher or lower than 50%. Once the company has chosen its position on
the menu we are requiring it, in line with the methodology, to recalibrate its ODIs with
the cost-sharing rate associated with that position, and provide us with the updated
incentive rate calculations. The company must do this alongside their menu choice
on 16 January 2015 so that the recalibrated ODIs can be included in the regulatory
reporting framework for 2015-16.
However, we first consider the responses to our draft determinations in relation to
the performance commitments and ODIs for Dŵr Cymru.
Consideration of representations on our draft determinations
In line with our ‘equivalence of treatment’ principle, Dŵr Cymru is subject to changes
we have made to outcomes following detailed comparisons of similar outcome
proposals put forward by companies (that is: our comparative assessment
comparative assessments).
In policy chapter A1, we provide a list of the respondents to the draft determinations
published in April, May and August of this year. We have fully considered all of the
responses received, and where appropriate, we have made either consequential
adjustments to our industry-wide approach or company-specific interventions.
Where representations have addressed issues that are common to a number of
companies, these comments, and any consequential changes to our approach, are
discussed in the policy chapter A2. Representations that are specific to performance

Final price control determination notice: company-specific appendix – Dŵr Cymru
115
commitments and ODIs for Dŵr Cymru, and any consequential impact on our final
determination, are summarised in the tables below as follows.
Tables AA4.1 and AA4.2 consider representations received on the
interventions we proposed in our draft determinations as a result of
comparative assessment comparative assessments in six areas for wholesale
water and wholesale wastewater respectively.
Tables AA4.3 and AA4.4 consider representations received on the
interventions we proposed in our draft determinations as a result of our
company specific assessments for wholesale water and wholesale
wastewater respectively.
Table AA4.5 considers representations received on the interventions we
proposed in our draft determinations as a result of our company specific
assessments for household retail.
Table AA4.6 considers representations received on the interventions we
proposed in our draft determinations as a result of our company specific
assessments for non-household retail.
Table AA4.7 lists the performance commitments that were proposed by
companies but that have been removed as part of our final determination.
Table AA4.8 lists performance commitments excluded from the commentary
tables above because we received no representations on them and we made
no interventions at draft determination or through the comparative
assessments.
Overall, Dŵr Cymru considers that we should:
clarify that some of its performance commitments and outcome delivery
incentives are measured on a three year rolling average; and
state that rewards and penalties will not be applicable where restitution have
been made or compensation have been paid via other routes in order to
prevent double jeopardy.
We have accepted a three-year average, where proposed, for some of the
company’s performance commitments. We also accept its position on double
jeopardy in principle, but expect the company to clearly explain why an incentive
should not apply in the event that it feels double jeopardy would occur.

Final price control determination notice: company-specific appendix – Dŵr Cymru
116
Table AA4.1 Representations specific to the comparative assessments on wholesale water
PC/ODI
affected
What we did at draft
determination/
subsequent comparative
assessment
Representations What we did at final
determination
Why we did it
A1 – safety
of drinking
water
We removed the reward as
we considered it not
appropriate to earn a reward
for a statutory obligation.
We changed the penalty to a
unit rate as we considered
this would give the company a
better incentive to improve.
The company stated that
Ofwat’s proposal to remove
the reward for safe drinking
water runs counter to the April
customer research findings,
and will be looking to resolve
this uncertainty with the
further analysis it undertook
between the draft and final
determination.
The company stated that the
relevant measure should be a
three year rolling average.
The company stated that it
would prefer the incentive rate
to be written as £2.5m per
0.01% rather than £250m per
1% as this will reduce the risk
of a stakeholder
misrepresenting the scale of
the penalty.
We maintained our
intervention to remove the
proposed reward.
We intervened in accordance
with our comparative
assessment by setting the
CPL at 100% and deadband
at 99.95%.
We intervened so that this
PC’s performance will be
measured and incentivised
annually.
Changed the representation
of the incentive rate to be
£2.5m per 0.01%.
Earning rewards for a
statutory obligation is not
appropriate.
See policy chapter A2 for
further explanation.
The DWI has measured
performance annually in the
past and we consider that it is
appropriate to continue
measuring performance
annually.
We consider that annual
measurement and incentives
will better protect customers
against non-delivery and
provide appropriate
incentives to the company to
deliver.
As suggested by the
company, expressing the

Final price control determination notice: company-specific appendix – Dŵr Cymru
117
PC/ODI
affected
What we did at draft
determination/
subsequent comparative
assessment
Representations What we did at final
determination
Why we did it
incentive rate as £2.5m per
0.01% makes the company’s
actual performance clearer.
A2 –
customer
acceptability
Changed from non-financial
incentive (NFI) to penalty-
only.
Set deadbands and penalty
collars in line with our
comparative assessments.
Established a maximum
penalty of £3.5m, based on
incremental totex.
The company stated that
Ofwat set penalty rates based
on incremental totex figures,
as submitted in tables W1 and
S1. But this does not take into
account that these are
allocations, not strict
estimates of incremental
expenditure. The company is
therefore questioning the size
of some of these adjustments.
The company does not agree
with the introduction of
additional penalties alongside
that which the DWI can
impose for customer
acceptability (drinking water).
The company considers that
We intervened in accordance
with our comparative
assessment by setting the
penalty deadband at 1.23,
collar at 1.43, reward
deadband at 1.23 and cap at
1.03 from 2017-18.
We set the CPLs in 2015-16
and 2016-17 at 2.54 and 1.89
to offer a glide-path to upper
quartile performance in 2017-
18.
We set the penalty
deadbands in 2015-16 and
2016-17 at 3.20, the 2014-15
level of performance.
We introduced a reward in all
years for performance that is
We consider that a financial
incentive will offer sufficient
protection to customers
against non-delivery and
provide appropriate
incentives to the company to
deliver.
The company’s performance
is not at upper quartile and
therefore we intervened to
incentivised to the company
to reach upper quartile
performance.
See policy chapter A2 for
further explanation.
All other companies’
standalone PCs on water
quality contacts are

Final price control determination notice: company-specific appendix – Dŵr Cymru
118
PC/ODI
affected
What we did at draft
determination/
subsequent comparative
assessment
Representations What we did at final
determination
Why we did it
the relevant measure should
be a three year rolling
average.
The company stated in its
representations of July 2014
that it would carry out
research to obtain customer
views on an ODI reward. It
submitted the results of this
research in its draft
determination representations
of October 2014. The
research showed that its
customers supported a
reward.
at or better than the upper
quartile of 1.23.We intervened
so that this PC’s performance
will be measured and
incentivised annually.
We assessed Dŵr Cymru’s
case for including a reward at
the same rate as its penalty of
£9.3m/1.00 contacts/1,000
population, and accepted it.
measured annually. We
therefore intend to measure
Dŵr Cymru’s PC in the same
way.
A majority of Dŵr Cymru’s
surveyed customers indicated
it was acceptable to link bills
to improvements, at a level of
reward symmetrical to the
penalty.
A3 –
reliability of
supply
Set a PC level of 10 minutes
and a penalty collar of 20
minutes from 2017-18
onwards.
The company considered that
the relatively limited
interconnectivity of its network
impacts its performance for
this commitment – it identified
this as a company specific
factor.
It proposed an overall target
In line with our comparative
assessment, we set a PC
level of 12 minutes from 2017-
18, with a penalty collar of 32
minutes and a reward cap of 0
minutes.
We set the CPLs in 2015-16
and 2016-17 at 36 and 24 to
The company’s performance
is not at upper quartile and
therefore we intervened to
incentivise the company to
reach upper quartile
performance.
We introduced a reward in
response to the company-

Final price control determination notice: company-specific appendix – Dŵr Cymru
119
PC/ODI
affected
What we did at draft
determination/
subsequent comparative
assessment
Representations What we did at final
determination
Why we did it
for the last three years of
AMP6 of 25.4 minutes.
It also proposed to widen the
deadband range for each year
of AMP6 from 10 minutes to
20 minutes, which results in a
penalty rate of £0.195m per
minute per property to keep
the maximum penalty the
same.
offer a glide-path to upper
quartile performance in 2017-
18.
We set the penalty
deadbands in 2015-16 and
2016-17 at 48, the 2014-15
level of performance.
We introduced a reward in all
years for performance that is
at or better than the upper
quartile of 12.
We accepted the company’s
revised penalty rate of
£0.195m/minute/property.
We set the reward rate equal
to the penalty rate.
specific factor concerning the
impact of network
interconnectivity on supply
interruptions that Dŵr Cymru
set out in its representations.
Generally, the companies’
customers supported rewards
that are symmetrical with
penalties.
See policy chapter A2 for
further explanation.

Final price control determination notice: company-specific appendix – Dŵr Cymru
120
Table AA4.2 Representations specific to the comparative assessments on wholesale wastewater
PC/ODI
affected
What we did at draft
determination/
subsequent comparative
assessment
Representations What we did at final
determination
Why we did it
B3 –
preventing
pollution
Changed the PC levels, caps,
collars and deadbands to
reflect the inclusion of
transferred assets.
Changed the penalty and
reward to unit rates to £0.4m
and £0.047m respectively
from their previous lump sums
of £10m each.
The company accepts that the
performance commitment
should include incidents from
transferred assets in principle,
but is proposing minor
alterations to Ofwat’s
proposed performance profile.
The company has proposed a
performance level of 137 in
2019-20 compared with our
intervention of 131.
The company’s preference is
that this measure should be
based on a three year rolling
average performance.
The company stated in its
representations of July 2014
that it did not have sufficient
evidence to justify the
inclusion of a reward but
would undertake further
We intervened in line with our
comparative assessments.
We intervened to define the
performance commitment as
the reduction in category 3
pollution incidents only.
We set a PC level of 131
pollution incidents from 2017-
18, with a penalty collar of
156 and a reward cap of 106.
We set the CPLs in 2015-16
and 2016-17 at 161 and 154
to offer a glide-path to upper
quartile performance in 2017-
18.
We set the penalty
deadbands in 2015-16 and
2016-17 at 224, the 2014-15
level of performance.
We introduced a reward in all
The company’s performance
is not at upper quartile and
therefore we intervened to
incentivise the company to
reach upper quartile
performance.
All other companies’ PC
levels are annual, not three
year averages, therefore we
have adopted a consistent
approach for Dŵr Cymru.
A majority of Dŵr Cymru’s
surveyed customers indicated
it was acceptable to link bills
to improvements, at a level of
reward symmetrical to the
penalty.
We consider that the
company should not receive
any reward for reducing
serious pollution incidents. It

Final price control determination notice: company-specific appendix – Dŵr Cymru
121
PC/ODI
affected
What we did at draft
determination/
subsequent comparative
assessment
Representations What we did at final
determination
Why we did it
customer research. It
submitted the results of this
research in its draft
determination representations
of October 2014. The
research indicated customer
support for a reward.
Natural Resources Wales
(NRW) would like to see
category 1 and 2 (serious)
pollution incidents separated
from category 3. It would like
to see a target of zero for
serious pollution incidents, in
line with other companies. It
disagrees with the company’s
proposed incentive (reward)
for reduced pollution
incidents, as it believes
pollution reduction should be
firmly embedded in the values
of the company.
years for performance that is
at or better than the upper
quartile of 131.
We intervened so that this
PC’s performance will be
measured and incentivised
annually.
We assessed Dŵr Cymru’s
case for a reward at £0.047m
per incident, and accepted it.
We left the penalty rate
unchanged at £0.400m per
incident.
is incentivised to reduce
category 1 and 2 incidents
through NRW legal action.
See policy chapter A2 for
further explanation.
D3 – Included properties flooded The company accepted that Accept Dŵr Cymru’s Dŵr Cymru is currently

Final price control determination notice: company-specific appendix – Dŵr Cymru
122
PC/ODI
affected
What we did at draft
determination/
subsequent comparative
assessment
Representations What we did at final
determination
Why we did it
properties
flooded in
the year
from transferred assets in the
performance commitment.
Changed the penalty and
reward rates from lump sums
of £10m to unit rates of
£0.161m/property and
£0.062m/property.
Changed the PC levels, caps,
collars and deadbands to
account for transferred
assets.
Reduced the reward rate.
the definition of performance
commitments for properties
flooded should include private
sewers transferred to the
company, but is proposing
alterations to Ofwat’s
proposed performance profile
to take account of issues such
as the different trends in
hydraulic overload and
flooding (other causes).
The company’s preference is
that this measure should be
based on a three year rolling
average performance.
The company stated in its
representations of July 2014
that it did not have sufficient
evidence to support the
reward rate but would
undertake further customer
research. It submitted the
results of this research in its
proposed performance profile.
We intervened so that this
performance commitment will
be measured and incentivised
annually.
Retained the reward at the
reduced rate of
£0.062m/property.
performing at the upper
quartile level so we have not
intervened.
All other companies’ PC
levels are annual, not three
year averages, therefore we
have adopted a consistent
approach for Dŵr Cymru.
Dŵr Cymru’s customer
research showed that its
customers support the reward
at the reduced rate.
See policy chapter A2 for
further explanation.

Final price control determination notice: company-specific appendix – Dŵr Cymru
123
PC/ODI
affected
What we did at draft
determination/
subsequent comparative
assessment
Representations What we did at final
determination
Why we did it
draft determination
representations of October
2014. The research indicated
customer support for a reward
at the level of £0.062m per
property.
Table AA4.3 Representations specific to the company specific assessments on wholesale water
PC/ODI
affected
What we did at draft
determination
Representations What we did at final
determination
Why we did it
F2 –
leakage
Changed the penalty to a unit
rate per Ml/day.
Increased the maximum
annual penalty from £5m to
£9.2m.
The company found that 59%
of the customers it sampled in
its research supported linking
bills to leakage performance.
Consequently, it believes that
there is a case for a reward,
but at a lower rate than the
£1.84m penalty rate it asked
its customers about. Instead
of the £1.84m per Ml/d used
for penalties, it proposed a
Assessed Dŵr Cymru’s case
for a reward and allowed it.
There is significant customer
support for a reward and,
given that the reward rate is
half the penalty rate,
customers are adequately
protected.

Final price control determination notice: company-specific appendix – Dŵr Cymru
124
PC/ODI
affected
What we did at draft
determination
Representations What we did at final
determination
Why we did it
reward rate half this level, at
£0.92m per Ml/d. It also
proposed symmetry in
deadbands and collars.
F3 – asset
resilience
Increased maximum annual
penalty from £0.5m to £3.1m.
The company states that the
penalty exposure should
revert to what it proposed in
its business plan submission.
The company stated that it did
not have sufficient evidence to
justify the inclusion of a
reward but would undertake
further customer research. It
submitted the results of this
research in its draft
determination
representations. The research
showed a majority of
customers (69%) supported
the liking of bills to this
performance measure in
principle, but only 47% felt
that the proposed level of
reward was appropriate.
We maintained our
intervention on the penalty
rate.
We further intervened to make
the penalty a variable one,
with a total penalty of £15.5m
applying over the range
between the company’s 2019-
20 penalty deadband and
collar, that is, 80% to 85% of
critical assets that are resilient
against a set of criteria. The
penalty rate per % is therefore
£15.5m/(85-80) = £3.1m.
We did not accept the
company’s proposed reward.
Our methodology states
penalties should be based on
incremental totex (and
customers’ WTP, if available).
The company’s proposed
penalty was not consistent
with our methodology, as it
was not based on
incremental totex and
customers’ WTP, despite
these being known.
The company has not
provided sufficiently strong
evidence that a reward is
appropriate.

Final price control determination notice: company-specific appendix – Dŵr Cymru
125
Table AA4.4 Representations specific to the company specific assessments on wholesale wastewater
PC/ODI
affected
What we did at draft
determination
Representations What we did at final
determination
Why we did it
C1 –
adapting to
climate
change
Change the PC from NFI to
penalty-only.
Established a maximum
annual penalty of £4.5m,
based on incremental totex.
The company states that
Ofwat has adjusted its penalty
rates on the basis of
incremental totex figures, as
submitted in tables W1 and
S1. The company states that
this has been done in a way
that appears to overlook the
fact that these are allocations,
not strict estimates of
incremental expenditure. The
company therefore questions
the size of some of these
adjustments.
The company states that it
does not agree with the
introduction of additional
penalties for responding to
climate change.
The company states that
there is an error in the DD
around profiling which needs
to be corrected. The penalty
We maintained our
intervention to make this a
penalty-only ODI.
We maintained our
intervention on the penalty.
We changed the penalty collar
from 10,000 to 1,000.
We stated in our ODI
methodology that penalties
should be based on
incremental totex (and
customers’ WTP, if available).
We corrected the error,
highlighted by the company,
which we had made in the
penalty collar in the draft
determination.

Final price control determination notice: company-specific appendix – Dŵr Cymru
126
PC/ODI
affected
What we did at draft
determination
Representations What we did at final
determination
Why we did it
collar for 2016-17 should read
1,000 rather than 10,000.
F3 – asset
resilience
We increased the maximum
annual penalty from £0.5m to
£2.2m.
The company states that the
penalty exposure should
revert to what it proposed in
its business plan submission.
The company stated that it did
not have sufficient evidence to
justify the inclusion of a
reward but would undertake
further customer research. It
submitted the results of this
research in its draft
determination
representations. The research
showed a majority of
customers (69%) supported
the liking of bills to this
performance measure in
principle, but only 47% felt
that the proposed level of
reward was appropriate.
We maintained our
intervention on the penalty
rate.
We further intervened to make
the penalty a variable one,
with a total penalty of £11.0m
applying over the range
between the company’s 2019-
20 penalty deadband and
collar, that is, 71% to 76% of
critical assets that are resilient
against a set of criteria. The
penalty rate per % is therefore
£11.0m/(76-71) = £2.2m.
We did not accept the
company’s proposed reward.
Our methodology states
penalties should be based on
incremental totex (and
customers’ WTP, if available).
The company’s proposed
penalty was not consistent
with our methodology, as it
was not based on
incremental totex and
customers’ WTP, despite
these being known.
The company has not
provided sufficiently strong
evidence that a reward is
appropriate.
B2 – treating
used water
No intervention. Natural Resources Wales’s
expectation is that companies
Intervened to set PC level at
100% compliance from 2015-
Compliance with wastewater
discharge permits is a

Final price control determination notice: company-specific appendix – Dŵr Cymru
127
PC/ODI
affected
What we did at draft
determination
Representations What we did at final
determination
Why we did it
will set PC levels of 100% for
all environmental statutory
obligations.
16. statutory obligation and
therefore a target of 100% is
appropriate.
Table AA4.5 Representations specific to the company specific assessments on household retail
PC/ODI
affected
What we did at draft
determination
Representations What we did at final
determination
Why we did it
None N/a N/a N/a N/a
Table AA4.6 Representations specific to the company specific assessments on non-household retail
PC/ODI
affected
What we did at draft
determination
Representations What we did at final
determination
Why we did it
D4 – non-
household
customer
satisfaction
We changed the penalty to a
unit rate per percentage.
CCWater sought a stronger
incentive.
We maintained our
intervention from the draft
determination.
We consider that the
company’s maximum penalty
is sufficient and should be
applied equally across the
penalty range.

Final price control determination notice: company-specific appendix – Dŵr Cymru
128
Table AA4.7 Performance commitments proposed by the company that we have removed from this final determination
Performance commitment Reason for its removal
Wholesale water:
G1 – health and safety
G2 – competence for role
H1 – operating efficiency
H2 – financing efficiency
Wholesale sewerage:
G1 – health and safety
G2 – competence for role
H1 – operating efficiency
H2 – financing efficiency
Household retail:
G1 – health and safety
G2 – competence for role
Non-household retail:
H1 – operating efficiency
We removed all of these PCs at draft determination as they related to internally
focused outputs, rather than customer-focused outcomes. The company has accepted
their removal.
Table AA4.8 Performance commitments excluded from the commentary tables because we received no representations to our
draft determinations on them and we made no interventions at draft determination or through the comparative assessments
Wholesale water Wholesale wastewater Household retail Non-household retail

Final price control determination notice: company-specific appendix – Dŵr Cymru
129
Wholesale water Wholesale wastewater Household retail Non-household retail
C2 – reducing our carbon
footprint
D1 – SIM
D2 – “at risk” customer services
D5 – earning the trust of
customers
E1 – affordable bills
F1 – asset serviceability
C2 – reducing our carbon
footprint
D1 – SIM
D2 – “at risk” customer services
D5 – earning the trust of
customers
E1 – affordable bills
F1 – asset serviceability
D1 – SIM
D5 – earning the trust of customers
E1 – affordable bills
E2 – help for disadvantaged
customers

Final price control determination notice: company-specific appendix – Dŵr Cymru
130
Summary of ODIs
For each outcome proposed, companies were asked to identify one or more
measures that would provide evidence that the outcome was being delivered. On
each measure, companies had to set out the level of performance that they were
committing to deliver. Companies also had to explain why they committed to the
performance level chosen and explain why this represented an appropriate level of
stretch (as benchmarked against an upper quartile level of performance across the
sector).
Companies also had to propose outcome delivery incentives. Where customers were
willing to pay for higher levels of performance and companies could demonstrate that
performance was at a high level relative to its peers, then the financial incentives
could contain rewards for over delivery as well as penalties for under delivery.
Below, we provide an overview of the performance commitments and outcome
delivery incentives. Table AA4.9 shows the balance between reward and penalty,
penalty only and reputational incentives in the package of incentives for the
company.
Table AA4.9 The composition of the package of ODIs
Reward and
penalty
Penalty only Non-financial
incentive
Wholesale water 4 3 5
Wholesale wastewater 3 3 5
Household retail 1 0 3
Non-household retail 1 1 2
Total 9 7 15
Figure AA4.1 shows the potential financial consequences of the individual financial
ODIs. The figures represent the penalties and rewards associated with the p10 and
p90 scenarios over the five years (2015-16 to 2019-20). This means there is a 10%
chance of performance being higher or lower than these assumed levels. In most
cases the potential maximum will be bigger but is very unlikely to occur. The p10 and
p90 therefore represent a more realistic estimate of potential financial
consequences.

Final price control determination notice: company-specific appendix – Dŵr Cymru
131
Figure AA4.1 Overview of financial ODIs
As explained in the policy chapter A2, we are introducing an aggregate cap on
rewards and collar on penalties from the outcome delivery incentives. Details of how
the cap/collar will operate are set out in section A2.6 of the policy chapter A2.
There are no specific exclusions from the cap and collar for Dŵr Cymru, though
under our ‘equivalence of treatment’ principle it is subject to the cap and collar.
In the remainder of this chapter, we provide the following information on each
performance commitment we are confirming as part of this final determination:
the name and detailed definition of the performance commitment;
the type of incentive;
the performance commitment level;
for financial incentives:
- the limits on rewards and penalties (caps and collars) and neutral zones
(deadbands) as applicable8; and
8 Unless otherwise stated, a deadband is the level of service against which an incentive is calculated
and the cap or collar is the level of service at which the maximum reward or penalty occurs. So for example, if the deadband is 1.29 and the actual performance level is 1.39, the result of the incentive would be a penalty of (1.39-1.29) times the specified penalty rate.

Final price control determination notice: company-specific appendix – Dŵr Cymru
132
- the incentive rates;
additional details on the measure; and
where Ofwat has not accepted the company’s proposals, the nature of the
intervention made is also explained.
Appendix 1 of our final methodology statement contains a number of worked
examples that illustrate how the different incentive types will operate.

Final price control determination notice: company-specific appendix – Dŵr Cymru
133
Performance commitments and ODIs in detail
Wholesale water outcome 1: Safe drinking water
Performance commitment A1: Safety of drinking water
Detailed definition of performance measure: Compliance with the DWI
regulations as measured by mean zonal compliance (MZC)
Incentive type: Financial – penalty only
Performance commitments
Starting
level
Committed performance levels
Unit 2014-15 2015-16 2016-17 2017-18 2018-19 2019-20
PC % 99.98 99.98 99.98 100.00 100.00 100.00
Penalty collar % 99.91 99.91 99.91 99.91 99.91
Penalty
deadband %
99.95 99.95 99.95 99.95 99.95
Incentive rates
Incentive type Incentive rate
(£m/0.01%/year)
Penalty 2.5
Additional details
Necessary detail on
measurement units
Compliance with the Drinking Water Inspectorate (DWI)
regulations as measured by mean zonal compliance (MZC).
Frequency of PC
measurement and any
use of averaging
Performance commitment measured and reported on an annual
basis through the company’s ‘Annual Service and Outcome
Delivery Report.’
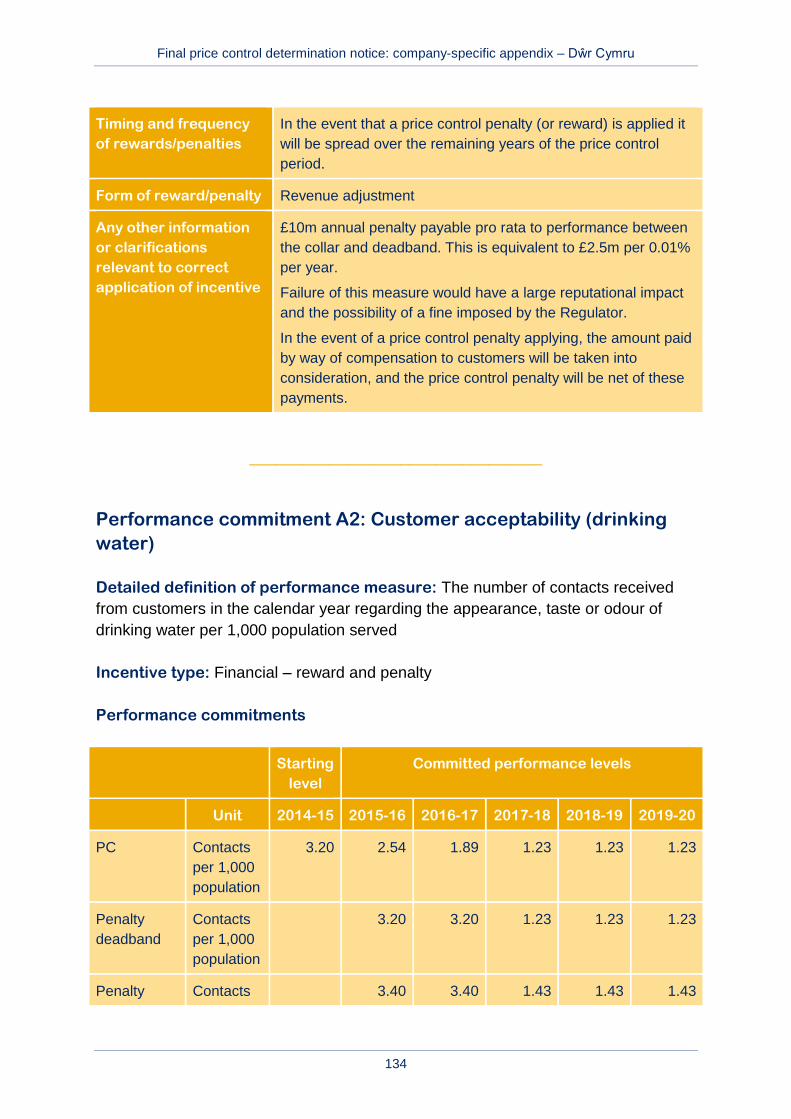
Final price control determination notice: company-specific appendix – Dŵr Cymru
134
Timing and frequency
of rewards/penalties
In the event that a price control penalty (or reward) is applied it
will be spread over the remaining years of the price control
period.
Form of reward/penalty Revenue adjustment
Any other information
or clarifications
relevant to correct
application of incentive
£10m annual penalty payable pro rata to performance between
the collar and deadband. This is equivalent to £2.5m per 0.01%
per year.
Failure of this measure would have a large reputational impact
and the possibility of a fine imposed by the Regulator.
In the event of a price control penalty applying, the amount paid
by way of compensation to customers will be taken into
consideration, and the price control penalty will be net of these
payments.
_________________________________
Performance commitment A2: Customer acceptability (drinking
water)
Detailed definition of performance measure: The number of contacts received
from customers in the calendar year regarding the appearance, taste or odour of
drinking water per 1,000 population served
Incentive type: Financial – reward and penalty
Performance commitments
Starting
level
Committed performance levels
Unit 2014-15 2015-16 2016-17 2017-18 2018-19 2019-20
PC Contacts
per 1,000
population
3.20 2.54 1.89 1.23 1.23 1.23
Penalty
deadband
Contacts
per 1,000
population
3.20 3.20 1.23 1.23 1.23
Penalty Contacts 3.40 3.40 1.43 1.43 1.43

Final price control determination notice: company-specific appendix – Dŵr Cymru
135
Starting
level
Committed performance levels
Unit 2014-15 2015-16 2016-17 2017-18 2018-19 2019-20
collar per 1,000
population
Reward
deadband
Contacts
per 1,000
population
1.23 1.23 1.23 1.23 1.23
Reward cap Contacts
per 1,000
population
1.03 1.03 1.03 1.03 1.03
Incentive rates
Incentive type Incentive rate
(£m/1.00 contacts/1,000 population)
Penalty 9.3
Reward 9.3
Additional details
Necessary detail on
measurement units
The Drinking Water Inspectorate, a regulator dedicated solely to
the objective of drinking water quality, monitors the company’s
performance closely and reports publicly on its performance
along with other companies.
Frequency of PC
measurement and any
use of averaging
Performance commitment measured and reported on an annual
basis through the company’s ‘Annual Service and Outcome
Delivery Report.’
Timing and frequency
of rewards/penalties
Annual
Form of reward/penalty Unit rate of £9.3m per 1.0 contacts per 1,000 population. This is
equivalent to £0.093m per 0.01 contacts per 1,000 population.
Any other information
or clarifications
relevant to correct
application of incentive

Final price control determination notice: company-specific appendix – Dŵr Cymru
136
_________________________________
Performance commitment A3: Reliability of supply
Detailed definition of performance measure: Average minutes of supply
interruption per property within our supply area (includes both planned and
unplanned interruptions) as defined for the Ofwat key performance indicator (KPI) in
IN 13/03
Incentive type: Financial – reward and penalty
Performance commitments
Starting
level
Committed performance levels
Unit 2014-15 2015-16 2016-17 2017-18 2018-19 2019-20
PC Minutes/
property
48 36 24 12 12 12
Penalty
collar
Minutes/
property
68 68 32 32 32
Penalty
deadband
Minutes/
property
48 48 12 12 12
Reward
deadband
Minutes/
property
12 12 12 12 12
Reward cap Minutes/
property
0 0 0 0 0
Incentive rates
Incentive type Incentive rate
(£m per minute)
Penalty 0.195
Reward 0.195

Final price control determination notice: company-specific appendix – Dŵr Cymru
137
Additional details
Necessary detail on
measurement units
As per Ofwat KPI – Water supply Interruptions in IN 13/03
Number of minutes lost due to water supply interruptions
(planned and unplanned) for three hours or longer, per property
served
Frequency of PC
measurement and any
use of averaging
Performance commitment measured and reported on an annual
basis through the company’s ‘Annual Service and Outcome
Delivery Report.’
Timing and frequency
of rewards/penalties
Annual
Form of reward/penalty Revenue adjustment
Any other information
or clarifications
relevant to correct
application of incentive
£0.195m per minute applies between penalty deadband and
collar, and reward deadband and cap.
Number of minutes lost per property served in the year with
supply interruption greater than three hours (irrespective of
whether it was planned, unplanned or caused by a third party).
Per property served is the number of connected properties
(domestic and non-domestic) for water supply. This includes
properties which are connected but not billed (for example,
temporarily unoccupied) but excludes properties which have
been permanently disconnected.
A group of properties supplied by a single connection should be
counted as multiple properties. They should only be treated as a
single property if a single bill covers all properties in the group.

Final price control determination notice: company-specific appendix – Dŵr Cymru
138
Wholesale water outcome 2: Protecting our environment
Performance commitment B1: Abstraction for water for use
Detailed definition of performance measure: Percentage compliance with our
abstraction licences, as regulated by Natural Resources Wales
Incentive type: Reputational
Performance commitments
Starting
level
Committed performance levels
Unit 2014-15 2015-16 2016-17 2017-18 2018-19 2019-20
PC % 100 100 100 100 100 100
Additional details
Necessary detail on
measurement units
The company will report on the % of our abstraction licenses
that it is compliant with in each calendar year.
Frequency of PC
measurement and any
use of averaging
Performance commitment measured and reported on an annual
basis through the company’s ‘Annual Service and Outcome
Delivery Report.’
Timing and frequency
of rewards/penalties
N/a
Form of reward/penalty N/a
Any other information
or clarifications
relevant to correct
application of incentive

Final price control determination notice: company-specific appendix – Dŵr Cymru
139
Wholesale water outcome 3: Responding to climate change
Performance commitment C2: Carbon footprint
Detailed definition of performance measure: The total GWh of renewable energy
generated within the year
Incentive type: Reputational
Performance commitments
Starting
level
Committed performance levels
Unit 2014-15 2015-16 2016-17 2017-18 2018-19 2019-20
PC GWh 7.11 7.11 9.78 12.45 15.11 17.78
Additional details
Necessary detail on
measurement units
GWh of renewable energy generated within the year.
Frequency of PC
measurement and any
use of averaging
Performance commitment measured and reported on an annual
basis through the company’s ‘Annual Service and Outcome
Delivery Report.’
Timing and frequency
of rewards/penalties
N/a
Form of reward/penalty N/a
Any other information
or clarifications
relevant to correct
application of incentive
The company will increased its renewable energy production
capacity by focusing on such initiatives as hydro generation,
solar photo-voltaic and expanding its anaerobic digestion
capacity. This is part of the company’s commitment to reduce its
carbon footprint.

Final price control determination notice: company-specific appendix – Dŵr Cymru
140
Wholesale water outcome 4: Best in class customer
service
Performance commitment D1: Service incentive mechanism
Detailed definition of performance measure: SIM score as defined in Ofwat’s
SIM guidance April 2012 and updated by IN 13/03
Incentive type: Financial – reward and penalty
Performance commitments
Starting
level
Committed performance levels
Unit 2014-15 2015-16 2016-17 2017-18 2018-19 2019-20
PC Industry
score
Top
quartile
Top
quartile
Top
quartile
Top
quartile
Top
quartile
Top
quartile
Penalty collar Industry
score
Ofwat
method-
ology
Ofwat
method-
ology
Ofwat
method-
ology
Ofwat
method-
ology
Ofwat
method-
ology
Penalty
deadband
Industry
score
Ofwat
method-
ology
Ofwat
method-
ology
Ofwat
method-
ology
Ofwat
method-
ology
Ofwat
method-
ology
Reward
deadband
Industry
score
Ofwat
method-
ology
Ofwat
method-
ology
Ofwat
method-
ology
Ofwat
method-
ology
Ofwat
method-
ology
Reward cap Industry
score
Ofwat
method-
ology
Ofwat
method-
ology
Ofwat
method-
ology
Ofwat
method-
ology
Ofwat
method-
ology
Incentive rates
Incentive type Incentive rate
Penalty Ofwat-led price control adjustments that are implemented
at price reviews.
Reward Ofwat-led price control adjustments that are implemented
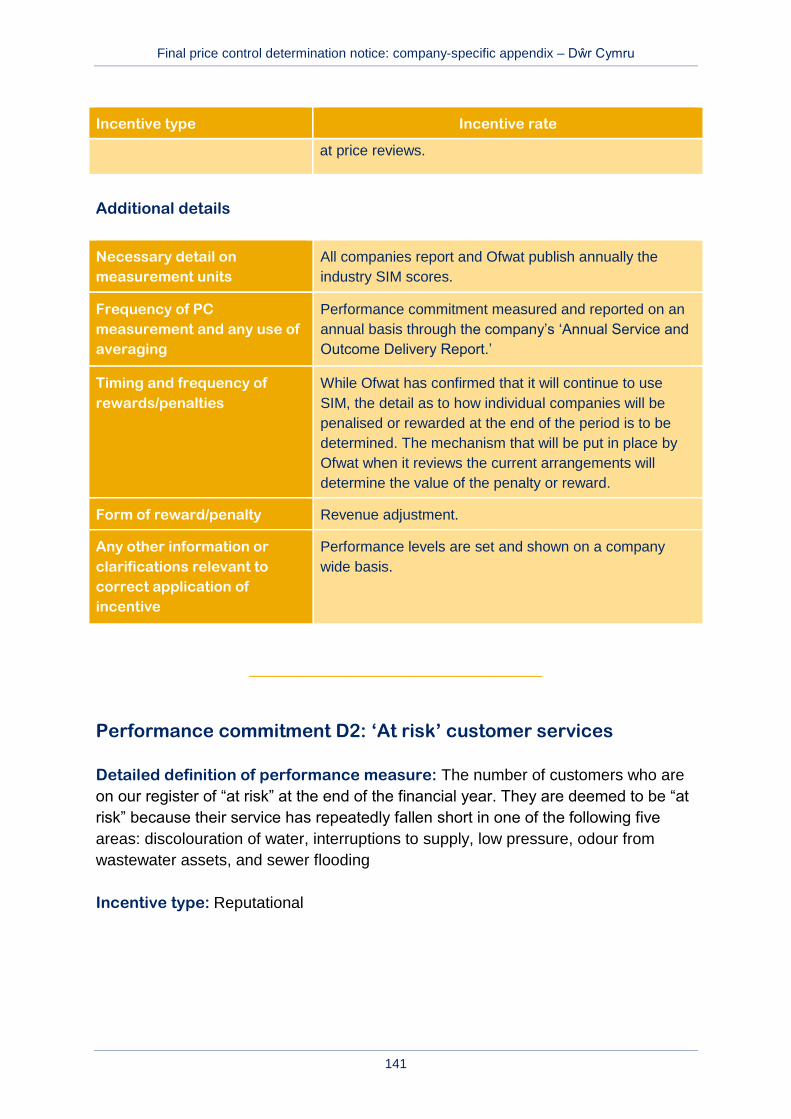
Final price control determination notice: company-specific appendix – Dŵr Cymru
141
Incentive type Incentive rate
at price reviews.
Additional details
Necessary detail on
measurement units
All companies report and Ofwat publish annually the
industry SIM scores.
Frequency of PC
measurement and any use of
averaging
Performance commitment measured and reported on an
annual basis through the company’s ‘Annual Service and
Outcome Delivery Report.’
Timing and frequency of
rewards/penalties
While Ofwat has confirmed that it will continue to use
SIM, the detail as to how individual companies will be
penalised or rewarded at the end of the period is to be
determined. The mechanism that will be put in place by
Ofwat when it reviews the current arrangements will
determine the value of the penalty or reward.
Form of reward/penalty Revenue adjustment.
Any other information or
clarifications relevant to
correct application of
incentive
Performance levels are set and shown on a company
wide basis.
_________________________________
Performance commitment D2: ‘At risk’ customer services
Detailed definition of performance measure: The number of customers who are
on our register of “at risk” at the end of the financial year. They are deemed to be “at
risk” because their service has repeatedly fallen short in one of the following five
areas: discolouration of water, interruptions to supply, low pressure, odour from
wastewater assets, and sewer flooding
Incentive type: Reputational

Final price control determination notice: company-specific appendix – Dŵr Cymru
142
Performance commitments
Starting
level
Committed performance levels
Unit 2014-15 2015-16 2016-17 2017-18 2018-19 2019-20
PC Properties/
incidents
on internal
register
850 850 750 650 550 425
Additional details
Necessary detail on
measurement units
The measure is the number of customers on the “at risk”
register. The register records the customers who have contacted
us at least once in each of the previous three years in respect of
(discolouration of water, interruptions to supply and odour), plus
customers on the DG2 register without sufficient remedial action
for at least the last three years and customers who have
experienced internal sewer flooding in the previous year and at
least once in the preceding ten years (internal or external,
hydraulic overload or other causes).
Frequency of PC
measurement and any
use of averaging
Performance commitment measured and reported on an annual
basis through the company’s ‘Annual Service and Outcome
Delivery Report.’
Timing and frequency
of rewards/penalties
N/a
Form of reward/penalty N/a
Any other information
or clarifications
relevant to correct
application of incentive
Performance levels are set and shown on a company-wide
basis.
_________________________________

Final price control determination notice: company-specific appendix – Dŵr Cymru
143
Performance commitment D5: Earning the trust of customers
Detailed definition of performance measure: This measure is derived from the
output of an annual survey of our customers. The measure is the percentage of
customers who confirm they trust us
Incentive type: Reputational
Performance commitments
Starting
level
Committed performance levels
Unit 2014-15 2015-16 2016-17 2017-18 2018-19 2019-20
PC % 63 63 66 68 71 75
Additional details
Necessary detail on
measurement units
The measure will be derived from the results of an annual
survey.
Frequency of PC
measurement and any
use of averaging
Performance commitment measured and reported on an annual
basis through the company’s ‘Annual Service and Outcome
Delivery Report.’
Timing and frequency
of rewards/penalties
N/a
Form of reward/penalty N/a
Any other information
or clarifications
relevant to correct
application of incentive
Performance levels are set and shown on a company-wide
basis.

Final price control determination notice: company-specific appendix – Dŵr Cymru
144
Wholesale water outcome 5: Affordable prices
Performance commitment E1: Affordable bills
Detailed definition of performance measure: The extent to which the company
will continue to make bills more affordable. After 2014-15 the company proposes that
customer bill increases will be 1% below the rate of inflation each year
Incentive type: Reputational
Performance commitments
Starting
level
Committed performance levels
Unit 2014-15 2015-16 2016-17 2017-18 2018-19 2019-20
PC Below
inflation
1%
below
inflation
1%
below
inflation
1%
below
inflation
1%
below
inflation
1%
below
inflation
Additional details
Necessary detail on
measurement units
Maintain falling bills in real terms, beating inflation by at least 1%
a year.
Frequency of PC
measurement and any
use of averaging
Performance commitment measured and reported on an annual
basis through the company’s ‘Annual Service and Outcome
Delivery Report.’
Timing and frequency
of rewards/penalties
N/a
Form of reward/penalty N/a
Any other information
or clarifications
relevant to correct
application of incentive
Performance levels are set and shown on a company-wide
basis.

Final price control determination notice: company-specific appendix – Dŵr Cymru
145
Wholesale water outcome 6: Asset stewardship
Performance commitment F1: Asset serviceability
Detailed definition of performance measure: Serviceability assessment of either
stable/marginal/deteriorating as defined within the Ofwat KPI, as set out in IN 13/03
Incentive type: Financial – penalty only
Performance commitments
Unit Starting
level
Committed performance levels
2014-15 2015-16 2016-17 2017-18 2018-19 2019-20
PC Stable Stable Stable Stable Stable Stable
Penalty collar Deterio-
rating
Deterio-
rating
Deterio-
rating
Deterio-
rating
Deterio-
rating
Penalty deadband Marginal Marginal Marginal Marginal Marginal
Incentive rates
Incentive type Incentive rate (£m/category/year)
Penalty £20 million maximum penalty (£2.5 million per failure.
See table below for more details.)
Additional details
Necessary detail on
measurement units
Measurement based on serviceability assessment criteria as
defined for the Ofwat KPIs in ‘Key performance indicators –
guidance, IN 13/03
Frequency of PC
measurement and any
use of averaging
Performance commitment measured and reported on an annual
basis through the company’s ‘Annual Service and Outcome
Delivery Report’
Timing and frequency
of rewards/penalties
Penalty applied at end of period. A maximum £20m penalty will
apply (£2.5m per sub-service failure) if serviceability is marginal
or deteriorating in any consecutive two year period

Final price control determination notice: company-specific appendix – Dŵr Cymru
146
Form of reward/penalty Revenue adjustment
Any other information
or clarifications
relevant to correct
application of incentive
Penalty applies in the second year for which serviceability is
marginal or deteriorating on one or more of the two water sub-
services. The table below gives two illustrative examples for how
this will operate:
Year 1 Year 2 Year 3 Year 4 Year 5 Penalty
Water non-
infra
S M S M S Total
£0m
Water infra S M M
£2.5m
M
£2.5m
M
£2.5m
Total
£7.5m
S = stable M = marginal
Water infrastructure serviceability – reference levels and control limits
Composite Index Committed performance levels
2015-16 2016-17 2017-18 2018-19 2019-20
Sub measure Unit 2014-15 Limits AMP5 Stable Stable Stable Stable Stable
Total
bursts
(nr)
Nr
Ref 4350 4350 4350 4350 4350 4350
High 4713 4713 4713 4713 4713 4713
Low 3987 3987 3987 3987 3987 3987
Interrupti
ons >12h
(nr)
Nr
Ref 93 93 93 93 93 93
High 298 298 298 298 298 298
Low 0 0 0 0 0 0
Iron non-
complian
ce (as
100-
Mean
Zonal
Complian
ce) (%)
% 0.20
Ref 0.30 0.30 0.30 0.30 0.30 0.30
High 0.64 0.64 0.64 0.64 0.64 0.64
Low 0.00 0.00 0.00 0.00 0.00 0.00
DG2
Pressure
(nr)
Nr 131
Ref 220 220 220 220 220 220
High 296 296 296 296 296 296
Low 144 144 144 144 144 144
Customer
contacts Nr
Ref 3.09 3.09 3.09 3.09 3.09 3.09
High 3.75 3.75 3.75 3.75 3.75 3.75

Final price control determination notice: company-specific appendix – Dŵr Cymru
147
–
discolour
ation (nr
/ 1000
populatio
n)
Low 2.43 2.43 2.43 2.43 2.43 2.43
Distributi
on Index
TIM (as
100-
Mean
Zonal
Complian
ce) (%)
%
Ref 0.23 0.23 0.23 0.23 0.23 0.23
High 0.33 0.33 0.33 0.33 0.33 0.33
Low 0.13 0.13 0.13 0.13 0.13 0.13
Water non-infrastructure serviceability – reference levels and control limits
Composite Index Committed performance levels
2015-16 2016-17 2017-18 2018-19 2019-20
Sub measure Unit 2014-15 Limits AMP5 Stable Stable Stable Stable Stable
Water
Treatmen
t Works
Coliforms
non-
complian
ce (%)
%
Ref 0.04 0.04 0.04 0.04 0.04 0.04
High 0.07 0.07 0.07 0.07 0.07 0.07
Low 0.01 0.01 0.01 0.01 0.01 0.01
Service
Reservoir
Coliforms
non-
complian
ce (%)*
%
Ref 0.00 0.00 0.00 0.00 0.00 0.00
High 0.34 0.34 0.34 0.34 0.34 0.34
Low 0.00 0.00 0.00 0.00 0.00 0.00
Turbidity
(nr) Nr
Ref 5.00 5.00 5.00 5.00 5.00 5.00
High 11.0
0 11.00 11.00 11.00 11.00 11.00
Low 0.00 0.00 0.00 0.00 0.00 0.00
Enforcem Nr Ref 0.00 0.00 0.00 0.00 0.00 0.00

Final price control determination notice: company-specific appendix – Dŵr Cymru
148
Composite Index Committed performance levels
2015-16 2016-17 2017-18 2018-19 2019-20
ent
(incidents
number)
High 1.00 1.00 1.00 1.00 1.00 1.00
Low 0.00 0.00 0.00 0.00 0.00 0.00
Unplanne
d
maintena
nce (nr)
Nr
Ref 1115
0 11150 11150 11150 11150 11150
High 1241
6 12416 12416 12416 12416 12416
Low 9884 9884 9884 9884 9884 9884

Final price control determination notice: company-specific appendix – Dŵr Cymru
149
Performance commitment F2: Leakage
Detailed definition of performance measure: Leakage measured in
megalitres/day for the calendar year. Calculation as defined for the Ofwat KPI in IN
13/03
Incentive type: Financial – reward and penalty
Performance commitments
Unit Starting
level
Committed performance levels
2014-15 2015-16 2016-17 2017-18 2018-19 2019-20
PC Ml/d 184 181 177 173 171 169
Penalty collar Ml/d 191 187 183 181 179
Penalty deadband Ml/d 186 182 178 176 174
Reward deadband Ml/d 171 167 163 161 159
Reward cap Ml/d 176 172 168 166 164
Incentive rates
Incentive type Incentive rate
(£m/Ml/d)
Penalty 1.84
Reward 0.92
Additional details
Necessary detail on
measurement units
The target has been calculated using the industry standard
economic level of leakage methodology.
Frequency of PC
measurement and any
use of averaging
Performance commitment measured and reported on an annual
basis through the company’s ‘Annual Service and Outcome
Delivery Report.’
Timing and frequency
of rewards/penalties
A variable penalty beginning at 5Ml/d above the leakage target,
calibrated at £1.84m per Ml/d with a maximum of £9.2m at
10Ml/d above. The penalty only applies if the target was missed

Final price control determination notice: company-specific appendix – Dŵr Cymru
150
by more than 5Ml/d in the immediately preceding year. The
penalty is applicable in any year following a year in which the
target was missed by more than 5Ml/d.
A variable reward beginning at 5Ml/d below the leakage target,
calibrated at £0.92m per Ml/d with a maximum of £4.6m at
10Ml/d below. The reward is only earned if the target was
exceeded by more than 5Ml/d in the immediately preceding
year. The reward is applicable in any year following a year in
which the target was exceeded by more than 5Ml/d.
Form of reward/penalty Revenue adjustment.
Any other information
or clarifications
relevant to correct
application of incentive
_________________________________
Performance commitment F3: Asset resilience
Detailed definition of performance measure: Percentage of critical assets that
are resilient against a set of criteria. Critical assets are those where failure would
have a major impact on service to customers or on the environment. The definitions
of resilience and criticality are set out in the supporting material to our business plan,
section 12
Incentive type: Financial – penalty only
Performance commitments
Unit Starting
level
Committed performance levels
2014-15 2015-16 2016-17 2017-18 2018-19 2019-20
PC % 80 80 81 83 85 87
Penalty collar % N/a N/a N/a N/a 80
Penalty deadband % N/a N/a N/a N/a 85

Final price control determination notice: company-specific appendix – Dŵr Cymru
151
Incentive rates
Incentive type Incentive rate
(£m/%)
Penalty 3.1
Additional details
Necessary detail on
measurement units
During the period 2015-20 period the company’s aim is to
improve its “percentage resilience score” from the current
figure to 87% by 2020.
Frequency of PC
measurement and any use
of averaging
Performance commitment measured and reported on an
annual basis through the company’s ‘Annual Service and
Outcome Delivery Report.’
Timing and frequency of
rewards/penalties
The company is not receiving any penalties until the end of
the period. The maximum penalty is £15.5m.
Form of reward/penalty Revenue adjustment.
Any other information or
clarifications relevant to
correct application of
incentive
N/a

Final price control determination notice: company-specific appendix – Dŵr Cymru
152
Wholesale wastewater outcome 1: protecting our
environment
Performance commitment B2: Treating used water
Detailed definition of performance measure: The % compliance of wastewater
treatment works with our discharge permits
Incentive type: Reputational
Performance commitments
Unit Starting
level
Committed performance levels
2014-15 2015-16 2016-17 2017-18 2018-19 2019-20
PC % 97.1 100.0 100.0 100.0 100.0 100.0
Additional details
Necessary detail on
measurement units
For each of the company’s wastewater treatment works
there is a permit which regulates the quality of wastewater
the company is allowed to discharge into rivers and coastal
waters, and is regulated by the NRW. The measure is the
% compliance against discharge permits.
Frequency of PC
measurement and any use
of averaging
Performance commitment measured and reported on an
annual basis through the company’s ‘Annual Service and
Outcome Delivery Report.’
Timing and frequency of
rewards/penalties
N/a
Form of reward/penalty N/a
Any other information or
clarifications relevant to
correct application of
incentive
N/a
_________________________________

Final price control determination notice: company-specific appendix – Dŵr Cymru
153
Performance commitment B3: Preventing pollution
Detailed definition of performance measure: The total number of category 3
pollution incidents as reported by NRW within the calendar year
Incentive type: Financial – reward and penalty
Performance commitments
Starting
level
Committed performance levels
Unit 2014-15 2015-16 2016-17 2017-18 2018-19 2019-20
PC Incidents 224 161 154 131 131 131
Penalty collar Incidents 249 249 156 156 156
Penalty
deadband
Incidents
224 224 131 131 131
Reward
deadband
Incidents
131 131 131 131 131
Reward cap Incidents 106 106 106 106 106
Incentive rates
Incentive type Incentive rate
(£m/incident)
Penalty 0.400
Reward 0.047
Additional details
Necessary detail on
measurement units
The total number of Welsh Water category 3 pollution incidents
within the calendar year including pollution attributed to assets
that transferred to the company on 1 October 2011 under the
Water Industry (Schemes for Adoption of Private Sewers)
Regulations 2011
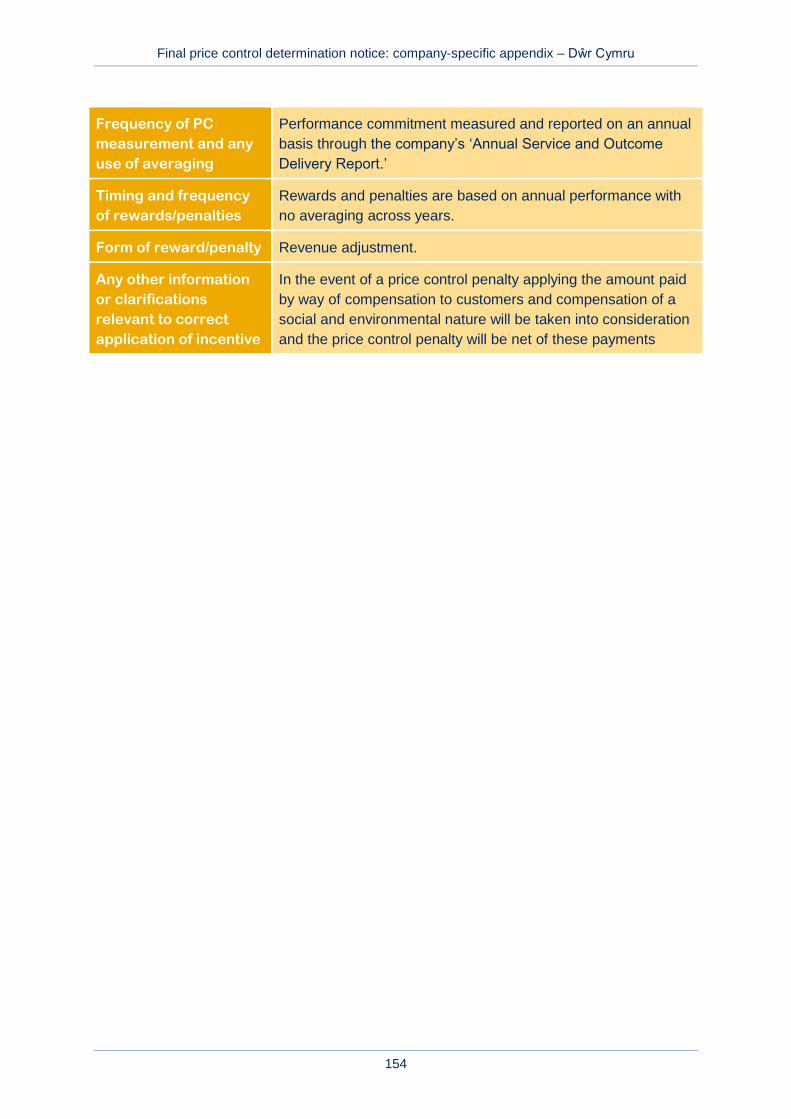
Final price control determination notice: company-specific appendix – Dŵr Cymru
154
Frequency of PC
measurement and any
use of averaging
Performance commitment measured and reported on an annual
basis through the company’s ‘Annual Service and Outcome
Delivery Report.’
Timing and frequency
of rewards/penalties
Rewards and penalties are based on annual performance with
no averaging across years.
Form of reward/penalty Revenue adjustment.
Any other information
or clarifications
relevant to correct
application of incentive
In the event of a price control penalty applying the amount paid
by way of compensation to customers and compensation of a
social and environmental nature will be taken into consideration
and the price control penalty will be net of these payments

Final price control determination notice: company-specific appendix – Dŵr Cymru
155
Wholesale wastewater outcome 2: responding to climate
change
Performance commitment C1: adapting to climate change
Detailed definition of performance measure: This measure reflects the
completion of schemes to reduce the amount of surface water entering the
company’s systems. The measure is the volume of surface water removed from the
system, expressed in number of properties equivalent. The company has defined the
property equivalent volume as 100m3 per year
Incentive type: Financial – penalty only
Performance commitments
Starting
level
Committed performance levels
Unit 2014-15 2015-16 2016-17 2017-18 2018-19 2019-20
PC Properties 1,000 1,000 1,000 15,000 20,000 25,000
Penalty collar Properties 1,000 1,000 1,000 1,000 1,000
Penalty
deadband
Properties 1,000 1,000 8,000 10,500 13,000
Incentive rates
Incentive type Incentive rate
(£/property)
Penalty 200
Additional details
Necessary detail on
measurement units
This captures reductions in the volume of rainwater draining into
the company’s sewerage system.
Frequency of PC
measurement and any
use of averaging
Performance commitment measured and reported on an annual
basis through the company’s ‘Annual Service and Outcome
Delivery Report.’

Final price control determination notice: company-specific appendix – Dŵr Cymru
156
Timing and frequency
of rewards/penalties
Annual.
Form of reward/penalty Revenue adjustment.
Any other information
or clarifications
relevant to correct
application of incentive
_________________________________
Performance commitment C2: Reducing our carbon footprint
Detailed definition of performance measure: GWh of renewable energy
generated
Incentive type: Reputational
Performance commitments
Unit Starting
level
Committed performance levels
2014-15 2015-16 2016-17 2017-18 2018-19 2019-20
PC GWh 32.89 32.89 45.22 57.55 69.89 82.22
Additional details
Necessary detail on
measurement units
GWh of renewable energy generated within the year.
Frequency of PC
measurement and any use
of averaging
Performance commitment measured and reported on an
annual basis through the company’s ‘Annual Service and
Outcome Delivery Report.’
Timing and frequency of
rewards/penalties
N/a
Form of reward/penalty N/a
Any other information or
clarifications relevant to

Final price control determination notice: company-specific appendix – Dŵr Cymru
157
correct application of
incentive

Final price control determination notice: company-specific appendix – Dŵr Cymru
158
Wholesale wastewater outcome 3: Best in class customer
service
Performance commitment D1: Service incentive mechanism
Detailed definition of performance measure: SIM score as defined in Ofwat’s
SIM guidance April 2012 and updated by IN 13/03
Incentive type: Financial – reward and penalty
Performance commitments
Starting
level
Committed performance levels
Unit 2014-15 2015-16 2016-17 2017-18 2018-19 2019-20
PC Industry
score
Top
quartile
Top
quartile
Top
quartile
Top
quartile
Top
quartile
Top
quartile
Penalty collar Industry
score
Ofwat
method-
ology
Ofwat
method-
ology
Ofwat
method-
ology
Ofwat
method-
ology
Ofwat
method-
ology
Penalty
deadband
Industry
score
Ofwat
method-
ology
Ofwat
method-
ology
Ofwat
method-
ology
Ofwat
method-
ology
Ofwat
method-
ology
Reward
deadband
Industry
score
Ofwat
method-
ology
Ofwat
method-
ology
Ofwat
method-
ology
Ofwat
method-
ology
Ofwat
method-
ology
Reward cap Industry
score
Ofwat
method-
ology
Ofwat
method-
ology
Ofwat
method-
ology
Ofwat
method-
ology
Ofwat
method-
ology
Incentive rates
Incentive type Incentive rate
Penalty Ofwat led price control adjustments that are implemented
at price reviews.
Reward Ofwat led price control adjustments that are implemented

Final price control determination notice: company-specific appendix – Dŵr Cymru
159
Incentive type Incentive rate
at price reviews.
Additional details
Necessary detail on
measurement units
All companies report and Ofwat publish an annual industry
SIM score.
Frequency of PC
measurement and any use of
averaging
Performance commitment measured and reported on an
annual basis through the company’s annual service and
outcome delivery report.
Timing and frequency of
rewards/penalties
Any reward or penalty will be applied at the end of the
regulatory period 2015-20.
Form of reward/penalty Adjustment to revenue.
Any other information or
clarifications relevant to
correct application of
incentive
Performance levels are set and shown on a company wide
basis.
_________________________________
Performance commitment D2: ‘at risk’ customer services
Detailed definition of performance measure: The number of customers who are
on the company’s register of ‘at risk’ at the end of the financial year. They are
deemed to be ‘at risk’ because their service has repeatedly fallen short in one of the
following areas: discolouration of water, interruptions to supply, low pressure, odour
from wastewater assets, and sewer flooding
Incentive type: Reputational

Final price control determination notice: company-specific appendix – Dŵr Cymru
160
Performance commitments
Unit Starting
level
Committed performance levels
2014-15 2015-16 2016-17 2017-18 2018-19 2019-20
PC Properties/
incidents on
internal register
850 850 750 650 550 425
Additional details
Necessary detail on
measurement units
The measure is the number of customers on the ‘At risk’
register. The register records the customers who have
contacted the company at least once in each of the previous
three years in respect of (discolouration of water,
interruptions to supply and Odour), plus customers on the
DG2 register without sufficient remedial action for at least the
last three years and customers who have experienced
internal sewer flooding in the previous year and at least once
in the preceding ten years (internal or external, hydraulic over
load or other causes).
This measure includes customer contacts and flooding
attributed to assets that transferred to the company on 1
October 2011 under the Water Industry (Schemes for
Adoption of Private Sewers) Regulations 2011.
Frequency of PC
measurement and any
use of averaging
Performance commitment measured and reported on an
annual basis through the company’s annual service and
outcome delivery report.’
Timing and frequency of
rewards/penalties
N/a
Form of reward/penalty N/a
Any other information or
clarifications relevant to
correct application of
incentive
Performance levels are set and shown on a company-wide
basis.
_________________________________

Final price control determination notice: company-specific appendix – Dŵr Cymru
161
Performance commitment D3: Properties flooded in the year
Detailed definition of performance measure: The number of properties subjected
to internal sewer flooding, in line with the KPI set out in IN 13/03
Incentive type: Financial – reward and penalty
Performance commitments
Starting
level
Committed performance levels
Unit 2014-15 2015-16 2016-17 2017-18 2018-19 2019-20
PC Properties 313 310 300 292 282 269
Penalty collar Properties 388 374 363 349 331
Penalty
deadband
Properties 313 313 313 313 313
Reward
deadband
Properties 271 263 256 248 238
Reward cap Properties 232 226 221 215 207
Incentive rates
Incentive type Incentive rate
(£m/property)
Penalty 0.161
Reward 0.062
Additional details
Necessary detail on
measurement units
The number of properties suffering internal sewer flooding per
year (not including flooding due to the most severe weather), in
line with the KPI set out in IN 13/03.
This measure includes flooding attributed to assets that
transferred to the company on 1 October 2011 under the Water
Industry (Schemes for Adoption of Private Sewers) Regulations
2011.

Final price control determination notice: company-specific appendix – Dŵr Cymru
162
Frequency of PC
measurement and any
use of averaging
Performance commitment measured and reported on an annual
basis through the company’s ‘Annual Service and Outcome
Delivery Report.’
Timing and frequency
of rewards/penalties
Average performance over two year period in order to smooth
the effects of weather variability.
Form of reward/penalty Revenue adjustment.
Any other information
or clarifications
relevant to correct
application of incentive
Excludes the impact of any exceptional weather conditions.
In the event of a price control penalty applying the amount paid
by way of compensation to customers will be taken into
consideration and the price control penalty will be net of these
payments.
_________________________________
Performance commitment D5: Earning the trust of customers
Detailed definition of performance measure: This measure is derived from the
output of an annual survey of our customers. The measure is the percentage of
customers who confirm they trust us
Incentive type: Reputational
Performance commitments
Starting
level
Committed performance levels
Unit 2014-15 2015-16 2016-17 2017-18 2018-19 2019-20
PC % 63 63 66 68 71 75
Additional details
Necessary detail on
measurement units
The measure will be derived from the results of an annual
survey.
Frequency of PC
measurement and any
use of averaging
Performance commitment measured and reported on an annual
basis through the company’s ‘Annual Service and Outcome
Delivery Report.’

Final price control determination notice: company-specific appendix – Dŵr Cymru
163
Timing and frequency
of rewards/penalties
N/a
Form of reward/penalty N/a
Any other information
or clarifications
relevant to correct
application of incentive
Performance levels are set and shown on a company-wide
basis.

Final price control determination notice: company-specific appendix – Dŵr Cymru
164
Wholesale wastewater outcome 4: Affordable prices
Performance commitment E1: Affordable bills
Detailed definition of performance measure: The extent to which the company
will continue to make bills more affordable. After 2014-15, the company proposes
that customer bill increases will be 1% below the rate of inflation each year
Incentive type: Reputational
Performance commitments
Starting
level
Committed performance levels
Unit 2014-15 2015-16 2016-17 2017-18 2018-19 2019-20
PC Below
inflation
1%
below
inflation
1%
below
inflation
1%
below
inflation
1%
below
inflation
1%
below
inflation
Additional details
Necessary detail on
measurement units
Maintain falling bills in real terms, beating inflation by at least
1% a year.
Frequency of PC
measurement and any
use of averaging
Performance commitment measured and reported on an annual
basis through the company’s ‘Annual Service and Outcome
Delivery Report.’
Timing and frequency
of rewards/penalties
N/a
Form of reward/penalty N/a
Any other information
or clarifications
relevant to correct
application of incentive
Performance levels are set and shown on a company-wide
basis.

Final price control determination notice: company-specific appendix – Dŵr Cymru
165
Wholesale wastewater outcome 5: Asset stewardship
Performance commitment F1: Asset serviceability
Detailed definition of performance measure: Serviceability assessment of either
improving, stable, marginal or deteriorating, as defined within the Ofwat KPIs set out
in IN 13/03
Incentive type: Financial – penalty only
Performance commitments
Unit Starting
level
Committed performance levels
2014-15 2015-16 2016-17 2017-18 2018-19 2019-20
PC Stable Stable Stable Stable Stable Stable
Penalty collar Deterio-
rating
Deterio-
rating
Deterio-
rating
Deterio-
rating
Deterio-
rating
Penalty deadband Marginal Marginal Marginal Marginal Marginal
Incentive rates
Incentive type Incentive rate
Penalty £20m maximum penalty (£2.5m per failure. See table below for more
details.)
Additional details
Necessary detail
on measurement
units
Measurement units are based on serviceability assessment criteria as
defined for the Ofwat KPIs in ‘Key performance indicators – guidance,
IN 13/03 and includes assets that transferred to the company on 1
October 2011 under the Water Industry (Schemes for Adoption of
Private Sewers) Regulations 2011.
Frequency of PC
measurement and
any use of
averaging
Performance commitment measured and reported on an annual basis
through the company’s ‘Annual Service and Outcome Delivery
Report.’

Final price control determination notice: company-specific appendix – Dŵr Cymru
166
Timing and
frequency of
rewards/penalties
Penalty applied at end of period. A maximum £20m penalty will apply
(£2.5m per sub-service failure) if serviceability is marginal or
deteriorating in any consecutive two-year period.
Form of
reward/penalty
Revenue adjustment.
Any other
information or
clarifications
relevant to
correct
application of
incentive
Penalty applies in the second year for which serviceability is marginal
or deteriorating on one or more of the two wastewater sub-services.
The table below gives two illustrative examples for how this will
operate:
Year 1 Year 2 Year 3 Year 4 Year 5 Penalty
Sewerage
non-infra
S
£0.0m
M
£0.0m
S
£0.0m
S
£0.0m
S
£0.0m
Total
£0.0m
Sewerage
infra
S
£0.0m
M
£0.0m
M
£2.5m
M
£2.5m
M
£2.5m
Total
£7.5m
Wastewater infrastructure serviceability – reference levels and control limits
Composite Index Committed performance levels
2015-16 2016-17 2017-18 2018-19 2019-20
Sub measure Unit 2014-15 Limits AMP5 Stable Stable Stable Stable Stable
Sewer
collapses
(nr)
Nr
Ref 504 504 504 504 504 504
High 603 603 603 603 603 603
Low 405 405 405 405 405 405
Pollution
incidents
(CSO+R
M+FS)
(nr)
Nr 100
Ref 155 155 155 155 155 155
High 229 229 229 229 229 229
Low 81 81 81 81 81 81
Propertie
s flooded
due to
other
causes
(nr)
Nr 100
Ref 120 120 120 120 120 120
High 170 170 170 170 170 170
Low 70 70 70 70 70 70
Propertie
s flooded
due to
overloade
Nr 86
Ref 92 92 92 92 92 92
High 132 132 132 132 132 132
Low 52 52 52 52 52 52

Final price control determination notice: company-specific appendix – Dŵr Cymru
167
Composite Index Committed performance levels
2015-16 2016-17 2017-18 2018-19 2019-20
d sewers
excluding
severe
weather
(nr)
Sewer
blockage
s (nr)
Nr 12700
Ref 1358
9 13589 13589 13589 13589 13589
High 1450
1 14501 14501 14501 14501 14501
Low 1312
7 13127 13127 13127 13127 13127
Equipme
nt failures
(nr)
Nr
Ref 250 250 250 250 250 250
High 311 311 311 311 311 311
Low 190 190 190 190 190 190
Wastewater non-infrastructure serviceability – reference levels and control
limits
Composite Index Committed performance levels
2015-16 2016-17 2017-18 2018-19 2019-20
Sub measure Unit 2014-15 Limits AMP5 Stable Stable Stable Stable Stable
Sewage
Treatmen
t Works
(STW)
%non-
complian
ce
%
Ref 2.44 2.44 2.44 2.44 2.44 2.44
High 3.42 3.42 3.42 3.42 3.42 3.42
Low 1.46 1.46 1.46 1.46 1.46 1.46
Populatio
n
equivalen
t (PE)
%non-
complian
ce
%
Ref 0.10 0.10 0.10 0.10 0.10 0.10
High 0.19 0.19 0.19 0.19 0.19 0.19
Low 0.01 0.01 0.01 0.01 0.01 0.01

Final price control determination notice: company-specific appendix – Dŵr Cymru
168
Composite Index Committed performance levels
2015-16 2016-17 2017-18 2018-19 2019-20
Unplanne
d
maintena
nce (nr)
Nr
Ref 2749
3 27493 27493 27493 27493 27493
High 2962
7 29627 29627 29627 29627 29627
Low 2535
8 25358 25358 25358 25358 25358
Ref 2.44 2.44 2.44 2.44 2.44 2.44
High 3.42 3.42 3.42 3.42 3.42 3.42

Final price control determination notice: company-specific appendix – Dŵr Cymru
169
Performance commitment F3: Asset resilience
Detailed definition of performance measure: Percentage of critical assets that is
resilient against a set of criteria. Critical assets are those where failure would have a
major impact on service to customers or on the environment. The definitions of
resilience and criticality are set out in the supporting material to our business plan,
section 12
Incentive type: Financial – penalty only
Performance commitments
Unit Starting
level
Committed performance levels
2014-15 2015-16 2016-17 2017-18 2018-19 2019-20
PC % 71 71 72 74 76 78
Penalty collar % N/a N/a N/a N/a 71
Penalty deadband % N/a N/a N/a N/a 76
Incentive rates
Incentive type Incentive rate
(£m/%)
Penalty 2.2
Additional details
Necessary detail on
measurement units
During the period 2015-20 period our aim is to improve the
“percentage resilience score” from the current figure to 78%
by 2020.
Frequency of PC
measurement and any use
of averaging
Performance commitment measured and reported on an
annual basis through the company’s ‘Annual Service and
Outcome Delivery Report.’
Timing and frequency of
rewards/penalties
The company is not receiving any penalties until the end of
the period. The maximum penalty is £11m.
Form of reward/penalty Revenue adjustment.

Final price control determination notice: company-specific appendix – Dŵr Cymru
170
Any other information or
clarifications relevant to
correct application of
incentive
N/a

Final price control determination notice: company-specific appendix – Dŵr Cymru
171
Household retail outcome 1: Best in class customer
service
Performance commitment D1: service incentive mechanism
Detailed definition of performance measure: SIM score as defined in Ofwat’s
SIM guidance April 2012 and updated by IN 13/03
Incentive type: Financial – reward and penalty
Performance commitments
Starting
level
Committed performance levels
Unit 2014-15 2015-16 2016-17 2017-18 2018-19 2019-20
PC SIM score Top
quartile
Top
quartile
Top
quartile
Top
quartile
Top
quartile
Top
quartile
Penalty collar SIM score Ofwat
method-
ology
Ofwat
method-
ology
Ofwat
method-
ology
Ofwat
method-
ology
Ofwat
method-
ology
Penalty
deadband
SIM score Ofwat
method-
ology
Ofwat
method-
ology
Ofwat
method-
ology
Ofwat
method-
ology
Ofwat
method-
ology
Reward
deadband
SIM score Ofwat
method-
ology
Ofwat
method-
ology
Ofwat
method-
ology
Ofwat
method-
ology
Ofwat
method-
ology
Reward cap SIM score Ofwat
method-
ology
Ofwat
method-
ology
Ofwat
method-
ology
Ofwat
method-
ology
Ofwat
method-
ology
Incentive rates
Incentive type Incentive rate
Penalty Ofwat-led price control adjustments that are implemented at
price reviews.
Reward Ofwat-led price control adjustments that are implemented at

Final price control determination notice: company-specific appendix – Dŵr Cymru
172
Incentive type Incentive rate
price reviews.
Additional details
Necessary detail on
measurement units
All companies report and Ofwat publish an annual industry SIM
score.
Frequency of PC
measurement and any
use of averaging
Performance commitment measured and reported on an annual
basis through the company’s ‘Annual Service and Outcome
Delivery Report.’
Timing and frequency
of rewards/penalties
Any reward or penalty will be applied at the end of the regulatory
period 2015-20.
Form of reward/penalty Revenue adjustment.
Any other information
or clarifications
relevant to correct
application of incentive
Performance levels are set and shown on a company-wide
basis.

Final price control determination notice: company-specific appendix – Dŵr Cymru
173
Performance commitment D5: Earning the trust of customers
Detailed definition of performance measure: This measure is derived from the
output of an annual survey of the company’s customers. The measure is the
percentage of customers who confirm they trust us
Incentive type: Reputational
Performance commitments
Starting
level
Committed performance levels
Unit 2014-15 2015-16 2016-17 2017-18 2018-19 2019-20
PC % 63 63 66 68 71 75
Additional details
Necessary detail on
measurement units
The measure will be derived from the results of an annual
survey.
Frequency of PC
measurement and any
use of averaging
Performance commitment measured and reported on an annual
basis through the company’s ‘Annual Service and Outcome
Delivery Report.’
Timing and frequency
of rewards/penalties
N/a
Form of reward/penalty N/a
Any other information
or clarifications
relevant to correct
application of incentive
Performance levels are set and shown on a company-wide
basis.

Final price control determination notice: company-specific appendix – Dŵr Cymru
174
Household retail outcome 2: Affordable prices
Performance commitment E1: Affordable bills
Detailed definition of performance measure: The extent to which the company
will continue to make bills more affordable. After 2014-15, the company proposes
that customer bill increases will be 1% below the rate of inflation each year
Incentive type: Reputational
Performance commitments
Starting
level
Committed performance levels
Unit 2014-15 2015-16 2016-17 2017-18 2018-19 2019-20
PC Below
inflation
1%
below
inflation
1%
below
inflation
1%
below
inflation
1%
below
inflation
1%
below
inflation
Additional details
Necessary detail on
measurement units
Maintain falling bills in real terms, beating inflation by at least
1% a year.
Frequency of PC
measurement and any
use of averaging
Performance commitment measured and reported on an annual
basis through the company’s ‘Annual Service and Outcome
Delivery Report.’
Timing and frequency
of rewards/penalties
N/a
Form of reward/penalty N/a
Any other information
or clarifications
relevant to correct
application of incentive
Performance levels are set and shown on a company-wide
basis.

Final price control determination notice: company-specific appendix – Dŵr Cymru
175
Performance commitment E2: Help for disadvantaged customers
Detailed definition of performance measure: The number of customers
benefiting from social tariffs
Incentive type: Reputational
Performance commitments
Starting
level
Committed performance levels
Unit 2014-15 2015-16 2016-17 2017-18 2018-19 2019-20
PC Customers 52,000 52,000 65,000 75,000 85,000 100,000
Additional details
Necessary detail on
measurement units
The number of customers using social tariffs, providing
assistance to those that struggle to pay their bills.
Frequency of PC
measurement and any
use of averaging
Performance commitment measured and reported on an annual
basis through the company’s ‘Annual Service and Outcome
Delivery Report.’
Timing and frequency
of rewards/penalties
N/a
Form of reward/penalty N/a
Any other information
or clarifications
relevant to correct
application of incentive
Performance levels are set and shown on a company-wide
basis.

Final price control determination notice: company-specific appendix – Dŵr Cymru
176
Non-household retail outcome 1: Business customer
satisfaction
Performance commitment D1: service incentive mechanism
Detailed definition of performance measure: SIM score as defined in Ofwat’s
SIM guidance April 2012 and updated by IN 13/03, applied to non-households
Incentive type: Financial – reward and penalty
Performance commitments
Starting
level
Committed performance levels
Unit 2014-15 2015-16 2016-17 2017-18 2018-19 2019-20
PC SIM score Top
quartile
Top
quartile
Top
quartile
Top
quartile
Top
quartile
Top
quartile
Penalty collar SIM score Ofwat
method-
ology
Ofwat
method-
ology
Ofwat
method-
ology
Ofwat
method-
ology
Ofwat
method-
ology
Penalty
deadband
SIM score Ofwat
method-
ology
Ofwat
method-
ology
Ofwat
method-
ology
Ofwat
method-
ology
Ofwat
method-
ology
Reward
deadband
SIM score Ofwat
method-
ology
Ofwat
method-
ology
Ofwat
method-
ology
Ofwat
method-
ology
Ofwat
method-
ology
Reward cap SIM score Ofwat
method-
ology
Ofwat
method-
ology
Ofwat
method-
ology
Ofwat
method-
ology
Ofwat
method-
ology
Incentive rates
Incentive type Incentive rate
Penalty Ofwat-led price control adjustments that are implemented at
price reviews.
Reward Ofwat-led price control adjustments that are implemented at

Final price control determination notice: company-specific appendix – Dŵr Cymru
177
Incentive type Incentive rate
price reviews.
Additional details
Necessary detail on
measurement units
All companies report and Ofwat publish an annual industry SIM
score.
Frequency of PC
measurement and any
use of averaging
Performance commitment measured and reported on an annual
basis through the company’s ‘Annual Service and Outcome
Delivery Report.’
Timing and frequency
of rewards/penalties
Any reward or penalty will be applied at the end of the regulatory
period 2015-20.
Form of reward/penalty Revenue adjustment.
Any other information
or clarifications
relevant to correct
application of incentive
Performance levels are set and shown on a company-wide
basis.
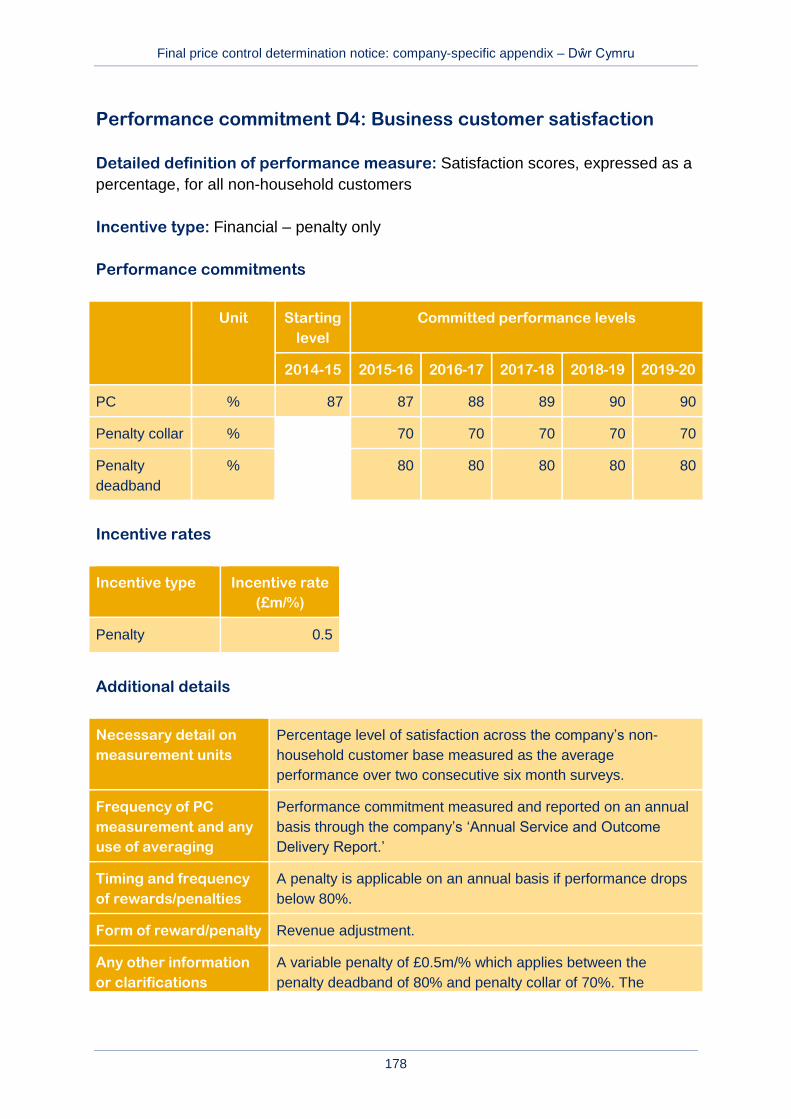
Final price control determination notice: company-specific appendix – Dŵr Cymru
178
Performance commitment D4: Business customer satisfaction
Detailed definition of performance measure: Satisfaction scores, expressed as a
percentage, for all non-household customers
Incentive type: Financial – penalty only
Performance commitments
Unit Starting
level
Committed performance levels
2014-15 2015-16 2016-17 2017-18 2018-19 2019-20
PC % 87 87 88 89 90 90
Penalty collar % 70 70 70 70 70
Penalty
deadband
% 80 80 80 80 80
Incentive rates
Incentive type Incentive rate
(£m/%)
Penalty 0.5
Additional details
Necessary detail on
measurement units
Percentage level of satisfaction across the company’s non-
household customer base measured as the average
performance over two consecutive six month surveys.
Frequency of PC
measurement and any
use of averaging
Performance commitment measured and reported on an annual
basis through the company’s ‘Annual Service and Outcome
Delivery Report.’
Timing and frequency
of rewards/penalties
A penalty is applicable on an annual basis if performance drops
below 80%.
Form of reward/penalty Revenue adjustment.
Any other information
or clarifications
A variable penalty of £0.5m/% which applies between the
penalty deadband of 80% and penalty collar of 70%. The

Final price control determination notice: company-specific appendix – Dŵr Cymru
179
relevant to correct
application of incentive
maximum penalty is therefore 5 (years) x £0.5m x (80 - 70) =
£25m.
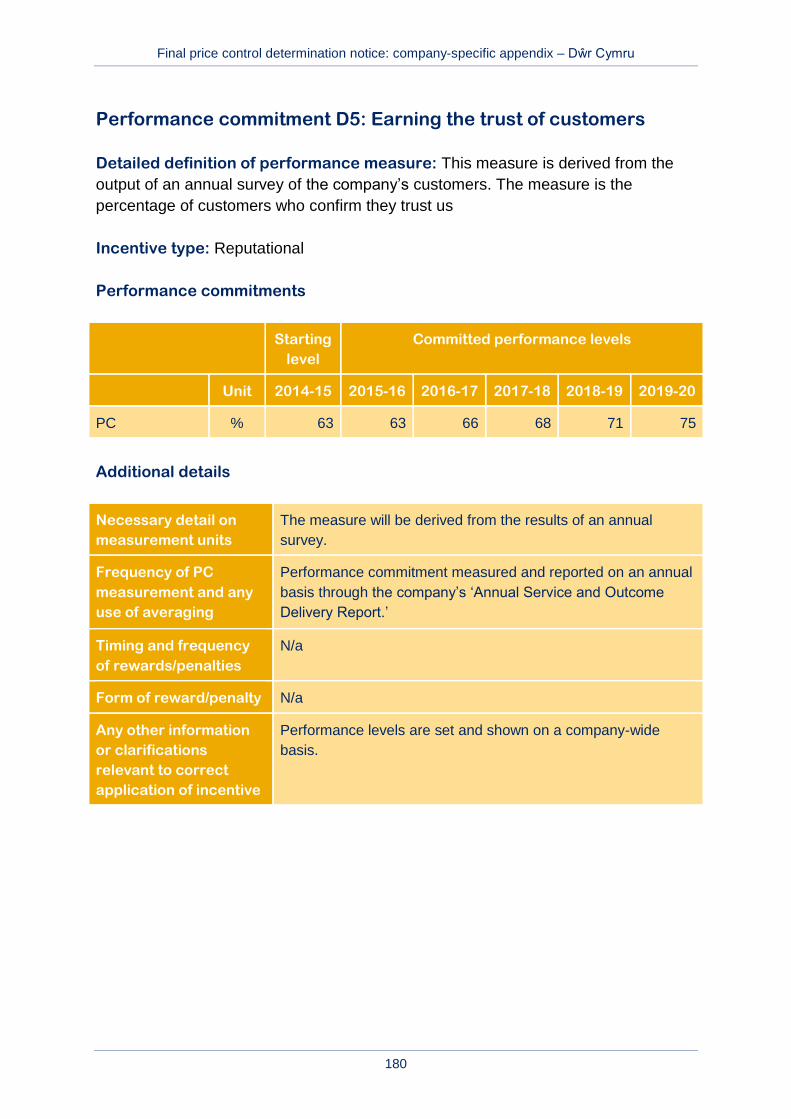
Final price control determination notice: company-specific appendix – Dŵr Cymru
180
Performance commitment D5: Earning the trust of customers
Detailed definition of performance measure: This measure is derived from the
output of an annual survey of the company’s customers. The measure is the
percentage of customers who confirm they trust us
Incentive type: Reputational
Performance commitments
Starting
level
Committed performance levels
Unit 2014-15 2015-16 2016-17 2017-18 2018-19 2019-20
PC % 63 63 66 68 71 75
Additional details
Necessary detail on
measurement units
The measure will be derived from the results of an annual
survey.
Frequency of PC
measurement and any
use of averaging
Performance commitment measured and reported on an annual
basis through the company’s ‘Annual Service and Outcome
Delivery Report.’
Timing and frequency
of rewards/penalties
N/a
Form of reward/penalty N/a
Any other information
or clarifications
relevant to correct
application of incentive
Performance levels are set and shown on a company-wide
basis.

Final price control determination notice: company-specific appendix – Dŵr Cymru
181
Non-household retail outcome 2: Affordable prices
Performance commitment E1: Affordable bills
Detailed definition of performance measure: The extent to which the company
will continue to make bills more affordable. After 2014-15, the company proposes
that customer bill increases will be 1% below the rate of inflation each year
Incentive type: Reputational
Performance commitments
Starting
level
Committed performance levels
Unit 2014-15 2015-16 2016-17 2017-18 2018-19 2019-20
PC Below
inflation
1%
below
inflation
1%
below
inflation
1%
below
inflation
1%
below
inflation
1%
below
inflation
Additional details
Necessary detail on
measurement units
Maintain falling bills in real terms, beating inflation by at least
1% a year.
Frequency of PC
measurement and any
use of averaging
Performance commitment measured and reported on an annual
basis through the company’s ‘Annual Service and Outcome
Delivery Report.’
Timing and frequency
of rewards/penalties
N/a
Form of reward/penalty N/a
Any other information
or clarifications
relevant to correct
application of incentive
Performance levels are set and shown on a company-wide
basis.

Final price control determination notice: company-specific appendix – Dŵr Cymru
182
Outcome delivery and reporting
In the policy chapter A2, we outline a framework against which we have assessed
Dŵr Cymru’s proposals in relation to outcome delivery and reporting.
The table below summarises Dŵr Cymru’s proposed approach to the measurement,
reporting and governance of outcomes and our assessment of this approach.
Table AA4.10 Dŵr Cymru’s proposals for outcome delivery and reporting
Dŵr Cymru’s proposals Our assessment
In its business plan submitted in May, Dŵr
Cymru proposed that performance
commitments will be measured and recorded
routinely using systems and processes
already in place, and will be monitored
monthly, including by the Board.
The company also plans to publish a new
report called the ‘Annual service and
outcome delivery report’ which will detail the
company’s progress in achieving the
performance commitments, the associated
rewards and penalties and the impact of
these on customer bills. The services of a
‘Reporter’ will be retained to provide external
assurance on the quality of data, including
the data contained within its new report.
In our methodology statement we set out our
expectation that companies should
demonstrate that their proposed PCs can be
measured and recorded consistently and that
they will have the appropriate governance
and quality assurance processes in place to
achieve this. We also expect companies to
be transparent with customers about their
performance against their outcomes and
commitments.
Dŵr Cymru has provided sufficient evidence
demonstrating the approach it will undertake
to ensure the PCs will be measured and
reported consistently, and the proposed
governance and assurance processes.
Therefore, we have accepted the company’s
proposal.
In time, we may develop further information
requirements with regard to outcomes, as we
review and change current requirements
relating to performance indicators and each
company’s annual risk and compliance
statement.

Ofwat
Centre City Tower
7 Hill Street
Birmingham B5 4UA
Phone: 0121 644 7500
Fax: 0121 644 7533
Website: www.ofwat.gov.uk
Email: [email protected]
Printed on 75% minimum de-inked post-consumer waste paper.
December 2014
© Crown copyright 2014
This publication is licensed under the terms of the Open Government
Licence v3.0 except where otherwise stated. To view this licence, visit
nationalarchives.gov.uk/doc/open-government-licence/version/3 or write to
the Information Policy Team, The National Archives, Kew, London TW9 4DU,
or email [email protected].
Where we have identified any third party copyright information, you will need
to obtain permission from the copyright holders concerned.
This document is also available from our website at www.ofwat.gov.uk.
Any enquiries regarding this publication should be sent to us at
Ofwat (The Water Services Regulation Authority) is a non-ministerial
government department. We are responsible for making sure that the
water sector in England and Wales provides customers with a good
quality and efficient service at a fair price.